Quenched metastable vortex states in Sr2RuO4
Abstract
Sr2RuO4, a leading-candidate spin-triplet superconductor and a highly anisotropic quasi-two-dimensional type-II superconductor, provides unique opportunity to study unconventional as well as conventional vortex phases. To investigate its vortex-matter phases, we studied the ac susceptibility of Sr2RuO4 for fields parallel to the RuO2 plane by adapting two different thermal processes: In addition to the ordinary field sweep (FS) process, we newly employed the “each-point field cooling (EPFC)” process, in which the superconductivity is once thermally destroyed before collecting the data. We find that the ac susceptibility signal substantially changes with the EPFC process. This result indicates that we succeed in inducing new metastable vortex states by the EPFC process. We also find a new field scale , below which the FS and EPFC processes provide the same value of the ac susceptibility. This new field scale suggests a liquid-like vortex state in the low-field region.
pacs:
74.70.Pq,74.25.Dw,74.25.Uv,74.25.WxI introduction
In a large part of the field-temperature superconducting phase diagram of a type-II superconductor below its critical temperature , magnetic quantum vortices penetrating the superconductor exhibit a number of vortex-matter phases depending on strengths of vortex-vortex interaction, thermal fluctuation, pinning energies by lattice defects, etc. Although such vortex-matter phases have been extensively studied in high- cuprate superconductors, Blatter et al. (1994); Fisher et al. (1991); Nelson and Seung (1989); Nelson (1988); Fisher (1989); Zeldov et al. (1995) superconductors with lower (e.g. NbSe2, CeRu2, etc.) also exhibit vortex phase transitions. Banerjee et al. (2001); Tomy and Pal (2002); Nattermann et al. (1998); G. Ravikumar, V. C. Sahni, P. K. Mishra, T. V. Chandrasekhar Rao, S. S. Banerjee, A. K. Grover, S. Ramakrishnan, S. Bhattacharya, M. J. Higgins, E. Yamamoto, Y. Haga, M. Hedo, Y. Inada (1998) In such low- superconductors, vortices at low fields form a quasi-long-range-ordered lattice, which is called as the vortex Bragg glass (VBG). This is because the arrangement of vortices is mostly governed by the repulsive vortex-vortex interaction. As the magnetic field is increased, vortex lattice becomes softer, because the vortex-vortex interaction becomes weaker. Then, near the upper critical field , other interactions can become dominant. As a result, the VBG state changes into the vortex glass (VG) state, in which vortices form a glassy structure without long-range ordering due to a dominance of vortex pinning. As the field is further increased, thermal fluctuation then becomes dominant and the VG melts into the vortex liquid (VL), where vortices can move individually.
It is now widely known that the measurement of the ac susceptibility is a powerful technique to explore the vortex matter phases.
One example is the peak effect, Banerjee et al. (2001) which is the occurrence of an anomalous maximum in the shielding signal near .
In weakly pinned superconductors, the onset of the peak effect corresponds to the VBG-VG transition and the peak top corresponds to VG-VL transition.
Another example is hysteretic behavior in .
It is often observed that the field cooling (FC) process and the zero field cooling (ZFC) process lead to different values of .
Such differences originate from hysteretic vortex configurations mainly caused by vortex pinning.
In typical cases, an ordered vortex lattice state and a disordered vortex amorphous/glass-like state are achieved by the ZFC and FC processes, respectively. Ling et al. (2001)
Sr2RuO4, a layered perovskite superconductor with K, has been extensively studied due to its unconventional pairing state. Maeno et al. (1994); Kallin (2012); Maeno et al. (2012); Mackenzie and Maeno (2003) Spin susceptibility measurements with the nuclear magnetic resonance (NMR) and with the polarized neutron scattering indicate the spin part of the Cooper pair is in the spin-triplet state. Ishida et al. (1998); Ishida ; Miyake (2014); Duffy et al. (2000) Muon-spin rotation and optical Kerr effect studies have revealed that the superconducting state of Sr2RuO4 is of chiral--wave, in which two degenerate order parameters form a complex linear combination, breaking the time reversal symmetry. Luke et al. (1998); Xia et al. (2006) Recently, a non-trivial topological nature of the chiral--wave superconducting wave function has been attracting wide attention. Maeno et al. (2012) Such a chiral--wave spin-triplet superconductor has spin and orbital degrees of freedom in its superconducting order parameter. Thus, it is expected that magnetic field affects such degrees of freedom and leads to emergence of new superconducting phases. Agterberg (1998); Udagawa et al. (2005); Kaur et al. (2005); Yanase et al. (2014) Indeed, such multiple phases have been observed in UPt3. Joynt and Taillefer (2002) In case of Sr2RuO4, a previous specific-heat study reported possible existence of new phases in the vicinity of . Deguchi et al. (2002) However, more recent studies with a smaller crystal did not reproduce the result. Yonezawa et al. (2013, 2014) Thus, it is still an open question whether the superconducting multiphase exists in Sr2RuO4 or not.
Sr2RuO4 has another interesting aspect as a highly anisotropic quasi-two-dimensional superconductor, reflecting its layered crystal structure. The anisotropy in the upper critical field , , is 20 for . Maeno et al. (2012) On the other hand, recent studies indicate that the intrinsic superconducting anisotropy is as large as 60.Rastovski et al. (2013); Kittaka et al. (2014) This large anisotropy may lead to interesting vortex phase formation in this material. In particular for , competition among various length and energy scales can lead to non-trivial vortex phases. For example, realization of vortex liquid crystals in an anisotropic type-II superconductor has been theoretically proposed Carlson et al. (2003). Note that, however, its coherence length along the axis is estimated to be Å, being still larger than the interlayer spacing Å. Thus, interlayer coherence should be maintained in Sr2RuO4, in clear contrast to high- cuprates, whose interlayer coherence can be vanishingly small.
Considering these situations, investigation of the vortex phase diagram in Sr2RuO4 is quite interesting and important. Firstly, to distinguish between the ordinary vortex-matter phases and unconventional superconducting multiphases originating from the spin-triplet order parameter, it is important to understand the vortex phase diagram in detail. Secondly, this oxide provides an unique opportunity to study vortex phases in highly anisotropic low- superconductivity (i.e. with relatively large coherence length). Previously, the small-angle neutron scattering (SANS) measurement revealed vortex lattices in some regions of the phase diagram both for and . Riseman et al. (1998); Rastovski et al. (2013) However, details of the vortex phase diagram has not been explored. In addition, although of Sr2RuO4 has been reported, Yoshida et al. (1996); Yaguchi et al. (2002); Kittaka et al. (2009) effects of different thermal/field treatments have not been investigated.
In this paper, we report of Sr2RuO4 for measured with a newly developed thermal/field process as well as with a conventional field-sweep process.
With the new process, we succeed in systematically inducing metastable vortex states.
By comparing results with different thermal treatments, we obtain a vortex phase diagram with a new phase boundary at low fields.
II Experimental
We used single crystalline Sr2RuO4 grown by a floating-zone method. Mao et al. (2000a) The sample used in this study has the size of mm3, and was cut from the crystal boule used for the SANS measurements. Rastovski et al. (2013) Zero-field measurements revealed the transition at K, which is defined as the mid-point temperature of the real part . The directions of the tetragonal crystalline axes of the sample were determined from X-ray Laue pictures. After cut, we glued two strain gauges with a resistance of 120 (Kyowa Dengyo, KFRS-02-120-C1-13 L1M3R) as heaters onto the -surfaces of the sample directly. We heat-treated the sample at up to 150∘C for several hours in order to glue heaters. This heat treatment may have served as a gentle annealing process.
The sample together with the heaters was glued to a sapphire rod with varnish (GE7031) and placed in a mutual-inductance coil, consisting of a counter-wound pick-up coil with 3300 turns and an excitation coil with 860 turns. A string of gold wire () is also attached between the sample and the thermal bath to achieve faster thermal equilibrium. Measurements of were performed with an ac field of 0.66 T-rms at the frequency of 3011 Hz. The direction of the ac field is within the plane and about 10 degrees away from the [100] axis. The configuration of the sample assembly and magnetic field directions is schematically shown in Fig. 1(a). The sample assembly was cooled down to below 0.1 K with a 3He-4He dilution refrigerator (Oxford Instruments, Kelvinox-25). The dc magnetic field was applied using a vector magnet system Deguchi et al. (2004). Based on the strong anisotropy of of Sr2RuO4, the field directions were determined with accuracies within with respect to the plane and within with respect to the direction within the plane.

In this paper, we measured in two different thermal processes, as depicted in Figs. 1(b) and (c). The first process is an ordinary field sweep (FS): the sample was cooled down to each target temperature in zero field and, kept at that temperature, the data was collected at each field on a field up-sweep sequence, followed by a field down-sweep sequence. The second process is the “each-point field cooling (EPFC)”. In this process, the sample at each field was once quickly heated up to above using the sample heaters and cooled back to the target temperature before collecting the data as described in Fig. 1(c). We confirmed by the signal that the sample is indeed heated up to above to become the normal state. After collecting the data, was changed before the next sequence of the heating, cooling, and data collection. As shown below, metastable vortex states can be induced with this latter process. We comment here that the EPFC process is similar to that adapted in Ref 10. However capability of much faster heating and cooling of the sample in our study enables us to construct vortex phase diagrams efficiently and precisely. Although we measured both the real and imaginary parts of , the imaginary part was too small. Thus, in this paper, we only discuss the real part. In order to subtract contribution from normal state and background, we adopt 2.0 K, as already done in Ref.36. We furthermore scaled so that at and K.
III Results
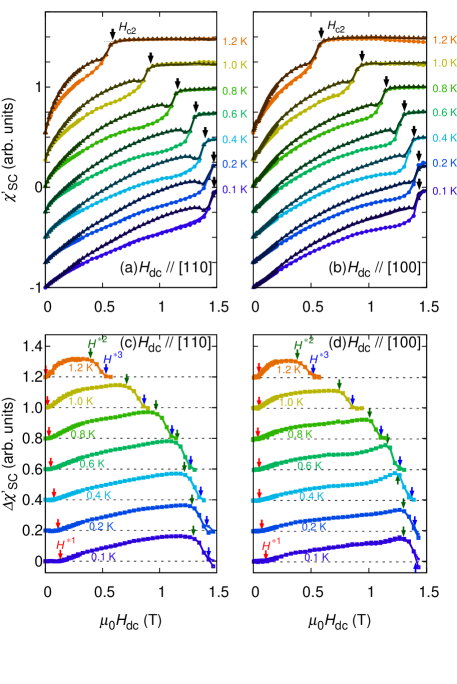
In Fig. 2(a), we present obtained with the FS and EPFC processes for at several temperatures. First we focus on results of the ordinary FS process. The curve of the FS process has a characteristic peak/dip structure near . This behavior resembles the peak effect observed in many ordinary type-II superconductors, Tomy and Pal (2002); Nattermann et al. (1998); Banerjee et al. (2001) and is consistent with previous reports on Sr2RuO4. Yoshida et al. (1996); Mao et al. (2000b); Yaguchi et al. (2002); Kittaka et al. (2009) The origin of this behavior will be discussed later. Note that the curves contain data of field-up and down sweeps; We didn’t observe any hysteresis between field-up and down sweeps except for near at low temperatures where the superconducting transition is of first order Yonezawa et al. (2013); Yanase et al. (2014). This absence of hysteresis in the FS branch in the superconducting state implies that the pinning effects are rather weak in this material so that one cannot achieve metastable vortex phases with the ordinary FS process.
Next, we focus on the data of the EPFC process for in Fig. 2(a). Interestingly, the curves for the EPFC process are very different from those for the FS process. Thus, we succeeded in inducing new vortex states by the EPFC process. The shielding signal in the FS branch is smaller than that in the EPFC branch in all investigated field and temperature conditions. This behavior indicates that the vortices in the EPFC branch are harder to move than those in the FS branch.
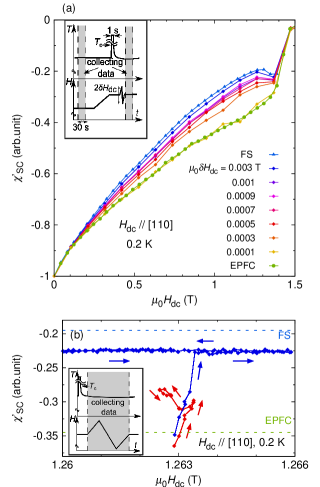
In order to investigate the stability of the EPFC-induced state, we tried other field/thermal processes. Firstly, we applied a small dc-field cycling with the amplitude to the EPFC branch just before collecting data as schematically explained in the inset of Fig. 3(a). As shown in Fig 3(a), the EPFC branch changes toward the FS branch with increasing . A field cycling of as small as 0.001 T is sufficient for the EPFC branch to merge into the FS branch. Larger field-cycling amplitude does not change the FS branch to other branches. Secondly, we performed ordinary FS after a EPFC process at T as presented in Fig. 3(b). We found that rapidly changes once the FS process started. Then becomes constant at a value very close to that of the FS branch when we swept by more than 0.001 T. These two results are consistent each other and indicate that the vortex state in the EPFC branch is metastable. Our observation also agrees with the general tendencies that the field-cooled vortex states are metastable, and that magnetic field cycling recovers more stable vortex states. Pasquini et al. (2008)
To compare the FS and EPFC branches in more detail, we evaluate the difference FSEPFC,
where EPFC is the average of EPFC in up and down sweeps.
Note that provides a measure of how sensitive the vortex configuration is against field/thermal processes.
From the data in Fig. 2(c), we can identify several field regions with different responses against field/thermal processes.
Firstly, in the lowest field region below a field that we denote by , is almost zero, indicating that the FS and EPFC branches exhibit the same value.
Thus, the vortex configurations achieved by the FS and EPFC processes are nearly the same for fields below .
We emphasize that this field scale in Sr2RuO4 has not been reported before to our knowledge and is newly revealed owing to the EPFC process employed in the present work.
Secondly, above , becomes larger with increasing field. On further increase of the field, starts to decrease beyond an onset field .
In this region, the FS branch shows a peak-effect-like feature as already explained.
Above a field which we denote by , becomes zero again and both processes yield the same vortex state, probably due to small pinning effect.
From these data, we construct the vortex phase diagram of Sr2RuO4 for as presented in Fig. 4(a). For the phase diagram, we adopt the following definitions for the field scales: We define as the field where the linear extrapolation in the region intersects the line, as the field where the linear extrapolations of increasing and decreasing regions intersects each other, and as the field where the linear extrapolation of the region intersects the line, respectively. These three characteristic fields decrease with increasing temperature but remain finite up to the zero-field . The narrow region between and become a little wider at low temperature. The separation between and is nearly independent of temperature below about 1 K. We note that the metastable state can be induced by the EPFC process in the wide region of the superconducting state surrounded by the and curves.
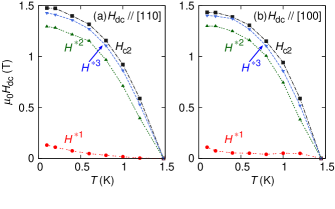
We performed similar measurements and analyses for to investigate the in-plane anisotropy. As shown in Fig. 2(b), curves for are similar to those for : The FS curves exhibit peak/dip structure near and the shielding signal in the FS branches is smaller than that in the EPFC branches. However there are some differences. For example, although the curves for at 0.1 K and 0.2 K show a clear peak/dip structure, such structure is rather vague in for . In addition, the temperature dependence of appears different: for monotonically decreases as the temperature is increased toward , whereas for exhibits a plateau in the range 0.5 K 1.2 K. As a result, above 0.8 K, for [100] is much larger than that for [110]. We comment here that this difference may be attributed to the difference in the vortex-lattice stability due to the in-plane anisotropy in the superconducting order parameter. Although previous study reported additional peak structure near only in the [110] direction, Yaguchi et al. (2002) we did not observe such additional peaks in this study possibly because the number of data points was not enough.
IV Discussion
First, we briefly summarize our experimental observations. The ordinary FS branch of Sr2RuO4 exhibits peak/dip structure in in the field region , similar to the peak effect in ordinary type-II superconductors such as NbSe2. Tomy and Pal (2002) The peak effect is attributed to changes in the vortex phases: the low-field onset of the peak effect correspond to the transition between the ordered VBG state in low fields and the disordered VG state, and the peak top corresponds to the transition between the VG and VL states. Therefore, in the ordinary type-II superconductor, and should correspond to VBG-VG and VG-VL transition lines. Similar situation is probably realized in Sr2RuO4, although consideration of the first-order superconducting transition is needed as described below. Indeed, previous SANS experiments Riseman et al. (1998); Rastovski et al. (2013) have revealed that the vortices exhibit clear Bragg reflections in wide regions of the phase diagram for both and , with thermal/field processes corresponding to our FS process. These results indicate that the bulk VBG state is formed in such regions. We achieved new metastable vortex phases by the EPFC process in the region . By examining the difference between the EPFC and FS branches, we are able to determine the accurate value of the onset of the peak-effect-like feature up to a high-temperature region, where the peak in itself becomes rather vague. Furthermore, we can get the new characteristic field signaling disappearance of metastability in the low-field region.
For , we revealed that vortex states in the EPFC process is metastable and should differ from the VBG state. There are several possible scenarios explaining the vortex state in the EPFC process. The first scenario is that a strongly pinned glassy state is induced by the EPFC process. Such a glassy state has been indeed reported in ordinary type-II superconductors. Tomy and Pal (2002) The second scenario is that a cleaner lattice is formed after a EPFC process. This scenario is based on the fact that the inter-vortex distance only depends on field and cooling process in EPFC should not change the distance. However, to the best of our knowledge, such a cleaner lattice has not been reported in other superconductors. In the third scenario, a metastable vortex state with vortices pinned at the surface is realized in the EPFC branch. Such a surface pinning is called the Bean-Livingston surface barrier and has been indeed observed in high- superconductors and granular superconductors. Burlachkov (1993); Kugel and Rakhmanov (1992) The vortices pinned by the surface pinning potential are easily moved by a small field cycling and are rearranged back to a more stable bulk VBG configuration.
Let us now discuss the origin of the state for . Since the field scale has previously not been known, the VBG state in the bulk was expected to occupy the whole region below down to the lower critical field , which is approximately 1 mT at . Sudershan et al. (1997) Our observation of , however, forces us to reconsider this naive expectation. In this region, due to a large inter-vortex distance, the vortex-vortex interaction may become too weak to sustain a stable VBG state in the bulk. For such a region, some theories predict existence of liquid-like vortex state near originating from such vanishingly small vortex interactions. Nelson (1988); Nelson and Seung (1989); Blatter et al. (1994); Fisher et al. (1991) Indeed, such a liquid-like state has been observed in high- cuprates near . Sudershan et al. (1997); Hucho et al. (2000) We propose that a similar liquid-like state is realized in Sr2RuO4 below . Note that the first and third scenarios for the stable VBG state for are compatible with the formation of the liquid-like state below . In the first scenario, it is naturally expected that the glassy metastable state becomes difficult to form when a liquid-like state is stable. In the third scenario, the Bean-Livingston surface barrier is also known to disappear once a liquid-like state is formed.
One apparent issue on this scenario is that the observed is approximately 100 times larger than , whereas ordinarily the low-field liquid phase has been expected only in the vicinity of . foo (a) To explain why the liquid phase can be realized in such a large field region in Sr2RuO4, we should consider its large anisotropy. Assuming a triangular vortex lattice, the inter-vortex distance in an isotropic superconductor is
| (1) |
where is the flux quantum and is the magnetic flux density. Meanwhile, the inter-vortex distances in an anisotropic superconductor are given by
| (2) | |||
| (3) |
where and are the shorter and longer inter-vortex distances, respectively (Fig. 5); and is the superconducting anisotropy.

It is natural to assume that the liquid state exists when either or becomes longer than a certain length . Then, the melting field for an isotropic superconductor is
| (4) |
whereas the melting field for an anisotropic superconductor with is
| (5) |
Thus, is almost times larger than . For YBa2Cu3O7-δ, is expected to be about 6 times larger than the penetration depth . foo (b) Assuming that this relation holds for Sr2RuO4, we estimate Å. Mackenzie and Maeno (2003) Thus, using eq. (5) and , for Sr2RuO4 is estimated to be 0.07 T. Even with this simple estimation, the value of semi-quantitatively agrees with the observed T. We should note here that the vortices may be still ordered along the direction even below since is still much smaller than . In this sense, the low-field liquid phase may have similarity to liquid crystals, as already proposed in Ref. 32.
Before closing the discussion, we comment on the relation between our result and the first-order superconducting transition. It has been recently revealed that the superconducting to normal transition of Sr2RuO4 below 0.8 K under in-plane field is of first-order. Yonezawa et al. (2013); Yanase et al. (2014) In ordinary type-II superconductors, continuous suppression of the superconducting order parameter toward zero as is the main source of the formation of the glass and liquid phases near . In contrast, the order parameter abruptly disappears from a finite value at the first order transition. Thus, it is actually surprising that the vortex phase diagrams of Sr2RuO4 for resemble those of ordinary type-II superconductors. Note that this sample exhibits weak but clear hysteretic behavior at , although not clear in the scale of Fig. 2(b). It is still an open question whether vortex phase transitions can occur near the first-order transition, which should not be accompanied by strong fluctuations. Further studies with cleaner samples are needed to resolve this interesting issue.
V Conclusion
The EPFC process, in which the sample was once quickly heated up to above and cooled back to the target temperature before collecting the data, enables us to realize new metastable vortex states. Precise vortex phase diagrams having a liquid-like state in the low-field region are revealed by comparison between the FS and EPFC branches. These vortex phase diagrams of Sr2RuO4 provide important bases for further studies of searching for superconducting multiphases originating from the anticipated chiral--wave spin-triplet order parameter.
Finally, we emphasize that the newly employed EPFC process can be adapted not only to ac susceptibility measurements but also to other techniques such as magnetization measurements and neutron diffractions. It is also applicable to study vortex phase diagrams of other conventional and unconventional type-II superconductors. Thus, it is envisaged that the EPFC method becomes a general and powerful technique to investigate vortex physics.
Acknowledgements
We acknowledge H. Takatsu for his contributions in crystal growth and R. Ikeda for helpful discussion. This work was supported by the “Topological Quantum Phenomena” (Nos. 22103002 & 22103004) Grant-in Aid for Scientific Research on Innovative Areas from the Ministry of Education, Culture, Sports, Science and Technology (MEXT) of Japan, and by Grant-in-Aid for Scientific Research (KAKENHI 26287078) from the Japan Society for Promotion of Science (JPSJ)
References
- Blatter et al. (1994) G. Blatter, M. Feigel’Man, V. B. Geshkenbeln, A. I. Larkin, and V. M. Vinokur, Rev. Mod. Phys. 66, 1125 (1994).
- Fisher et al. (1991) D. S. Fisher, M. P. A. Fisher, and D. A. Huse, Phys. Rev. B 43, 130 (1991).
- Nelson and Seung (1989) D. R. Nelson and H. S. Seung, Phys. Rev. B 39 (1989).
- Nelson (1988) D. R. Nelson, Phys. Rev. Lett. 60, 1973 (1988).
- Fisher (1989) M. P. A. Fisher, Phys. Rev. Lett. 62, 1415 (1989).
- Zeldov et al. (1995) E. Zeldov, D. Majer, M. Konczykowski, V. B. Geshkenbeln, V. M. Vinokur, and H. Shtrikman, Nature 375, 373 (1995).
- Banerjee et al. (2001) S. Banerjee, A. Grover, M. Higgins, G. I. Menon, P. K. Mishra, D. Pal, S. Ramakrishnan, T. V. Chandrasekhar Rao, G. Ravikumar, V. C. Sahni, S. Sarkar, and C. V. Tomy, Physica C 355, 39 (2001).
- Tomy and Pal (2002) C. Tomy and D. Pal, Pramana - J. Phys. 58, 925 (2002).
- Nattermann et al. (1998) T. Nattermann, Y. Shapir, and I. Vilfan, Phys. Rev. B 58, 995 (1998).
- G. Ravikumar, V. C. Sahni, P. K. Mishra, T. V. Chandrasekhar Rao, S. S. Banerjee, A. K. Grover, S. Ramakrishnan, S. Bhattacharya, M. J. Higgins, E. Yamamoto, Y. Haga, M. Hedo, Y. Inada (1998) Y. O. G. Ravikumar, V. C. Sahni, P. K. Mishra, T. V. Chandrasekhar Rao, S. S. Banerjee, A. K. Grover, S. Ramakrishnan, S. Bhattacharya, M. J. Higgins, E. Yamamoto, Y. Haga, M. Hedo, Y.Inada, Phys. Rev. B 57, R11069 (1998).
- Ling et al. (2001) X. Ling, S. Park, B. McClain, S. Choi, D. Dender, and J. Lynn, Phys. Rev. Lett. 86, 712 (2001).
- Maeno et al. (1994) Y. Maeno, H. Hashimoto, K. Yoshida, S. Nishizaki, T. Fujita, J. G. Bednorz, and F. Lichtenberg, Nature 372, 532 (1994).
- Kallin (2012) C. Kallin, Rep. Prog. Phys. 75, 042501 (2012).
- Maeno et al. (2012) Y. Maeno, S. Kittaka, T. Nomura, S. Yonezawa, and K. Ishida, J. Phys. Soc. Jpn. 81, 011009 (2012).
- Mackenzie and Maeno (2003) A. P. Mackenzie and Y. Maeno, Rev. Mod. Phys. 75, 657 (2003).
- Ishida et al. (1998) K. Ishida, H. Mukuda, Y. Kitaoka, K. Asayama, Z. Q. Mao, Y. Mori, and Y. Maeno, Nature 396, 658 (1998).
- (17) K. Ishida, unpublished .
- Miyake (2014) K. Miyake, J. Phys. Soc. Jpn. 83, 053701 (2014).
- Duffy et al. (2000) J. A. Duffy, S. M. Hayden, Y. Maeno, Z. Mao, J. Kulda, and G. J. McIntyre, Phys. Rev. Lett. 85, 5412 (2000).
- Luke et al. (1998) G. M. Luke, Y. Fudamoto, K. M. Kojima, M. I. Larkin, J. Merrin, B. Nachumi, Y. J. Uemura, Y. Maeno, Z. Q. Mao, Y. Mori, H. Nakamura, and M. Sigrist, Nature 394, 558 (1998).
- Xia et al. (2006) J. Xia, Y. Maeno, P. T. Beyersdorf, M. M. Fejer, and A. Kapitulnik, Phys. Rev. Lett. 97, 167002 (2006).
- Agterberg (1998) D. F. Agterberg, Phys. Rev. Lett. 80, 5184 (1998).
- Udagawa et al. (2005) M. Udagawa, Y. Yanase, and M. Ogata, J. Phys. Soc. Jpn 74, 2905 (2005).
- Kaur et al. (2005) R. P. Kaur, D. F. Agterberg, and H. Kusunose, Phys. Rev. B 72, 144528 (2005).
- Yanase et al. (2014) Y. Yanase, S. Takamatsu, and M. Udagawa, J. Phys. Soc. Jpn. 83, 061019 (2014).
- Joynt and Taillefer (2002) R. Joynt and L. Taillefer, Rev. Mod. Phys. 74, 235 (2002).
- Deguchi et al. (2002) K. Deguchi, M. A. Tanatar, Z. Mao, T. Ishiguro, and Y. Maeno, J. Phys. Soc. Jpn. 71, 2839 (2002).
- Yonezawa et al. (2013) S. Yonezawa, T. Kajikawa, and Y. Maeno, Phys. Rev. Lett. 110, 077003 (2013).
- Yonezawa et al. (2014) S. Yonezawa, T. Kajikawa, and Y. Maeno, J. Phys. Soc. Japan 83, 083706 (2014).
- Rastovski et al. (2013) C. Rastovski, C. D. Dewhurst, W. J. Gannon, D. C. Peets, H. Takatsu, Y. Maeno, M. Ichioka, K. Machida, and M. R. Eskildsen, Phys. Rev. Lett. 111, 087003 (2013).
- Kittaka et al. (2014) S. Kittaka, A. Kasahara, T. Sakakibara, D. Shibata, S. Yonezawa, Y. Maeno, K. Tenya, and K. Machida, Phys. Rev. B 90, 220502 (2014).
- Carlson et al. (2003) E. Carlson, a. Castro Neto, and D. Campbell, Phys. Rev. Lett. 90, 087001 (2003).
- Riseman et al. (1998) T. Riseman, P. Kealey, and E. Forgan, Nature 396, 242 (1998).
- Yoshida et al. (1996) K. Yoshida, Y. Maeno, S. Nishizaki, and T. Fujita, J. Phys. Soc. Jpn. 65, 2220 (1996).
- Yaguchi et al. (2002) H. Yaguchi, T. Akima, Z. Mao, Y. Maeno, and T. Ishiguro, Phys. Rev. B 66, 214514 (2002).
- Kittaka et al. (2009) S. Kittaka, T. Nakamura, Y. Aono, S. Yonezawa, K. Ishida, and Y. Maeno, Phys. Rev. B 80, 174514 (2009).
- Mao et al. (2000a) Z. Mao, Y. Maeno, and H. Fukazawa, Mater. Res. Bull. 35, 1813 (2000a).
- Deguchi et al. (2004) K. Deguchi, T. Ishiguro, and Y. Maeno, Rev. Sci. Instrum. 75, 1188 (2004).
- Mao et al. (2000b) Z. Q. Mao, Y. Maeno, S. NishiZaki, T. Akima, and T. Ishiguro, Phys. Rev. Lett. 84, 991 (2000b).
- Pasquini et al. (2008) G. Pasquini, D. Daroca, C. Chiliotte, G. Lozano, and V. Bekeris, Phys. Rev. Lett. 100, 247003 (2008).
- Burlachkov (1993) L. Burlachkov, Phys. Rev. B 47, 8056 (1993).
- Kugel and Rakhmanov (1992) K. Kugel and A. Rakhmanov, Physica C 196, 17 (1992).
- Sudershan et al. (1997) Y. S. Sudershan, A. Rastog, S. V. Bhat, A. K. Grover, Y. Yamaguchi, K. Oka, and Y. Nishihara, Physica C 282-287, 1975 (1997).
- Hucho et al. (2000) C. Hucho, J. M. Carter, V. Müller, A. Petrean, and W. K. Kwok, Physica C 332, 370 (2000).
- foo (a) In YBa2Cu3O7-δ with , Blatter et al. (1994) is expected to be 0.0001 T above , which is around 0.07 T.
- foo (b) From the values T, and Å, Blatter et al. (1994) in YBa2Cu3O7-δ is evaluated to be 0.004 T by using the formula Then, can be evaluated using eq. (4).