Dissecting the Gaseous Halos of Damped Ly Systems with Close Quasar Pairs
Abstract
We use spectroscopy of close pairs of quasars to study diffuse gas in the circumgalactic medium (CGM) surrounding a sample of 40 Damped Ly systems (DLAs). The primary sightline in each quasar pair probes an intervening DLA in the redshift range , such that the second quasar sightline then probes Ly, C II, Si II, and C IV absorption in the CGM transverse to the DLA to projected distances kpc. Analysis of the Ly profiles in these CGM sightlines constrains the covering fraction () of optically thick H I (having column density ) to be within kpc of DLAs. Strong Si II absorption with equivalent width Å occurs with an incidence in the closest CGM sightlines (at kpc), indicating that low-ionization metal absorption associated with DLAs probes material within a physical distance kpc. However, we find that strong C IV absorption is ubiquitous in these environments ( within kpc), and in addition exhibits a high degree of kinematic coherence on scales up to kpc. We infer that this high-ionization material arises predominantly in large, quiescent structures extending beyond the scale of the DLA host dark matter halos rather than in ongoing galactic winds. The Ly equivalent width in the DLA-CGM is anticorrelated with at confidence, suggesting that DLAs arise close to the centers of their host halos rather than on their outskirts. Finally, the average Ly, C II and C IV equivalent widths measured as a function of are consistent with those measured around Lyman Break Galaxies. Assuming that DLAs trace a galaxy population at lower masses and luminosities, this finding implies that the absorption strength of cool circumgalactic material has a weak dependence on dark matter halo mass at .
Subject headings:
galaxies: ISM — galaxies: halos — quasars: absorption lines1. Introduction
Damped Ly absorbers (DLAs) tracing H I with column density have contained most of the neutral gas since (Wolfe et al., 1986; Storrie-Lombardi & Wolfe, 2000). The significant decline in the neutral gas mass density between and today, concomitant with the buildup of over half the present-day mass in stars (Hopkins & Beacom, 2006), suggests that DLAs dominate the reservoir of fuel for star formation over cosmic time (Wolfe et al., 2005).
However, efforts to establish the direct link between DLAs and the sites of active, ongoing star formation have met with only partial success. The shape of the conjugate Ly emission and absorption profiles observed ‘down the barrel’ toward luminous Lyman Break Galaxies (LBGs) at suggests that their galactic disks have H I surface densities exceeding the DLA threshold (Pettini et al., 2002; Shapley et al., 2003; Steidel et al., 2010). On the other hand, many of the observational programs targeting emission from counterpart galaxies close to quasar sightlines probing DLAs have yielded non-detections. To date, these efforts have revealed only associated galaxies at (e.g. Möller et al., 2004; Fynbo et al., 2010; Péroux et al., 2011; Bouché et al., 2012; Krogager et al., 2012; Fynbo et al., 2013; Jorgenson & Wolfe, 2014), the majority of which were selected for study based on their relatively high metallicity (e.g., Möller et al., 2004; Fynbo et al., 2013). These counterparts are typically within ( kpc) of the background QSO (Krogager et al., 2012), and in cases for which robust photometry is possible have magnitudes , or (Reddy et al., 2008).
Systems with lower metallicities than those targeted in the aforementioned imaging studies, however, likely trace a much fainter, less massive galaxy population. The tight positive correlation between DLA metallicities and both the kinematic width of unsaturated low-ionization metal absorption and the equivalent width () of saturated transitions (i.e., Si II ) is strongly evocative of the mass-metallicity relation established for galaxies from the local universe out to (Tremonti et al., 2004; Erb et al., 2006a; Møller et al., 2013), inspiring the inference that traces the kinematics (and hence the mass) of DLA host dark matter halos (Prochaska et al., 2008; Neeleman et al., 2013). Indeed, searches for individual DLA hosts selected without regard for metallicity have resulted in very few detections, and a recent statistical study of the rest-frame UV flux arising within kpc of DLAs demands that the vast majority of these systems are forming stars at a rate (Fumagalli et al., 2014c). Such stringent limits strongly suggest that DLAs must be hosted by low-luminosity (), low-mass galaxies.
At the same time, however, DLA velocity widths are too large to arise from the rotational motions of individual dwarf systems (; Prochaska & Wolfe, 1997; Wolfe et al., 2005). Studies of DLAs in early cosmological simulations invoked multiple neutral gas ‘clumps’ virialized within a single dark matter halo to satisfy this latter constraint (e.g., Haehnelt et al., 1998; Nagamine et al., 2004; Pontzen et al., 2008). More recent work has suggested that some fraction of DLAs arise in cold, dense inflowing streams extending over many tens of kpc and feeding star formation in a massive central galaxy (Razoumov et al., 2008; Fumagalli et al., 2011; Cen, 2012), and/or that they trace wind material lofted away from galactic disks by star formation driven outflows (Pontzen et al., 2008; Razoumov et al., 2008). We note, however, that none of these cosmological simulations have been able to match the full DLA velocity width distribution (although see Bird et al. 2014a for recent success along these lines). Moreover, a constraint on the bias of DLAs from measurement of their cross-correlation with Ly forest absorption implies they must also arise in dark matter halos with masses exceeding (Font-Ribera et al., 2012). As clustering measurements suggest that such massive halos host luminous LBGs at (Adelberger et al., 2005; Conroy et al., 2008; Rakic et al., 2013) with star formation rates (SFR) of (Erb et al., 2006b), this finding lies in apparent conflict with the stringent limits imposed on DLA-galaxy UV luminosities by direct imaging studies (e.g., Fumagalli et al., 2014c).
This tension leaves open a number of questions regarding the nature of DLAs. To date, few experiments have assessed the incidence of DLAs as a function of halo mass (Prochaska et al. 2013a; hereafter QPQ6), the spatial extent of DLAs (e.g., Cooke et al., 2010), or the location of these systems within their host halos (e.g., in extended streams or in compact, central galaxy disks). In principle, however, empirical constraints on these quantities can directly relate the cold gas content of DLAs with the star-forming regions they will feed.
One avenue toward meeting this goal is the measurement of the cool hydrogen and metal content in the environments surrounding DLAs; i.e., the study of their circumgalactic medium (CGM). The more diffuse material in these regions must likewise compose the fuel for star formation at later epochs, and is likely enriched by the large-scale outflows driven by current and past star formation in nearby galaxies (Heckman et al., 1990; Veilleux et al., 2003, 2005). Studies leveraging spectroscopy of lensed QSOs have recently begun to provide measurements of the CGM close to a small sample of DLAs () over kpc scales (Smette et al., 1995; Lopez et al., 2005; Monier et al., 2009; Cooke et al., 2010), with the vast majority of these systems manifest as DLAs toward only one of the QSO images. Adopting a model assuming that the H I column declines exponentially with projected distance, Cooke et al. (2010) found typical scalelengths for of kpc for this sample. Their analysis suggests that such scale lengths imply total DLA sizes of kpc, supporting a picture in which the neutral material has a highly localized, compact structure. In one of the only studies of the spatial distribution of cool gas absorption around DLAs on scales larger than kpc, Ellison et al. (2007) reported on spectroscopy of a binary QSO separated by kpc (also included in the present analysis), identifying a absorption system having in both QSO sightlines. From comparison with the H I distribution in cosmological ‘zoom-in’ simulations of two halos (Razoumov & Sommer-Larsen, 2006), both of which have DLA-absorbing material distributed on scales kpc, they conclude that the coincidence is most likely due to a structure hosting more than one massive galaxy.
However, most studies of the CGM to date have focused on the areas surrounding strongly star-forming or AGN-dominated systems which are identified with relative ease in deep imaging and spectroscopic surveys. LBGs, photometrically selected from deep near-UV and optical imaging as described in Steidel et al. (2003, 2004) and Adelberger et al. (2004), are now known to be surrounded by an envelop of H I which is optically thick (with ) in % of sightlines to projected distances of kpc (Rudie et al., 2012; Crighton et al., 2013, 2014). More recent work taking advantage of a large sample of close pairs of luminous quasars (Hennawi et al., 2006a, 2010) has explored the gaseous environments of quasar-host galaxies, revealing a incidence of optically thick, metal-enriched material out to kpc, with enhanced H I absorption extending to even larger scales ( Mpc; Hennawi et al. 2006b; Hennawi & Prochaska 2007, 2013; Prochaska et al. 2013b or QPQ5 hereafter; QPQ6). Taken together, these studies demonstrate clear, qualitative differences between the H I and metal absorption properties of material tracing the high-mass dark matter halos hosting high-redshift quasars (with masses ; Wild et al. 2008; White et al. 2012; Font-Ribera et al. 2013), and the gas in halos of more modest masses hosting LBGs (; Adelberger et al. 2005; Conroy et al. 2008; Rakic et al. 2013). Detailed studies of the CGM around systems with a broad range of properties similarly suggest a trend of increasing H I and low-ionization metal absorption strength with halo mass (Churchill et al. 2013; Werk et al. 2014; R. Bordoloi et al. in prep; Prochaska et al. 2014 or QPQ7 hereafter). Characterization of these quantities in DLA environments thus offers a point of comparison with magnitude-selected samples, providing the opportunity to differentiate based on the properties of this CGM material. There has in addition been significant recent progress toward predicting the properties of the CGM using cosmological ‘zoom-in’ simulations (e.g., Fumagalli et al., 2014a; Faucher-Giguere et al., 2014) with a particular focus on developing these predictions over a broad range in halo mass. Study of the diffuse gas surrounding DLAs will directly address the degree of metal enrichment due to the effects of stellar feedback acting from nearby star-forming regions, potentially providing the only constraint on feedback physics in the lowest-mass halos studied in these simulations.
Using a subset of the large sample of close pairs of quasars referenced above (Hennawi et al., 2006a, 2010), we have searched each quasar sightline for instances of damped Ly absorption in the foreground of both of the paired quasars. Here we report our measurements of the Ly and metal-line absorption strength and kinematics in the CGM out to kpc around of these systems, obtained from spectroscopy of the secondary quasar in each pair. Our sample selection and dataset are described in §2, and our methods for assessing CGM absorption are described in §3. We present our results in §4, and discuss their implications for the nature of DLAs and their relationship to luminous galaxies in §5. We adopt a CDM cosmology with , and throughout.
2. Data and Sample Selection
Our DLA sample is drawn from an ongoing survey to obtain medium-resolution spectroscopy of close quasar pairs at (QPQ6). These pairs were initially identified via data mining techniques from SDSS photometry (Bovy et al., 2011, 2012). Pair candidates were then observed with low-resolution spectrographs on a suite of 3.5-6.5m telescopes at the APO, KPNO, MMTO and Calar Alto Observatory as described in Hennawi et al. (2006a, 2010) to develop a sample of confirmed QSO pairs having transverse separations kpc and minimum redshifts . We subsequently obtained deep, medium- and high-resolution spectroscopy of many of these quasars using a range of instruments, including LBT/MODS, Gemini/GMOS, Magellan/MagE, Magellan/MIKE, Keck/ESI and Keck/LRIS. These observations and the data reduction procedures are described in detail in §2.2 of QPQ6.
Following the publication of QPQ6 we added observations of three additional pairs to this survey. Two of these pairs were observed with the Magellan Echellette Spectrograph (MagE; Marshall et al. 2008) on the 6.5m Magellan Clay telescope on the nights of UT 2014 February 1-4. These data were collected with the -wide slit, and thus have a spectral resolution and a wavelength coverage Å. A single additional pair was observed with the Echellette Spectrometer and Imager (ESI; Sheinis et al. 2002) on the 10m Keck 2 telescope on the night of UT 2014 February 5 with the slit. These data provide a spectral resolution and wavelength coverage Å. We reduced these MagE and ESI data following the same procedures listed in QPQ6, making use of custom software available in the public XIDL software package111www.ucolick.org/xavier/IDL.
We further supplemented this spectroscopic sample with high-S/N SDSS and BOSS spectra where available (Abazajian et al., 2009; Ahn et al., 2012). In the following analysis, we use the highest spectral resolution data at hand for targets which have been observed with more than one instrument, preferring MIKE, ESI or MagE data, but selecting LRIS, GMOS, or SDSS/BOSS spectra (in order of preference) when echelle or echellette coverage is not available. Quasar redshifts are calculated as described in QPQ6, and have uncertainties in the range .
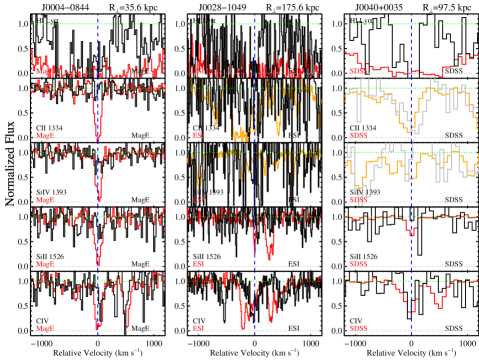
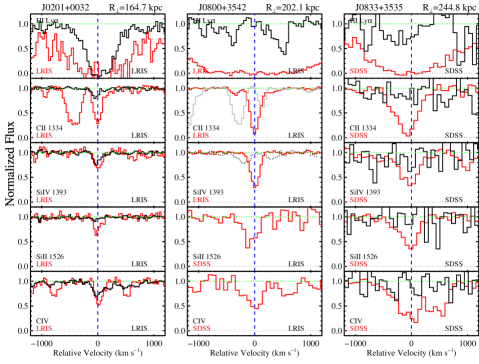
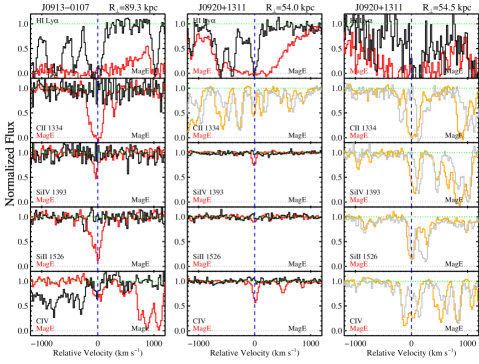
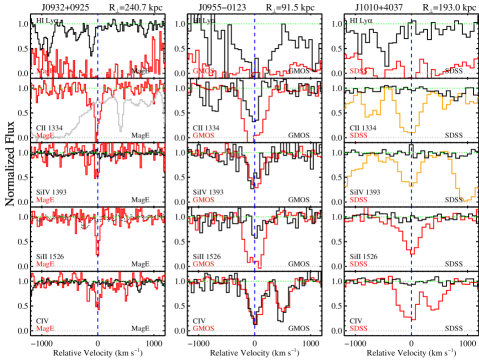
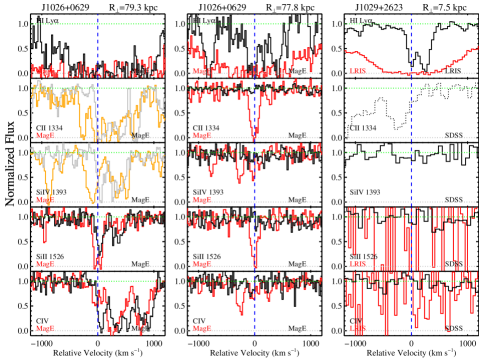
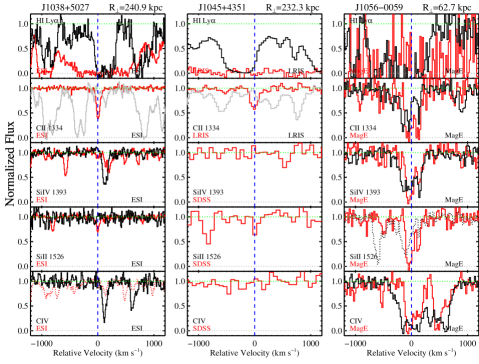
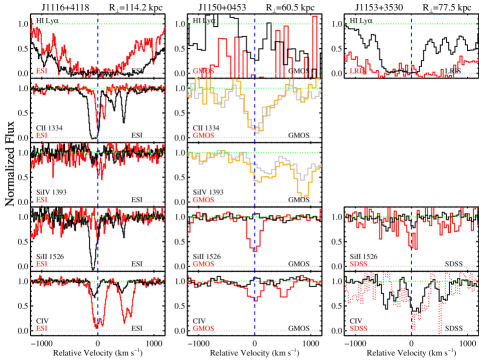
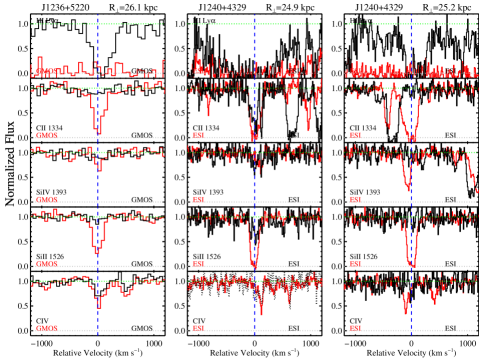
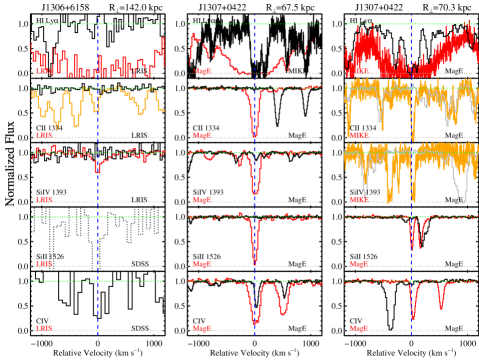
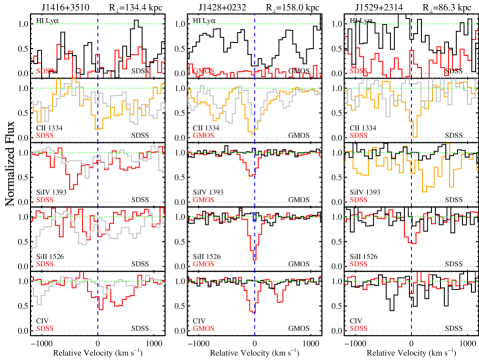
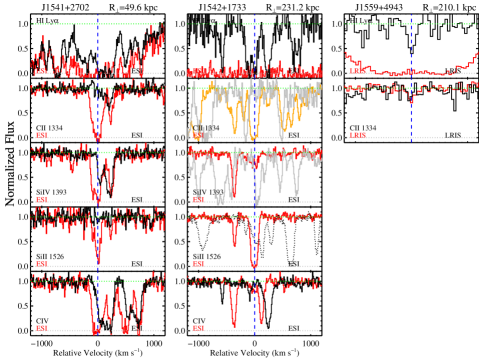
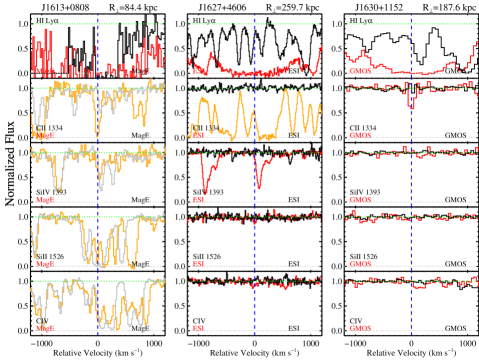
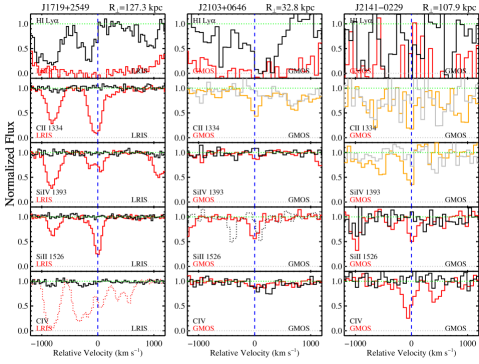
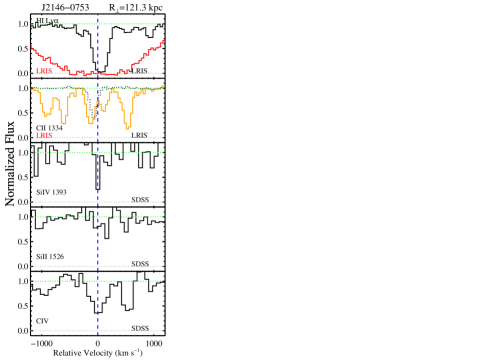
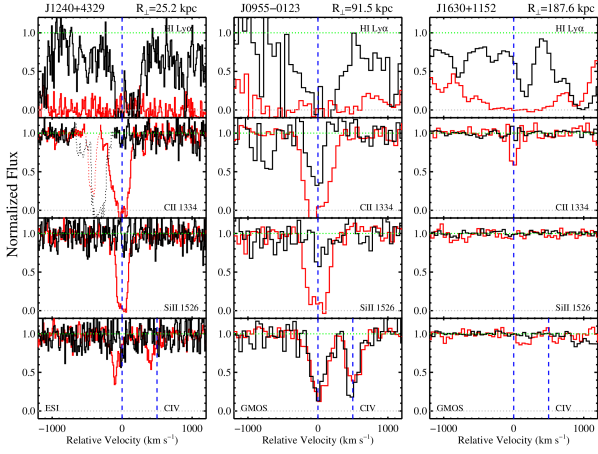
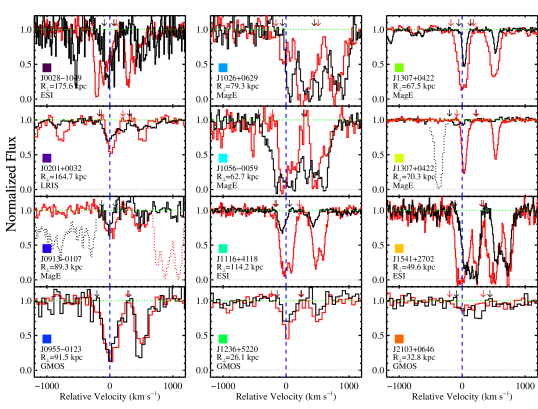
We performed a by-eye search of each spectrum for the signature of a DLA with Ly absorption blueward of the Ly emission line in the foreground quasar in each pair and redward of the Lyman limit at the redshift of the corresponding background quasar. The redshift of each DLA was set by an approximate centroid of the associated low-ionization metal absorption. We fitted a model Voigt profile to the H I absorption in each DLA using custom routines (xfitdla, also available in the XIDL software package), obtaining constraints with typical uncertainties of dex dominated by continuum error and line blending (Prochaska et al., 2003). We then expunged all systems having and lying within of the foreground quasar redshift. This liberal limit (slightly lower than the limit defining DLAs, ) increases our sample size while still selecting systems which are predominantly neutral (H I/H ; Prochaska & Wolfe 1996). Finally, both quasar spectra in every pair probing a DLA were continuum normalized using custom software as described in QPQ6. All pairs with CGM sightlines having at the wavelength corresponding to the Ly transition at the DLA redshift (henceforth ) were then eliminated from the sample. This leaves a total of 40 pairs probing DLAs and with spectral S/N sufficient to constrain the Ly absorption in the CGM sightline. For three pairs exhibiting DLAs toward both QSOs, the sightlines were assigned to the DLA and CGM samples arbitrarily, and were treated as single systems. The instrumentation, spectral resolution, and date of observation for each of these 40 pairs is listed in Table Dissecting the Gaseous Halos of Damped Ly Systems with Close Quasar Pairs. Representative spectroscopy of the H I and metal-line absorption for three of our sample DLAs (red) and the corresponding CGM sightlines (black) is shown in Figure 1. We show spectroscopy of the full sample of 40 pairs in the Appendix.
One of the QSO pairs in our sample, SDSSJ1029+2623, with an apparent angular separation , is not a physical pair but rather two images of a lensed QSO at . This system was first reported in Inada et al. (2006) and further analyzed by Oguri et al. (2013), who obtained the redshift of the lensing cluster . We use the relation derived by Cooke et al. (2010) and presented in their Eqn. 5 to calculate the transverse distance between the two light paths at . This distance, kpc, is assumed throughout this work, and makes this system the closest QSO ‘pair’ in our sample.
3. Line Profile Analysis
3.1. Equivalent Widths
As a first step in our analysis, we measure boxcar of the Ly absorption at along the CGM sightline (). This measurement can be complicated by line-blending with intervening Ly forest absorbers, particularly for the subset of our sample observed at medium resolution and for systems at . We search the spectral region within of by eye to find the “single” H I absorption component closest to . We choose the velocity range assigned to each absorber by hand, aiming to encompass the full velocity extent of this single component, and then perform a simple boxcar sum over this velocity range to obtain . While this method is somewhat subjective, it at least provides a conservative lower bound on the H I absorption strength along the sightline.
As we wish to characterize the possible enhancement of Ly absorption due to the presence of a nearby DLA, we must also assess the ‘background’ strength of Ly absorption in randomly-selected regions of the intergalactic medium (IGM). To do this, we draw from the much larger spectroscopic sample of QSO pairs described in QPQ6, which are similar in both S/N and spectral resolution to the present sample. For each DLA, we select a QSO spectrum at random from all spectra for which is both redward of the Ly transition and blueward of the Ly transition in the rest-frame of the QSO. We also require that does not coincide with Ly absorption from any close foreground QSO. We then search within a window around , again selecting the strongest H I absorption component closest to . This procedure results in a sampling of IGM Ly absorption with the same redshift distribution as our DLA sample, and which we verified to have a flat distribution of flux-weighted velocity centroids (measured relative to ).
The strength of C II 1334, Si II 1526, and C IV 1548, 1550 absorption in the CGM sightlines was assessed in a similar manner, although the wavelength range chosen to span each metal-line absorber was limited to within the velocity window previously determined for the corresponding H I absorption. We likewise measured the boxcar of each of these transitions in the DLAs themselves; here, because such metal-line absorption is nearly always strong and is used to determine , there is no ambiguity in line identification. These measurements, along with , are listed for each system in Table Dissecting the Gaseous Halos of Damped Ly Systems with Close Quasar Pairs.
3.2. The Average CGM Absorption Strength
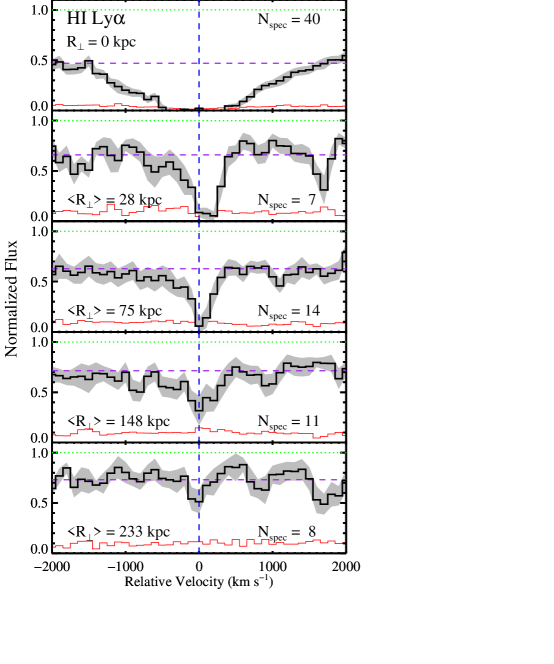
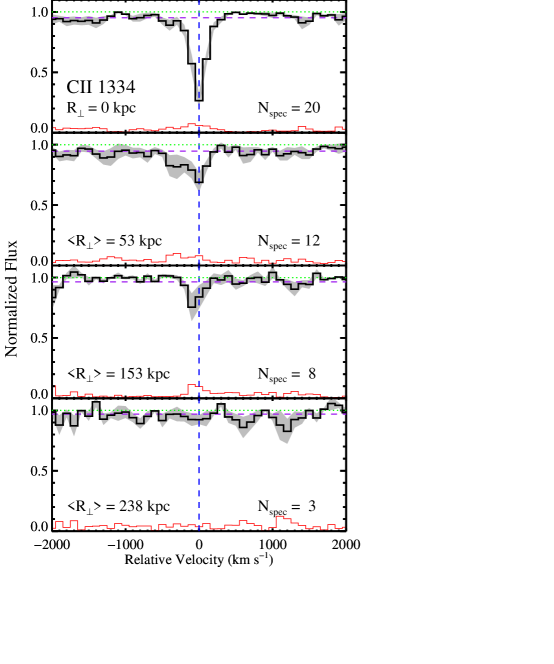
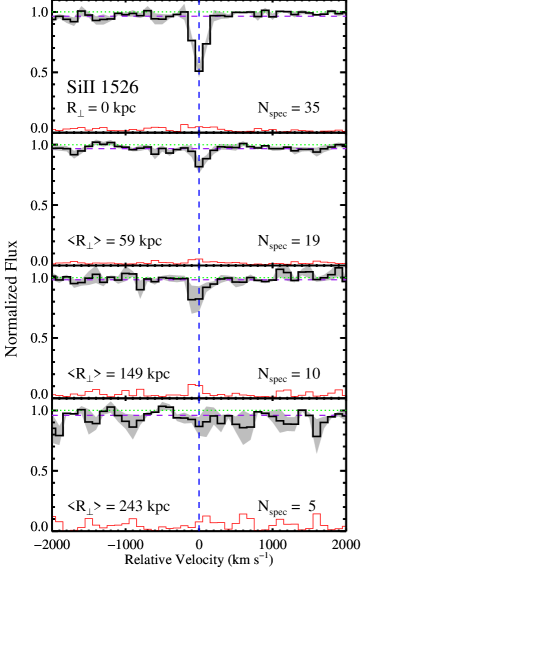
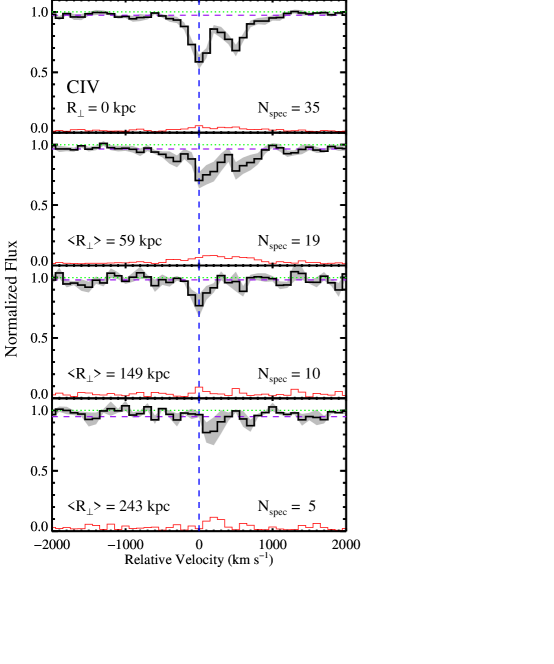
We also wish to quantify the ‘average’ absorption strength of the aforementioned transitions, both to track the change in the mean level of absorption with projected distance from DLAs and to facilitate comparisons with studies of the CGM around systems selected using complementary methods (e.g., QPQ5; Steidel et al., 2010; Crighton et al., 2013, 2014; Turner et al., 2014). To assess this average we coadd the continuum-normalized spectroscopy of our DLA and CGM sightlines covering Ly, C II, Si IV , Si II, and C IV using the method described in §3 of QPQ7. Briefly, we linearly interpolate each spectrum onto -wide pixels, preserving the total normalized flux. We then compute the average flux in each pixel, renormalize the resulting coadd via a linear fit to the pseudo-continuum measured in the velocity windows and , and measure the equivalent width () of any resulting features. When generating coadded spectra for the metal-line transitions, we only include sightlines for which the transition of interest lies outside of the Ly forest (i.e., ). For all of the transitions except for C IV, we use a relative velocity window to measure . For the latter we choose a window , such that the red edge of the window falls at the midpoint between the two lines in the C IV doublet, and thus avoids absorption from the Å transition. The uncertainty in this equivalent width is determined by generating 100 bootstrap samples of the spectra, coadding each sample in the same manner, and measuring the dispersion in the resultant mean absorption strength among these 100 samples. The results of the coaddition of all DLA sightlines covering Ly, C II, Si II, and C IV are shown in Figure 2, along with coadds of the CGM sightlines sorted by . measurements are listed in Table Dissecting the Gaseous Halos of Damped Ly Systems with Close Quasar Pairs and discussed in §4.
3.3. along CGM Sightlines
Finally, we make an effort to assess the column density of H I detected at in each CGM sightline using detailed analysis of the line profile shapes and aided by our measurements of both H I and metal absorption. A significant fraction of the CGM H I systems in our sample do not exhibit damping wings, and yet have values ( Å) placing them on the flat part of the curve of growth. In such cases, the line profile shapes depend strongly on gas kinematics rather than gas column, and hence can only be used to place a lower limit on the amount of material along the sightline. However, as we expect these limits to be constraining for galaxy formation models (e.g., Shen et al., 2012; Fumagalli et al., 2014a), we move forward with the following approach (described in complete detail in QPQ6).
For every spectrum with sufficient S/N ( at ), we first perform a by-eye Voigt profile fit to the H I line profile using a custom interactive fitting code. This code allows the user to adjust the model Doppler parameter and for an optimal fit. In cases for which damping wings are clearly evident (), this method provides a relatively tight constraint with an uncertainty of dex. For a handful of CGM sightline spectra obtained with MagE or ESI and which are sensitive to optically thin systems with Å, we may likewise perform a direct comparison with model line profile shapes to obtain a tight column density constraint. For the remaining systems, we use the absence of obvious damping wings to place an upper limit on the gas column by increasing the in the model profile until its shape is no longer consistent with the observed line. These measurements and limits are included in Table Dissecting the Gaseous Halos of Damped Ly Systems with Close Quasar Pairs.
This latter category of absorbers makes up a substantial fraction of our sample, and we are therefore motivated to search for additional constraints on the gas column. Systems having strong low-ionization metal absorption are very likely optically thick to ionizing radiation (with ; Fumagalli et al. 2013), and so we deem any system having low-ionization metal-line (C II 1334 or Si II 1526) Å ‘optically thick’. Systems with particularly high values ( Å, corresponding to a single absorber having a Doppler parameter of and ) or which exhibit damping wings are also assumed to be optically thick, even if the corresponding metal absorption is weak, blended with the Ly forest, or if we lack spectroscopic coverage of the metal transitions of interest. All other saturated systems which lack damping wings, however, are conservatively assumed to have ‘ambiguous’ optical depths (below the previously-determined limit).
4. Results
4.1. The DLA Sample in Context
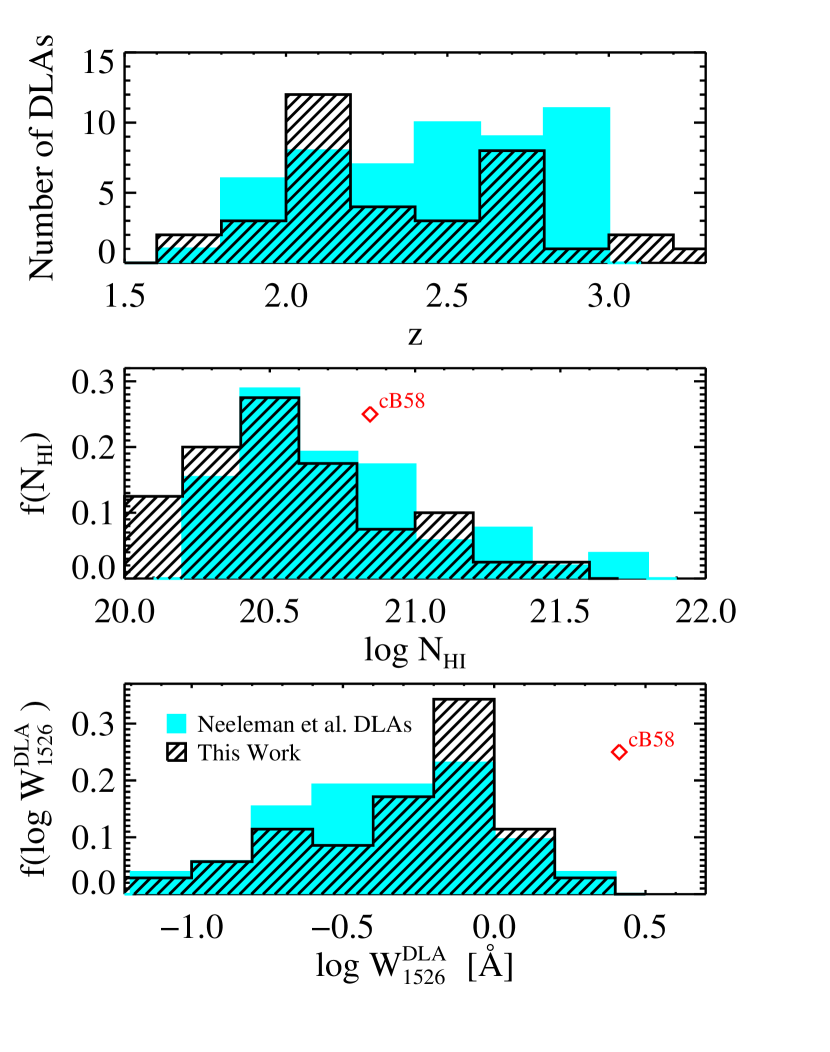
Figure 3 presents the redshift distribution of our DLA sample (top panel), along with the DLA H I column densities (middle) and Si II equivalent widths (; bottom panel). For comparison, we also show these properties for a random sample of DLAs drawn from the literature (Neeleman et al. 2013; cyan histograms) and selected solely on the basis of their . The kinematics and metal abundances of this comparison sample have been carefully analyzed in previous work, providing a rich set of ancillary measurements which will aid in later discussion.
The median of our sample is 2.199, similar to the mean redshift of the sample of LBGs discussed in Rudie et al. (2012) with . Furthermore, both the and distributions of our DLA sample are similar to those in Neeleman et al. (2013), although our distribution extends to slightly lower values due to our liberal DLA selection criterion. The red diamond indicates and measured ‘down the barrel’ in high-resolution spectroscopy of the lensed LBG cB58 (Pettini et al., 2002). The metal-line absorption observed toward the star-forming regions of LBGs have been shown to trace the kinematics of cool gas outflows (e.g., Pettini et al., 2002; Shapley et al., 2003; Steidel et al., 2010), and these outflows may be driving the exceptionally large observed along this unique sightline. On the other hand, Prochaska et al. (2008) and Neeleman et al. (2013) have invoked the tight relationship between DLA metallicity and to suggest that traces the kinematics of a DLA’s host dark matter halo, with larger arising in more massive systems. These issues will be discussed further in Section 5.2.2.
4.2. H I Absorption in DLA Environments
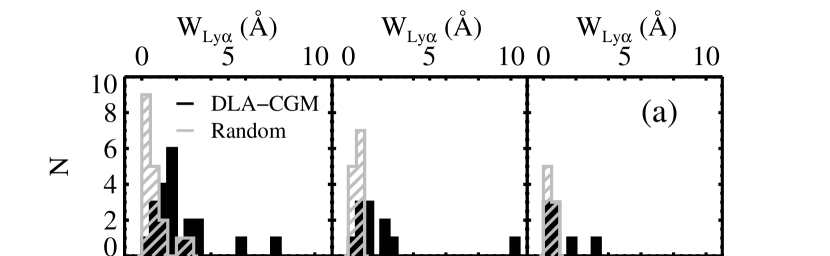
Here we present our measurements of the H I absorption strength as a function of projected distance from DLA-host galaxies. The solid black histograms in Figure 4a show the distribution of in the DLA-CGM, divided into 3 bins according to ( kpc, kpc, etc.). The distribution of in randomly-selected control sightlines, measured as described in §3.1, is shown in gray. The CGM distributions are skewed to higher equivalent widths relative to the control distributions in every bin. A Kolmogorov-Smirnov test indicates a very low probability that the control and CGM distributions are drawn from the same parent population in both the inner ( kpc; ) and middle ( kpc; ) bins. The control and CGM distributions in the outer-most ( kpc) bin, however, are relatively likely to have been drawn from the same parent population (). These probabilities point to a significant enhancement in Ly absorption within kpc and of DLAs.
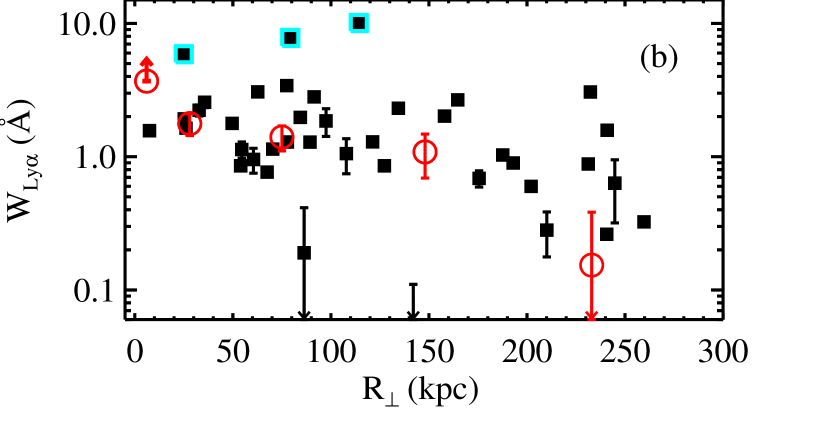
Figure 4b again shows our assessment of in each CGM sightline, now vs. . The three CGM systems exhibiting exceptionally strong H I absorption (with ) are highlighted in cyan, and are discussed in more detail below. Almost every remaining sightline probes absorption stronger than Å to nearly kpc. The two-sided probability that is uncorrelated with indicated by Kendall’s rank correlation test is with , bolstering our finding that Ly absorption is elevated significantly above the level in the ambient IGM close to DLAs. The open red circles show our measurements of as described in §3.2, and are similarly indicative of strong absorption extending to kpc. A Kendall’s rank correlation test of the two-sided probability that is uncorrelated with yields , demonstrating that the apparent decline in with is statistically significant (i.e., we reject a lack of correlation in favor of an anticorrelation with confidence). We also include measured in the coadd of all DLA sightlines at kpc in this panel. The method we use to assess the continuum level in coadded spectra underestimates the true continuum in this case, as the Ly damping wings of DLAs extend well beyond . Our value of therefore provides a lower bound on the average Ly absorption due to the DLAs themselves, and is shown here as a lower limit. When this value is included in the Kendall’s rank correlation test described above, the probability of no correlation decreases to .
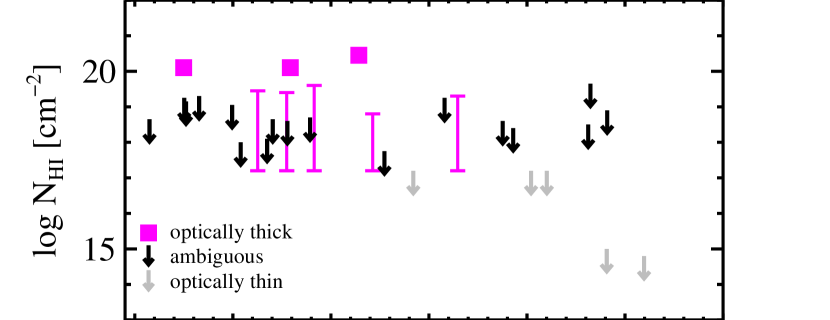
Figure 5 (top) shows our constraints on , with systems having in magenta, with sightlines for which we place an ‘ambiguous’ upper limit on in black, and with optically thin sightlines in gray. Most of the CGM sightlines in our sample do not satisfy our DLA criterion, consistent with previous findings suggesting that DLAs have a covering fraction for kpc (Cooke et al., 2010). However, three of these systems (J1026+0629 at kpc, J1116+4118 at kpc, and J1240+4329 at kpc) have CGM (solid magenta squares). Ellison et al. (2007), reporting on the J1116+4118 system, suggested that this QSO pair probes a relatively overdense environment, and the apparent paucity of such systems in our dataset lends further support to this interpretation. Overall, our measurements and limits are indicative of a incidence of optically thick () H I out to kpc. It is only beyond kpc that we may confidently rule out the presence of optically thick material in a handful of cases.
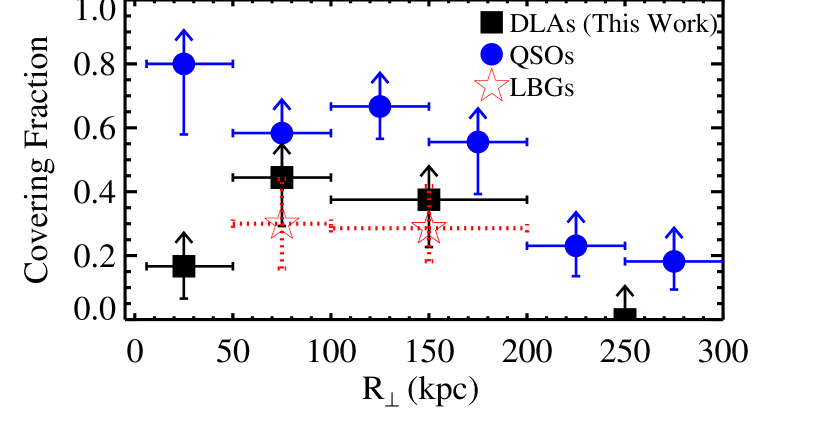
We estimate a lower limit on the covering fraction of material in several bins by dividing the number of bona fide optically thick systems by the total number of sightlines in each bin. These estimates are shown with black squares in Figure 5 (bottom), with the horizontal error bars indicating the bin widths. The vertical error bars show the 68% confidence Wilson score intervals. We measure a covering fraction extending to kpc, with our uncertainty intervals indicating is at least at kpc. The true covering fraction may be significantly higher than these estimates due to the preponderance of sightlines with ‘ambiguous’ absorption; however, the measured incidence is fully consistent with the estimate of the incidence of optically thick H I in the CGM around LBGs from Rudie et al. (2012), shown with red stars. Measurements of in the host halos of massive QSOs, however, are suggestive of a higher in such environments (QPQ5; blue filled circles). Although our limits on cannot formally rule out consistency with these constraints, the incidence of optically thick systems in the present study and in QPQ5 could be brought into agreement only if it was found that our dataset is significantly less complete for optically thick systems than that of QPQ5. Because these datasets are of very similar quality and fidelity, we consider such a discrepancy unlikely.
4.3. Metal-Line Absorption in DLA Environments
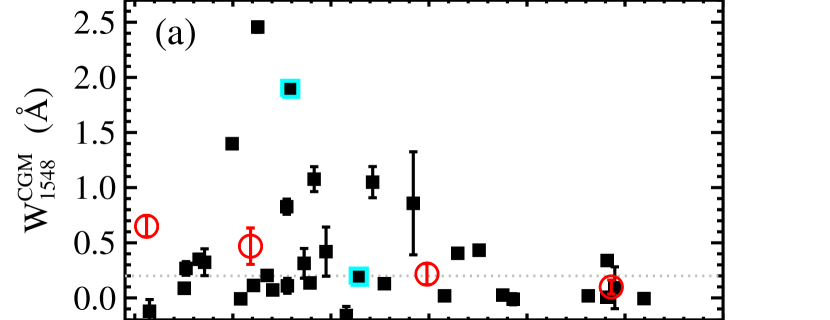
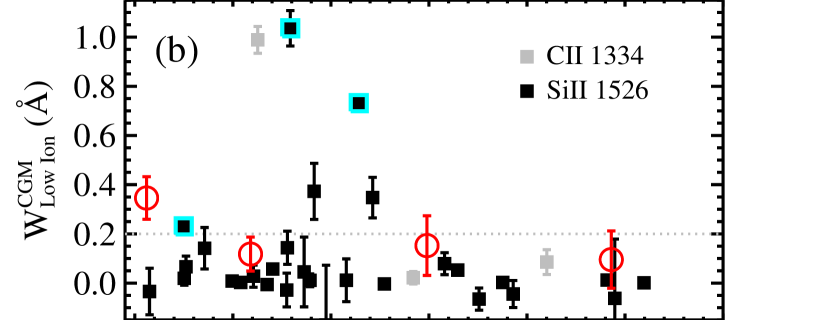
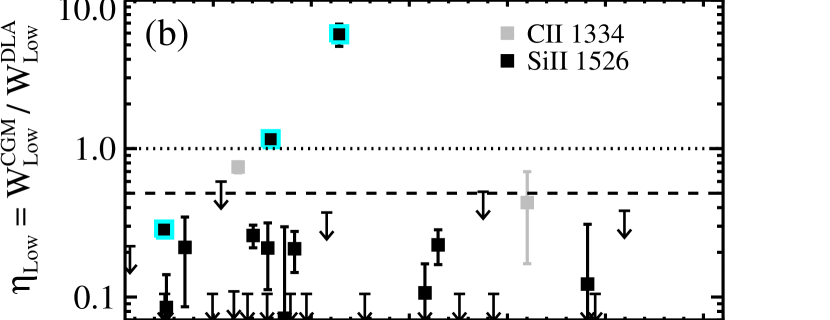
Figure 6a shows our measurement of in each CGM sightline, . For reference, the CGM sightlines having are marked with open cyan squares. We detect very large Å to projected distances as large as 121 kpc. However, within this distance there is significant scatter in , with many sightlines exhibiting only Å. Beyond 150 kpc, we measure as large as Å, but are more likely to find Å (see also Figure 6c). A Kendall’s rank correlation test does not rule out a lack of correlation between and (yielding a two-sided probability ), reflecting the overall large scatter in these values at a given .
The red open circles show measured in the coadded spectra discussed in §3.2, with in the coadded DLA sightlines marked at kpc. The corresponding error bars are determined using our bootstrapping method, and thus reflect both the measurement uncertainty and the scatter in values for each subsample. We find that while appears to decrease with increasing , the trend is a weak one: even the measured in the DLA sightlines is consistent with in the CGM at kpc within the measured scatter, and the measured at differs from the latter by . Kendall’s test for a lack of correlation between and yields a low two-sided probability () only if the value measured in DLA sightlines is included. Without this ‘down-the-barrel’ measurement, the probability is , suggestive of a weak anti-correlation of marginal statistical significance.
Figure 6b shows our measurements of CGM absorption in low-ionization metal lines (): in most cases we plot the equivalent width of Si II 1526 (; black), but we add measurements of the C II 1334 equivalent width (; gray) for CGM sightlines which lack coverage of Si II 1526. These latter values have been multiplied by the ratio of the rest wavelengths of the Si II and C II transitions (i.e., by 1526.7066 Å/1334.5323 Å). The largest values are Å, with 2 of these 3 strong systems arising in “double” DLAs (having ). Otherwise, the vast majority () of the remaining 29 (non-DLA) CGM sightlines yield weak absorption ( Å), including the lensed QSO sightline with kpc. Our measurements of (red open circles) are consistent within the uncertainty intervals across the three CGM subsamples, with in the coadded DLA sightlines exceeding that in the CGM by only . Here, we find no statistically significant anti-correlation between either or and .
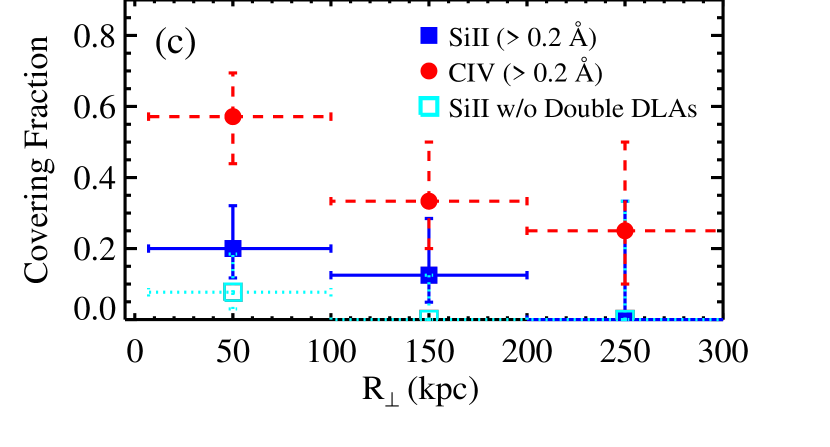
We next compute covering fractions for strong metal-line absorption. We consider a system to be “strong” if the equivalent width measurement satisfies (where is the uncertainty in ) and Å. All systems with securely-detected lines (having ) with below 0.2 Å and all systems having with upper limits on less than 0.2 Å are treated as sightlines without strong absorption. We consider constraints from sightlines with upper limits on larger than 0.2 Å to be ambiguous in this context, and do not include them in covering fraction estimates. As shown in Figure 6c, we detect strong ( Å) C IV absorption in % of our sightlines within 100 kpc of a DLA. Beyond this , we estimate a lower , but find that the measurements in all bins are consistent within their uncertainties. We measure % within 100 kpc, an incidence lower than that measured for C IV, and estimate similarly low values at larger (also consistent with our results for at these distances). The values are slightly lower than, although statistically consistent with, our measurement of a incidence of optically thick H I described in §4.2; this is in spite of our use of the presence of strong low-ionization metal absorption as a criterion for the detection of optically thick material. This slight discrepancy is in part due to two systems (J0201+0032 and J1153+3530) which exhibit clear damping wings but for which we measure weak ( Å) Si II absorption, and in part due to our incomplete spectroscopic coverage of Si II or Ly forest contamination of this transition in a few sightlines. We additionally note that if “double DLA” systems are excluded, the estimated covering fraction of low-ionization material within 100 kpc falls below 10% (, from 1 strong system among 13 total sightlines).
Finally, we find that the Si IV 1393 absorption around DLAs is intermediate in strength between that of C IV and low-ionization absorption. We measure Å in 6 out of 14 sightlines within 100 kpc of DLAs, yielding ; i.e., a value slightly higher than but lower than . At larger impact parameters kpc, we measure only . Similarly, our coadded spectra covering Si IV at kpc exhibit negligible absorption, with the coadd of sightlines within kpc showing a modest Å (Table Dissecting the Gaseous Halos of Damped Ly Systems with Close Quasar Pairs).
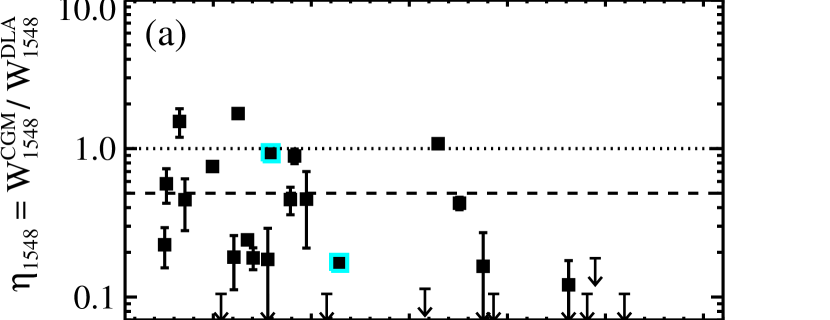
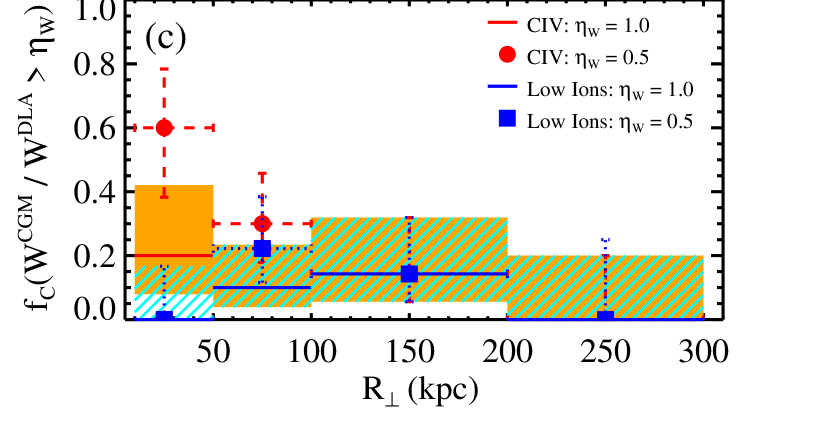
In Figure 7, we compare our measurements of the CGM metal-line absorption strength with the strength of metal absorption measured along the associated DLA sightline, or ‘down the barrel’. Panel (a) shows the ratio of measured in the CGM, , to that measured in the DLA, , as a function of sightline separation. Here we only include systems for which we have unblended coverage of the C IV transition along the DLA sightline: of the 33 systems shown in Figure 6a, 28 meet this criterion. In cases for which the ratio is , a symbol is shown either at the upper limit on the ratio, or at if the upper limit is below the range of the y-axis. Double DLA systems are highlighted with cyan open squares. Particularly within kpc, is frequently at least half as large as . This finding is quantified in panel (c), in which we show the fraction of pairs () exhibiting larger than a fiducial ratio, , calculated by dividing the number of pairs satisfying by the total number of pairs in a given range in . We choose values of (horizontal red bars with confidence intervals in orange) and (filled red circles). Sightlines at kpc have a probability of exhibiting as high as that measured in the associated DLA, and have a probability of exhibiting which is at least half as strong as . The incidence of similarly high ratios decreases at kpc but remains significant (). These results imply that the bulk of the C IV equivalent width observed ‘down the barrel’ along DLA sightlines traces the motions of gas extending well beyond the cold neutral material giving rise to the H I absorption in the systems. This high-ionization absorption may instead be tracing halo gas kinematics dominated by virial motions and/or galactic winds out to distances kpc. This scenario was first suggested by the finding that the velocity structure of unsaturated, low-ionization metal absorption (tracing neutral material) differs significantly from the velocity structure of C IV in DLAs (Wolfe & Prochaska, 2000). However, our measurements offer the first direct constraints on the three-dimensional geometry of this high-ionization absorption.
Figure 7b shows the same ratios for the Si II (black) and C II (gray) transitions. Here, it is unusual for to exceed : if ‘double DLAs’ are excluded, no CGM sightlines exhibit low-ionization equivalent widths greater than those measured toward the associated DLA. Overall, Figure 7c shows that only of sightlines at 50 kpc kpc exhibit . There is, however, a low incidence () of systems having out to kpc. Thus, while Si II absorption in DLAs appears to arise predominantly from gas within kpc of the neutral material, there is a sub-dominant contribution from a gaseous component extending over kpc scales. We discuss this point further in the context of previous results (e.g., Prochaska et al., 2008) in §5.1.

4.4. C IV Absorption Kinematics in DLA Environments
As discussed in the previous subsection, the strong similarity in the values of and , particularly between sightlines separated by kpc, suggests that these quantities are dominated by absorbing gas extending over large distances from the DLA ( kpc). Motivated by the high quality and high spectral resolution of the data available for many of these sightlines, here we perform a more detailed comparison of the properties of these line profiles. Figure 8 shows C IV profiles for the 12 systems with in both the CGM and DLA sightlines. Eight of these pairs were observed at echellette resolution, such that our spectra reveal the detailed velocity structure of the profiles. The separations of these sightlines range from to 176 kpc.
Several points become evident from examination of this figure. First, we remind the reader that the systemic velocity () is determined from the centroid of the low-ionization metal absorption arising in the DLAs. This velocity is often very similar to the velocity centroid of higher-ionization absorption, although we see that the DLA C IV profile is significantly offset from (by a few hundred ) in a handful of cases (most notably for J1026+0629). These offsets notwithstanding, the central velocities, velocity widths, and even the detailed shapes of the DLA and CGM C IV profiles are remarkably similar.
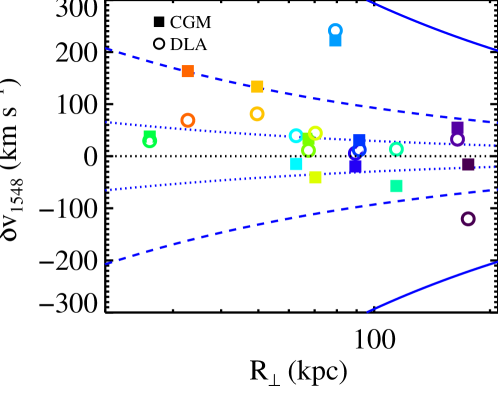
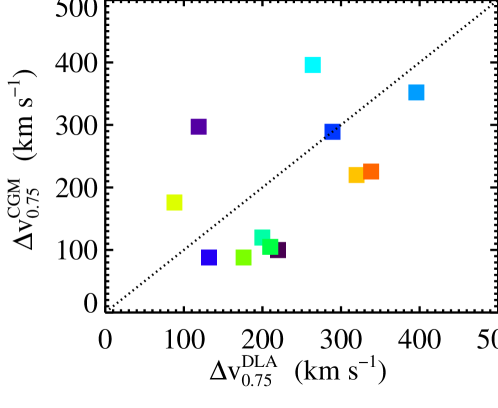
To quantify these similarities, we calculate the flux-weighted wavelength centroid of each profile, , where and are the continuum-normalized flux and wavelength of individual pixels comprising the profile of each system. We show the velocities of these centroids relative to () in Figure 9 (left). Measurements for DLA and CGM sightlines are shown with open circles and filled squares, respectively, and the symbols for each pair are given a unique color to indicate the corresponding profiles in Figure 8. In general, the values of for the sightlines in each pair are close, and where they are offset from they are mostly offset in the same sense. We show the distribution of the offsets between and in the middle panel of Figure 9. These differences are never larger than , even for the pairs with the largest sightline separations (up to kpc), and are for 8 of 12 pairs. We note that a number of these systems have exceeding , such that there is a higher degree of coherence between the C IV absorption covering kpc scales in these systems than that exhibited by low- and high-ionization absorption along the same QSO sightline. Figure 9 (left) also indicates the radial velocity required for escape from the potential well of dark matter halos over a range of masses (), or , with . There are few instances in which the CGM C IV absorption has a central velocity surpassing these values, even for quite low . However, this material may have an additional component to its velocity vector in the plane of the sky to which our measurements are not sensitive. Furthermore, material with kinematics at the extremes of these quite broad profiles may indeed have the energy to escape from halos with , even if motions transverse to the line of sight are neglected.
To quantify the velocity width of these profiles, we identify the set of pixels encompassing of the total profile , defining the central pixel in this set be the pixel whose relative velocity is closest to (i.e., the flux-weighted C IV 1548 velocity centroid measured as described above). From this set of pixels, we locate those closest to the blue and red profile edges, and calculate the velocity difference between them (). We compare our measurements of this quantity for each pair of sightlines in the right-most panel of Figure 9. Although there is a large range in the values (), and differ by more than in only 5 of 12 pairs and are weakly correlated (at a confidence level). Furthermore, is almost always larger than the value , and exceeds the latter by in 6 pairs. As anticipated above, the velocities of the pixels at the blue and red edges of these quite broad line profiles (identified in the process of estimating ) frequently lie outside of the envelop defined by the halo escape velocity if .
These comparisons evoke a scenario in which C IV absorption around DLAs arises from gaseous structures having a large velocity dispersion from structure to structure (yielding large velocity widths), but which extend over many tens of kpc with a high degree of kinematic coherence on these scales. Indeed, such coherence among C IV systems detected along paired QSO sightlines has been noted previously (e.g., Rauch et al., 2001; Martin et al., 2010), but our study is the first to measure this in the vicinity of DLAs. We discuss the implications of these results and their potential to constrain the physical drivers of C IV gas kinematics in §5.3.
5. Discussion
5.1. A ‘Two-Dimensional’ View of DLAs
5.1.1 The Spatial Extent of DLAs
Much of our understanding of DLAs relies heavily on studies of the absorption along single, pencil-beam sightlines piercing neutral gas in the host galaxy along with any more diffuse material associated with the galaxy’s halo in the same beam. However, as noted in §1, studies of DLAs toward lensed QSOs (e.g., Cooke et al., 2010) have recently begun to augment these single-sightline analyses, constraining the spatial extent of damped absorption and the coherence of metal-line kinematics over relatively small scales ( kpc). Ellison et al. (2007) presented the first exploration of the extent of DLAs over the scales of galaxy halos, identifying a absorption system having in spectroscopy of both sightlines toward the binary QSO J1116+4118 (see also Figure 5, top panel).
The present work adds considerable fidelity to this latter, ‘two-dimensional’ approach to the study of DLAs and their environment. First, the measurements shown in Figure 5 offer direct constraints on the spatial extent of the high column density material giving rise to DLAs on scales larger than kpc. Of the 30 CGM sightlines in our sample with sufficient S/N to assess , only three exhibit . Within kpc (the maximum among these double DLA pairs), absorption with is absent from 13 CGM sightlines, most notably from of sightlines having kpc. This is strong confirmation of the conclusion of Cooke et al. (2010) that the physical extent of absorption in a ‘typical’ DLA must be kpc. Taking our measurements at face value, they indicate either (1) that all DLAs have radii kpc, with occurring in overdense environments hosting multiple damped systems; (2) that DLA gas is distributed on scales kpc with a low covering factor; or (3) that of DLAs have physical extents kpc, with all others having much smaller sizes. As we expect these systems to occupy halos having virial radii kpc, the latter scenario would require high-density gas disks to extend over at least of their halo virial diameter (as proposed in, e.g., Maller et al. 2001).
Moreover, we note that the covering fraction of material within kpc of DLAs is . This measurement may be compared with constraints on the DLA cross section offered by the clustering analysis of Font-Ribera et al. (2012) as follows. The expectation value of the DLA covering fraction within kpc measured from a statistical sampling of in dark matter halos with masses ranging down to a minimum mass is
| (1) |
Here, we assume that our experimental setup is sensitive to halos with ; i.e., that all of these halos host a DLA and hence may fall into our ‘primary’ DLA sample. We further assume that
describes the typical incidence of DLAs as a function of halo mass , with equal to the DLA cross section (in ) and equal to the comoving number density of halos with mass in the interval (, ).
If we consider all halos to be isolated such that their DLA cross sections do not overlap on the sky, we can additionally state that the DLA covering fraction measured within kpc for a halo of mass is
Here we are assuming that the full DLA cross section arises within kpc, and that cannot exceed . The value in Equ. 1 is then fully specified given a functional form for and a minimum DLA halo mass .
Motivated by trends in the distribution of neutral material over a range in halo masses exhibited in cosmological hydrodynamical simulations, Font-Ribera et al. (2012) explored two parameterizations of . They first adopted a form
| (2) |
with a constant. Their estimate of the bias factor of DLAs, in combination with the observed DLA incidence rate, place simultaneous constraints on , , and . For instance, they found that with requires . This particular model yields a low value of , consistent with our measurement. On the other hand, a model of the form
| (3) |
with and satisfies the DLA bias and incidence rate with , but yields a much higher . This value likewise falls nearly within the uncertainties in our estimate of . Thus, our current constraints on are in accord with a large neutral gas cross section (with a characteristic length scale kpc) arising in high-mass dark matter halos (). As noted above, however, given the high incidence of non-detections within kpc and in the Cooke et al. (2010) study, this material is most likely distributed with a covering fraction less than unity. Moreover, the factor of variation in between the two models described above suggests that a larger sample of QSO sightlines within kpc of DLAs may eventually aid in breaking the degeneracies in these model parameters, further elucidating the relationship between the morphology of DLA absorption and dark matter halo mass.
5.1.2 The Origin of Low-Ionization Absorption Associated with DLAs
Among CGM sightlines which do not exhibit a second DLA, we detect optically thick H I within kpc with an incidence of . We emphasize that we cannot rule out the presence of optically thick material in any of the CGM sightlines within this projected distance, and that the true incidence of such absorption may be significantly higher. We can, however, place stringent limits on the incidence of low-ionization metal absorption in many of our CGM sightlines. As shown in Figure 6b, we detect strong Si II with Å in only one sightline which does not also probe a DLA (and which has kpc), with measurements of falling well below 0.2 Å in the vast majority of the remaining sightlines. The resulting covering fraction for strong low-ionization absorption in environments outside the high-density neutral material giving rise to DLAs is .
This finding has implications for the interpretation of low-ionization absorption kinematics and equivalent widths measured ‘down the barrel’ toward DLAs themselves. Such low limits at kpc suggest that measurements must be dominated by material within a physical distance kpc. Furthermore, Figure 7 shows that is nearly always of , likewise indicating that the low-ion kinematics are typically driven by gas motions close to the DLA. If the tight correlation between DLA metallicity and (Prochaska et al., 2008; Neeleman et al., 2013) is indeed driven by a galaxy mass–metallicity relation, this suggests that must preferentially trace galaxy dynamics on small scales, analogous to emission-line tracers of H II region kinematics (e.g. Weiner et al., 2006). In contrast to these results, we have found that the kinematics of higher-ionization material (e.g., C IV) must arise predominantly from the motions of gas extending over much larger scales. We discuss the processes which may be most relevant to these motions in §5.3.
5.2. The DLA-CGM and Magnitude-Selected Galaxy Environments
5.2.1 Geometrical Considerations
As one of our primary goals is to understand DLAs in the context of their host dark matter halos and their relation to star formation at high redshift, we wish to draw comparisons between the absorption strength of material in and around DLAs with that around optically-selected galaxies at . Ideally, we would directly compare the CGM absorption strength as a function of projected distance from the centers (or density peaks) of DLA host halos with that of halos of known mass scale. However, because the precise location of DLAs within their surrounding dark matter distribution is not well understood, we must first consider how our experimental design affects our ability to constrain the projected radial absorption profile of the halos selected via our chosen technique.
As noted in §1, in the few cases for which an emission counterpart to a previously-known DLA has been recovered, they are typically located within kpc of the QSO sightline (e.g., Péroux et al., 2011; Krogager et al., 2012), suggestive of a scenario in which DLAs arise close to the peak halo density locus. On the other hand, cosmological ‘zoom-in’ simulations predict that DLAs can trace inflowing streams or cool outflows extending to the host halo virial radius (Fumagalli et al., 2011; Bird et al., 2014b), leaving open the possibility that a significant portion of the DLA cross section is contributed by systems many tens of kpc from the nearest halo center. In this case, the ‘true’ projected distance () from the center of a DLA-selected halo for a given CGM sightline in our sample may likewise be many tens of kpc larger or smaller than the QSO pair sightline separation (). In particular, given a projected distance from the halo center for a DLA, , must fall in the range .
To determine the probability distribution of within this range of values, we consider a circle with radius defined by the vector and centered on the DLA. The DLA is located at , with the origin of the coordinate system defined to be at the halo center. We refer to the angle between the vectors and as . The vector connecting the origin to the CGM sightline, , forms the third side of a triangle with and , and its length may therefore be written .
Under the assumption that there is no preferred direction for , i.e., that has a uniform probability distribution in the range , we draw values at random to estimate the resultant probability distribution for , . We find that is sharply peaked toward both and , meaning that is significantly more likely to have a value close to these extremes than close to . For example, if kpc and kpc, the total probability that kpc or kpc is , whereas the probability that kpc is only . The form of this distribution must be considered when interpreting the results presented in Figures 4, 5, 6, and 7: each sightline shown has a non-negligible probability of probing an offset from the indicated by an amount . If is indeed small ( kpc), this offset will be of the x-axis coverage of these figures. If is instead on the order of kpc, the systematic uncertainty in will span much of the range shown.
In preparation for comparing measured in coadded DLA-CGM sightlines to that measured around magnitude-selected samples, we also wish to calculate the probability of a sightline at falling within a projected distance . Here, we consider the intersection of two circles: (1) one of radius and centered at the origin (i.e., the halo center), and (2) one of radius and centered at . The probability that a sightline at falls within is then simply the fraction of the circumference of circle (2) which falls within circle (1). This probability can be written:
Here, is the length of the chord defined by the intersection points of the two circles. When comparing DLA-CGM absorption measurements against those measured around magnitude-selected samples to a given , higher values of indicate higher probabilities that our DLA-CGM measurements with actually fall within this , and hence that we are more likely to be comparing physically analogous regions.
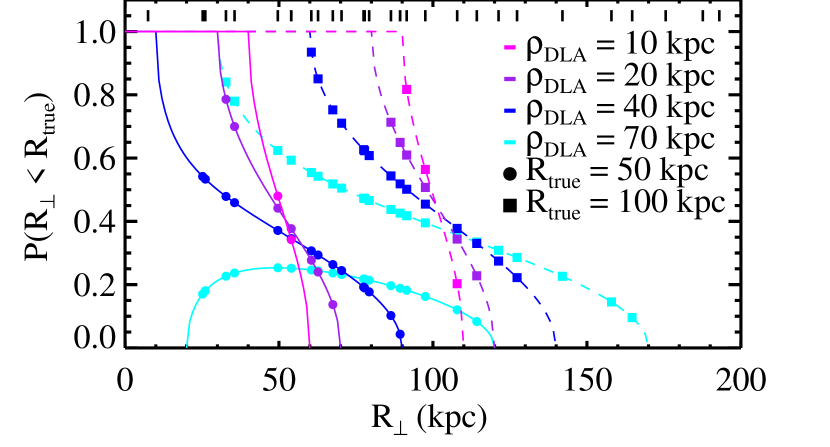
We show the distribution of expected for our sample adopting representative values of and in Figure 10. The set of values for the QSO pairs with coverage of C IV in the CGM sightline is shown with black vertical hashes toward the top of the figure. The colored curves show the probability as a function of for values of kpc (solid) and kpc (dashed), with different colors corresponding to different values of as indicated in the legend. The points show the value of corresponding to each sample sightline (although values of are not plotted).
This figure demonstrates that for kpc, most sightlines having kpc or kpc have a high probability of lying within kpc or kpc, respectively. For kpc, only 4 of 18 sightlines within kpc have , and in 3 of these 4 cases . Moreover, there are only two sightlines at kpc with a non-zero , and these probability values are low (). Therefore, in coadded spectra of all CGM sightlines having kpc, 4 of the sightlines will have a probability of lying at kpc. Under the assumption that the CGM absorption strength declines with , the presumably weaker absorption in these few sightlines will tend to dilute the absorption signal measured in the coadded spectrum. At the same time, a coadded spectrum of sightlines with kpc may include a few sightlines with kpc: specifically, two sightlines with kpc have a probability of having kpc. These sightlines therefore may tend to enhance the absorption signal measured at larger impact parameters.
These effects become more pronounced for larger values of . For instance, the average value of for all sightlines with kpc is 0.97 for kpc, 0.92 for kpc, 0.78 for kpc, and 0.61 for kpc. Similarly, the likelihood of spurious enhancement of the absorption signal at large increases with : the average value of for all sightlines having kpc is 0.04 for kpc and 0.12 for kpc.
In more qualitative terms, our uncertainty in the value of for our sample sightlines can be considered an additional source of systematic uncertainty in our assessment of the average CGM absorption strength as a function of projected distance from the centers of DLA host halos. Under the assumption that this absorption declines in strength with , we expect that the primary repercussion of this uncertainty is a ‘dilution’ or underestimation of the CGM absorption signal at small impact parameters. The foregoing analysis suggests that the enhancement of CGM absorption at large due to the inclusion of sightlines at small occurs with a relatively low probability. Because is not well constrained and may span a wide range of values, we do not attempt to correct for these effects here. However, they will be considered as we proceed with our comparison to previous results on the CGM absorption strength around optically-selected samples.
5.2.2 Comparison with the CGM around Bright Galaxies and QSOs
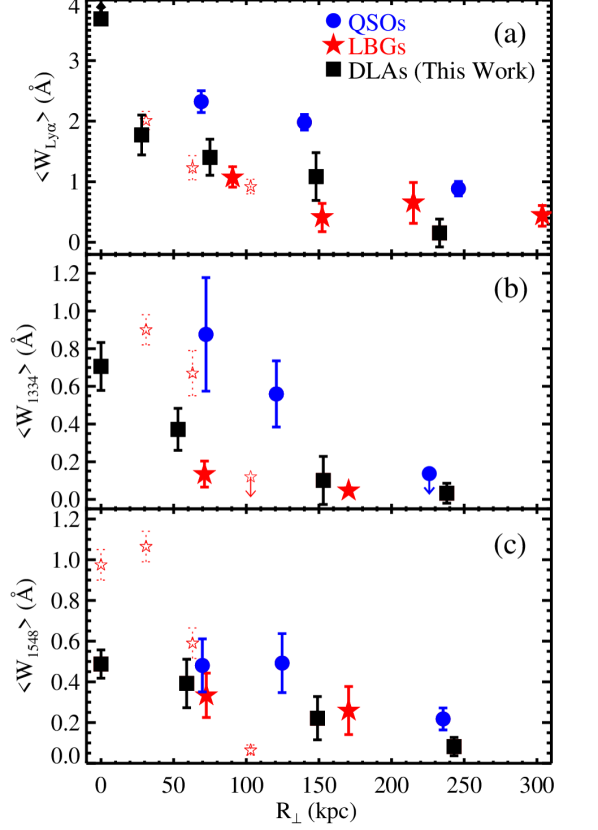
Figure 11 shows (a), (b), and (c) measured from the coadded spectra in Figure 2 (black squares). Symbols at kpc show equivalent widths measured in the coadded spectra of DLA sightlines. The absorption strength of CGM material around QSO host galaxies measured using a similar dataset is shown with filled blue circles (QPQ5). The CGM absorption strength around LBGs measured along coadded background galaxy sightlines is shown with red open stars (Steidel et al., 2010), and measurements of the LBG-CGM absorption strength toward background QSOs assembled from the literature (Adelberger et al., 2005; Simcoe et al., 2006; Rakic et al., 2011; Rudie et al., 2012; Crighton et al., 2014) are plotted with red filled stars.
First, regarding average equivalent widths measured along DLA sightlines, we find that they are significantly lower than equivalent widths measured down the barrel in coadded spectra of LBGs. In particular, Steidel et al. (2010) measure Å and Å, values more than twice as large as and (Figure 11; Table Dissecting the Gaseous Halos of Damped Ly Systems with Close Quasar Pairs). The relatively low absorption strength in DLAs suggests that their low-ion absorption profiles are tracing material with less extreme kinematics on average. This may be a consequence of DLAs having lower host halo masses, particularly given the established correlation between and metallicity. However, Steidel et al. (2010) argued that the large LBG C II equivalent widths are due to large-scale outflows driven by star formation in the galaxies based on the overall blueshift of the transition (by ). The low may therefore instead indicate either that DLA host galaxies drive less extreme outflows, or that these outflows are not traced by the low-ion absorption because, e.g., the DLAs are not co-spatial with galactic star formation (Fumagalli et al., 2014b).
Turning to the CGM, we find that the equivalent widths of CGM absorption around DLAs and LBGs are consistent within the measurement errors. With the exception of the measurement at kpc, which falls between the Steidel et al. (2010) value of at kpc and the independent LBG-CGM measurement toward background QSOs at kpc, every DLA-CGM reported is within of the neighboring LBG-CGM values. This suggests that on average, both LBGs and DLAs are surrounded by similar gaseous environments, in spite of any differences in the distribution of halo masses and/or star formation histories among the two populations. We additionally note that the cosmological ‘zoom-in’ simulations of Faucher-Giguere et al. (2014) predict this overall similarity, under the assumption that DLAs do indeed occupy smaller halos than bright LBGs. In particular, they report that the covering fraction of optically thick H I within kpc remains approximately constant over a range in halo mass . They do not report of Ly or metal-line absorption in the simulated CGM; however, we expect comparisons with more detailed predictions from such work to yield useful constraints on the physics adopted by the simulations.
Moreover, the significant decline in both and with measured in our DLA-CGM sightlines is similar to the trend exhibited in nearly all studies of CGM absorption centered around magnitude-selected systems. This finding conflicts with a picture in which DLAs are dominated by absorption on the outskirts ( kpc) of the halos hosting bright LBGs, and instead suggests that DLAs tend to arise close to the centers of their halos. Moreover, as discussed in §5.2.1, if there is indeed a small offset between the DLA locations and their halo centers, the CGM absorption signal at a given will likely be underestimated. This suggests that the consistency between DLA-CGM and LBG-CGM absorption measurements cannot be due to spurious sampling of regions with small , and is robust to the systematic scatter introduced by our experimental design.
In contrast to the LBG-CGM, the CGM around QSOs yields marginally stronger low-ionization absorption than that around DLAs. The QSO-CGM values are higher than the measured DLA-CGM absorption at comparable within 200 kpc. The QSO-CGM is likewise stronger than our measurements of at kpc from DLAs. The general finding that the CGM around QSOs gives rise to the strongest absorption in low-ionization transitions (i.e., Ly, C II) of any galaxy environment probed to date was discussed in detail in QPQ7, and the absorption in DLA environments assessed here offers no exception. Indeed, it is noted in QPQ7 that QSO host halos exhibit the strongest low-ionization CGM both at a given and at a given (with the fiducial QSO host halo virial radius kpc). Furthermore, it was argued that this strong, cool gas absorption must result primarily from the relatively high masses of the halos hosting QSOs (White et al., 2012).
However, the QSO-CGM and DLA-CGM values are discrepant only at kpc, and are very close within 100 kpc. Indeed, if we rescale the QSO-CGM measurements to account for the larger virial radii of the host halos (and assume kpc), we find that the blue, red, and black points in Figure 11c lie nearly on top of each other. This similarity is particularly noteworthy given it has been explicitly demonstrated that DLAs are very rarely detected within 200 kpc of QSOs (QPQ6). Considering this concordance of the CGM C IV absorption in the context of host halo mass, we must conclude either that the absorption strength of this higher-ionization material has a weak mass dependence (if any), or that DLAs and QSOs occupy halos which give rise to similar C IV kinematic widths, e.g., because DLA- and QSO-hosts in fact have similar virial masses.
Our finding that C IV-absorbing material is distributed over large scales (§4.4) and is therefore likely tracing virial halo motions tends to support the latter scenario over the former. Furthermore, the large cross-correlation amplitude measured in a clustering analysis of strong C IV systems and QSO host galaxies (QPQ7) implies that these C IV absorbers do indeed occupy the same dark matter overdensities as bright QSOs, and additionally provides strong evidence against a scenario in which C IV is insensitive to halo mass. On the other hand, it is difficult to reconcile the idea of a close association between QSOs and DLAs and the relative weakness of low-ionization absorption in the DLA-CGM.
These tensions notwithstanding, the comparisons described above offer new insight into the origin of metals extending many tens to hundreds of kpc from galaxies at . Metal absorption in LBG environments has been attributed in the literature to powerful, metal-rich gas outflows driven to kpc distances by strong star formation activity in the central galaxy (Steidel et al., 2010). Bright LBGs, with typical SFRs (e.g., Erb et al., 2006b), do indeed exhibit strong outflows when observed ‘down the barrel’, with metal-line absorption extending blueward of systemic velocity by up to (Steidel et al., 2010). However, the spatial extent and ultimate fate of this high-velocity material has remained unconstrained: to give rise to the observed blueshifted absorption, it need only cover the young stars in the LBGs extending over scales of a few kpc (Rubin et al., 2014).
Adding a new layer to this picture, the present study has revealed a strong similarily between the CGM metal absorption strength around both LBGs and DLAs; that is, in the environments surrounding galaxies with SFRs which differ by at least an order of magnitude. In particular, Fumagalli et al. (2014c) place a limit on the in-situ SFR of typical DLAs within kpc of the QSO sightlines of , and further determine that only a small minority of DLAs () have SFRs within kpc. We consider it implausible that systems with such low SFRs could give rise to powerful gas outflows similar to those attributed to bright LBGs, and yet the material in their surroundings exhibits very similar C II and C IV absorption strengths. This suggests an alternative origin for the metals in both the LBG- and DLA-CGM. Of course, some fraction of the DLA population is certainly in the vicinity of LBGs, allowing the possibility that the DLA-CGM is on occasion enriched by LBG winds. The probability of such enrichment may be estimated by invoking the cross-correlation function between DLAs and LBGs measured in Cooke et al. (2006) and the LBG luminosity function of Reddy et al. (2008). We find that a spherical volume extending 100 proper kpc from a DLA at has only a probability of containing a bright () LBG. The vast majority of DLAs, therefore, appear to lie well beyond a plausible enrichment ‘radius’ from ongoing, LBG-driven galactic outflows. Alternative enrichment mechanisms for LBG and DLA environments could include tidal stripping or the accretion of gas which has been enriched and expelled from dwarf galaxies at an earlier epoch (Shen et al., 2012). We discuss these scenarios in more detail along with additional supporting evidence in the next subsection.
5.3. The CIV Halos of DLAs
In §4.3, we emphasized the high covering fraction of strong C IV around DLAs: for kpc. We showed that the C IV equivalent widths along the CGM sightlines frequently exceed half that measured along the corresponding DLA sightline. These properties imply a ubiquitous, highly ionized, and enriched medium tracing the environments surrounding DLAs. Investigating further, in §4.4 we demonstrated a high degree of kinematic coherence between the C IV absorption along each pair of sightlines. This coherence is exemplified by the small offsets in the flux-weighted velocity centroids of these profiles, which are for 8 of 12 pairs and never exceed over projected distances as large as kpc. Finally, inspired by the similarity between the LBG- and DLA-CGM absorption discussed in §5.2.2, we note that Turner et al. (2014) detected enhanced C IV absorption out to 2 Mpc from their LBG sample. While this absorption is weak (0.01 Å 0.1 Å at Mpc), this finding nevertheless suggests that the C IV absorption around DLAs may in fact extend to much larger scales than are probed in this study.
Together, these results offer unique constraints on the formation and evolution of C IV ‘halos’. On the one hand, the high incidence of C IV requires wide-spread enrichment in the highly ionized gas phase. Previous works have invoked strong galactic winds to enrich halo gas and drive the material to large scales (e.g., Aguirre et al., 2001; Oppenheimer & Davé, 2006). Some have further argued that the C IV observed along sightlines probing DLAs directly traces the wind (Fox et al., 2007a). However, such a scenario lies in apparent conflict with the kinematics of the C IV-absorbing gas associated with DLAs. First, the coherence in kinematics between sightlines of a given pair implies modest motions within the C IV-absorbing medium. Wind speeds exceeding are likely ruled out by the observations, unless one invokes a fine-tuned geometry to minimize velocity differences at kpc separations. Second, the C IV absorption appears to be dominated by gas extending over large distances. The large covering fraction of Å absorption evident in Figure 6c, along with the frequency with which (Figure 7c), imply that the properties are largely determined by gas at kpc. Such a geometry in turn implies a limited contribution from galactic wind kinematics, which we expect to dominate on smaller scales (i.e., close to the star-forming regions). Considering these points together, we regard a wind-dominated scenario to be implausible and encourage comparison of these observations to models of galaxy formation which invoke high mass-loading factors in lower mass galaxies (e.g., Vogelsberger et al. 2013, 2014, Crain et al. 2014, in prep).
In lieu of winds, what may the C IV gas be tracing? Reviewing the properties, one requires a medium that was previously enriched, that is distributed over scales of kpc, and has relatively quiescient kinematics. Perhaps the simplest picture to invoke is a highly-ionized medium that pervades the dark matter halos hosting DLAs and in many cases extends beyond the virial radii of these halos. One may envision a filamentary structure of diffuse, enriched gas that expresses C IV and has kinematics dominated by gravitational motions, similar to the scenario first proposed by Rauch et al. (1997). The early enrichment of filamentary infalling material may also explain the high metallicities of weak () Mg II absorbers at high redshifts (; Matejek et al. 2013). Rauch et al. (1997) additionally showed that such structures can naturally give rise to a broad range in C IV velocity widths, depending on their geometry and the orientation of the line of sight. We do note at least one potential conflict with this simple scenario. Observations along DLA sightlines have shown that the kinematics of the C IV gas are more complex than those traced by the low-ion gas. In the cases of DLAs exhibiting both very broad low and high-ion absorption, one may need to invoke additional motions on small scales (e.g. winds) to account for the measurements. The potential impact of winds on the DLA C IV absorption in such cases could in principle be tested by comparing the coherence of the C IV between paired sightlines with the same measurement in less extreme systems.
Irrespective of the origin of the C IV gas surrounding DLAs, we may leverage the high covering fraction to provide a constraint on the minimum mass of halos hosting DLAs, as follows. We adopt two assumptions motivated by our observations and current theories on neutral gas in high- galaxies: (1) we assume that all halos above a minimum mass contain sufficient H I gas to satisfy our DLA criterion ( ); and (2) we assume every halo hosting DLAs exhibits extended, strong C IV absorption with covering fraction as observed in this study. Under these assumptions, we may calculate the incidence of strong C IV absorption as a function of :
| (4) |
where is the extent of the C IV gas, is the covering fraction for , and where is the comoving number density of halos with .
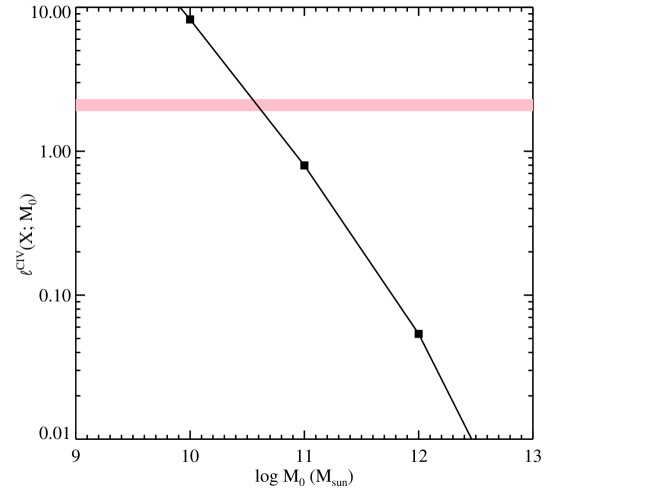
Figure 12 presents assuming a CDM cosmology at with and kpc. The pink band overplotted on the figure shows the incidence of strong ( Å) C IV systems at along random quasar sightlines (QPQ7). We find that exceeds the random value for . This constraint is conservative in the sense that strong C IV absorption may also occur in astrophysical sightlines located far from DLAs. However, our assumption that DLAs occupy all halos with masses may not hold in practice, and relaxing this assumption would indeed allow for a contribution to the DLA population from halos with .
The high incidence of strong C IV absorption and the large scales over which it is distributed point to a substantial reservoir of metals in the diffuse material surrounding DLAs at . We may roughly estimate the total mass in carbon in this CGM reservoir as follows:
where and is the mass of the carbon atom. Here we conservatively set , as Fox et al. (2007b) demonstrated this to be the maximum possible ionization fraction in models assuming either photo- or collisional ionization. Adopting a typical column density of for C IV in DLAs (Fox et al., 2007a), with and kpc as above, we find .
We compare this value to an estimate of the total mass in carbon in the stars and neutral ISM of DLAs themselves. We first assume that DLAs occupy dark matter halos having masses (only slightly lower in mass than the halos hosting LBGs; e.g., Rakic et al. 2013). Such halos host galaxies having stellar masses at (Moster et al., 2013), and which are likely to have high ISM gas fractions (Tacconi et al., 2013). The total baryonic mass of these systems is then , and the total mass in carbon is
If we assume a typical DLA metallicity of (Neeleman et al., 2013) and adopt a value for the solar abundance of carbon (Asplund et al., 2009), we find , an order of magnitude lower than . DLAs in less massive halos will likely have yet lower metallicities, and hence may be deficient in carbon relative to the solar abundance pattern (Cooke et al., 2011). We expect that the discrepancy between the carbon mass in the stars and ISM of such systems and the mass of carbon in their CGM will therefore be even more extreme.
The preceding estimates are crude, and suffer from uncertainties comparable to the differential between the two values obtained. However, the exercise illustrates that diffuse CGM material must make up an important fraction of the universal metal budget as early as 10 Gyr ago (see also Lehner et al. 2014), and may contain more metals than the stellar material and star-forming regions it surrounds. This widespread distribution of metals, in combination with the apparent quiescence of the C IV kinematics, point to efficient enrichment processes occurring at much earlier times; e.g., powerful stellar feedback with high mass-loading factors from galaxies at . We await deep, rest-frame UV spectroscopy of star-forming systems at , aided by gravitational lensing (Bayliss et al., 2013) or with next-generation 30m-class telescopes, to confirm this picture.
6. Conclusions
With the goal of understanding the relationship between reservoirs of neutral hydrogen and star formation at early times, we have searched spectroscopy of paired QSO sightlines with projected separations kpc for instances of damped Ly absorption in the foreground. We use the second QSO sightline in each pair to characterize the Ly and metal-line absorption as a function of around 40 such systems. Our primary findings are as follows:
-
•
Damped absorption rarely extends over scales kpc: the measured incidence of paired sightlines both exhibiting DLAs within kpc is . This incidence, although low, is consistent with a model in which the cross section of DLAs increases with halo mass and extends over in halos with (Font-Ribera et al., 2012).
-
•
We place a lower limit on the incidence of optically thick H I absorption within 200 kpc of DLAs of . However, strong absorption from low-ionization metal transitions is rare in these environments, such that the covering fraction of Å absorption is within kpc. These measurements suggest that the low-ionization metal absorption observed toward DLAs themselves is dominated by material within kpc of the DLA, rather than by an extended gaseous halo.
-
•
We measure a high incidence () of strong C IV absorption ( Å) within 100 kpc of DLAs, with the absorption strength in the CGM frequently at least half that in the nearby DLA. This absorption exhibits a high degree of kinematic coherence on scales of kpc, with flux-weighted velocity centroids in the sightline pairs falling within in all cases. These profiles must be dominated by the motions of material at large physical separations from the DLAs; i.e., at kpc. Under the assumption that all dark matter halos with masses above host DLAs, the ubiquity of C IV absorption in DLA environments requires that .
-
•
The equivalent width of Ly absorption in the DLA-CGM is anticorrelated with at confidence. This finding suggests that DLAs cannot predominantly arise near the outskirts of bright LBG host halos, and instead are likely located close to their halo centers.
-
•
The average Ly and metal absorption strength in the environments extending to kpc from DLAs is of similar strength to that exhibited by the CGM around LBGs. This implies either (1) that the DLA population is dominated by systems hosted by halos similar in mass to those hosting LBGs (), or (2) CGM absorption at does not change with halo mass over the range .
-
•
The close conformity between the DLA- and LBG-CGM, in combination with recently-reported limits on the SFRs of DLA hosts (Fumagalli et al., 2014c), suggest that the distribution of metals in the outer regions of DLA- and LBG-host halos occurs via the dynamical accretion of previously-enriched material rather than via ongoing cool gas outflows.
The foregoing discussion reports our initial efforts to constrain the properties of the diffuse DLA-CGM and the physical processes relevant to its origin. Future directions will include analysis of detailed metal abundances and kinematics in our echellette-quality spectroscopy for constraints on the degree of CGM metal enrichment relative to that of DLA material. Direct comparisons of these results with the metal abundances and kinematics of CGM material around DLAs in cosmological ‘zoom-in’ simulations (e.g., Shen et al., 2012; Faucher-Giguere et al., 2014) and simulations of large cosmological volumes (e.g., Bird et al., 2014b; Vogelsberger et al., 2014) will inform future interpretation and provide crucial leverage on feedback prescriptions. In combination with future efforts to characterize the emission from DLA hosts to deeper limits than have yet been achieved (e.g., Fumagalli et al., 2014c), these experiments will ultimately link the early reservoirs of neutral material with the formation of luminous structures on every mass scale.
References
- Abazajian et al. (2009) Abazajian, K. N., et al. 2009, ApJS, 182, 543
- Adelberger et al. (2005) Adelberger, K. L., Shapley, A. E., Steidel, C. C., Pettini, M., Erb, D. K., & Reddy, N. A. 2005, ApJ, 629, 636
- Adelberger et al. (2004) Adelberger, K. L., Steidel, C. C., Shapley, A. E., Hunt, M. P., Erb, D. K., Reddy, N. A., & Pettini, M. 2004, ApJ, 607, 226
- Aguirre et al. (2001) Aguirre, A., Hernquist, L., Schaye, J., Weinberg, D. H., Katz, N., & Gardner, J. 2001, ApJ, 560, 599
- Ahn et al. (2012) Ahn, C. P., et al. 2012, ApJS, 203, 21
- Asplund et al. (2009) Asplund, M., Grevesse, N., Sauval, A. J., & Scott, P. 2009, ARA&A, 47, 481
- Bayliss et al. (2013) Bayliss, M. B., Rigby, J. R., Sharon, K., Wuyts, E., Florian, M., Gladders, M. D., Johnson, T., & Oguri, M. 2013, ArXiv e-prints
- Bird et al. (2014a) Bird, S., Haehnelt, M., Neeleman, M., Genel, S., Vogelsberger, M., & Hernquist, L. 2014a, ArXiv e-prints
- Bird et al. (2014b) Bird, S., Vogelsberger, M., Haehnelt, M., Sijacki, D., Genel, S., Torrey, P., Springel, V., & Hernquist, L. 2014b, ArXiv e-prints
- Bouché et al. (2012) Bouché, N., Hohensee, W., Vargas, R., Kacprzak, G. G., Martin, C. L., Cooke, J., & Churchill, C. W. 2012, MNRAS, 3207
- Bovy et al. (2011) Bovy, J., et al. 2011, ApJ, 729, 141
- Bovy et al. (2012) —. 2012, ApJ, 749, 41
- Cen (2012) Cen, R. 2012, ApJ, 748, 121
- Churchill et al. (2013) Churchill, C. W., Trujillo-Gomez, S., Nielsen, N. M., & Kacprzak, G. G. 2013, ApJ, 779, 87
- Conroy et al. (2008) Conroy, C., Shapley, A. E., Tinker, J. L., Santos, M. R., & Lemson, G. 2008, ApJ, 679, 1192
- Cooke et al. (2006) Cooke, J., Wolfe, A. M., Gawiser, E., & Prochaska, J. X. 2006, ApJ, 652, 994
- Cooke et al. (2010) Cooke, R., Pettini, M., Steidel, C. C., King, L. J., Rudie, G. C., & Rakic, O. 2010, MNRAS, 409, 679
- Cooke et al. (2011) Cooke, R., Pettini, M., Steidel, C. C., Rudie, G. C., & Nissen, P. E. 2011, MNRAS, 417, 1534
- Crighton et al. (2013) Crighton, N. H. M., Hennawi, J. F., & Prochaska, J. X. 2013, ApJ, 776, L18
- Crighton et al. (2014) Crighton, N. H. M., Hennawi, J. F., Simcoe, R. A., Cooksey, K. L., Murphy, M. T., Fumagalli, M., Prochaska, J. X., & Shanks, T. 2014, ArXiv e-prints
- Ellison et al. (2007) Ellison, S. L., Hennawi, J. F., Martin, C. L., & Sommer-Larsen, J. 2007, MNRAS, 378, 801
- Erb et al. (2006a) Erb, D. K., Shapley, A. E., Pettini, M., Steidel, C. C., Reddy, N. A., & Adelberger, K. L. 2006a, ApJ, 644, 813
- Erb et al. (2006b) Erb, D. K., Steidel, C. C., Shapley, A. E., Pettini, M., Reddy, N. A., & Adelberger, K. L. 2006b, ApJ, 647, 128
- Faucher-Giguere et al. (2014) Faucher-Giguere, C.-A., Hopkins, P. F., Keres, D., Muratov, A. L., Quataert, E., & Murray, N. 2014, ArXiv e-prints
- Font-Ribera et al. (2013) Font-Ribera, A., et al. 2013, J. Cosmology Astropart. Phys, 5, 18
- Font-Ribera et al. (2012) —. 2012, J. Cosmology Astropart. Phys, 11, 59
- Fox et al. (2007a) Fox, A. J., Ledoux, C., Petitjean, P., & Srianand, R. 2007a, A&A, 473, 791
- Fox et al. (2007b) Fox, A. J., Petitjean, P., Ledoux, C., & Srianand, R. 2007b, A&A, 465, 171
- Fumagalli et al. (2014a) Fumagalli, M., Hennawi, J. F., Prochaska, J. X., Kasen, D., Dekel, A., Ceverino, D., & Primack, J. 2014a, ApJ, 780, 74
- Fumagalli et al. (2014b) Fumagalli, M., O’Meara, J. M., Prochaska, J. X., Kanekar, N., & Wolfe, A. M. 2014b, ArXiv e-prints
- Fumagalli et al. (2014c) Fumagalli, M., O’Meara, J. M., Prochaska, J. X., Rafelski, M., & Kanekar, N. 2014c, ArXiv e-prints
- Fumagalli et al. (2013) Fumagalli, M., O’Meara, J. M., Prochaska, J. X., & Worseck, G. 2013, ApJ, 775, 78
- Fumagalli et al. (2011) Fumagalli, M., Prochaska, J. X., Kasen, D., Dekel, A., Ceverino, D., & Primack, J. R. 2011, MNRAS, 418, 1796
- Fynbo et al. (2013) Fynbo, J. P. U., et al. 2013, MNRAS, 436, 361
- Fynbo et al. (2010) —. 2010, MNRAS, 408, 2128
- Haehnelt et al. (1998) Haehnelt, M. G., Steinmetz, M., & Rauch, M. 1998, ApJ, 495, 647
- Heckman et al. (1990) Heckman, T. M., Armus, L., & Miley, G. K. 1990, ApJS, 74, 833
- Hennawi et al. (2010) Hennawi, J. F., et al. 2010, ApJ, 719, 1672
- Hennawi & Prochaska (2007) Hennawi, J. F., & Prochaska, J. X. 2007, ApJ, 655, 735
- Hennawi & Prochaska (2013) —. 2013, ApJ, 766, 58
- Hennawi et al. (2006a) Hennawi, J. F., et al. 2006a, ApJ, 651, 61
- Hennawi et al. (2006b) —. 2006b, ApJ, 651, 61
- Hopkins & Beacom (2006) Hopkins, A. M., & Beacom, J. F. 2006, ApJ, 651, 142
- Inada et al. (2006) Inada, N., et al. 2006, ApJ, 653, L97
- Jorgenson & Wolfe (2014) Jorgenson, R. A., & Wolfe, A. M. 2014, ApJ, 785, 16
- Krogager et al. (2012) Krogager, J.-K., Fynbo, J. P. U., Møller, P., Ledoux, C., Noterdaeme, P., Christensen, L., Milvang-Jensen, B., & Sparre, M. 2012, ArXiv e-prints
- Lehner et al. (2014) Lehner, N., O’Meara, J. M., Fox, A. J., Howk, J. C., Prochaska, J. X., Burns, V., & Armstrong, A. A. 2014, ApJ, 788, 119
- Lopez et al. (2005) Lopez, S., Reimers, D., Gregg, M. D., Wisotzki, L., Wucknitz, O., & Guzman, A. 2005, ApJ, 626, 767
- Maller et al. (2001) Maller, A. H., Prochaska, J. X., Somerville, R. S., & Primack, J. R. 2001, MNRAS, 326, 1475
- Marshall et al. (2008) Marshall, J. L., et al. 2008, in Society of Photo-Optical Instrumentation Engineers (SPIE) Conference Series, Vol. 7014, Society of Photo-Optical Instrumentation Engineers (SPIE) Conference Series
- Martin et al. (2010) Martin, C. L., Scannapieco, E., Ellison, S. L., Hennawi, J. F., Djorgovski, S. G., & Fournier, A. P. 2010, ApJ, 721, 174
- Matejek et al. (2013) Matejek, M. S., Simcoe, R. A., Cooksey, K. L., & Seyffert, E. N. 2013, ApJ, 764, 9
- Möller et al. (2004) Möller, P., Fynbo, J. P. U., & Fall, S. M. 2004, A&A, 422, L33
- Møller et al. (2013) Møller, P., Fynbo, J. P. U., Ledoux, C., & Nilsson, K. K. 2013, MNRAS, 430, 2680
- Monier et al. (2009) Monier, E. M., Turnshek, D. A., & Rao, S. 2009, MNRAS, 397, 943
- Moster et al. (2013) Moster, B. P., Naab, T., & White, S. D. M. 2013, MNRAS, 428, 3121
- Nagamine et al. (2004) Nagamine, K., Springel, V., & Hernquist, L. 2004, MNRAS, 348, 421
- Neeleman et al. (2013) Neeleman, M., Wolfe, A. M., Prochaska, J. X., & Rafelski, M. 2013, ApJ, 769, 54
- Oguri et al. (2013) Oguri, M., et al. 2013, MNRAS, 429, 482
- Oppenheimer & Davé (2006) Oppenheimer, B. D., & Davé, R. 2006, MNRAS, 373, 1265
- Péroux et al. (2011) Péroux, C., Bouché, N., Kulkarni, V. P., York, D. G., & Vladilo, G. 2011, MNRAS, 410, 2237
- Pettini et al. (2002) Pettini, M., Rix, S. A., Steidel, C. C., Adelberger, K. L., Hunt, M. P., & Shapley, A. E. 2002, ApJ, 569, 742
- Pontzen et al. (2008) Pontzen, A., et al. 2008, MNRAS, 390, 1349
- Prochaska et al. (2008) Prochaska, J. X., Chen, H.-W., Wolfe, A. M., Dessauges-Zavadsky, M., & Bloom, J. S. 2008, ApJ, 672, 59
- Prochaska et al. (2003) Prochaska, J. X., Gawiser, E., Wolfe, A. M., Cooke, J., & Gelino, D. 2003, ApJS, 147, 227
- Prochaska et al. (2013a) Prochaska, J. X., et al. 2013a, ApJ, 776, 136
- Prochaska et al. (2013b) Prochaska, J. X., Hennawi, J. F., & Simcoe, R. A. 2013b, ApJ, 762, L19
- Prochaska et al. (2014) Prochaska, J. X., Wingyee Lau, M., & Hennawi, J. F. 2014, ArXiv e-prints
- Prochaska & Wolfe (1996) Prochaska, J. X., & Wolfe, A. M. 1996, ApJ, 470, 403
- Prochaska & Wolfe (1997) —. 1997, ApJ, 487, 73
- Rakic et al. (2013) Rakic, O., Schaye, J., Steidel, C. C., Booth, C. M., Dalla Vecchia, C., & Rudie, G. C. 2013, MNRAS, 433, 3103
- Rakic et al. (2011) Rakic, O., Schaye, J., Steidel, C. C., & Rudie, G. C. 2011, MNRAS, 414, 3265
- Rauch et al. (1997) Rauch, M., Haehnelt, M. G., & Steinmetz, M. 1997, ApJ, 481, 601
- Rauch et al. (2001) Rauch, M., Sargent, W. L. W., & Barlow, T. A. 2001, ApJ, 554, 823
- Razoumov et al. (2008) Razoumov, A. O., Norman, M. L., Prochaska, J. X., Sommer-Larsen, J., Wolfe, A. M., & Yang, Y.-J. 2008, ApJ, 683, 149
- Razoumov & Sommer-Larsen (2006) Razoumov, A. O., & Sommer-Larsen, J. 2006, ApJ, 651, L89
- Reddy et al. (2008) Reddy, N. A., Steidel, C. C., Pettini, M., Adelberger, K. L., Shapley, A. E., Erb, D. K., & Dickinson, M. 2008, ApJS, 175, 48
- Rubin et al. (2014) Rubin, K. H. R., Prochaska, J. X., Koo, D. C., Phillips, A. C., Martin, C. L., & Winstrom, L. O. 2014, ApJ, 794, 156
- Rudie et al. (2012) Rudie, G. C., et al. 2012, ApJ, 750, 67
- Shapley et al. (2003) Shapley, A. E., Steidel, C. C., Pettini, M., & Adelberger, K. L. 2003, ApJ, 588, 65
- Sheinis et al. (2002) Sheinis, A. I., Bolte, M., Epps, H. W., Kibrick, R. I., Miller, J. S., Radovan, M. V., Bigelow, B. C., & Sutin, B. M. 2002, PASP, 114, 851
- Shen et al. (2012) Shen, S., Madau, P., Guedes, J., Mayer, L., & Prochaska, J. X. 2012, ArXiv e-prints
- Simcoe et al. (2006) Simcoe, R. A., Sargent, W. L. W., Rauch, M., & Becker, G. 2006, ApJ, 637, 648
- Smette et al. (1995) Smette, A., Robertson, J. G., Shaver, P. A., Reimers, D., Wisotzki, L., & Koehler, T. 1995, A&AS, 113, 199
- Steidel et al. (2003) Steidel, C. C., Adelberger, K. L., Shapley, A. E., Pettini, M., Dickinson, M., & Giavalisco, M. 2003, ApJ, 592, 728
- Steidel et al. (2010) Steidel, C. C., Erb, D. K., Shapley, A. E., Pettini, M., Reddy, N., Bogosavljević, M., Rudie, G. C., & Rakic, O. 2010, ApJ, 717, 289
- Steidel et al. (2004) Steidel, C. C., Shapley, A. E., Pettini, M., Adelberger, K. L., Erb, D. K., Reddy, N. A., & Hunt, M. P. 2004, ApJ, 604, 534
- Storrie-Lombardi & Wolfe (2000) Storrie-Lombardi, L. J., & Wolfe, A. M. 2000, ApJ, 543, 552
- Tacconi et al. (2013) Tacconi, L. J., et al. 2013, ApJ, 768, 74
- Tremonti et al. (2004) Tremonti, C. A., et al. 2004, ApJ, 613, 898
- Turner et al. (2014) Turner, M. L., Schaye, J., Steidel, C. C., Rudie, G. C., & Strom, A. L. 2014, ArXiv e-prints
- Veilleux et al. (2005) Veilleux, S., Cecil, G., & Bland-Hawthorn, J. 2005, ARA&A, 43, 769
- Veilleux et al. (2003) Veilleux, S., Shopbell, P. L., Rupke, D. S., Bland-Hawthorn, J., & Cecil, G. 2003, AJ, 126, 2185
- Vogelsberger et al. (2013) Vogelsberger, M., Genel, S., Sijacki, D., Torrey, P., Springel, V., & Hernquist, L. 2013, MNRAS, 436, 3031
- Vogelsberger et al. (2014) Vogelsberger, M., et al. 2014, MNRAS, 444, 1518
- Weiner et al. (2006) Weiner, B. J., et al. 2006, ApJ, 653, 1027
- Werk et al. (2014) Werk, J. K., et al. 2014, ArXiv e-prints
- White et al. (2012) White, M., et al. 2012, MNRAS, 424, 933
- Wild et al. (2008) Wild, V., et al. 2008, MNRAS, 388, 227
- Wolfe et al. (2005) Wolfe, A. M., Gawiser, E., & Prochaska, J. X. 2005, ARA&A, 43, 861
- Wolfe & Prochaska (2000) Wolfe, A. M., & Prochaska, J. X. 2000, ApJ, 545, 591
- Wolfe et al. (1986) Wolfe, A. M., Turnshek, D. A., Smith, H. E., & Cohen, R. D. 1986, ApJS, 61, 249
J0004-0844 & 3.00 3.00 35.6 2.75877 20.7 Magellan/MagE 4000 2008-06-28
J0028-1049 3.10 2.62 175.6 2.58793 20.9 Keck/ESI 5000 2008-07-04
J0040+0035 2.76 2.75 97.5 2.12990 20.6 BOSS 2000 2010-09-05
J0201+0032 2.30 2.29 164.7 2.07593 20.1 Gemini/GMOS 1700 2004-11-19
J0800+3542 2.07 1.98 202.1 1.78820 20.9 Keck/LRISb 2400 2007-04-13
SDSS 2000 2001-11-25
J0833+3535 2.34 2.34 244.8 2.19860 20.2 BOSS 2000 2010-12-02
J0913-0107 2.92 2.75 89.3 2.68874 20.3 Magellan/MagE 4000 2014-02-01
J0920+1311 2.43 2.42 54.0 2.03572 20.1 Magellan/MagE 4000 2008-04-06
J0920+1311 2.43 2.42 54.5 1.60723 20.2 Magellan/MagE 4000 2008-04-06
J0932+0925 2.60 2.41 240.7 2.25198 20.6 Magellan/MagE 4000 2009-03-26
J0955-0123 2.84 2.83 91.5 2.72677 20.8 Gemini/GMOS 1700 2013-09-02
J1010+4037 2.51 2.18 193.0 2.04454 20.7 BOSS 2000 2011-01-09
J1026+0629 3.12 3.12 79.3 2.56408 21.5 Magellan/MagE 4000 2009-03-23
J1026+0629 3.12 3.12 77.8 2.78217 20.4 Magellan/MagE 4000 2009-03-23
J1029+2623 2.21 2.20 7.5 1.97830 20.5 Keck/LRISb 2400 2007-01-17
Keck/LRISr -999 2007-01-17
SDSS 2000 2006-02-28
J1038+5027 3.24 3.13 240.9 2.79502 20.2 Keck/ESI 5000 2008-01-04
J1045+4351 3.01 2.44 232.3 2.19625 21.3 BOSS 2000 2011-04-02
Keck/LRISb 2400 2008-05-08
J1056-0059 2.13 2.12 62.7 1.96682 20.3 Magellan/MagE 4000 2014-02-01
J1116+4118 3.00 2.94 114.2 2.66270 20.2 Keck/ESI 5000 2006-03-04
J1150+0453 2.52 2.52 60.5 2.00063 20.6 Gemini/GMOS 1700 2013-08-30
J1153+3530 3.05 2.43 77.5 2.34610 20.7 BOSS 2000 2011-03-28
Keck/LRISb 2400 2008-05-08
J1236+5220 2.58 2.57 26.1 2.39644 21.1 Gemini/GMOS 1700 2013-07-11
J1240+4329 3.26 3.25 24.9 3.09694 20.5 Keck/ESI 5000 2014-02-05
J1240+4329 3.26 3.25 25.2 2.97887 21.1 Keck/ESI 5000 2014-02-05
J1306+6158 2.17 2.10 142.0 1.88163 20.4 Keck/LRISb 2400 2005-03-09
SDSS 2000 2002-02-20
J1307+0422 3.04 3.01 67.5 2.76528 20.1 Magellan/MIKE 22000 2004-05-09
Magellan/MagE 4000 2008-06-28
J1307+0422 3.04 3.01 70.3 2.24969 20.1 Magellan/MIKE 22000 2004-05-09
Magellan/MagE 4000 2008-06-28
J1416+3510 2.92 2.48 134.4 2.08596 20.4 BOSS 2000 2010-03-13
J1428+0232 3.02 3.01 158.0 2.62613 21.1 Gemini/GMOS 1700 2013-09-02
J1529+2314 2.64 2.49 86.3 2.07736 20.4 BOSS 2000 2011-04-29
J1541+2702 3.63 3.62 49.6 3.32992 20.1 Keck/ESI 5000 2011-04-29
J1542+1733 3.26 2.78 231.2 2.42660 21.1 Keck/ESI 5000 2008-06-05
J1559+4943 1.95 1.86 210.1 1.78449 20.8 Keck/LRISb 2400 2008-05-08
J1613+0808 2.39 2.38 84.4 1.61703 20.5 Magellan/MagE 4000 2008-06-29
J1627+4606 4.11 3.81 259.7 3.54960 20.5 Keck/ESI 5000 2007-04-11
J1630+1152 3.28 3.26 187.6 3.18047 20.3 Gemini/GMOS 1700 2012-09-06
J1719+2549 2.17 2.17 127.3 2.01900 20.8 Gemini/GMOS 1700 2004-04-23
J2103+0646 2.57 2.55 32.8 2.13902 20.5 Gemini/GMOS 1700 2013-07-11
J2141-0229 2.71 2.70 107.9 2.10624 20.4 Gemini/GMOS 1700 2013-07-11
J2146-0753 2.58 2.11 121.3 1.85306 20.5 Keck/LRISb 2400 2007-08-17
SDSS 2000 2001-09-21
QSO Pair Name
kpc Å Å Å Å Å Å Å
\endfirsthead Table 2 – Continued
QSO Pair Name
kpc Å Å Å Å Å Å Å
\endhead
Continued on Next Page…
\endfoot
Note 1: Transitions which fall in the Ly forest of the corresponding QSO are indicated with “…”.
Note 2: Transitions which are affected by blending with unassociated systems are marked with b.
a in the CGM sightline. Values are not listed for spectra which have insufficient S/N to constrain (S/N at .)
\endlastfootJ0004-0844 35.6 2.75877
J0028-1049 175.6 2.58793
J0040+0035 97.5 2.12990
J0201+0032 164.7 2.07593
J0800+3542 202.1 1.78820
J0833+3535 244.8 2.19860
J0913-0107 89.3 2.68874
J0920+1311 54.0 2.03572
J0920+1311 54.5 1.60723
J0932+0925 240.7 2.25198
J0955-0123 91.5 2.72677
J1010+4037 193.0 2.04454
J1026+0629 79.3 2.56408
J1026+0629 77.8 2.78217
J1029+2623 7.5 1.97830
J1038+5027 240.9 2.79502
J1045+4351 232.3 2.19625
J1056-0059 62.7 1.96682
J1116+4118 114.2 2.66270
J1150+0453 60.5 2.00063
J1153+3530 77.5 2.34610
J1236+5220 26.1 2.39644
J1240+4329 24.9 3.09694
J1240+4329 25.2 2.97887
J1306+6158 142.0 1.88163
J1307+0422 67.5 2.76528
J1307+0422 70.3 2.24969
J1416+3510 134.4 2.08596
J1428+0232 158.0 2.62613
J1529+2314 86.3 2.07736
J1541+2702 49.6 3.32992
J1542+1733 231.2 2.42660
J1559+4943 210.1 1.78449
J1613+0808 84.4 1.61703
J1627+4606 259.7 3.54960
J1630+1152 187.6 3.18047
J1719+2549 127.3 2.01900
J2103+0646 32.8 2.13902
J2141-0229 107.9 2.10624
J2146-0753 121.3 1.85306
Range HI CII 1334 SiIV 1393 SiII 1526 CIV 1548
kpc kpc Å kpc Å kpc Å kpc Å kpc Å
\endfirsthead Table 3 – Continued
\endhead
Continued on Next Page…
\endfoot
Note 1: All values are measured in a relative velocity window , with the exception of ,
which is measured in a window .
Note 2: We have excluded spectra from these coadds for which the transition of interest lies in the Ly forest; i.e., if
.
\endlastfoot 0 0 0 0 0
28
75
60 53 54 59 59
148 153 154 149 149
233 238 238 243 243
119 112 117 112 112
Figure 13 shows our spectroscopy of all DLAs and the corresponding CGM systems included in this study.