A High Power-Density Mediator-Free Microfluidic Biophotovoltaic Device for Cyanobacterial Cells
Abstract
Biophotovoltaics has emerged as a promising technology for generating renewable energy since it relies on living organisms as inexpensive, self-repairing and readily available catalysts to produce electricity from an abundant resource - sunlight. The efficiency of biophotovoltaic cells, however, has remained significantly lower than that achievable through synthetic materials. Here, we devise a platform to harness the large power densities afforded by miniaturised geometries. To this effect, we have developed a soft-lithography approach for the fabrication of microfluidic biophotovoltaic devices that do not require membranes or mediators. Synechocystis sp. PCC 6803 cells were injected and allowed to settle on the anode, permitting the physical proximity between cells and electrode required for mediator-free operation. We demonstrate power densities of above 100 mW/m2 for a chlorophyll concentration of M under white light, a high value for biophotovoltaic devices without extrinsic supply of additional energy.
Fuelling the ever-growing need for energyEIA by fossil combustibles is expected to have dramatic, global consequences on climate and ecosystems. These environmental effects, in combination with the depletion of fossil fuel reserves, have led to a pressing need for developing technologies for harnessing renewable energy.Lewis and Nocera (2006); New et al. (2011) In this scenario, bio-electrochemical systems - such as microbial fuel cellsRabaey and Verstraete (2005); Logan et al. (2006); Yang et al. (2011); Jiang et al. (2013) (MFCs) and biological photovoltaic cellsTsujimura et al. (2001); Rosenbaum et al. (2005); Pisciotta et al. (2010); Bombelli et al. (2011); Samsonoff et al. (2014) (BPVs) - may help to alleviate the present concerns by utilising living organisms as inexpensive, readily available catalysts to generate electricity. A particularly advantageous feature of BPVs is that they consist of living photosynthetic material that allows for continuous repair of photo-damage to key proteins.
Whereas MFCs use heterotrophic bacteria to convert the chemical energy stored in organic matter, BPVs use photosynthetic organisms capable of harnessing solar energy. In MFCs operating with Geobacter sulfurreducens, the oxidation of acetate can proceed with a Coulombic efficiency of .Nevin et al. (2008) Nevertheless, the availability of acetate and other organic substrates is not endless which imposes a limiting factor to this approach. By contrast, in BPV-type systems, the conversion efficiencies of light into charges remain low (),McCormick et al. (2011) but the primary fuel (i.e., solar light) is virtually unlimited. Consequently, a significant research effort is required towards understanding which processes limit the performance of biophotovoltaic cells, both in terms of biophysics and engineering.
In this context, miniaturisation of BPVs provides highly attractive possibilities for high-throughput studies of small cell cultures, down to individual cells, in order to learn about differences in genetically identical organisms as well as to direct the evolution of efficient cell lines in bulkCarter (2006); Bershtein and Tawfik (2008); Keasling (2008) and in microfluidics.Agresti et al. (2010) Furthermore, the distances which the charge carriers have to migrate within the devices can be shortened dramatically, reducing resistive losses in the electrolyte.Rabaey and Verstraete (2005) The readily achievable conditions for laminar flow and sessile state of the anodophilic photosynthetic cells also permit operation without the use of a proton-exchange membrane.Choban et al. (2004); Kjeang et al. (2009); Wang and Su (2013); Ye et al. (2013)
To date, efforts have focussed on miniaturised microbial fuel cells.Chiao et al. (2006); Crittenden et al. (2006); Siu and Chiao (2008); Hou et al. (2009); Qian et al. (2009, 2011); Wang et al. (2011); Hou et al. (2012); Ye et al. (2013); Jiang et al. (2013) In order to exploit the high power densities available through the decrease of the length scales of the charge transport and the decrease of the electrolyte volume, we have developed a simple fabrication method for microfluidic biophotovoltaic (BPV) devicesChiao et al. (2006) that do not require an electron mediator or a proton-exchange membrane. Besides increasing efficiency and simplicity of the device, relinquishing mediator and membrane also reduces the cost of potential large-scale applications.Bond and Lovley (2003); Reguera et al. (2006); Malik et al. (2009); McCormick et al. (2011)
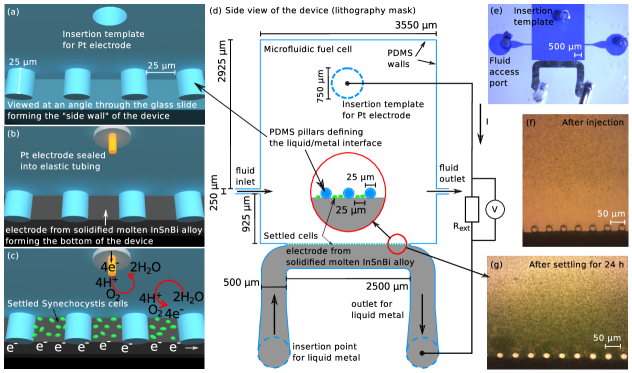
We use soft lithographyMcDonald and Whitesides (2002) to form microscopic channels which we equip using microsolidicsSiegel et al. (2009) with a self-aligned electrode from a low-melting point alloySo and Dickey (2011); Li et al. (2013); Herling et al. (2013) (InSnBi) and a platinum electrode sealed inside microfluidic tubing. A scheme of such a device is shown in Fig. 1(a-c), and the specific design including the external measurement circuit is presented in Fig. 1(d). True-colour microscopy photographs of a device filled with Coomassie blue, with freshly injected Synechocystis cell, as well as with cells that have settled on the anode during 24 hours are shown in Fig. 1(e), (f), and (g), respectively. The possibility of omitting the mediator arises from the physical proximity of the settled cells and the anode which forms the bottom of the device, as well as the choice of electrode materials. The latter ensures that \ceH+ is preferably reduced at the cathode since platinum catalyses this reaction.
The inherently small size (below 400 nL) of our microfluidic approach permits studies of minute amounts of biological material. Moreover, our BPV works without any additional energy supply, such as inert gas purging to keep the anodic chamber anoxic and/or oxygen gas purging in the cathodic chamber to facilitate the reformation of water,Yagishita et al. (1997); Torimura et al. (2001); Tsujimura et al. (2001) or a bias potential applied to polarise the electrodes and improve the electron flux between anode and cathode.Malik et al. (2009)
The use of soft lithography allows for fast in-house prototyping and for the utilisation of the range of techniques developed for integrated circuits. Despite the small volumes contained in microfluidic devices, such approaches can be scaled up by parallelisation,Hou et al. (2012); Romanowsky et al. (2012) and the surface-to-volume ratio can be designed to outperform macroscopic approaches significantly.Wang et al. (2011)
Results
The microfluidic BPV device described here operates as a microbial fuel cell with submicroliter volume, generating electrical power by harnessing the photosynthetic and metabolic activity of biological material. Its anodic half-cell consists of sessile Synechocystis cells - performing water photolysis (\ce2H_2O\ce4H^+ +4e^- +O_2) and subsequent “dark” metabolism - as well as an anode made from an InSnBi alloy and a light source.
Current and power analyses
A BPV was loaded with wild type Synechocystis sp. PCC 6803 cells (subsequently referred to as Synechocystis) suspended in BG11 medium - supplemented with NaCl - at a final chlorophyll concentration of 100 nmol Chl mL-1. The exoelectrogenic activity of three biological replicates of sessile cells was characterised under controlled temperature conditions sequentially in the same device.
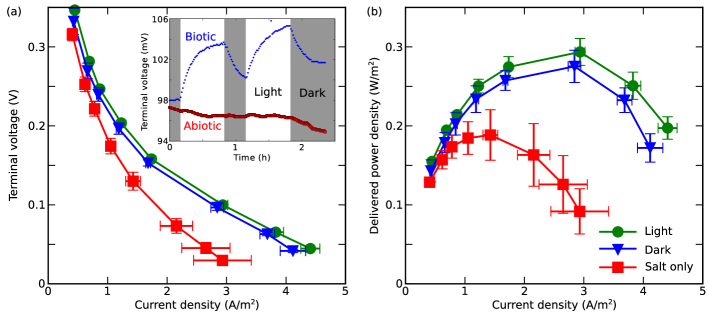
The BPV was rested for 24 hours, permitting the formation of cellular films on the anodic surface and stabilising the open circuit potential. Polarisation and power curves were then recorded by connecting different resistance loads to the external circuit in the dark or under illumination with white LED light (see Methods), and are shown in Fig. 2.
In the dark, significant power output was observed relative to the control sample containing no cells. This observation is consistent with the breakdown of stored carbon intermediates accumulated during the light period.Bombelli et al. (2011) The peak power output of was established at a current density of . Under illumination the microfluidic BPV loaded with Synechocystis showed an increase in both current and power output. The peak power density was established at a current of . Crucially, both the dark and the light electrical outputs were significantly higher than the abiotic peak power output in this device of established at a current of , demonstrating that the power output from our devices originates from the biological activity of the cyanobacteria.
From the linear slope at the high current side of the polarization curve as well as the from the external resistance for which maximal power transfer occurs we can estimate the internal resistance of the device to be around for the biotically loaded device and for the abiotic control (for further details see Supplementary Material).
The electrical output recorded from the abiotic control - possibly due to medium salinityLogan et al. (2006); Logan (2009) and anodic oxidation - is taken into account when the power densities of biotic experiments are quoted. Specifically, subtracting the abiotic background yields a biotic output power density of . This number is halved when comparing to the full cross-sectional area of the device (including the inaccessible parts of the anode), and the power available per footprint area is ca. .
Light response
To demonstrate the photo-activity of the Synechocystis cells, the variation of the anode-cathode voltage as a response to repeated light stimulation was recorded over time (see inset of Fig. 2(a)). The external resistor was fixed at 100 M, and the voltage was sampled once per minute. Illumination by white LED light at resulted in a reproducible voltage increase at a rate of with . The time until the electrical outputs were stabilised was around one hour. We find that the baseline voltage levels change after illumination - most certainly due to a buildup and breakdown of intracellular metabolites.
From the measured spectrum of the light source (see Supplementary Information) we can determine the average wave number which corresponds to a wavelength of 570 nm. Thus the photon flux can be converted to an incident light intensity of . Using these values we can extract a rough estimate for the efficiency of our BPV (energy output versus energy input) of around 0.25% which compares favourably to previously achieved values.Chiao et al. (2006); McCormick et al. (2011); Lan et al. (2013) Note that light scattering on the glass surface and losses from the non perpendicular illumination angle would increase this number and hence it can be understood as a lower bound.
With such an illumination cycle, the light-driven electrical response of a device can be directly compared to dark conditions, proving the functionality of our BPV. In addition, the abiotic control shows no variations in anode-cathode potential under similar illumination.
The difference between the power outputs under dark and illuminated conditions is consistent with previous studies of Synechocystis sp. PCC 6803.McCormick et al. (2011) Nevertheless, a direct comparison of the power output reported by McCormick et al. of around with the peak value in excess of demonstrated here emphasises the great potential of microfluidic approaches compared to macroscopic devices.
Variability of the abiotic characterisation
In order to characterise the variability of the electrical behaviour of our BPV, two further, lithographically identical devices were studied with abiotic loading (i.e., without photosynthetic cells). These devices were injected with BG11 media (with 0.25 M NaCl), and the current and power outputs were characterised under controlled temperature conditions.
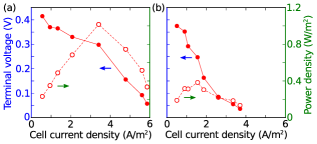
Following 24 hours of stabilisation of the BPV at open circuit potential, polarisation and power curves (see Fig. 3) were generated by applying different resistance loads to the external circuit in the dark. In different devices, the abiotic peak power density outputs vary from around 0.2 to and were established at current densities of 1.5 and , respectively. The large variation in device output between different devices stems from the variable position and shape of the cathode which is not lithographically defined in our current designs. Device improvements at this level may well provide a straightforward route to further improvement of the output power. Crucially, no major changes in current and power outputs were observed upon exposure to white light (see inset of Fig. 2(a)).
Comparison with recent literature
The exceptionally high power density in excess of after subtraction of the abiotic background has been facilitated by the physical proximity of the cells to the anode allowing for operation without a proton-exchange membrane, which in turn leads to a low internal resistance in the device, as well as by the microscopic size of the anodic chamber allowing for a large ratio of active surface to volume. In macroscopic bio-electrochemical systems by contrast, parameters such as mass transport, reaction kinetics and ohmic resistance are expected to have detrimental effect on the electrical output.Rabaey and Verstraete (2005); Wang et al. (2011)
| Study | AAA | ACV | Anode/ | Mediator | Photosynthetic | |
|---|---|---|---|---|---|---|
| mW/m2 | mm2 | L | Cathode | organism | ||
| Chiao 2006Chiao et al. (2006) | 0.0004 | 50 | 4.3 | Au/ | Methylene | Anabaena sp. |
| N-Au - csc | blue | |||||
| Bombelli 2011Bombelli et al. (2011) | 1.2 | 80 | 150 | ITO/N-CPt | \ceK_3[Fe(CN)_6] | Synechocystis sp. |
| PCC 6803 | ||||||
| McCormick 2011McCormick et al. (2011) | 10 | 1’300 | 12’600 | ITO/ | free | Synechococcus sp. |
| Pt-coated glass | WH 5701 | |||||
| Thorne 2011Thorne et al. (2011) | 24 | 230 | 2’300 | FTO/Carbon cloth | \ceK_3[Fe(CN)_6] | Chlorella vulgaris |
| Bombelli 2012Bombelli et al. (2012) | 0.02 | 2’000 | 20’000 | ITO/Pt-C | free | Oscillatoria limnetica |
| Madiraju 2012Madiraju et al. (2012) | 0.3 | 1’500 | 60’000 | Carbon fibre | free | Synechocystis sp. |
| PCC 6803 | ||||||
| Bradley 2013Bradley et al. (2013) | 0.2 | 1’300 | 31’500 | ITO/N-CPt | \ceK_3[Fe(CN)_6] | Synechocystis TM |
| Lan 2013Lan et al. (2013) | 13 | 4’600 | Pre-treated graphite/csc | \ceK_3[Fe(CN)_6] | Chlamydomonas | |
| reinhardtii | ||||||
| Lin 2013Lin et al. (2013) | 10 | 2’100 | Au mesh/Graphite cloth | free | Spirulina platensis | |
| Luimstra 2013Luimstra et al. (2013) | 6 | 1’400 | 70’000 | PPCP/ | free | Pauschulzia |
| Carbon cloth with Pt | pseudovolvox | |||||
| Sekar 2014Sekar et al. (2014) | 35 | 2.5 | n/a | CNTCP/ | free | Nostoc sp. |
| Laccase on CNTCP | ||||||
| Sekar 2014Sekar et al. (2014) | 100 | 2.5 | n/a | CNTCP/ | BQ | Nostoc sp. |
| Laccase on CNTCP | ||||||
| This study | 105 | 0.03 | 0.4 | InSnBi alloy/Pt | free | Synechocystis sp. |
| PCC 6803 |
For a specific comparison, Tab. 1 gives an overview of the power densities as well as technical specifications of intrinsic BPVs (i.e., requiring no external energy) characterised in the recent literature, including an instance with an additional enzymatic cathode.Sekar et al. (2014) While there are many aspects influencing the performance of a BPV, such as surface-to-volume ratio, photosynthetic organism, and electrode material, one can observe a trend that generally the mediator-free approaches surpass their counterparts that rely on electron mediators diffusing over large distances. It should be mentioned that many of the studies listed in Tab. 1 were not intended to improve on output power. We also note that higher power densities have been observedTsujimura et al. (2001) when extrinsic energy was supplied.
Discussion
In summary, we have described a microfluidic design for a mediator-less, membrane-free bio-photovoltaic device. Electrical characterisation of devices loaded with Synechocystis sp. PCC 6803 revealed peak power densities in excess of . In spite of the low power available per footprint area (currently of the order of ) the promising performance and the simple fabrication process demonstrate the potential of our approach for generating biological solar cells with microfluidics.
Our approach is applicable to any photosynthetic organism forming biofilms. Furthermore, using the strategy presented in this work, further improvement of the power output should be readily achievable through reduction of the distance between anode and cathode and increase of the channel height. This flexibility in device geometry and the possibility of in-situ electroplating of the anode underline the versatility of soft-lithography as a means for generating biophotovoltaic cells.
Options for enhanced miniaturisation open pathways for the study of small cell cultures containing as little as tens of cells for rapid screening of electrochemically active microbes in the context of directed evolution.
Methods
Device fabrication
Devices were fabricated to a height of using standard soft lithographyMcDonald and Whitesides (2002) for polydimethylsiloxane (PDMS) on glass. The designs include an array of wide PDMS pillars spaced by in order to allow for insertion of molten solderSo and Dickey (2011); Li et al. (2013) (Indalloy 19, Indium Corporation, Clinton NY, USA) on a hotplate set to . Solidification of this \ceInBiSn alloy upon removal from the heat yields self-aligned wall electrodes using a single lithography step.Herling et al. (2013) This process is illustrated in Fig. 1(a) and (b). The cathode is constructed by inserting a strip of platinum wire of diameter through polyethylene tubing (Smiths Medical; 800/100/120; the same as used for contacting microfluidic devices in general) and sealing off both ends of the tubing with epoxy glue. Inserting this tube through a previously punched hole in the device generates a sealed electrical connection and is indicated by the orange wire (Pt) inside a white cylinder (tubing) in the scheme in Fig. 1(b). Note that this method for electrode fabrication also allows for straightforward exchange of the cathode material, which would be beneficial for in-situ electroplating the \ceInBiSn alloy.
During settling and operation, the BPVs are oriented such that the bottom of the device is formed by the anode, and the glass slide as well as the pdms forming the side and top walls.
The total volume above the anode is below 400 nL, significantly reducing the consumption of biological material and chemicals of each experiment compared to macroscopic approaches.
Electrode Area
The accessible surfaces of these electrodes are ca. for the anode (only approximately one half of the total metal area is accessible due to the PDMS pillars) and of the order of for the cathode, assuming the available length of the Pt wire to be 2 mm. Note that the majority of the cathode lies inside the cavity of the insertion template. If one were to consider the entire horizontal cross-section of the device, the according area would double to , and the footprint of the device is at present around including the access ports for fluid injection. This latter number can be reduced straightforwardly by more than one order of magnitude by redesigning the inlet ports.
Cell culture and growth
A wild-type strain of Synechocystis sp. PCC 6803 was cultivated from a laboratory stock.Bombelli et al. (2011) Cultures were grown and then analysed in BG11 mediumRippka et al. (1979) supplemented with 0.25 M NaCl. All cultures were supplemented with 5 mM NaHCO3 and maintained at under continuous low light (ca. ) in sterile conditions. Strains were periodically streaked onto plates containing agar () and BG11 including NaCl, which were then used to inoculate fresh liquid cultures. Culture growth and density were monitored by spectrophotometric determination of chlorophyll content. Chlorophyll was extracted in (v/v) methanol (Sigma-Aldrich, Gillingham, UK) as described previously.Porra et al. (1989)
Cell injection and settling
First, the devices were filled with culture medium (BG11 with 0.25 M NaCl) and any air bubbles were removed by means of syringes attached via elastic polyethylene tubing (Smiths Medical; 800/100/120). Synechocystis cells suspended in BG11 (supplemented with NaCl) were then injected at a concentration of chlorophyll. Maintaining the devices for 24 h at an orientation in which the metal alloy anode forms the bottom allows the cells to sediment on the electrode by gravity. This process creates a closely-spaced interface allowing the electrons to be transmitted to the anode (see Fig. 1(c) and (g)) and thus favouring mediator-free operation. Throughout all experiments, the syringes are kept attached in order to prevent drying out of the BPV.
Microfluidic BPV measurement and illumination
In principle, the optimal way of extracting the voltage output of our biophotovoltaic device would be to determine the half-cell potentials individually by integrating reference electrodes into the devices. Since this is challenging in microfluidic devices,Shinwari et al. (2010) we have instead measured the terminal voltage of our BPV which does not offer insight into the potentials of the complex half-cell reactions but provides an accurate measurement for the power delivered to an external load.
Polarisation curves were acquired by recording the terminal voltage under pseudo steady-state conditionsLogan et al. (2006) with variable external loads () and plotting the cell voltage as a function of current density (current per unit anodic area). Typically, a time span of around 20 min was sufficient for a stable output (see Supplementary Fig. 2). The resistance values ranged from 24.8 M to 324 k (24.8, 13, 9.1, 5.3, 2.9, 1.1, 0.547, and 0.324 M), where the internal resistance of the digital voltmeter of has been taken into account. Voltages were recorded using an UT-70 data logger (Uni-Trend Limited, Hong Kong, China). The current delivered to the load was calculated from Ohm’s law
| (1) |
and the power is given by
| (2) |
Based on the polarisation curves, power curves were obtained for each system by plotting the power per unit area or power density as a function of current density. These power density curves were further used to determine the average maximum power output for the microfluidic BPV system and the negative control. For all measurements, alligator clamps and copper wire served as connections to anode and cathode, and the temperature was kept at .
To characterise the light response, artificial light was provided by a warm white LED bulb (Golden Gadgets, LA2124-L-A3W-MR16), maintained at a constant output of at the location of the BPVs. A measured spectrum of the light source is shown in the supplementary material. Light levels were measured in with a SKP 200 Light Meter (Skye Instruments Ltd, Llandrindod Wells, UK).
The photo-active cells were illuminated through the glass slide forming the bottom of the device, resulting in an almost parallel angle of incidence on the cell layer. This geometry does lead to a decreased light intensity on the cells, which may be compensated for by using a more powerful light source in studies of photosynthetic materials or by altering the geometric arrangement of the devices when harnessing actual sunlight.
References
References
- (1) U.S. Energy Information Administration, International Energy Outlook 2013.
- Lewis and Nocera (2006) N. S. Lewis and D. G. Nocera, Proc Natl Acad Sci USA 103, 15729 (2006).
- New et al. (2011) M. New, D. Liverman, H. Schroeder, and K. Anderson, Phil Trans Royal Soc A 369, 6 (2011).
- Rabaey and Verstraete (2005) K. Rabaey and W. Verstraete, Trend Biotech 23, 291 (2005).
- Logan et al. (2006) B. E. Logan, B. Hamelers, R. Rozendal, U. Schröder, J. Keller, S. Freguia, P. Aelterman, W. Verstraete, and K. Rabaey, Envir Sci Technol 40, 5181 (2006).
- Yang et al. (2011) Y. Yang, G. Sun, and M. Xu, J Chem Tech Biotech 86, 625 (2011).
- Jiang et al. (2013) X. Jiang, J. Hu, E. R. Petersen, L. A. Fitzgerald, C. S. Jackan, A. M. Lieber, B. R. Ringeisen, C. M. Lieber, and J. C. Biffinger, Nat Commun 4, 2751 (2013).
- Tsujimura et al. (2001) S. Tsujimura, A. Wadano, K. Kano, and T. Ikeda, Enzyme Microbial Tech 29, 225 (2001).
- Rosenbaum et al. (2005) M. Rosenbaum, U. Schröder, and F. Scholz, Appl Microbiol Biotech 68, 753 (2005).
- Pisciotta et al. (2010) J. M. Pisciotta, Y. Zou, and I. V. Baskakov, PloS One 5, e10821 (2010).
- Bombelli et al. (2011) P. Bombelli, R. W. Bradley, A. M. Scott, A. J. Philips, A. J. McCormick, S. M. Cruz, A. Anderson, K. Yunus, D. S. Bendall, P. J. Cameron, J. M. Davies, A. G. Smith, C. J. Howe, and A. C. Fisher, Energy Environ Sci 4, 4690 (2011).
- Samsonoff et al. (2014) N. Samsonoff, M. D. Ooms, and D. Sinton, Appl Phys Lett 104, 043704 (2014).
- Nevin et al. (2008) K. P. Nevin, H. Richter, S. F. Covalla, J. P. Johnson, T. L. Woodard, A. L. Orloff, H. Jia, M. Zhang, and D. R. Lovley, Environ Microbiol 10, 2505 (2008).
- McCormick et al. (2011) A. J. McCormick, P. Bombelli, A. M. Scott, A. J. Philips, A. G. Smith, A. C. Fisher, and C. J. Howe, Energy Environ Sci 4, 4699 (2011).
- Carter (2006) P. J. Carter, Nat Rev Immun 6, 343 (2006).
- Bershtein and Tawfik (2008) S. Bershtein and D. S. Tawfik, Curr Op Chem Biol 12, 151 (2008).
- Keasling (2008) J. D. Keasling, ACS Chem Biol 3, 64 (2008).
- Agresti et al. (2010) J. Agresti, E. Antipov, A. Abate, K. Ahn, A. Rowat, J. Baret, M. Marquez, A. Klibanov, A. Griffiths, and D. Weitz, Proc Natl Acad Sci USA 107, 4004 (2010).
- Choban et al. (2004) E. R. Choban, L. J. Markoski, A. Wieckowski, and P. J. A. Kenis, J of Power Sources 128, 54 (2004).
- Kjeang et al. (2009) E. Kjeang, N. Djilali, and D. Sinton, J Power Sources 186, 353 (2009).
- Wang and Su (2013) H.-Y. Wang and J.-Y. Su, Bioresource Tech 145, 271 (2013).
- Ye et al. (2013) D. Ye, Y. Yang, J. Li, X. Zhu, Q. Liao, B. Deng, and R. Chen, Intl J Hydr Energy 38, 15710 (2013).
- Chiao et al. (2006) M. Chiao, K. B. Lam, and L. Lin, J Micromech Microeng 16, 2547 (2006).
- Crittenden et al. (2006) S. R. Crittenden, C. J. Sund, and J. J. Sumner, Langmuir 22, 9473 (2006).
- Siu and Chiao (2008) C.-P. Siu and M. Chiao, J Microelectromech Sys 17, 1329 (2008).
- Hou et al. (2009) H. Hou, L. Li, Y. Cho, P. de Figueiredo, and A. Han, PLoS One 4, e6570 (2009).
- Qian et al. (2009) F. Qian, M. Baum, Q. Gu, and D. E. Morse, Lab Chip 9, 3076 (2009).
- Qian et al. (2011) F. Qian, Z. He, M. P. Thelen, and Y. Li, Bioresource Technology 102, 5836 (2011).
- Wang et al. (2011) H.-Y. Wang, A. Bernarda, C.-Y. Huang, D.-J. Lee, and J.-S. Chang, Bioresource Tech 102, 235 (2011).
- Hou et al. (2012) H. Hou, L. Li, C. U. Ceylan, A. Haynes, J. Cope, H. H. Wilkinson, C. Erbay, P. d. Figueiredo, and A. Han, Lab Chip 12, 4151 (2012).
- Bond and Lovley (2003) D. R. Bond and D. R. Lovley, Appl Environ Microbiol 69, 1548 (2003).
- Reguera et al. (2006) G. Reguera, K. P. Nevin, J. S. Nicoll, S. F. Covalla, T. L. Woodard, and D. R. Lovley, Appl Environ Microbiol 72, 7345 (2006).
- Malik et al. (2009) S. Malik, E. Drott, P. Grisdela, J. Lee, C. Lee, D. A. Lowy, S. Gray, and L. M. Tender, Energy Environ Sci 2, 292 (2009).
- McDonald and Whitesides (2002) J. McDonald and G.M. Whitesides, Acc Chem Res 35, 491 (2002).
- Siegel et al. (2009) A. C. Siegel, D. A. Bruzewicz, D. B. Weibel, and G. M. Whitesides, Adv Mater 19, 727 (2007).
- So and Dickey (2011) J.-H. So and M. D. Dickey, Lab Chip 11, 905 (2011).
- Li et al. (2013) S. Li, M. Li, Y. Hui, W. Cao, W. Li, and W. Wen, Microfluid Nanofluid 14, 499 (2013).
- Herling et al. (2013) T. W. Herling, T. Müller, L. Rajah, J. N. Skepper, M. Vendruscolo, and T. P. J. Knowles, Appl Phys Lett 102, 184102 (2013).
- Yagishita et al. (1997) T. Yagishita, S. Sawayama, K.-I. Tsukahara, and T. Ogi, Bioelectrochem Bioenerg 43, 177 (1997).
- Torimura et al. (2001) M. Torimura, A. Miki, A. Wadano, K. Kano, and T. Ikeda, J Electroanal Chem 496, 21 (2001).
- Romanowsky et al. (2012) M. B. Romanowski, A. R. Abate, A. Rotem, C. Holtze, and D. A. Weitz, Lab Chip 12, 802 (2012).
- Logan (2009) B. E. Logan, Nat Rev Microbiol 7, 375 (2009).
- Lan et al. (2013) J. C.-W. Lan, K. Raman, C.-M. Huang, and C.-M. Chang, Biochem Eng J 78, 39 (2013).
- Thorne et al. (2011) R. Thorne, H. Hu, K. Schneider, P. Bombelli, A. Fisher, L. M. Peter, A. Dent, and P. J. Cameron, J Mater Chem 21, 18055 (2011).
- Bombelli et al. (2012) P. Bombelli, M. Zarrouati, R. J. Thorne, K. Schneider, S. J. L. Rowden, A. Ali, K. Yunus, P. J. Cameron, A. C. Fisher, D. Ian Wilson, C. J. Howe, and A. J. McCormick, Phys Chem Chem Phys 14, 12221 (2012).
- Madiraju et al. (2012) K. S. Madiraju, D. Lyew, R. Kok, and V. Raghavan, Bioresource Tech 110, 214 (2012).
- Bradley et al. (2013) R. W. Bradley, P. Bombelli, D. J. Lea-Smith, and C. J. Howe, Phys Chem Chem Phys 15, 13611 (2013).
- Lin et al. (2013) C.-C. Lin, C.-H. Wei, C.-I. Chen, C.-J. Shieh, and Y.-C. Liu, Bioresource Tech 135, 640 (2013).
- Luimstra et al. (2013) V. M. Luimstra, S.-J. Kennedy, J. Güttler, S. A. Wood, D. E. Williams, and M. A. Packer, J Appl Phycol 26, 15 (2013).
- Sekar et al. (2014) N. Sekar, Y. Umasankar, and R. P. Ramasamy, Phys Chem Chem Phys 16, 7862 (2014).
- Rippka et al. (1979) R. Rippka, J. Deruelles, J. Waterbury, M. Herdman, and R. Stanier, J Gen Microbiol 111, 1 (1979).
- Porra et al. (1989) R. Porra, W. Thompson, and P. Kriedemann, Biochim Biophys Acta 975, 384 (1989).
- Shinwari et al. (2010) M. W. Shinwari, D. Zhitomirsky, I. A. Deen, P. R. Selvaganapathy, M. J. Deen, and D. Landheer, Sensors 10, 1679 (2010).
Acknowledgements
We gratefully acknowledge financial support from the Biotechnology and Biological Sciences Research Council (BBSRC), the Engineering and Physical Sciences Research Council (EPSRC), the European Research Council (ERC), the EnAlgae consortium (http://www.enalgae.eu/), as well as the Swiss National Science Foundation (SNF).
Supplementary Information
.1 Device Handling
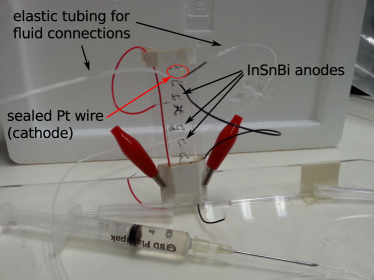
Figure 4 illustrates the operation of the device. After the fabrication of the device and the electrodes, the cell medium is injected using plastic syringes, and all air is removed by applying pressure on the fluid inlet and outlet. Thereafter, the elastic tubing is cut on one side and the cells are injected through another syringe. The syringes are then left attached to prevent drying of the device. Copper wires are soldered to the electrodes to provide electric connections. Finally, the device is positioned such that the anode forms the bottom and the cells sediment on it under the influence of gravity.
A magnified version of a device filled with a Coomassie blue solution is shown in Fig. 5(a), and a true-colour microscopy image of Synechocystis sp. PC 6803 cells settled on the alloy anode is presented in Fig. 4(b).

.2 Device stability
In order to assess the stability of our devices, a sample was loaded with cell medium and its power output was measured during more than 25 hours (see Fig. 6). After a sharp decrease in the first minutes, the device was stable for a period in excess of 24 hours.

.3 Anode Material
The low-melting point solder Indalloy 19 (Indium Corporation, Clinton NY, USA) - composed of indium, bismuth, and tin - has been chosen due to its simplicity for generating self-aligned wall electrodes in microfluidic devices.So and Dickey (2011); Li and Yip (2013); Herling et al. (2013) The melting point at C enables straightforward insertion into the device on a hot plate at C, with the liquid metal patterned by polydimethylsiloxane pillars due to its surface tension. Upon removing the devices from the hot plate the alloy solidifies forming a solid electrode.
The standard potentials of each of the constituent metals areBard et al. (1985)
| (3) | ||||
| (4) | ||||
| (5) | ||||
| (6) |
These potentials are below the value for the oxidation of hydrogen to water at the cathode (), and therefore it is quite possible that oxides such as, for instance, \ceIn_2O_3, \ceBi_2O_3, \ceBi_2Sn_2O_7, or \ceSnO_2 are forming on the anode. We have subtracted this oxidative current from our power estimates and did not see any significant deterioration in performance in a control over a time span of 25 hours (Fig. 6).
.4 Estimates of the internal resistance
Measuring the voltage drop over an external resistor attached to a source yields the terminal voltage which is smaller than the actual cell voltage due to the internal resistance of the source
| (7) |
Therefore,
| (8) |
Since the -characteristics are not linear, the internal resistance of the cell, or - more likely - its output voltage, depends on the current drawn. Nevertheless, from the linear part of the polarisation curve at high currents (Fig. 2(a) in the main text) we can estimate the internal resistance to amount to
| (9) |
for the biotically loaded device and
| (10) |
for the abiotic control. Note that the internal resistance decreased by with the addition of the cyanobacteria. Furthermore, since maximal power transfer to the external load is observed when the load resistance is matched to the internal resistance of the cell, we can double-check the above values by comparison to Fig. 2(b). There, the maximum power is observed for external resistances of and for biotic and abiotic filling, respectively. These values are in close agreement with the estimates from the polarisation curves.
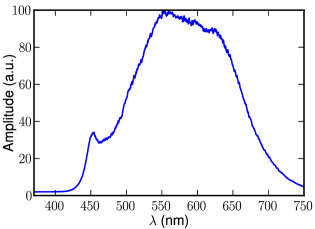
.5 Light source
In Fig. 7 we present the measured spectrum of the lamp we have used to illuminate our biophotovoltaic cells. From these data, we can also extract the weighted average wave number to be which corresponds to a wavelength of around 570 nm. Therefore, the average energy per photon is , and the measured photon flux of yields an illumination intensity at the location of the devices of .
Supplementary References
References
- So and Dickey (2011) J.-H. So and M. D. Dickey, Lab Chip, 2011, 11, 905–911.
- Li and Yip (2013) J. J. Li and C. M. Yip, Biochimica et Biophysica Acta (BBA) - Biomembranes, 2013, 1828, 2272–2282.
- Herling et al. (2013) T. W. Herling, T. Müller, L. Rajah, J. N. Skepper, M. Vendruscolo and T. P. J. Knowles, Appl Phys Lett, 2013, 102, 184102.
- Bard et al. (1985) Standard Potentials in Aqueous Solution, ed. A. J. Bard, R. Parsons and J. Jordan, CRC Press, 1985.