Inequality and cumulative advantage in science careers: a case study of high-impact journals
For the long published version, complete with full analysis, references, methods, and data summary, see:
AM Petersen, O Penner (2014) EPJ Data Science 3: 24.
DOI:10.1140/epjds/s13688-014-0024-y
Send correspondence to: petersen.xander@gmail.com
Analyzing a large data set of publications drawn from the most competitive journals in the natural and social sciences we show that research careers exhibit the broad distributions of individual achievement characteristic of systems in which cumulative advantage plays a key role. While most researchers are personally aware of the competition implicit in the publication process, little is known about the levels of inequality at the researcher level.
Here we analyzed both productivity and impact measures for a large set of researchers publishing in high-impact journals, accounting for censoring biases in the publication data by using distinct researcher cohorts defined over non-overlapping time periods. For each researcher cohort we calculated Gini inequality coefficients, with average Gini values around 0.48 for total publications and 0.73 for total citations. For perspective, these observed values are well in excess of the inequality levels observed for personal income in developing countries.
Investigating possible sources of this inequality, we identify two potential mechanisms that act at the level of the individual that may play defining roles in the emergence of the broad productivity and impact distributions found in science. First, we show that the average time interval between a researcher’s successive publications in top journals decreases with each subsequent publication. Second, after controlling for the time dependent features of citation distributions, we compare the citation impact of subsequent publications within a researcher’s publication record. We find that as researchers continue to publish in top journals, there is more likely to be a decreasing trend in the relative citation impact with each subsequent publication. This pattern highlights the difficulty of repeatedly producing research findings in the highest citation-impact echelon, as well as the role played by finite career and knowledge life-cycles. It also points to the intriguing possibility of confirmation bias in the evaluation of science careers.
Our focal unit throughout the analysis is the scientific career, even though we use publication and citation counts as the central quantitative measure. Our data comprises 412,498 publications drawn from 23 individual high-impact journals indexed by Thompson Reuters Web of Knowledge (TRWOK). From these data we extracted the publication trajectory of 258,626 individual scientists, where each trajectory is defined within a set of similar journals. The three principal journal sets analyzed are Nature/PNAS/Science, a collection of 14 high-impact economics journals, and a collection of 3 prestigious management science journals. For each analysis, we carefully selected comparable sets of researcher profiles using thresholds that controlled for possible censoring and cohort biases in the data.
By analyzing researcher profiles within prestigious journals, we gather insights into the ascent of top scientists and the operational value of these highly-selective competitive arenas. Our analysis starts with the basic question: How do such skewed achievement distributions emerge, even within the highest-impact journals? To this end, we used the longitudinal aspects of the data to quantify the role of cumulative advantage in science careers, summarized in 3 parts:
(a) What are the levels of “inequality” within these high-impact distributions? For example, for researchers who had their first publication between 1970-1980, we calculated a Gini index (economics) and (Nat./PNAS/Sci.) and found that the top 1% of researchers (comprised of 17 and 139 researchers, respectively) held a significantly disproportionate share of and of the total aggregated across all researchers in each distribution. For perspective, these inequality levels are in excess of those observed for personal income in developing countries. Nevertheless, analysis of for different time periods indicates that both productivity and impact equality is increasing over time.
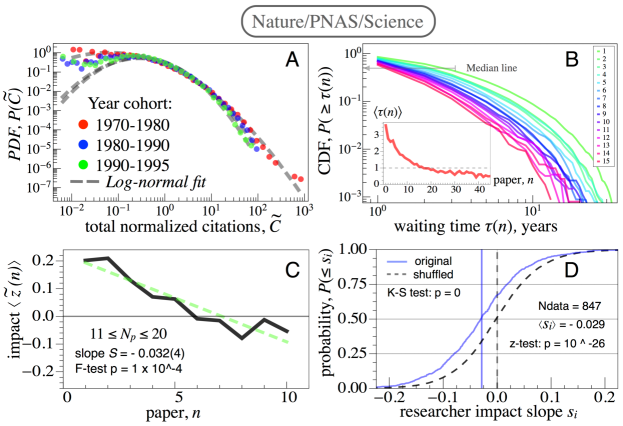
(b) How long does a researcher typically wait before his/her next high-profile publication? For each author, , we define a sequence of waiting times, , for which the entry is the number of years between his/her publication and publication in a given journal set. The longest waiting time is typically between the first and second publication. For example, the average waiting time in both NEJM and Nat./PNAS/Sci. is roughly years, whereas in the biology journal Cell and the physics journal PRL the initial mean waiting times are closer to years. With each successive publication, we found that decreases significantly, so that by the 10th publication the waiting time has decreased to roughly 1/2 of the initial waiting time . This shifting towards smaller waiting times with increasing is further evident in the entire distribution of waiting times, .
(c) Focusing only a researcher’s publications in selective high-impact journals, are a typical researcher’s later publications more or less cited than their previous publications? To investigate the longitudinal variation in the citation impact, we map the citation count of the publication of researcher , published in journal set to a -score,
| (1) |
which allows for comparison across time since publications are measured relative to publications from the same publication year . In order to account for author-specific heterogeneity before we aggregate citation trajectories across scientists, we centered the -score around the mean value calculated for the publications of a given scientist . As a result, we obtain the relative citation impact trajectory,
| (2) |
This normalization also helps in controlling for latent effects caused by disciplinary variation within the aggregated economies and multidisciplinary natural science journal sets, which could affect the overall citation potential of a paper over time. Using these standardized trajectories, we pooled the data across scientists, noting that is still measured in normalized units of the standard deviation . For each journal set we observed a negative trend in (aggregate level) and a significant excess of negative trends in (individual level), see Fig.1 (C,D).
This result is indicative of the complex prestige system in science. Finite career and knowledge lifecycles, as well as the intriguing possibility of identifying institutional confirmation bias in the evaluation process of science careers, likely play a role in this the decreasing trend in . The latter explanation represents a possibly counterproductive role of cumulative advantage in science, since the publication of a high-impact publication early in the career, which may or may not be an appropriate predictor of sustainable impact in the future, nevertheless appears to facilitate additional future opportunities in these highly-competitive journals.