Intervalence Charge Transfer Luminescence: Interplay between anomalous and emissions in Yb-doped fluorite-type crystals.
Abstract
In this paper we report the existence of intervalence charge transfer (IVCT) luminescence in Yb-doped fluorite-type crystals associated with Yb2+–Yb3+ mixed valence pairs. By means of embedded cluster, wave function theory ab initio calculations, we show that the widely studied, very broad band, anomalous emission of Yb2+-doped CaF2 and SrF2, usually associated with impurity-trapped excitons, is, rather, an IVCT luminescence associated with Yb2+–Yb3+ mixed valence pairs. The IVCT luminescence is very efficiently excited by a two-photon upconversion mechanism where each photon provokes the same strong –1–1 absorption in the Yb2+ part of the pair: the first one, from the pair ground state; the second one, from an excited state of the pair whose Yb3+ moiety is in the higher multiplet. The Yb2+–Yb3+ Yb3+–Yb2+ IVCT emission consists of an Yb2+ Yb3+ charge transfer accompanied by a deexcitation within the Yb2+ subshell: [,] [,]. The IVCT vertical transition leaves the oxidized and reduced moieties of the pair after electron transfer very far from their equilibrium structures; this explains the unexpectedly large band width of the emission band and its low peak energy, because the large reorganization energies are substracted from the normal emission. The IVCT energy diagrams resulting from the quantum mechanical calculations explain the different luminescent properties of Yb-doped CaF2, SrF2, BaF2, and SrCl2: the presence of IVCT luminescence in Yb-doped CaF2 and SrF2; its coexistence with regular - emission in SrF2; its absence in BaF2 and SrCl2; the quenching of all emissions in BaF2; and the presence of additional – emissions in SrCl2 which are absent in SrF2. They also allow to interpret and reproduce recent experiments on transient photoluminescence enhancement in Yb2+-doped CaF2 and SrF2, the appearence of Yb2+ – absorption bands in the excitation spectra of the IR Yb3+ emission in partly reduced CaF2:Yb3+ samples, and to identify the broad band observed in the excitation spectrum of the so far called anomalous emission of SrF2:Yb2+ as an IVCT absorption, which corresponds to an Yb2+ Yb3+ electron transfer.
I Introduction
The capability of lanthanide ion dopants to luminesce from their and/or excited states has granted them a prominent role as activators in solid state lighting, lasers, fiber amplifiers, and medical imaging devices. van Eijk (2002); Liu and Jacquier (2005); Ronda (2007); Weber (2002) Frequently, however, their applicability is compromised by quenching or by replacement of the expected luminescence by an anomalous emission. Detailed understanding of these mechanisms is important in the search for new interesting phosphor and scintillating materials based on lanthanide ion activators.
The anomalous emission of Yb2+ in Yb-doped materials is a prototypical case (for a review on the anomalous emission of Yb2+ and Eu2+-doped crystals, see Ref. Dorenbos, 2003). The interplay between anomalous and – emissions in Yb2+-doped fluorite-type crystals results in a complex electronic spectroscopy, which has been the focus of investigations for decades. Feofilov (1956); Kaplyanskii and Feofilov (1962); Reut (1976); McClure and Pédrini (1985); B. Moine, C. Pédrini, D. S. McClure and Bill (1988); B. Moine, B. Courtois and Pédrini (1989); Dorenbos (2003); Kaczmarek et al. (2005); M. F. Reid, P. S. Senanayake, J.-P. R. Wells, G. Berden, A. Meijerink, A. J. Salkeld, C.-K. Duan and R. J. Reeves (2011); P. S. Senanayake, J. P. R. Wells, M. F. Reid, G. Berden, A. Meijerink and R. J. Reeves (2013) The adjective anomalous has been used to reflect the irregular, unexpected, very large Stokes shift of the emission observed, with respect to the excitation, which makes the red shifted emission band extremely broad. When Yb2+ is doped in CaF2, the anomalous emission prevails; Feofilov (1956); Kaplyanskii and Feofilov (1962); Reut (1976); B. Moine, B. Courtois and Pédrini (1989); M. F. Reid, P. S. Senanayake, J.-P. R. Wells, G. Berden, A. Meijerink, A. J. Salkeld, C.-K. Duan and R. J. Reeves (2011) it also occurs in SrF2, where both, anomalous emission and regular luminescence have been detected together; Reut (1976); McClure and Pédrini (1985); B. Moine, C. Pédrini, D. S. McClure and Bill (1988); P. S. Senanayake, J. P. R. Wells, M. F. Reid, G. Berden, A. Meijerink and R. J. Reeves (2013) and no emission whatsoever occurs in BaF2 up to 1.5m. Reut (1976); B. Moine, B. Courtois and Pédrini (1989) Changing the ligand, as in the SrF2 and SrCl2 series, also affects the interplay. The dual character of the luminescence of Yb in SrF2 disappears in the SrCl2 host, where the anomalous emission is not observed; only regular – emission bands have been assigned in this case showing a complex temperature behaviour. WIT ; Pan et al. (2008) Analyses of spectroscopic data have suggested that the anomalous emission observed in Yb2+-doped CaF2 and SrF2 is associated with an excited state which has a "radically different" (smaller) radiative rate compared with that of higher lying levels. B. Moine, B. Courtois and Pédrini (1989); M. F. Reid, P. S. Senanayake, J.-P. R. Wells, G. Berden, A. Meijerink, A. J. Salkeld, C.-K. Duan and R. J. Reeves (2011) This characteristic has allowed the application of a two-frequency UV + IR transient photoluminescence enhancement technique which ultimately produces the IR excited state absorption spectrum (ESA) from the lowest anomalous state to close lying energy levels. M. F. Reid, P. S. Senanayake, J.-P. R. Wells, G. Berden, A. Meijerink, A. J. Salkeld, C.-K. Duan and R. J. Reeves (2011); P. S. Senanayake, J. P. R. Wells, M. F. Reid, G. Berden, A. Meijerink and R. J. Reeves (2013) The anomalous emission of Yb has also been observed in Yb3+-doped CaF2 after application of reducing conditions. Kaczmarek et al. (2005)
Analogous competitions between regular – (as well as –) and anomalous emissions have been reported involving other commonly used lanthanide ion activators: Ce3+, Pr3+, and Eu2+. Reut (1976); McClure and Pédrini (1985); Dorenbos (2003); Bessière et al. (2004, 2006); Grinberg (2011) For all of them (including Yb2+), it is recognized that it is difficult to prevent the coexistence of another different valence state, Loh (1968, 1969); WIT ; Reut (1976); Pan et al. (2008); L. Su, J. Xu, H. Li, L. Wen, W. Yang, Z. Zhao, J. Si, Y. Dong and Zhou (2005); L. Su, J. Xu, H. Li, L. Wen, Y. Zhu, Z. Zhao, Y. Dong, G. Zhou and Si (2005) which means that the formation of mixed valence pairs, that is, pairs between two metal sites differing only in oxidation state, is very likely. In this way, occurrence of Ce3+–Ce4+, Pr3+–Pr4+, Eu2+–Eu3+, and Yb2+–Yb3+ mixed valence pairs should be expected, to some extent. In this paper we show that the study of the electronic structure of Yb2+–Yb3+ mixed valence pairs is crucial to understand anomalous emission and its interplay with regular emissions in Yb-doped fluorite-type crystals. The same is true for Ce3+–Ce4+ pairs, as we show in an analogous study of the anomalous emission in Ce3+-doped Cs2LiLuF6 elpasolite. SEI
Since mixed valence pairs (for lanthanides: Lnn+-Ln(n+1)+) constitute a donor–acceptor () redox system, electron transfer between the donor and acceptor sites, Lnn+ + Ln(n+1)+ Ln(n+1)+ + Lnn+, may occur, and the process can be referred to as an intervalence charge transfer (IVCT), Verhoeven (1996) in analogy with the IVCT processes that have been investigated involving mostly mixed valence transition metal compounds Marcus (1964); Allen and Hush (1967); Hush (1967); Robin and Day (1968); Piepho et al. (1975) and, scarcely, lanthanide ions. Blasse (1991); van Schaik et al. (1993) Although most IVCT studies refer to thermally and radiatively induced electron transfer between the ground states of the donor and acceptor sites, we show here that the reaction can involve many of the excited electronic states of the mixed valence pair and lead to a variety of non-radiative and radiative IVCT processes.
The goal of this paper is to show that all of the spectral features we have summarized above for Yb2+-doped CaF2, SrF2, BaF2, and SrCl2 hosts can be explained if the existence of Yb2+–Yb3+ mixed valence pairs is assumed, ab initio multielectronic wavefunction-based diabatic potential energy surfaces of the ground and excited states of the embedded Yb2+–Yb3+ active pairs are calculated, and quantitative energy diagrams for the Yb2+ + Yb3+ Yb3+ + Yb2+ electron transfer reaction, along well defined reaction coordinates, are produced. In this framework, the anomalous emission of Yb-doped fluorite-type crystals is interpreted as an Yb2+–Yb3+ Yb3+–Yb2+ IVCT emission, in which an Yb2+ Yb3+ electron transfer and a deexcitation within the Yb2+ subshell take place: [,] [,]. So, the bielectronic character of this IVCT luminescence explains the very slow radiative decay rate of the so far called anomalous emission. Its very large band width comes from the large change in the electron transfer reaction coordinate accompanying the electronic transition: = 0.49 Å (CaF2), 0.60 Å (SrF2). Its occurrence and temperature quenching in CaF2 and SrF2, including its coexistence with regular – emission in SrF2 below 140 K, or its abscence in BaF2 and SrCl2, including the absence of any emission in BaF2, can be understood on the basis of changes in the topology of the diabatic IVCT energy diagrams of the Yb2+–Yb3+ invervalence pairs in the different hosts. The IR ESA spectra measured in CaF2 and SrF2 are also reproduced, showing a close, upper lying state, which may contribute a much faster monoelectronic Yb2+ Yb3+ IVCT emission, plus a number of other close lying upper levels which contribute to the transient photoluminescence enhancement.
In parallel to this work, we are presenting analogous studies on the nature of the anomalous luminescence of Ce-doped Cs2LiLuCl6 and its interplay with regular emissions. SEI There, the fast anomalous emission of Ce is identified as a monoelectronic Ce3+ Ce4+ IVCT luminescence, which is observed and calculated to be above the lowest, regular emission of the Ce3+ active center. That work and the present paper are part of an effort focused on assessing and showing the relevance of intervalence charge transfer processes in the optical properties of very common lanthanide ions activators. Both works show that IVCT luminescence has been observed experimentally, but has not been identified as such, neither in Yb2+-doped nor in Ce3+-doped crystals. The same is true for other IVCT processes which are predicted and have not been identified or observed (i.e. transient IVCT photoluminescence enhancement, other IVCT absorptions, emissions, and non-radiative energy transfers). Altogether, the results presented so far suggest that the theoretical effort should continue and cover other common hosts and activators like those mentioned above; they also suggest that incorporating quantitative IVCT energy diagrams to experimental analyses should be useful. BAR (a)
This paper is organized as follows: In Sec. II we describe the ab initio calculation of intervalence charge transfer potential energy surfaces of Yb2+-Yb3+ pairs in fluorite-type crystals and the corresponding IVCT configuration coordinate diagrams. In Sec. III we interpret the anomalous luminescence of CaF2:Yb2+ as an IVCT luminescence, we explain its mechanism and we discuss the involvement of IVCT states in transient photoluminescence enhancement experiments and in the excitation of the IR Yb3+ emission by Yb2+ – absorptions. Finally, in Sec. IV we show that changes in the topology of the IVCT energy diagrams account for the interplay between IVCT and regular – emissions in the chemical series of fluorite-type crystals CaF2, SrF2, BaF2 (Sec. IV.1) and SrF2, SrCl2 (Sec. IV.2). The conclusions are summarized in Sec. V.
II Potential energy surfaces of Yb2+–Yb3+ active pairs in fluorite-type crystals
In this Section we describe how the diabatic potential energy surfaces of the ground and excited states of Yb2+–Yb3+ mixed valence active pairs can be calculated in the CaF2, SrF2, BaF2, and SrCl2 (MX2) hosts using the potential energy surfaces obtained from independent Yb2+ and Yb3+ embedded cluster calculations as building blocks. From them, quantitative IVCT energy diagrams can be built in terms of normal electron transfer reaction coordinates which involve concerted vibrational breathing modes of the donor (YbX8)6- and acceptor (YbX8)5- sites. The approximations involved in this procedure are outlined; their accuracy is expected to be sufficient to achieve the goals of this work, which have been stated in the Introduction.
II.1 Yb2+–Yb3+ diabatic potential energy surfaces
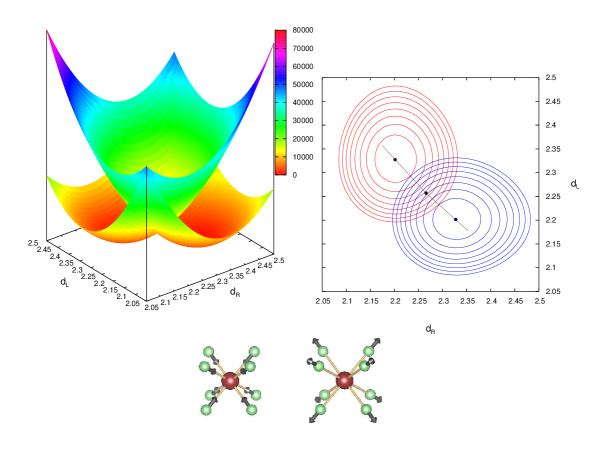
A convenient definition for the diabatic wavefunctions and energies of the Yb2+–Yb3+ mixed valence pairs can be set up using generalized antisymmetric product functions McWeeny (1959) resulting from the combination of the states of the donor , and states of the acceptor sites, which in this work are the states of the , , , and manifolds of the donor (YbX8)6- and those of the manifold of the acceptor (YbX8)5- separated embedded clusters, respectively. So, from the combination of the state of , , and the state of , , two diabatic wavefunctions are obtained: one for the state of , , and one for the state of , ( is a normalization constant and is the inter-group antisymmetrization operator McWeeny (1959)), where and refer to the mixed valence pairs before and after electron transfer: Yb2+–Yb3+ and Yb3+–Yb2+, respectively. These two diabatic wavefunctions will be needed to study the electron transfer (YbX8)–(YbX8)(YbX8)–(YbX8) from the left to the right moieties of the mixed valence pair embedded in the MX2 solid. Altogether, a basis of 2 diabatic wavefunctions are obtained. The two corresponding diabatic potential energy surfaces and are the expected values of the fixed nuclei Hamiltonian of the embedded pair : , . Given that the electronic spectroscopic transitions are dominated by the totally symmetric vibrational coordinates, the breathing modes of the donor (YbX8)6- and acceptor (YbX8)5- sites are the only vibrational degrees of freedom we will consider, which results in the parametric dependence of the diabatic potential energy surfaces on the Yb–X distance in the left and right components of the and pairs, and : and . Note that . The two diabatic potential energy surfaces for the ground state of the Yb2+–Yb3+ mixed valence pair in Yb-doped CaF2, and , can be seen in Fig. 1.
It is important to note that in this work the electronic coupling between any two diabatic states of and of , , will be neglected for all values of the and coordinates. As a consequence, there will be no avoided crossings among the diabatic potential energy surfaces nor mixings between the diatabic states. Whereas this approximation can be expected to be a good one away from the intersection regions, it becomes weaker on them, since the diabatic energies at intersections give upperbounds to the energy barriers that would result from avoided crossings should the electronic couplings be considered. We comment further on this issue in the next section where diabatic energy diagrams for the electron transfer reactions will be extracted from the diabatic energy surfaces. As we will show in this work, many spectroscopic features of the mixed valence pairs can be addressed quantitatively or semiquantitatively within the diabatic approximation, using the diabatic energy surfaces only. We describe next how they will be computed in this work.
According to the group function theory used to define the diabatic wavefunctions of the mixed valence pairs, the diabatic pair energies are the sum of the donor and acceptor energies plus their mutual Coulomb and exchange interaction. McWeeny (1959) The latter should be almost independent of the donor and acceptor states, in general. Hence, we can write:
| (1) |
In Eq. 1, and include the embedding interactions of and with the crystalline environment of the pair in the MX2 crystal. In this work, we will compute using the energy curves obtained from independent donor (YbX8)6- and acceptor (YbX8)5- clusters embedded in the perfect MX2 hosts, as building blocks. According to this alternative we will use:
| (2) |
where and are the independent embedded cluster energy curves of the donor and acceptor obtained as described in Sec. II.2, and
| (3) | |||||
with (or ) standing for the Coulomb and exchange interaction energy between the donor (YbX8)6- (or acceptor (YbX8)5-) cluster and the cluster of the original host cation (MX (M: Ca2+, Sr2+, or Ba2+, in this case). Except for short cation-cation distances, . In any case, the term is common to the and energy surfaces and to all states of both. Its effect is a common shift of all of them and, consequently, it does not contribute to energy differences between them.
In this alternative, the symmetry reductions around and due to the presence of the other ( and , respectively) are not considered. Therefore, the energy splittings driven by symmetry lowering, which are dependent on the distance and relative orientation between and , are not obtained. The most important ones in the present work would be the splittings produced on the (YbX8)6- levels by the presence of the Yb3+ substitutional ion. Yet, whereas such site symmetry reductions would add significant conputational effort to the embedded cluster calculations, the corresponding splittings would only be responsible for fine structure features of the spectra; they would neither affect the positions nor the number of the main absorption and emission bands. Therefore, the alternative chosen in this work will be able to capture the basics of the energy surfaces of the pairs by means of completely independent calculations on the and embedded clusters. This is the strength of the present approach.
II.2 Independent embedded cluster calculations
In this Section we describe the details and summarize the results of the quantum mechanical calculations of the () and () components of the mixed valence pair energies in Eq. 2. As donor and acceptor we adopted, respectively, the (YbX8)6- and (YbX8)5- clusters (X= F, Cl) . We performed ab initio wave function theory embedded cluster quantum chemical calculations on these clusters embedded in the MX2 hosts, with the MOLCAS suite of programs. Karlström et al. (2003) The calculations include bonding interactions, static and dynamic electron correlation effects, and scalar and spin-orbit coupling relativistic effects within the clusters, which are treated at a high theoretical level. They also include Coulomb, exchange, and Pauli repulsion interations between the host and the clusters, which are considered at a lower theoretical level by means of a quantum mechanical embedding potential. Electron correlation effects between the cluster and the host are excluded from these calculations.
II.2.1 Details of the quantum mechanical calculations
The calculations presented here assume that Yb2+ and Yb3+ ions substitute for M2+ (M2+= Ca2+, Sr2+, Ba2+) and occupy cubic sites in the perfect fluorite structures. Wyckoff (1982) Following the embedded-cluster approximation, the imperfect crystals were divided into the defect cluster and the embedding host, which were represented as follows.
The embedded-cluster scalar relativistic second-order Douglas-Kroll-Hess Hamiltonian Douglas and Kroll (1974); Hess (1986) and wave functions, comprising the Yb impurity at (0,0,0) and eight X ligands at variable (x,x,x), included all the electrons of Yb2+ or Yb3+ and eight X-. The basis sets used to expand the cluster molecular orbitals included the all electron ANO-RCC bases Yb (25s22p15d11f4g2h) [9s8p5d4f3g2h], F (14s9p4d3f2g) [5s4p3d] or Cl (17s12p5d4f2g) [6s5p3d]. Roos et al. (2005, 2008) In addition, the highest occupied and orbitals of the embedding M2+ ions, contracted as Ca2+ (20s15p)[1s1p], Sr2+ (23s19p)[1s1p], Ba2+ (27s23p)[1s1p], were used as orthogonalization functions at the 12 second neighbour sites (,,0), to fulfil strong orthogonality, and 5 -type Gaussian type functions were used at the six (,0,0) interstitial sites surrounding the YbX8 cube in the fluorite structures; their orbital exponents were optimized to give minimal impurity-trapped exciton energy. The embedded-cluster calculations were performed using symmetry.
AIMP embedding potentials were used in the embedded-cluster Hamiltonian to represent the host effects due to interactions with the remainder of the crystal ions, which include quantum mechanical embedding effects associated with exchange and Pauli repulsion, in addition to Coulomb electron repulsion and Madelung interactions. Barandiarán and Seijo (1988); Seijo and Barandiarán (1999) The embedding potentials for all four MX2 hosts were obtained in this work to represent the M2+ and X- ions located outside the cluster, at their cubic crystal structure sites [Group 225, , = 5.46294 Å (CaF2), 5.796 Å (SrF2), 6.2001 Å (BaF2), 6.9744 Å (SrCl2) Wyckoff (1982)]; the potentials were obtained by performing self-consistent embedded M2+ and F- ions calculations at the Hartree-Fock level on the perfect host crystal as described in Ref. Seijo and Barandiarán, 1999. All ions located in a cube of 777 unit cells, centered at the impurity site, were represented by their total ion embedding AIMP; an additional set of 2781 point charges was used to ensure that the Ewald potential is reproduced within the cluster volume. These charges were obtained following the zero multipole method of Gellé and Le Petit. Gellé and Lepetit (2008)
A recent study on radial correlation effects on interconfigurational transitions at the end of the lanthanide series has revealed that to double excitations must be included at the variational multiconfigurational self-consistent field step preceding second order perturbation theory calculations. Barandiarán and Seijo (2013) Consequently, state-average restricted active space self-consistent field (RASSCF) J. Olsen, B. O. Roos, P. Jørgensen, and Jensen (1988); Malmqvist et al. (1990); P.-Å. Malmqvist, K. Pierloot, A. R. Moughal Shahi, C. J. Cramer and L. Gagliardi (2008) calculations were done on the (YbX8)6- and (YbX8)5- embedded clusters including to single and double excitations from the and reference to calculate the – ground state, and the , , and states of the manifold, whereas single excitations from the reference to one shell and to the shell (which belong to the and irreducible representations) were also allowed to provide the minimal configurational space required for the spectroscopy of the (YbX8)6- cluster, plus additional single and double excitations from the shell to the shell to account for the large change of radial correlation upon electronic transitions. These calculations are referred here as RASSCF(-//-), which indicates the maximum number of holes allowed in the shell and the maximum number of electrons allowed in the empty and 5d shells to calculate the states of the = , , , , octahedral irreps.
Once these wave functions are obtained, they become the multireference for multistate second onder perturbation theory calculations (MS-RASPT2), Zaitsevskii and Malrieu (1995); Finley et al. (1998); P.-Å. Malmqvist, K. Pierloot, A. R. Moughal Shahi, C. J. Cramer and L. Gagliardi (2008) which include dynamic electron correlation, also necessary for getting sufficient precission in the structure and electronic transition data. At this level, all valence electrons of the embedded-cluster were correlated, which amounts to 86 and 85 electrons (Yb: 22 or 21; eight X: 64). We used the standard IPEA parameter value (0.25 a.u.) introduced in Ref. G. Ghigo, B. O. Roos, and P.-Å. Malmqvist, 2004 as a simple way to correct for systematic underestimations of CASPT2 transition energies from closed-shell ground states to open-shell excited states, also recommended for other cases. An imaginary shift of 0.1 was also used to avoid intruder states. Forsberg and Malmqvist (1997)
The highly correlated wavefunctions and energies resulting from the previous spin-orbit free step, namely, the eigenvectors (which are transformed RASSCF wave functions) and eigenvalues (MS-RASPT2 energies) of the spin-orbit free effective Hamiltonian computed at the MS-RASPT2 step, were transferred and used in the last step of spin-orbit coupling calculations, which used the restricted-active-space state interaction method (RASSI-SO). Malmqvist et al. (2002) The transformed RASSCF wave functions were used to compute the spin-orbit coupling matrix resulting from adding the AMFI approximation of the Douglas-Kroll-Hess spin-orbit coupling operator Hess et al. (1996) to the scalar relativistic Hamiltonian. Given that symmetry was used, the MS-RASPT2 energies show slight degeneracy breakings which would spread further throughout the spin-orbit calculation. Hence, the spin-free-state-shifting technique was used to substitute them for averaged values which were used in the diagonal elements of the spin-orbit coupling matrix. The calculation and diagonalization of the transformed RASSCF spin-orbit interaction matrix leads to the final results of the ab initio calculations on the independent (YbX8)6- and (YbX8)5- active centers, which can be used in Eq. 2 to compute the diabatic potential energy surfaces of the (YbX8)6-–(YbX8)5- mixed valence active pairs.
II.2.2 Energy curves of Yb2+ and Yb3+ independent active centers
The results of the quantum mechanical calculations on the donor (YbX8)6- and acceptor (YbX8)5- cubic clusters embedded in the four MX2 hosts are collected in the Suplementary Material of this paper, where the details of the electronic structure of the ground and excited states of the Yb2+ and Yb3+ active centers are presented. Sup Tables I to IV of Ref. Sup, include the Yb–X equilibrium bond distance, totally symmetric vibrational frequency, minimum-to-minimum energy differences relative to the –1 ground state, and analyses of the spin-orbit wavefunctions of all 7 , 7 , 14 , 21 , and 21 spin-orbit levels calculated. They also include the results for the electronic states of the configuration of the Yb3+ active centers. Plots of their energy curves the Yb–X bond distance at different levels of methodology (RASSCF, MS-RASPT2, and RASSI-SO) and the calculated absorption spectra are also presented in Figures 1 to 5 of Ref. Sup, . The data of only the lowest levels (14 of Yb2+ and 5 of Yb3+) in CaF2 are presented here in Table LABEL:TAB:Ca-SpinOrbit-short; selected energy curves are presented in the left graphs of Fig. 2; all the energy curves are presented in the left grpah of Fig. 3.
The excited states of Yb2+ in the four hosts appear to be grouped in four manifolds of impurity states (see Table LABEL:TAB:Ca-SpinOrbit-short and left graph of Fig. 3 for CaF2): , , , and , and two of impurity-trapped excitons (ITE): and , which, in some cases, show significant configurational interaction. The more delocalized ITE states, whose electronic structure shows the same characteristics as those found in previous quantum mechanical studies on U4+-doped Cs2GeF6, Ordejón et al. (2007) and Yb2+-doped SrCl2, Sánchez-Sanz et al. (2010a) appear above the lowest impurity manifold in all four hosts. The lowest excited states of Yb2+ are, in all cases, the electric dipole forbidden 1, 1, and the electric dipole allowed 1 states. (In all figures, blue and green colours have been used for the energy curves of the and , manifolds, respectively; maroon has been used when they interact among themselves or with ITE states. Black has been used for the Yb2+ ground state and for the lowest manifold of Yb3+; red is used for the higher components.)
The present ab initio results and those of calculations presented elsewhere, BAR (b) especially designed to allow the wavefunctions of excited states to spread electron density beyond first neighbours, over the twelve next Ca2+ or Sr2+ ions, as proposed by McClure and Pédrini for impurity-trapped excitons, McClure and Pédrini (1985); B. Moine, B. Courtois and Pédrini (1989) allow to conclude that none of the electronic states of the Yb2+ active centers can be considered responsible for the anomalous emission observed in the CaF2 and SrF2 hosts. Therefore, the hypothesis of the impurity-trapped excitons being responsible for the anomalous emission McClure and Pédrini (1985); B. Moine, B. Courtois and Pédrini (1989) is not supported by the ab initio quantum mechanical calculations. Impurity-trapped excitons show up in the calculations, but at much higher energies than those that would allow them to play a role in the anomalous emission. As we show in Sec.III and IV, intervalence charge transfer within the Yb2+–Yb3+ active pairs has to be invoked instead.
II.3 Quantitative energy diagrams for Yb2+–Yb3+ intervalence charge transfer reaction
Even though the calculation of the two diabatic potential energy surfaces and associated with each state of the embedded pair before and after electron transfer is necessary for the obtention of the structural and energetic results discussed in this paper (note that any of the MX2:Yb2+–Yb3+ excited states lead to two energy surfaces like those for the ground state presented in Fig. 1, which would make their joint plot extremely crowded and cumbersome), the extraction of the minimal energy electron transfer reaction path from them is a very important step leading to quantitative IVCT energy diagrams which will be actually used to discuss IVCT luminescence and other radiative and non-radiative IVCT processes in Sec. III and IV. In this Section we explain how these diagrams are built: In a first step, the normal electron transfer reaction coordinate for the ground state of the mixed valence pair, , will be defined from the topology of the and energy surfaces, in terms of concerted vibrational breathing modes of the donor and acceptor sites, which leads to the diabatic () and () branches for the reaction. In a second step, the energy curves of the excited states of the mixed valence pairs will be evaluated at the , coordinate values which correspond to the axis, leading to () and () branches for all states of interest and, hence, to the final quantitative IVCT diagram. The same procedure would be applicable to any other two and diabatic surfaces, which would lead to analogous energy diagrams along corresponding reaction coordinates.
II.3.1 Electron transfer reaction coordinate
Within the diabatic approximation, the two symmetric diabatic energy surfaces involved in the electron transfer reaction between the and ground states, and , do intersect, without avoiding crossing, at all points (see Fig. 1), where they are degenerate, while the corresponding pair wavefunctions and never mix, but keep their pure character. In this way, the electron transfer reaction path (see Fig. 1, top right graph) connects the energy minimum of the (YbX8)–(YbX8) pair, =, for which the (YbX8) and (YbX8) clusters are at their Yb–X equilibrium distance, and , with that of the symmetrical minimum of the (YbX8)–(YbX8) pair, =, at the , point, crossing from the to the surface through the activated complex, which is the crossing point with minimal energy, equal sharing of the transferred electron, and equal Yb–X bond distance for the left and right clusters of the and pairs, . The diabatic electron transfer activation energy: , is an upperbound to the energy barrier that would result from avoided crossings should the electronic coupling between the two energy surfaces be considered. Whereas the diabatic activation energy is independent from the distance between the and moieties of the pairs, , the adiabatic energy barrier is -dependent. As commented above, it is close to the activated complex structure where the diabatic approximation is weakest.
The ground state diabatic reaction coordinate (for simplicity we will drop the superscript in from now on) can be aproximated with the straight lines that connect the activated complex with the two minima and . This reaction coordinate is represented in Fig. 1 in the - plane. The pair has the lowest diabatic energy in the left side of the activation complex () and the pair in the right side (), in correspondance with the larger size of at equilibrium. Since these lines contain the most interesting information of the diabatic energy surfaces, it is convenient to plot them in energy diagrams along the reaction coordinate: () and () instead of the more cumbersome –dependent energy surfaces, and , as mentioned above.
For a precise definition of , we can recall that the changes of the Yb–X distances in the left and right clusters and along the reaction coordinate fulfil
| (6) |
Then, the normal reaction coordinate can be written as
| (7) |
and being the normal breathing modes of the left and right YbX8 moieties with respect to their structures in the activated complex:
| (8) |
which have been expressed in terms of the displacements and of the X ligand atoms in the left and right YbX8 moieties away from their respective Yb atoms, starting from the positions they occupy in the activated complex. A graphical representation of the X displacements along is shown in Fig. 1 (bottom graph). Since the left and right cluster breathings imply and , we can write
| (9) |
and
| (10) | |||||
We may mention the relationship of this reaction coordinate and the one of the vibronic model of Piepho et al.. Piepho et al. (1975) The latter correspons to , which implies and gives .
II.3.2 Quantitative Yb2+–Yb3+ IVCT energy diagrams
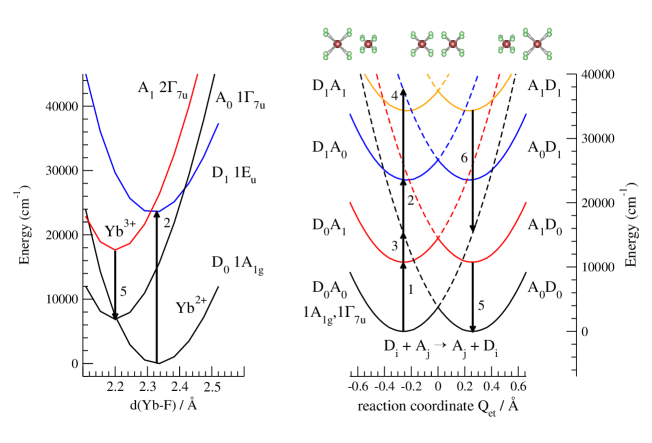
According to Eq. 2 and Eqs. 6–10, quantitative IVCT energy diagrams for the embedded Yb2+–Yb3+ active pairs can be obtained using the energy curves resulting from the independent embedded cluster calculations of the electronic states of the donor (YbX8)6- and acceptor (YbX8)5- active centers described in Sec. II.2. We illustrate here how this is done using the energy curves of only two electronic states for the donor and acceptor clusters embedded in CaF2, (): the ground state and one excited state, which have been plotted in the left graph of Fig. 2. The IVCT energy diagram resulting from them, which includes diabatic mixed valence pair states, is plotted in the right graph of Fig. 2 and is described next. The much more dense IVCT energy diagrams used below in this paper result from obvious extensions which use the complete manifold of excited states calculated for the separated active centers.
Using the energy curves of the 1 and 1 ground states of the Yb2+ and Yb3+ doped CaF2 (see Table LABEL:TAB:Ca-SpinOrbit-short), the diabatic potential energy surfaces and , for the pair before (YbX8)–(YbX8) [1,1] and after (YbX8)–(YbX8) [1,1] electron transfer, are obtained from Eq. 2. From any of them, the activated complex structure, =2.261 Å, is obtained searching for the minimal energy along the axis. Using this value, plus the Yb–F equilibrium distances of the independent embedded cluster ground states, =2.329 Å (1) and =2.201 Å (1), respectively, the diabatic electron transfer reaction coordinate for the ground state of the mixed valence pair is defined from Eqs. 6–10, and the two mixed valence pair ground state branches [1,1] and [1,1] are obtained; they are plotted in black in the right graph of Fig. 2. The two diabatic energy curves cross at the activated complex structure (=0 Å; Å; =3774 cm-1). In the structures of the pair around the minimum of the state [1,1] (= –0.256 Å;=2.329, =2.201 Å), the complementary state [1,1] has a much higher energy because the oxidized and reduced moieties, and , are under strong structural stress. The opposite is true around the minimum of the state [1,1]. We indicate this in the energy diagram by representing the energy of a given mixed valence pair state with full lines when it is around its minimum, and with dashed lines when it is under strong stress. Computing the energies of the excited states of the pairs at the values corresponding to the ground state electron transfer coordinate we obtained the energy curves of the states [1,2] (red), [1,1] (blue), and [1,2] (orange), plus their IVCT counterparts. They are plotted in the right graph of Fig. 2 using the above definition of solid and dashed lines.
The quantitative IVCT diagram shown in Fig. 2 can be used to read different types of processes.
The thermally induced ground state intervalence electron transfer reaction, Yb2+–Yb3+ [1,1] Yb3+–Yb2+ [1,1], with an upperbound activation energy barrier of 3774 cm-1 (black, solid line connecting the two equivalent ground state minima through the activated complex).
Vertical absorptions of the independent active centers, which occur at their (fixed) ground state structure, such as: the Yb3+ - absorption , at a Yb3+-F distance 2.201 Å (, arrow 1), and the Yb2+ - absorption , at a Yb2+-F distance 2.329 Å (, arrow 2). These transitions are the same read in the energy curves of the independent active centers in the left graph of Fig. 2.
Vertical IVCT absorptions from the pair ground state, at fixed =–0.256 Å, which means a left Yb-F distance 2.329 Å and a right Yb-F distance 2.201 Å. The initial pair (YbX8)–(YbX8) is relaxed and, after the radiatively induced electron transfer, the final pair (YbX8)–(YbX8) is very stressed and far from equilibrium. These absortion bands are very wide. There is a lowest IVCT absorption (, arrow 3), which leads to the photoinduced ground state electron transfer reaction after nonradiative decay, and higher lying IVCT absorptions, like (arrow 4).
Electron transfer non-radiative decays to the ground state or to excited states of the pair can also be visualized in the IVCT energy diagram, like the or the decays. In this cases, although the IVCT diagram is very helpul identifying the most probable decay mechanisms, the corresponding energy barriers have to be found in the full diabatic potential energy surfaces involved, and , because they may occur at , points not corresponding to the ground state electron transfer reaction coordinate axis.
Finally, vertical emissions can also be discussed using the IVCT energy diagrams in analogous terms as we have discussed vertical absorptions above. These can be regular emissions of the independent acive centers, like (arrrow 5), and IVCT emissions, like (arrow 6). Rigorously, the electron transfer reaction coordinate axis should correspond to the emitting state of the pair. Yet, the IVCT diagram obtained for the and axes are very similar in most cases. Hence, although the transition energies tabulated in this work will be calculated rigorously, we will use the ground state IVCT energy diagram to discuss absorption, decays, and emission processes altogether. Therefore, independent active center emissions and IVCT emissions will be discussed in analogous terms as the independent active center absorptions and IVCT absorptions, with obvious substitutions of the fixed values involved in the radiative processes and their effects on the emission band structure.
III IVCT luminescence in CaF2:Yb2+
In this Section we present and discuss in detail the IVCT luminescence of CaF2:Yb2+. The manifolds of excited states of Yb2+–Yb3+ pairs in CaF2 are introduced in Sec. III.1 and they are used to interpret the anomalous luminescence of CaF2:Yb2+ as an IVCT luminescence in Sec. III.2, where its mechanism is discussed in detail. Additionally, we discuss two experiments that reinforce the involvement of IVCT states: Firstly, in Sec. III.3 we show that the transient photoluminescence enhancement measured via two-frequency excitation experiments can be interpreted, in detail, as an IVCT photoluminescence enhancement experiment; then, in Sec. III.4 we show that the IVCT model also explains the excitation of the IR Yb3+ emission by Yb2+ – absorptions.
III.1 Excited states of Yb2+–Yb3+ pairs
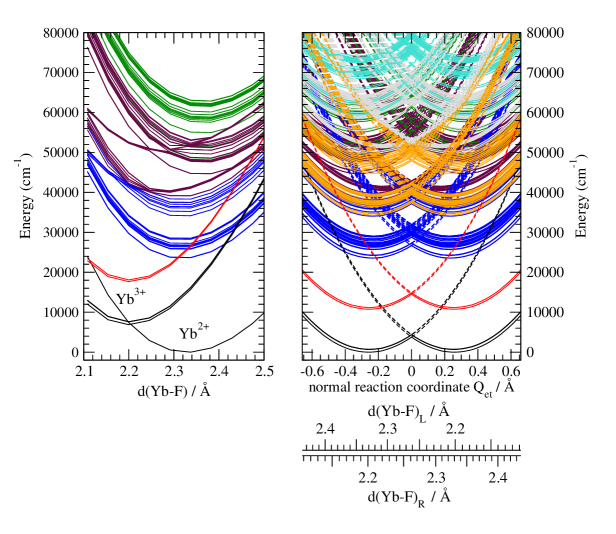
The full diabatic IVCT energy diagram for the ground and excited states of the Yb2+–Yb3+ pairs in CaF2, along the normal reaction coordinate of the ground state, can be seen in Fig. 3. It has been built using all the parent independent embedded cluster energy curves plotted in the left graph, following the procedure explained in Section II.3.2. The vertical transition energies from the Yb2+–Yb3+ [1,1] ground state minimum (= –0.256, ,= 2.330,2.201 Å; zero energy in the diagram), which can be read directly from the diagram, are also collected in Table LABEL:TAB:CaSrF2-YbIIYbIII. As indicated in the Table, only the excited states which are relevant for the discussions of this paper have been tabulated; the remaining data is available in Ref. Sup, . Vertical transition energies from the minima of other two electronic states of the Yb2+–Yb3+ pairs, [1,2] and [2,1], have also been included in Table LABEL:TAB:CaSrF2-YbIIYbIII. In the [1,2] state the (YbX8)5- right moiety of the Yb2+–Yb3+ pair is excited in the lowest of the (5/2) levels; in the [2,1] state the (YbX8)6- left moiety is excited in the lowest of levels (cf. symmetry labels and configurational character of the parent independent embedded cluster states in Table LABEL:TAB:Ca-SpinOrbit-short). Vertical absorptions and emissions from their minima will be used in the next subsections; however, their values cannot be read directly from the IVCT diagram of Fig. 3, since its electron transfer reaction coordinate is that of the ground state. Specific IVCT diagrams along the [1,2] and [2,1] reaction coordinates would have to be constructed using Eqs. 6–10 and the procedure outlined in Sec. II.3.2. However, the similarity of all three IVCT diagrams allows to visualize the data from Table LABEL:TAB:CaSrF2-YbIIYbIII in Fig. 3.
Diabatic energy barriers for the IVCT reaction Yb2+–Yb3+ Yb3+–Yb2+, connecting two different electronic states of the pairs: [] [], have been included in Table 3 for the forward and backwards reactions, together with the , coordinates of their activated complex point, since they play an important role in non-radiative decay pathways, as discussed below. The forward/backwards energy barriers have been calculated searching for the activated complex point of the [] [] reaction directly along the intersection points of the two and energy surfaces. Again, even though the activated complex , structures gathered in the Table do not necessarily fall in the ground state electron transfer reaction coordinate of Fig. 3, they are not far from the crossing points of their respective () and () branches; so, they can be visualized in Fig. 3.
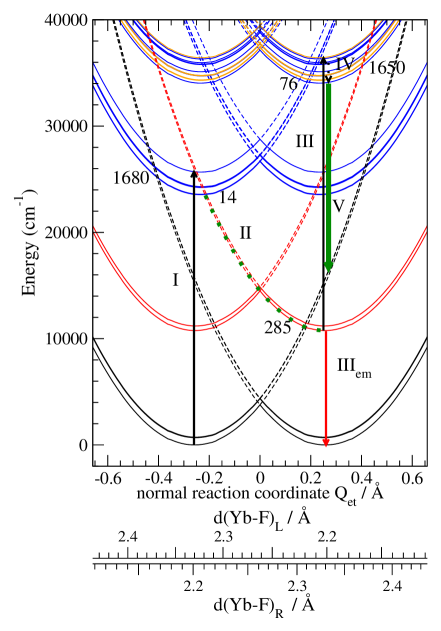
In the following and for clarity, the IVCT energy diagram of Fig. 3 will be reduced so as to include only the electronic states that have been found to participate in the IVCT luminescence mechanism of Yb-doped CaF2 crystals and in the electronic spectroscopy experiments that will be discussed below. The reduced IVCT diagram appears in Fig. 4.
III.2 IVCT luminescence mechanism
The results of the quantum mechanical calculations described in the preceding sections suggest that the IVCT luminescence, which has been observed experimentally and has been interpreted so far as an luminescence, occurs according to the following mechanism involving steps I to V. The data which characterize the radiative and non-radiative processes the Yb2+–Yb3+ pair states undergo, can be found in Table LABEL:TAB:CaSrF2-YbIIYbIII and Fig. 4; Table LABEL:TAB:Ca-SpinOrbit-short should be useful to clarify the electronic structure of their Yb2+ and Yb3+ parent states.
III.2.1 Step I. First photon absorption.
Step I is the first photon absorption [1,1] [1,1].
This step is the lowest electric dipole allowed excitation of Yb2+: 1 1. Loh (1968, 1969) Temperature dependent (multiphonon) non-radiative decay to the lowest lying state of the configuration, 1, can be expected to occur. Grimm and Güdel (2005); Pan et al. (2008) Alternatively, a lower energy photon can excite directly the 1 state with a less efficient, electric dipole forbidden transition. B. Moine, B. Courtois and Pédrini (1989) These two states can be labelled as the [1,1] and [1,1] states of the Yb3+–Yb2+ pair, respectively. Comparisons between their calculated vertical transition energies and experimental peak energies Feofilov (1956); Kaplyanskii and Feofilov (1962); Loh (1969) (Table LABEL:TAB:CaSrF2-YbIIYbIII, 25706 cm-1 and 23576 cm-1 vs. 27400 cm-1 and 24814 cm-1, respectively), suggest similar overestiamtions of around 1500 cm-1.
III.2.2 Step II. Non-radiative electron transfer
Step II is the non-radiative electron transfer [1,1] and/or [1,1] [2,1].
A very small energy barrier (49 cm-1) is found for Yb2+–Yb3+ [1,1] to Yb3+–Yb2+ [2,1] electron transfer, which suggests that such non-radiative decay is very likely to ocurr. At the activated complex point of the electron transfer, (,)=(2.323 Å, 2.197 Å) the resulting Yb3+–Yb2+ [2,1] state is so structurally stressed that a profound non-radiative relaxation towards its final equilibrium structure (,)=(2.201 Å, 2.330 Å) follows (see step II in Fig. 4). The same is true for the [1,1] [2,1] non-radiative charge transfer for wich the energy barrier is found to be even smaller: 14 cm-1.
These small energy barriers suggest that step II, which is an Yb2+()–Yb3+() Yb3+()–Yb2+() non-radiative IVCT that leaves Yb3+ in its 2 excited state, should be an efficient quenching mechanism for regular radiative emissions back to the ground state. This explains that experimental detection of these emissions has never been reported for the CaF2 host, as far as we know.
Going into more details, it is worth noticing that [1,1] can excite the IVCT directly through non-radiative decay along step II, followed by steps III and IV explained below. [1,1], however, can excite it directly through its own step II, but also indirectly through an intermediate decay to [1,1]. This explains the difference observed experimentally in the short time part of the intensity decay curves of the anomalous (IVCT) emission: whereas the intensity of the emission shows a risetime when 1 is excited, the risetime dissappears when 1 is directly excited instead. B. Moine, B. Courtois and Pédrini (1989)
The calculatons show branching of the step II non-radiative decays, which could result in quenching of the IVCT luminescence. Besides, the energy barrier for the electron transfer reaction back to the ground state of the Yb2+–Yb3+pair after step II, Yb3+–Yb2+ [2,1] Yb2+–Yb3+ [1,1], is found to be 285 cm-1. All this indicate that: (i) both non-radiative decays below the branching should occur, and (ii) the pairs that decay to the Yb3+–Yb2+ [2,1] minimum (the end of step II) and can yield IVCT luminescence after the next steps, will still face temperature dependent decay to the ground state through the low energy barrier. This is in agreement with the fact that quenching of the anomalous luminescence of CaF2:Yb2+ has been observed at 180 K. B. Moine, B. Courtois and Pédrini (1989); Rubio (1991) Also, since the temperature dependence of the non-radiative decay from the 1 to the 1 states of Yb2+ mentioned in step I, [1,1] [1,1], should influence step II as well, right at the initiation of the IVCT emission mechanism, the overall temperature dependence of the IVCT luminescence should be complex; this is further discussed in Sec. IV.1.2.
III.2.3 Step III. Second photon absorption.
Step III is the second photon absorption [2,1] [2,1].
This step is equivalent to step I, since Yb2+ is excited to its lowest electric dipole allowed level 1 by a second photon of the same wavelength as that of step I. The difference is that now, after step II, the Yb3+ component of the pair is in its 2 excited state instead of its 1 ground state. As commented in step I, alternatively, the lower lying [2,1] state can be directly excited in this step by a second, lower energy photon.
This step reveals that the excitation of the IVCT luminescence is a two-photon process. Whether excitation of the yellow-green anomalous luminescence is a one- or a two-photon process has not been investigated experimentally, as far as we know.
III.2.4 Step IV. Non-radiative decay to the luminescent level.
Step IV is the non-radiative decay to the luminescent level [2,1] [1,2].
The non-radiative relaxation from [2,1] to the lowest [1,2] level in this energy region separated from lower lying states by a large energy gap, is now significantly different from that described in step I after excitation to the [1,1] state with the first photon, because the number and nature of the electronic states that are found below the excited level are now different. In effect, the first photon excites to the lowest levels of the Yb2+–Yb3+ [,] manifold, in which both the inner-shell of Yb2+ and the shell of Yb3+ are in their ground spin-orbit multiplet. However, the second photon excites to a more crowded energy region, where two manifolds of the Yb3+–Yb2+ pair share the same energy range: [,] and [,]; these two manifolds have their inner-shell of Yb2+ and shell of Yb3+, respectively, excited into the spin-orbit multiplet. As a result, all of these energy levels lie close in energy (cf. Table LABEL:TAB:CaSrF2-YbIIYbIII) and non-radiative relaxation should not be hindered by energy gaps and it should be fast until the luminescent level [1,2] is reached. This step would be reduced to a minimum when the [2,1] level is directly excited.
III.2.5 Step V. IVCT luminescence.
Step V is the IVCT luminescence [1,2] [1,].
In the last step, the IVCT luminescence consists of three vertical Yb3+–Yb2+ Yb2+–Yb3+ intervalence charge transfer transitions. They occur from the excited Yb3+()–Yb2+() state [1,2] to the three components of the Yb2+()–Yb3+() ground state: [1,1] at 19974 cm-1, [1,1] at 19999 cm-1, and [1,1] at 20508 cm-1. These leads basically to two wide bands 530 cm-1 apart.
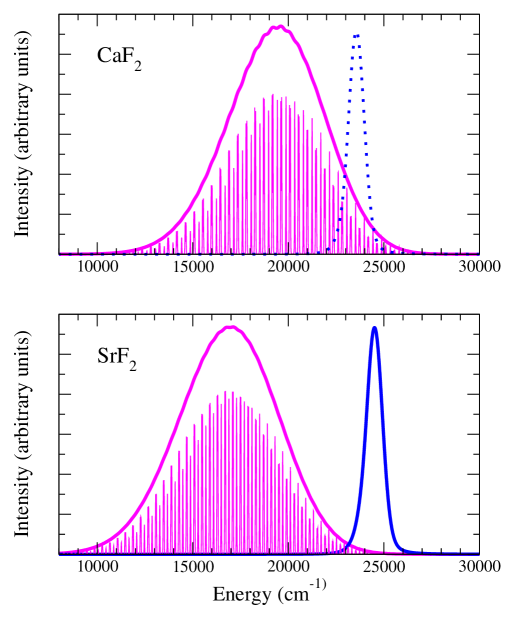
The vertical transitions occur at the equilibrium structure of the initial [1,2] state: (,)e,initial=(2.201 Å, 2.314 Å). This means that the Yb2+–Yb3+ pair that results from the vertical electron transfer is very much stressed, far away from its own equilibrium structure at (,)e,final=(2.330 Å, 2.201 Å), which defines the offsets on the left and right moieties of the pair as =+0.129 Å and =–0.113 Å, and the offset in the normalized concerted vibrational electron transfer reaction coordinate (the distance between (,)e,initial and (,)e,final in the , plane) as = = 0.49 Å. This large offset results in very broad emission bands with full width at half maximum (FWHM) about 5800 cm-1, much broader than it could be expected from the regular emission, should the latter occur. This is illustrated in Fig. 5, where the simulation of the IVCTL band has been produced for the three electronic origins [1,2] [1,1] using the semiclassical time-dependent approach of Heller Heller (1975, 1981); Zink and Shin (1991) with an arbitrary value for the oscillator strengths.
The first reports on the luminescence of CaF2:Yb2+ crystals below 200 K describe a broad structureless band in the yellow-green region formed by two overlapping bands peaking at 17600 and 18200 cm-1, Feofilov (1956); Reut (1976); B. Moine, B. Courtois and Pédrini (1989) which suggests that the results of the calculations lead to overestimations of the IVCT luminescence by some 2000 cm-1. Values of the FWHM between 3000 and 4000 cm-1 have been found experimentally, depending on temperature. B. Moine, B. Courtois and Pédrini (1989) The 2000 cm-1 overestimation of the calculated peaks of the IVCT bands, together with the 1700 cm-1 understimation obtained for the calculated Yb2+ –1 –1 transition contribute to a smaller calculated red shift of the IVCT luminescence relative to the Yb2+ excitation than observed: it is found to be about 5600 cm-1 whereas the experimentally measured red shift is about 10000 cm-1. Rubio (1991); B. Moine, B. Courtois and Pédrini (1989)
An important characteristic of the level responsible for the IVCT luminescence, [2,1] (or equivalently [1,2]), is its very low radiative rate compared with that of upper lying levels. This characteristic is basic for the efficiency of transient photoluminescence enhancement experiments like the ones described next.
III.3 Transient IVCT photoluminescence enhancement
Two-frequency transient photoluminescence enhancement measurements on CaF2:Yb2+ single crystals at 10 K have been conducted to probe the energy levels lying above the state responsible for the so far called anomalous emission. M. F. Reid, P. S. Senanayake, J.-P. R. Wells, G. Berden, A. Meijerink, A. J. Salkeld, C.-K. Duan and R. J. Reeves (2011) The experiments are based on the "radically" different radiative decay rates of the lowest emitting state and higher excited states. The sample, excited in the UV at 365 nm (27400 cm-1), is irradiated by an IR pulse. The IR excitation induces significant enhancement of the emission because it populates excited states that have significantly higher radiative rates. M. F. Reid, P. S. Senanayake, J.-P. R. Wells, G. Berden, A. Meijerink, A. J. Salkeld, C.-K. Duan and R. J. Reeves (2011) So, whereas the radiative rate of the lowest emitting level is in the order of 101ms, the decay of the transient signal is much faster than 2102 s. M. F. Reid, P. S. Senanayake, J.-P. R. Wells, G. Berden, A. Meijerink, A. J. Salkeld, C.-K. Duan and R. J. Reeves (2011) Here we show that these experiments can be interpreted as transient IVCT photoluminescence enhancement experiments.
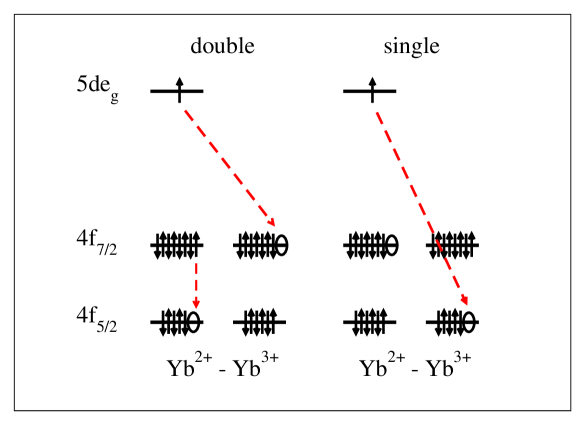
Even though within the diabatic approximation used here we cannot calculate transition moments between pair states and, hence, radiative rates or emission lifetimes, the analyses of the wavefunctions of the parent Yb2+ and Yb3+ states can give relevant information on this subject. In this line, the IVCT luminescence can be described as: Yb2+ + Yb3+ Yb3+ + Yb2+ . This indicates that the transition is a double orbital (or spinor) deexcitation, because Yb2+ gets its subshell deexcited (Yb2+ Yb2+) at the same time that its electron is transferred to fill the Yb3+ hole (Yb2+ Yb3+). This is graphically represented in the scheme labeled double in Fig. 6. Analogous analysis of the emission from the next upper lying level [1,2] yields the conclusion that its IVCT emission Yb2+–Yb3+ [1,2] Yb3+–Yb2+ [2,1] is a single electron transfer Yb2+ Yb3+ (see scheme labeled single in Fig. 6). Altogether, it is possible to conclude that the radiative rate of the lowest emission should be much lower than that of the next higher emission, which is in agreement with the lowest emitting state having a long lifetime. Feofilov (1956); Reut (1976); B. Moine, B. Courtois and Pédrini (1989); M. F. Reid, P. S. Senanayake, J.-P. R. Wells, G. Berden, A. Meijerink, A. J. Salkeld, C.-K. Duan and R. J. Reeves (2011)
Now, let us discuss the transient photoluminescence enhancement in more detail. Analyses of the transient signals IR wavelength allowed to extract the IR excited state absorption (ESA) spectrum originating in the lowest luminescent level; it consists of two low-intensity sharp peaks at 250 and 1145 cm-1 and a higher intensity broad band from 650 to 950 cm-1. M. F. Reid, P. S. Senanayake, J.-P. R. Wells, G. Berden, A. Meijerink, A. J. Salkeld, C.-K. Duan and R. J. Reeves (2011) Other signals found were assigned to trap liberation processes and atmospheric absorptions of the IR free electron laser FEL. M. F. Reid, P. S. Senanayake, J.-P. R. Wells, G. Berden, A. Meijerink, A. J. Salkeld, C.-K. Duan and R. J. Reeves (2011) The calculated vertical IR ESA spectrum originating in the Yb2+–Yb3+ [2,1] pair state has been included in Table LABEL:TAB:CaSrF2-YbIIYbIII. The simulation of the ESA spectrum of Fig. 7, graph (a), has been produced as the superposition of narrow gaussians centered at the energy levels lying below 1700 cm-1, using equal values of the oscillator strength for each electronic transition. It also consists of three groups of bands which correlate satisfactorily with the experimental values from Ref. M. F. Reid, P. S. Senanayake, J.-P. R. Wells, G. Berden, A. Meijerink, A. J. Salkeld, C.-K. Duan and R. J. Reeves, 2011, which have also been included in Table LABEL:TAB:CaSrF2-YbIIYbIII and Fig. 7 for comparisons. As in the previous paragraph, analyses of the pair wavefunctions involved in the calculated IR ESA spectrum in terms of the Yb2+ and Yb3+ parent states are useful to interpret the IR ESA signals observed, as follows: The sharp experimental peak at 250 cm-1 corresponds to an energy transfer from the subshell of Yb2+ to the shell of Yb3+:
or [,] [,] within the pair Yb2+-Yb3+, which is a – emission in Yb2+ and a – absorption in Yb3+. In particular, the two IR ESA bands calculated at 270 and 307 cm-1 correspond to [2,1][1,2] and [2,1][1,2]. The sharp experimental peak at 1145 cm-1 corresponds to the intraconfigurational absorption occurring in the Yb2+ center of the pair
Yb2+ Yb2+ ,
as it correlates well with the [2,1][5,1] band calculated at 1069 cm-1. Finally, the broad band observed from 650 to 950 cm-1 is found to correspond to a set of transitions calculated from 686 to 739 cm-1, which span a narrower energy interval. Here, higher components of the energy transfer transitions from the subshell of Yb2+ to the shell of Yb3+, like those of the lowest IR ESA band, are found together with a third type of excitations which are intraconfigurational – transitions between the Stark components of the Yb3+ moiety:
In all cases, the electronic transitions involve negligible structural reorganization, which explains why they are very narrow bands.
III.4 Excitation of the IR Yb3+ luminescence
A study of the optical properties of Yb3+-doped CaF2 crystals after application of reducing methods such as -irradiation and annealing in hydrogen, was conducted in order to investigate the Yb3+/Yb2+ conversion in the CaF2 host. Kaczmarek et al. (2005) The study showed the appearence of the absorption bands characteristic of Yb2+-doped CaF2 in the UV absorption spectrum of the treated samples. Kaczmarek et al. (2005) Two weak overlapping emission bands were observed at room temperature at 565 and 540 nm (17699 and 18519 cm-1) in -irradiated CaF2:30at.% Yb3+ samples excited with 357 nm (28011 cm-1), which were identified as the yellow-green anomalous emission of Yb2+-doped CaF2, which was observable even at room temperature in this case. A reduction on the intensity of the EPR signals associated with Yb3+ centers was observed after -irradiation at temperatures ranging 10 to 100 K. All of these features were taken as evidences of partial reduction of Yb3+ to Yb2+ in the CaF2 host. Kaczmarek et al. (2005)
Since the existence of Yb2+–Yb3+ mixed valence pairs in these samples appears to be a reasonable hypothesis, the interpretation of the spectral features mentioned can be done in terms of the IVCT diagrams calculated in this work as explained in the previous sections, where the first absorption of Yb2+ and the IVCT luminescence mechanism have been described in detail. Yet, the type of samples used in Ref. Kaczmarek et al., 2005 brings the opportunity to examine the quality of some of the approximations assumed in the IVCT theoretical model used in this paper. In effect, it is worth noticing that departure from cubic site symmetry is far more likely in as-grown CaF2:Yb3+ than in CaF2:Yb2+ crystals due to necessary charge compensation in the former. Kirton and S. D. McLaughlan (1967) [Associated with charge compensations, optical absorption signals between 10257 and 10995 cm-1 have been found in CaF2:Yb3+ crystals (this work, cubic: 10763, 11196 cm-1) and have been associated with cubic, tetragonal, trigonal, and rhombic sites; Kirton and S. D. McLaughlan (1967) they all correspond to different splittings of the excited multiplet.] This is also true after the CaF2:Yb3+ samples are subjected to reducing treatments. Kaczmarek et al. (2005) Yet, the shape, number of bands, and peak positions of the IVCT luminescence bands (so far anomalous bands) reported for CaF2:Yb3+ reduced samples in Ref. Kaczmarek et al., 2005 and for CaF2:Yb2+ crystals in Ref. Feofilov, 1956; Kaplyanskii and Feofilov, 1962, are basically identical: two broad, structureless overlapping bands are observed peaking at 17699 and 18519 cm-1, and at 17600 and 18200 cm-1, respectively. This fact suggests that the diabatic approximation proposed here and the disregard of non-cubic splittings due to local charge compensation and/or mutual interaction between the moieties of the Yb2+–Yb3+ pairs are reasonable theoretical bases and allow for the quantitative interpretation of the main spectral features of the Yb2+–Yb3+ mixed valence pairs at the cost of independent embedded cluster calculations.
In the reduced samples of Ref. Kaczmarek et al., 2005, the absorption bands of Yb2+ were found in the excitation spectrum where the 980 nm (10204 cm-1) IR emission of Yb3+ was monitored. The IVCT energy diagram (Fig. 4) provides a mechanism for the excitation of the Yb3+ emission by the first absorption band of Yb2+: a generalization of step I, followed by steps II and IIIem. E.g. the lowest Yb2+ excitation is setp I, and the next excitations will be followed by nonradiative decays to ; the lowest Yb2+ excitation (second band) will be followed by IVCT non-radiative decay [,1] [1,], followed by steps II and IIIem; and similar arguments hold for the higher energy states. Obviously, the Yb3+ emission, step IIIem, competes with step III, which excites the IVCT luminescence through a second photon absorption. However, its quenching ability is probably small given than step IIIem is basically (within the independent embedded cluster approximation) an Yb3+ - electric dipole forbidden transition whereas step III is an electric dipole Yb2+ - allowed absorption.
IV Interplay between IVCT and emissions in CaF2, SrF2, BaF2, and SrCl2.
As we have discussed, only the very broad yellow-green IVCT luminescence has been detected in CaF2:Yb2+. Feofilov (1956); Reut (1976); B. Moine, B. Courtois and Pédrini (1989) In SrF2:Yb2+, the equivalent “anomalous” emission has been detected in the red, Reut (1976); McClure and Pédrini (1985) but a second much narrower, blue emission band was also found experimentally and was interpreted as a regular – emission from the metastable states 1 and 1 of Yb2+. B. Moine, C. Pédrini, D. S. McClure and Bill (1988) And in BaF2:Yb2+ there is no emission at all up to 1.5m after strong laser excitation in the – band. B. Moine, B. Courtois and Pédrini (1989) The remaining luminescence combination, i.e. that only regular – emission is observed, is found in SrCl2:Yb2+. WIT ; Pan et al. (2008) The – emissions of SrF2:Yb2+ and SrCl2:Yb2+ are different: an Yb2+ electric dipole allowed emission of higher energy, from 1, is present in SrCl2:Yb2+, which was not found in SrF2:Yb2+ from 4.4 K to room temperature. WIT ; B. Moine, C. Pédrini, D. S. McClure and Bill (1988); Pan et al. (2008) In this Section we discussed the reasons for such a chemical dependence of the luminescence. Firstly, we discuss the CaF2, SrF2, BaF2 chemical series in Sec. IV.1. Then, we discuss the SrF2, SrCl2 series in Sec. IV.2.
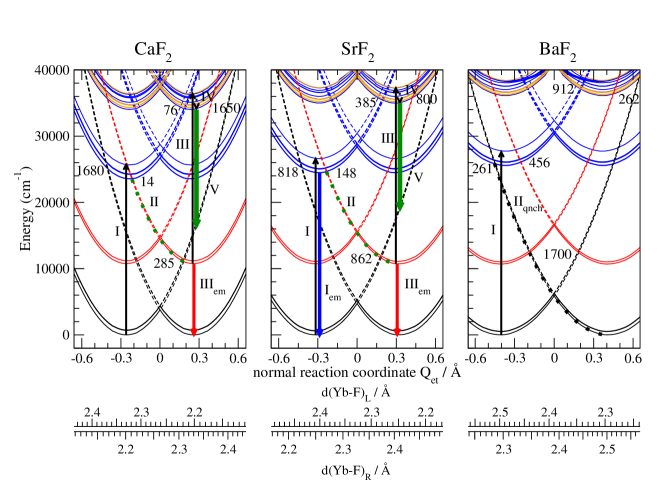
The results of the quantum mechanical calculations of the diabatic potential energy surfaces and the full and selected IVCT energy diagrams for the ground and excited states of the Yb2+–Yb3+ embedded pairs in the CaF2, SrF2, BaF2 hosts are presented in Fig. 6 of Ref. Sup, and Fig. 8, an in the SrF2, SrCl2 hosts in Fig. 7 of Ref. Sup, and Fig. 9. Vertical transition energies and energy barriers for IVCT reactions between pair states have been included in Tables LABEL:TAB:CaSrF2-YbIIYbIII and 3, respectively (descriptions of their content given in Sec. III.1 are valid and readily adaptable to SrF2 and BaF2 results). More data can be found in Ref. Sup, .
IV.1 Luminescence of Yb2+-doped CaF2, SrF2, and BaF2
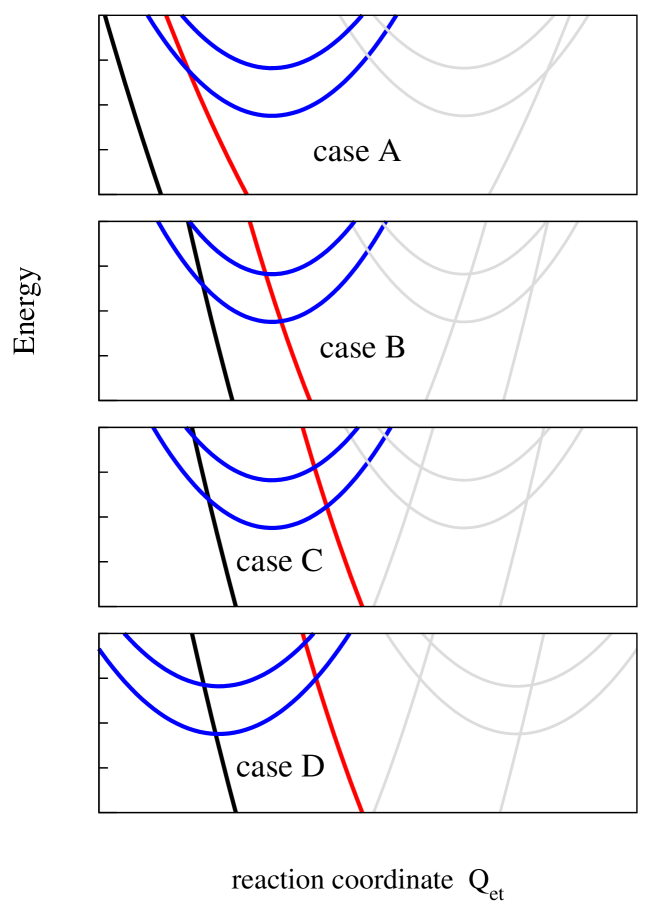
Probably associated with the increasing lattice volume going from CaF2 (163.0 Å3, 0%) to SrF2 (194.7 Å3, 19%) to BaF2 (238.3 Å3, 46%), the offset between the Yb–F equilibrium distance of the ground states of the donor Yb2+ and acceptor Yb3+ independent active centers (1 and 1, respectively), increases significantly from 0.129 Å (0%) to 0.154 Å (19%), to 0.200 Å (55%), in absolute values. Sup Other properties change as well (breating mode vibrational frequencies, ligand field effects, etc.), but their variations in the series are noticeably smaller. Sup The bond length offsets mentioned determine the values of the normal electron transfer reaction coordinate () at the minimum of the Yb2+–Yb3+ pair ground state [1,1] and, therefore, the offsets between the two equivalent minima Yb2+–Yb3+ [1,1] and Yb3+–Yb2+ [1,1] along the axis. In the fluoride series this offset increases as: = 0.517 Å (0%, CaF2), 0.616 Å (+19%, SrF2), 0.802 Å (+55%, BaF2), as it can be observed in Fig. 6 of Ref. Sup, and Fig. 8. The different luminescent behaviour of Yb in the fluoride series stems from this trend because, the increase in the offset between the two minima in the IVCT configuration coordinate diagram provokes a shift of the crossing points between the lowest Yb2+–Yb3+ [,] states and the stressed branches of the Yb3+–Yb2+ IVCT states [] and [], which act as two different non-radiative decay pathways after the first photon excitation: the first decay yields to the pair ground state, and so, to luminescence quenching; the second, leaves Yb3+ in its excited spin-orbit multiplet, which can ultimately lead to IVCT luminescence. We will see here how the magnitude of the energy barriers for these crossings are responsible for either luminescence quenching, as in BaF2, or interplay between regular – and IVCT luminescence, as in the CaF2 and SrF2 cases. This is summarized in Fig. 10.
IV.1.1 Luminescence quenching in BaF2:Yb2+
The crossing between Yb2+–Yb3+ [] and Yb3+–Yb2+ [] that enables quenching of the luminescence (step IIqnch) by direct non-raditive decay to the ground state after the first photon absorption (step I), i.e. from Yb2+–Yb3+ [1,1] to Yb3+–Yb2+ [1,1], varies very strongly in the fluoride series (cf. Table 3 and Fig. 8): 1680 cm-1 (CaF2), 818 cm-1 (SrF2), 261 cm-1 in BaF2. This result suggests that step IIqnch should result in appreaciable quenching of the luminescence in BaF2 after – excitation. This observation holds both for IVCT and – luminescence and it is in line with experimental evidences. B. Moine, B. Courtois and Pédrini (1989) Then, we can say that BaF2:Yb2+-Yb3+ belongs to the case depicted in Fig. 10.
IV.1.2 Interplay between IVCT and – emissions in CaF2 and SrF2
The second important non-radiative pathway following excitation is step II (see Sec. III.2), which enables IVCT non-radiative decay to the Yb3+–Yb2+ [2,1] excited state and is part of the IVCT luminescence mechanism. The shifts of the energy barriers leading to step II from CaF2 to SrF2 allow to interpret the different luminescent behaviour in these two hosts, as discussed next.
The energy barrier of IVCT crossing from Yb2+–Yb3+ [1,1] to Yb3+–Yb2+ [2,1] increases from CaF2 to SrF2: 14 cm-1 (CaF2), 148 cm-1 (SrF2). This suggest that [1,1] is more stable in SrF2 than in CaF2. So, regular Yb2+ – emission from this level should be more likely in SrF2, where, as a matter of fact, it has been observed. B. Moine, C. Pédrini, D. S. McClure and Bill (1988) For the same reason, its contribution to exciting the IVCT luminescence through steps II to IV is much less likely in SrF2 than in CaF2, which correlates well with the significantly overall smaller emission lifetime of the IVCT (anomalous) luminescence measured in SrF2 compared with CaF2. B. Moine, B. Courtois and Pédrini (1989) Then, we can say that SrF2:Yb2+ and CaF2:Yb2+ belong, respectively, to a case intermediate between and , and to case depicted in Fig. 10.
In contrast, the energy barriers for crossing from [1,1] to [2,1]: 49 cm-1 (CaF2) and 10 cm-1 (SrF2), are comparable (although slightly smaller in the latter), which suggests that [1,1] should contribute significantly to the excitation of the IVCT luminescence in both hosts, especially at very low temperatures, since non-radiative multiphonon decay from this level to the [1,1] should gradually quench this contribution in favour of a build up of the population of [1,1] on a temperature dependent basis. Grimm and Güdel (2005); Pan et al. (2008) Whereas this temperature dependent build up implies further excitation of the IVCT luminescence in CaF2:Yb2+(because [1,1] preferetially undergoes step II of the IVCT luminesnce), it contributes to increasing the intensity of the Yb2+ – blue emission [1,1][1,1] in SrF2:Yb2+ (because – emission is the preferred pathway for [1,1] depopulation in this material). Altogether, these results allow to explain the different variation of the IVCT luminescence intensity with temperature in SrF2 compared with CaF2: IVCT luminescence intensity reaches its maximum very sharply in SrF2:Yb2+, at very low temperature: 20 K, and quenches already at 140 K; maximum intensity is reached more gradually at 110 K in CaF2 and quenching is observed at 180 K (Ref. B. Moine, B. Courtois and Pédrini, 1989) (this quenching has been connected with branching to the ground state in Sec. III.2). Correspondingly, the intensity of the – emission [1,1][1,1] in SrF2 upon excitation in the [1,1] state (355 nm) is shown to be significantly higher than that measured upon direct excitation in the [1,1] state (370 nm) beyond 140 K, which further reveals the temperature dependent [1,1][1,1] build up at the expense of the [1,1][2,1] decay and IVCT luminescence.
Beyond step II, which has been discussed so far, the mechanism for IVCT luminescence in SrF2 is the same as in CaF2 and leads to a very broad band consisting of two overlapping bands corresponding to the three Yb3+-Yb3+ [1,2] Yb2+-Yb3+ [,] vertical transitions at 17698, 17716, and 18121 cm-1. Its FWHM is about 6000 cm-1 as it can be seen in Fig. 5. The peak energy and FWHM found experimentally are 12670 cm-1 and 4800 cm-1. This indicates that the underestimation of the peak energy found in CaF2 becomes larger in the SrF2 host. In SrF2, the agreement between the calculated IR ESA spectrum and the one deduced from transient photoluminescence enhancement experiments in Ref. P. S. Senanayake, J. P. R. Wells, M. F. Reid, G. Berden, A. Meijerink and R. J. Reeves, 2013 is comparable to that in CaF2. Both the theoretical and experimental spectra can be compared in Table LABEL:TAB:CaSrF2-YbIIYbIII and Fig. 7. The interpretation of the observed bands is the same as in the CaF2 case.
IV.1.3 IVCT absorption in Yb2+-doped SrF2
Finally, we would like to report on the IVCT absorption bands which, according to our interpretation, have been detected in the excitation spectra of Yb2+-doped SrF2 (Ref. B. Moine, B. Courtois and Pédrini, 1989) even though they have not been identified as such. We are not aware of similar experiments in the other hosts.
We will try to interpret the excitation spectra of the SrF2:Yb2+ blue and red emissions B. Moine, B. Courtois and Pédrini (1989) using the calculations presented in this paper. According to them, a large number of close lying states of the Yb2+–Yb3+ [,] configuration lie above its lowest state, [1,1], forming a dense manifold 5500 cm-1 wide. This can be seen in Fig. 6 of Ref. Sup, (first manifold of states plotted with solid blue lines); some of the levels are plotted in Fig. 8 and are tabulated in the absorption spectrum from the [1,1] ground state in Table LABEL:TAB:CaSrF2-YbIIYbIII (see also Ref. Sup, ). In the vertical absorption spectrum from the [1,1] ground state (Table LABEL:TAB:CaSrF2-YbIIYbIII), this manifold is crossed by the stressed IVCT [,] branches of Yb3+–Yb2+ [2,1] and [2,1] (dashed red lines in Fig. 6 of Ref. Sup, and in Fig. 8) which are found at 28545 and 28809 cm-1 (4070 and 4333 cm-1 above the [1,1] state).
Then, according to the mechanism discussed in Sec. III.2, IVCT luminescence will be excited if these branches are reached either by crossings (like above) or by direct vertical IVCT absorptions from the ground state (like here, in the excitation spectrum). This explains the differences observed in the experimental excitation spectra: The excitation spectra of the IVCT luminescence consists of one intense and very broad band peaking at about 351 nm (28400 cm-1) as one can read in Fig. 3 of Ref. B. Moine, B. Courtois and Pédrini, 1989. This band can be assigned to the vertical IVCT absorptions Yb2+–Yb3+ [1,1] Yb3+–Yb2+ [2,1], [2,1]. The band is broad due to the large offset between the to minima [1,1] and [2,1] along the axis (0.616 Å). Interestingly, the broad band shows a shoulder in its high energy side, which indicates that non-radiative decay to the IVCT [2,1] branch from states lying above (like the electric dipole allowed [4,1]) could also excite the IVCT luminescence with sufficient efficiency so as to be observed as a shoulder from the main IVCT absorption excitation channel. Correspondingly, the excitation spectrum of the blue [1,1][1,1] emission shows the electronic structure of the [,] manifold interrupted by a dip, which coincides with the maximum of the intense IVCT absorption band of the IVCT luminescence excitation spectrum. Also, the shoulder of the latter and the fourth and highest intense peak of the former lie very close, which suggests the presence of the electric dipole allowed [1,1][4,1] transition. It is interesting to note that in most of the experiments reported for SrF2:Yb2+ a larger wavelength (typically, 355 nm) has been used to study the luminescent behaviour of the anomalous emission.
The IVCT absorption band we have just assigned can be interpreted as the following one electron transfer: Yb2+ Yb3+ . It differs from the commonly observed IVCT absorptions in mixed valence compounds in that the final state of the pair upon electron transfer is not the stressed ground state, but, rather, a stressed excited state. In this case, the Yb3+ part of the pair after electron transfer appears to be in the excited multiplet. This – electron transfer is probably weaker than the close lying transitions in the absorption spectrum; however, it is more efficient in exciting the IVCT luminescence, because of its direct decay (step II) not facing an energy barrier, which explains its relative intensity in the excitation spectrum.
IV.2 Interplay between IVCT and – emissions in SrF2 and SrCl2
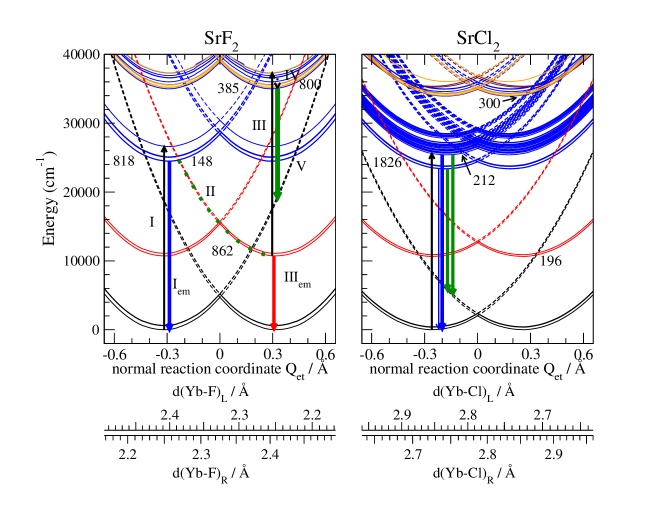
The dual character of the luminescence of Yb in SrF2 we have just discussed, disappears in the SrCl2 host, where the IVCT luminescence is not observed: only regular – emission bands have been assigned in this case. However, the emission spectrum of SrCl2:Yb2+ is very complex. This complexity stems precisely from the fact that the IVCT luminescence mechanism cannot occur, hence, – bands which are not observable in SrF2:Yb2+, become uncovered in SrCl2:Yb2+. The purpose of this section is to explain why this is so even if the existence of Yb2+–Yb3+ mixed valence pairs is likely. Pan et al. (2008); L. Su, J. Xu, H. Li, L. Wen, W. Yang, Z. Zhao, J. Si, Y. Dong and Zhou (2005); L. Su, J. Xu, H. Li, L. Wen, Y. Zhu, Z. Zhao, Y. Dong, G. Zhou and Si (2005) We do not intend to discuss the complex – spectroscopy of SrCl2:Yb2+, which has been the subject of a number of experimental and theoretical studies. Piper et al. (1967); WIT ; Pan et al. (2008); Sánchez-Sanz et al. (2010a, b)
In the host series SrF2, SrCl2, it is the chemical change what leads the variations of the local properties of the Yb2+ and Yb3+ moieties of the Yb2+–Yb3+ pairs, rather than the structural change. In particular, the energies of the breathing mode of the donor (YbX8)6- and acceptor (YbX8)5- embedded clusters clearly show the chemical change, so that the mean values of the ground state vibrational frequencies [(1)+(1)]/2, decrease from 402 cm-1 (0%, SrF2) to 246 cm-1 (39 %, SrCl2). These mean values basically determine the curvatures of the diabatic potential energy surfaces and of the IVCT energy diagrams of the Yb2+–Yb3+ embedded pairs. The change is very clear in Fig. 7 of Ref. Sup, and Fig. 9. As an effect, the crossing points between the lowest Yb2+–Yb3+ [,] states and the stressed branches of the Yb3+–Yb2+ ground and excited configurations [,] and [,] are drastically shifted in SrCl2 (see Fig. 9 and Table 3). And as a consequence, none of the two non-radiative pathways is available in SrCl2 anymore. We can say that SrCl2:Yb2+-Yb3+ belongs to the case in Fig. 10. Therefore, the first conclusion driven from the SrCl2:Yb2+–Yb3+ IVCT energy diagrams is that the IVCT luminescence observed in CaF2 and SrF2 cannot occur in this host. The second conclusion is that not only is the [1,1] state very stable, but also the higher electric dipole allowed [1,1] state is, since it cannot decay through step II, like in CaF2 and SrF2. This means that both states can luminesce in a wide range of temperatures (blue arrows in Fig. 9) and that the temperature dependent multiphonon relaxation from [1,1] to [1,1], which influenced the intensities of the blue and red emissions of SrF2 discussed above, applies now to the interplay between radiative and non radiative decays from [1,1], with the additional complexity arising from the Boltzmann population of close lying states above the 1 before room temperature is reached. All of which results in a complex, but well understood temperature dependence of the relative intensities and lifetimes of the two emission bands. Pan et al. (2008)
In addition to the two emission bands from [1,1] and [1,1], observed peaking at 26500 and 24700 cm-1, respectively (this work: 25500 and 22900 cm-1), Witzke et al. reported other three emission bands peaking at 19000, 23900, and 25400 cm-1, which were ruled out as internal transitions of the Yb2+ ion and were called defect bands involving, possibly, Yb3+ ions or Yb3+–Yb2+ pairs. WIT The band peaking at 19000 cm-1 could be associated with the IVCT luminescence Yb2+–Yb3+ [1,1] Yb3+–Yb2+ [1,1], calculated as a vertical transition at 17200 cm-1 (see green arrows in Fig. 9).
V CONCLUSIONS
Ab initio quantum mechanical calculations of the electronic structure of Yb2+–Yb3+ mixed valence pairs in fluorites allow to conclude the existence of two-photon excited IVCT luminescence in Yb-doped CaF2 and SrF2. The IVCT emission is found to be a bielectronic deexcitation involving electron transfer from the donor to the acceptor moieties of the Yb2+–Yb3+ pair, Yb2+ Yb3+ , and a deexcitation within the Yb2+ subshell: Yb2+-Yb3+ [,] Yb3+-Yb2+[,]. Hence, it is a very slow rate radiative process. It is excited by a very efficient two-photon mechanism where each photon provokes the same strong –1–1 absorption in the Yb2+ part of the pair: the first one, from the pair ground state; the second one, from an excited state of the pair whose Yb3+ moiety is in the higher spin-orbit multiplet. The band widths of the emissions are very large, in analogy with the wide band widths of well-known IVCT absorptions of transition metal mixed valence compounds.
The calculated IVCT energy diagrams show that two important non-radiative decay pathways may occur after the first photon excitation, which involve non-radiative Yb2+–Yb3+Yb3+–Yb2+ electron transfer (see graphical conclusion Fig. 10). One, leads to the ground state [] and quenches any emission (black line in Fig. 10); the other, leads to the excited state [] from where the (second-photon) IVCT luminescence excitation takes place (red line in Fig. 10). The structural change in the CaF2, SrF2, BaF2 series and the chemical change in the SrF2, SrCl2 series, influence the topology of the calculated IVCT energy diagrams and shift the crossings with both decay pathways making the quenching decay the most likely in BaF2, the decay towards IVCT luminescence excitation the most likely in CaF2 and SrF2, whereas none of the two decays occur in the SrCl2 case, all of which leads to total quenching of any emission in BaF2 (case D), IVCT luminescence only in CaF2 (case B), dual IVCT and emissions in SrF2 (intermediate case between B and C), and only emissions in SrCl2 (case A), as experimentally observed.
The electronic structure of the Yb2+–Yb3+ pairs has been calculated within the diabatic and independent Yb2+ and Yb3+ embedded cluster approximations. The donor (YbX8)6- and acceptor (YbX8)5- ab initio wavefunctions and energies have been calculated using high quality, well-established ab initio quantum chemical methods, including: extended basis sets, non-dynamic and dynamic electron correlation, relativistic effects up to spin-orbit coupling, and quantum mechanical host embedding, all of them, at the highest levels of methodology compatible with the need to combine them all at once. The two series of hosts chosen to demonstrate the capabilities and limitations of the IVCT model presented span a very complex luminescence scenario for validation. In this context, the overall agreement of the theoretical and experimental results including different types of samples (Yb2+-doped, Yb3+-doped) and experimental techniques: emission, excitation, photoluminescence enhancement spectra and their variation with temperature, is very satisfactory and allows to draw the conclusion that the anomalous luminescence of Yb2+ associated so far with impurity-trapped excitons is, rather, an IVCT luminescence associated with Yb2+–Yb3+ mixed valence pairs. We also conclude that the broad band observed in the excitation spectrum of the so far called anomalous emission of Yb2+-doped SrF2 is a broad IVCT absorption band corresponding to the following Yb2+ Yb3+ electron transfer.
Acknowledgements.
This work was partly supported by a grant from Ministerio de Economía y Competitividad, Spain (Dirección General de Investigación y Gestión del Plan Nacional de I+D+i, MAT2011-24586).References
- van Eijk (2002) C. W. E. van Eijk, Phys. Med. Biol. 47, R85 (2002).
- Liu and Jacquier (2005) G. Liu and B. Jacquier, eds., Spectroscopic Properties of Rare Earths in Optical Materials (Springer, Berlin, 2005).
- Ronda (2007) C. R. Ronda, ed., Luminescence: From Theory to Applications (Wiley-VCH, Weinheim, 2007).
- Weber (2002) M. J. Weber, J. Lumin. 100, 35 (2002).
- Dorenbos (2003) P. Dorenbos, J. Phys.: Condens. Matter 15, 2645 (2003).
- Feofilov (1956) P. P. Feofilov, Opt. Spektrosk. 1, 992 (1956).
- Kaplyanskii and Feofilov (1962) A. A. Kaplyanskii and P. P. Feofilov, Opt. Spectrosc. 13, 129 (1962).
- Reut (1976) E. G. Reut, Opt. Spectrosc. 40, 55 (1976).
- McClure and Pédrini (1985) D. S. McClure and C. Pédrini, Phys. Rev. B 32, 8465 (1985).
- B. Moine, C. Pédrini, D. S. McClure and Bill (1988) B. Moine, C. Pédrini, D. S. McClure and H. Bill, J. Lumin. 40&41, 299 (1988).
- B. Moine, B. Courtois and Pédrini (1989) B. Moine, B. Courtois and C. Pédrini, J. Phys. France 50, 2105 (1989).
- Kaczmarek et al. (2005) S. M. Kaczmarek, T. Tsuboi, M. Ito, G. Boulon, and G. Leniec, J. Phys.: Condens. Matter 17, 3771 (2005).
- M. F. Reid, P. S. Senanayake, J.-P. R. Wells, G. Berden, A. Meijerink, A. J. Salkeld, C.-K. Duan and R. J. Reeves (2011) M. F. Reid, P. S. Senanayake, J.-P. R. Wells, G. Berden, A. Meijerink, A. J. Salkeld, C.-K. Duan and R. J. Reeves, Phys. Rev. B 84, 113110 (2011).
- P. S. Senanayake, J. P. R. Wells, M. F. Reid, G. Berden, A. Meijerink and R. J. Reeves (2013) P. S. Senanayake, J. P. R. Wells, M. F. Reid, G. Berden, A. Meijerink and R. J. Reeves, J. Lumin. 133, 81 (2013).
- (15) H. Witzke, D. S. McClure, and B. Mitchell, in Luminescence of Crystals, Molecules, and Solutions, edited by F. E. Williams (Plenum, New York, 1973), p. 598.
- Pan et al. (2008) Z. Pan, C. Duan, and P. A. Tanner, Phys. Rev. B 77, 085114 (2008).
- Bessière et al. (2004) A. Bessière, P. Dorenbos, C. van Eijk, L. Pidol, K. Krämer, and H. Güdel, J. Phys.: Condens. Matter 16, 1887 (2004).
- Bessière et al. (2006) A. Bessière, P. Dorenbos, C. van Eijk, K. Krämer, H. Güdel, and A. Galtayries, J. Lumin. 117, 187 (2006).
- Grinberg (2011) M. Grinberg, J. Lumin. 131, 433 (2011).
- Loh (1968) E. Loh, Phys. Rev. 175, 533 (1968).
- Loh (1969) E. Loh, Phys. Rev. 184, 348 (1969).
- L. Su, J. Xu, H. Li, L. Wen, W. Yang, Z. Zhao, J. Si, Y. Dong and Zhou (2005) L. Su, J. Xu, H. Li, L. Wen, W. Yang, Z. Zhao, J. Si, Y. Dong and G. Zhou, J. Cryst. Growth 277, 264 (2005).
- L. Su, J. Xu, H. Li, L. Wen, Y. Zhu, Z. Zhao, Y. Dong, G. Zhou and Si (2005) L. Su, J. Xu, H. Li, L. Wen, Y. Zhu, Z. Zhao, Y. Dong, G. Zhou and J. Si, Chem. Phys. Lett. 406, 254 (2005).
- (24) L. Seijo and Z. Barandiarán, "Intervalence charge transfer luminescence: The anomalous luminescence of cerium-doped Cs2LiLuCl6 elpasolite," J. Chem. Phys., accepted.
- Verhoeven (1996) J. W. Verhoeven, Pure Appl. Chem. 68, 2223 (1996).
- Marcus (1964) R. A. Marcus, Annu. Rev. Phys. Chem 15, 155 (1964).
- Allen and Hush (1967) G. C. Allen and N. S. Hush, Prog. Inorg. Chem. 8, 357 (1967).
- Hush (1967) N. S. Hush, Prog. Inorg. Chem. 8, 391 (1967).
- Robin and Day (1968) M. Robin and P. Day, Adv. Inorg. Chem. Radiochem. 10, 247 (1968).
- Piepho et al. (1975) S. B. Piepho, E. R. Krausz, and P. N. Schatz, J. Amer. Chem. Soc. 100, 2996 (1975).
- Blasse (1991) G. Blasse, Struct. Bond. 76, 153 (1991).
- van Schaik et al. (1993) W. van Schaik, S. Lizzo, W. Smit, and G. Blasse, J. Electrochem. Soc. 140, 216 (1993).
- BAR (a) Z. Barandiarán, A. Meijerink, and L. Seijo, "Intervalence charge transfer and metal-to-metal charge transfer configuraton coordinate diagrams of dopant pairs in solids," in preparation.
- McWeeny (1959) R. McWeeny, Proc. R. Soc. Lond. A 253, 242 (1959).
- Karlström et al. (2003) G. Karlström, R. Lindh, P. A. Malmqvist, B. O. Roos, U. Ryde, V. Veryazov, P. O. Widmark, M. Cossi, B. Schimmelpfennig, P. Neogrady, et al., Comput. Mater. Sci. 28, 222 (2003).
- Wyckoff (1982) R. W. G. Wyckoff, Crystal Structures, vol. 1, 2nd. edn. (Interscience Publishers, 1982).
- Douglas and Kroll (1974) M. Douglas and N. M. Kroll, Ann. Phys. (N.Y.) 82, 89 (1974).
- Hess (1986) B. A. Hess, Phys. Rev. A 33, 3742 (1986).
- Roos et al. (2005) B. O. Roos, R. Lindh, P. A. Malmqvist, V. Veryazov, and P. O. Widmark, J. Phys. Chem. A 108, 2851 (2005).
- Roos et al. (2008) B. O. Roos, R. Lindh, P. A. Malmqvist, V. Veryazov, and P. O. Widmark, J. Chem. Phys. 112, 11431 (2008).
- Barandiarán and Seijo (1988) Z. Barandiarán and L. Seijo, J. Chem. Phys. 89, 5739 (1988).
- Seijo and Barandiarán (1999) L. Seijo and Z. Barandiarán, in Computational Chemistry: Reviews of Current Trends, edited by J. Leszczyński (World Scientific, Singapore, 1999), vol. 4, pp. 55–152.
- Gellé and Lepetit (2008) A. Gellé and M.-B. Lepetit, J. Chem. Phys. 128, 244716 (2008).
- Barandiarán and Seijo (2013) Z. Barandiarán and L. Seijo, J. Chem. Phys. 138, 074102 (2013).
- J. Olsen, B. O. Roos, P. Jørgensen, and Jensen (1988) J. Olsen, B. O. Roos, P. Jørgensen, and J. A. Jensen, J. Chem. Phys. 89, 2185 (1988).
- Malmqvist et al. (1990) P.-A. Malmqvist, A. Rendell, and B. O. Roos, J. Phys. Chem. 94, 5477 (1990).
- P.-Å. Malmqvist, K. Pierloot, A. R. Moughal Shahi, C. J. Cramer and L. Gagliardi (2008) P.-Å. Malmqvist, K. Pierloot, A. R. Moughal Shahi, C. J. Cramer and L. Gagliardi, J. Chem. Phys. 128, 204109 (2008).
- Zaitsevskii and Malrieu (1995) A. Zaitsevskii and J.-P. Malrieu, Chem. Phys. Lett. 233, 597 (1995).
- Finley et al. (1998) J. Finley, P.-A. Malmqvist, B. O. Roos, and L. Serrano-Andrés, Chem. Phys. Lett. 288, 299 (1998).
- G. Ghigo, B. O. Roos, and P.-Å. Malmqvist (2004) G. Ghigo, B. O. Roos, and P.-Å. Malmqvist, Chem. Phys. Lett. 396, 142 (2004).
- Forsberg and Malmqvist (1997) N. Forsberg and P.-A. Malmqvist, Chem. Phys. Lett. 274, 196 (1997).
- Malmqvist et al. (2002) P. A. Malmqvist, B. O. Roos, and B. Schimmelpfennig, Chem. Phys. Lett. 357, 230 (2002).
- Hess et al. (1996) B. A. Hess, C. M. Marian, U. Wahlgren, and O. Gropen, Chem. Phys. Lett. 251, 365 (1996).
- (54) Detailed core and embedding AIMP data libraries in electronic format are available from the authors upon request or directly at the address http://www.uam.es/quimica/aimp/Data/AIMPLibs.html. See also Ref. Karlström et al., 2003.
- (55) See supplemental material at [URL] for detailed results of the quantum mechanical calculations on the donor (YbX8)6- and acceptor (YbX8)5- cubic clusters embedded in the four CaF2, SrF2, BaF2, and SrCl2 fluorite-type hosts. Diabatic IVCT energy diagrams and vertical absorptions and emissions of – pairs in the same hosts, calculated at the equilibrium geometry of various initial states of the pairs are also included.
- Ordejón et al. (2007) B. Ordejón, L. Seijo, and Z. Barandiarán, J. Chem. Phys. 126, 194712 (2007).
- Sánchez-Sanz et al. (2010a) G. Sánchez-Sanz, L. Seijo, and Z. Barandiarán, J. Chem. Phys. 133, 114509 (2010a).
- BAR (b) Z. Barandiarán and L. Seijo, to be published.
- Grimm and Güdel (2005) J. Grimm and H. U. Güdel, Chem. Phys. Lett. 404, 40 (2005).
- Rubio (1991) J. Rubio, J. Phys. Chem. Solids 52, 101 (1991).
- Heller (1975) E. J. Heller, J. Chem. Phys. 62, 1544 (1975).
- Heller (1981) E. J. Heller, Acc. Chem. Res. 14, 368 (1981).
- Zink and Shin (1991) J. I. Zink and K. S. Shin, in Advances in Photochemistry (Wiley, New York, 1991), vol. 16, pp. 119–214.
- Kirton and S. D. McLaughlan (1967) J. Kirton and S. D. McLaughlan, Phys. Rev. 155, 279 (1967).
- Piper et al. (1967) T. S. Piper, J. P. Brown, and D. S. McClure, J. Chem. Phys. 46, 1353 (1967).
- Sánchez-Sanz et al. (2010b) G. Sánchez-Sanz, L. Seijo, and Z. Barandiarán, J. Chem. Phys. 133, 114506 (2010b).
- Kiss (1962) Z. J. Kiss, Phys. Rev. 127, 3 (1962).
| State | Te | weights of terms larger than 10% a | |||||||||||
| Yb2+-doped CaF2 | |||||||||||||
| 1 | 2.329 | 417 | 0 | 100.0 | 1 | ||||||||
| 4() submanifold; = 2.3150.001 ; = 4231 | |||||||||||||
| 1 | 2.317 | 423 | 23510 | 89.21 | 1 | ||||||||
| 1 | 2.317 | 423 | 23548 | 89.94 | 1 | ||||||||
| 1 | 2.316 | 423 | 25636 | 1.000 | 42.33 | 1 | 34.07 | 1 | 19.47 | 1 | |||
| 1 | 2.315 | 424 | 25704 | 99.57 | 1 | ||||||||
| 2 | 2.316 | 424 | 25730 | 68.39 | 1 | 30.16 | 1 | ||||||
| 2 | 2.315 | 422 | 26202 | 48.54 | 1 | 25.35 | 1 | 25.02 | 2 | ||||
| 3 | 2.314 | 422 | 26420 | 48.54 | 1 | 23.19 | 2 | 21.10 | 1 | ||||
| 2 | 2.314 | 423 | 26533 | 0.160 | 50.49 | 1 | 21.19 | 2 | 15.29 | 1 | |||
| 1 | 2.315 | 424 | 26664 | 96.37 | 2 | ||||||||
| 3 | 2.316 | 421 | 27095 | 0.045 | 55.67 | 2 | 26.78 | 2 | |||||
| 3 | 2.315 | 422 | 28096 | 79.67 | 2 | 13.20 | 2 | ||||||
| 4 | 2.315 | 423 | 28327 | 48.35 | 2 | 29.41 | 2 | ||||||
| 4 | 2.316 | 421 | 28344 | 0.001 | 56.72 | 2 | 20.97 | 2 | 11.40 | 2 | |||
| 4()5 submanifold; = 2.3160.001 ; = 4222 | |||||||||||||
| 2 | 2.317 | 424 | 34004 | 96.24 | 1 | ||||||||
| 5 | 2.316 | 423 | 35075 | 0.797 | 51.63 | 1 | 21.10 | 1 | 16.08 | 1 | |||
| 4 | 2.315 | 423 | 35924 | 64.80 | 1 | 18.78 | 1 | ||||||
| 5 | 2.315 | 423 | 36270 | 43.72 | 1 | 22.91 | 1 | 20.02 | 1 | ||||
| 6 | 2.316 | 421 | 36832 | 1.696 | 41.99 | 1 | 36.54 | 1 | 15.64 | 1 | |||
| 5 | 2.315 | 422 | 37291 | 54.90 | 2 | 24.35 | 1 | 19.89 | 2 | ||||
| 6 | 2.315 | 423 | 37344 | 56.03 | 2 | 21.66 | 1 | 14.64 | 2 | ||||
| 7 | 2.315 | 416 | 38161 | 0.016 | 45.48 | 2 | 19.46 | 1 | 16.83 | 2 | 16.23 | 2 | |
| Yb3+-doped CaF2 | |||||||||||||
| 4 manifold; = 2.2010.001 ; = 4930 | |||||||||||||
| 4() submanifold | |||||||||||||
| 1 | b | 2.200 | 493 | 0 | 62.74 | 1 | 37.26 | 1 | |||||
| 1 | 2.202 | 493 | 686 | 99.99 | 1 | ||||||||
| 1 | 2.202 | 494 | 729 | 63.93 | 1 | 36.06 | 1 | ||||||
| 4() submanifold | |||||||||||||
| 2 | 2.201 | 494 | 10764 | 62.74 | 1 | 37.26 | 1 | ||||||
| 2 | 2.202 | 493 | 11196 | 63.94 | 1 | 36.06 | 1 | ||||||
a Weights are given in % and correspond to calculations at d(Yb-F) = 2.200 Å and 2.383 Å for Yb3+ and Yb2+ -doped CaF2, respectively.
b The Yb2+ 1Yb3+ 1 minimum-to-minimum energy difference is 6905 cm-1.
| Yb2+–Yb3+ initial state | |||||||
| [,] | [,] | [,] | |||||
| [1,1] | [1,2] | [2,1] | |||||
| , | , | , | |||||
| CaF2 | SrF2 | CaF2 | SrF2 | CaF2 | SrF2 | ||
| 2.330,2.201 | 2.406,2.252 | 2.330,2.201 | 2.406,2.253 | 2.314,2.201 | 2.396,2.252 | ||
| Final state | |||||||
| Yb2+–Yb3+ | [,] | ||||||
| (IIIem) Yb3+ luminescence | |||||||
| 1,1 | 0 | 0 | -10762 | -10718 | -33913 | -34897 | |
| 1,1 | 686 | 580 | -10078 | -10140 | -33226 | -34316 | |
| 1,1 | 729 | 614 | -10035 | -10106 | -33183 | -34283 | |
| [,] | |||||||
| [10384] a | |||||||
| 1,2 | 10763 | 10719 | 0 | 0 | -23149 | -24177 | |
| [10794] a | |||||||
| 1,2 | 11196 | 11092 | -22716 | -23804 | |||
| Yb3+–Yb2+ | [,] | ||||||
| (V) IVCT luminescence | |||||||
| [-18200] b | |||||||
| [-18000] c | [-13700] c | ||||||
| [-17400] d | [-12000] d | ||||||
| 1,1 | 15238 | 17894 | -20508 | -18121 | |||
| [-17600] b | |||||||
| 1,1 | 15728 | 18290 | -19999 | -17716 | |||
| 1,1 | 15751 | 18307 | -19974 | -17698 | |||
| Yb2+–Yb3+ | [,] | ||||||
| [24814] e | [25316] e | ||||||
| 1,1 | 23576 | 24475 | |||||
| 1,1 | 23614 | 24517 | |||||
| 1,1 | 24263 | 25055 | |||||
| 1,1 | 24301 | 25097 | |||||
| 1,1 | 24305 | 25089 | |||||
| 1,1 | 24344 | 25131 | |||||
| (I) 1st photon absorption | |||||||
| [27400] f | [27950] f | ||||||
| 1,1 | 25706 | 26618 | |||||
| others g | |||||||
| Yb3+–Yb2+ | [,] | ||||||
| IVCT absorption | |||||||
| [ 28490] h | |||||||
| 2,1 | 25922 | 28545 | |||||
| 2,1 | 26243 | 28809 | |||||
| others g | |||||||
| Yb2+–Yb3+ | [ ,] | ||||||
| IR ESA i | |||||||
| 2,1 | 34074 | 35003 | 23311 | 24284 | 0 | 0 | |
| [250] | [178] | ||||||
| 1,2 | 34340 | 35194 | 23576 | 24475 | 270 | 195 | |
| 1,2 | 34378 | 35236 | 23614 | 24517 | 307 | 236 | |
| [650-950] | [500-670] | ||||||
| 2,1 | 34761 | 35583 | 23996 | 24863 | 686 | 580 | |
| 1,2 | 34772 | 35568 | 24007 | 24847 | 702 | 568 | |
| 2,1 | 34804 | 35617 | 24039 | 24896 | 729 | 614 | |
| 1,2 | 34810 | 35610 | 24045 | 24889 | 739 | 609 | |
| [1145] | [1273] | ||||||
| 5,1 | 35145 | 36013 | 24382 | 25295 | 1069 | 1013 | |
| 5,1 | 35832 | 36594 | 25067 | 25873 | 1756 | 1593 | |
| Yb3+–Yb2+ | 1,1 | 1775 | |||||
| Yb2+–Yb3+ | 5,1 | 35874 | 36627 | 25109 | 25907 | 1799 | 1627 |
| Yb3+–Yb2+ | 1,1 | 1809 | |||||
| Yb2+–Yb3+ | 4,1 | 36005 | 36927 | 25242 | 26208 | 1917 | 1917 |
| 5,1 | 36356 | 37301 | 25593 | 26582 | 2262 | 2292 | |
| Yb3+–Yb2+ | 1,1 | 2284 | |||||
| 1,1 | 2309 | ||||||
| 1,1 | 2319 | ||||||
| 1,1 | 2343 | ||||||
| (III) 2nd photon absorption | |||||||
| Yb2+–Yb3+ | 1,2 | 36470 | 37337 | 25706 | 26618 | 2343 | 2336 |
| others g | |||||||
a Only the absorption line at 10384 cm-1 was assigned to a cubic site in Ref. Kirton and S. D. McLaughlan, 1967; the splitting of the () multiplet was expected to be similar to that found by Kiss (Ref. Kiss, 1962) for the isoelectronic ion CaF2Tm2+: 410 cm-1.
b From Ref. Feofilov, 1956 and Kaplyanskii and Feofilov, 1962, below 200 K.
c From Ref. Reut, 1976 at 77 K.
d From Ref. B. Moine, B. Courtois and Pédrini, 1989 at 4.2 K.
e Estimations from changes in the short time part of the fluorescence decay at 30 K, from Ref. B. Moine, B. Courtois and Pédrini, 1989.
f From absorption spectra from Ref. Feofilov, 1956 and Kaplyanskii and Feofilov, 1962 at 20oC and Ref. Loh, 1969 at 77 K.
g Ref. Sup,
h Read from Fig. 2 of Ref. B. Moine, B. Courtois and Pédrini, 1989; see text for details.
i Experimental data from two frequency transient photoluminescence enhancement spectra at 10 K, from Ref. M. F. Reid, P. S. Senanayake, J.-P. R. Wells, G. Berden, A. Meijerink, A. J. Salkeld, C.-K. Duan and R. J. Reeves, 2011 (CaF2) and Ref. P. S. Senanayake, J. P. R. Wells, M. F. Reid, G. Berden, A. Meijerink and R. J. Reeves, 2013 (SrF2).
| forward; backwards diabatic energy barriers for IVCT | ||||||
| (YbX8) + (YbX8) | (YbX8) + (YbX8) | , at the crossing point | ||||
|---|---|---|---|---|---|---|
| Yb2+–Yb3+ | Yb3+–Yb2+ | CaF2 | SrF2 | BaF2 | SrCl2 | |
| [,] | [] | |||||
| [,] | [] | |||||
| [1,1] | [2,1] | 11048; 285 | 11581; 862 | 12390; 1700 | 10837; 196 | |
| 2.220,2.311 | 2.285,2.377 | 2.349,2.442 | 2.711,2.878 | |||
| [,] | [] | |||||
| (II) crossing | ||||||
| [1,1] | [2,1] | 14; 12741 | 148; 13874 | 456; 15281 | 1826; 14375 | |
| 2.312,2.205 | 2.383,2.266 | 2.448,2.322 | 2.880,2.671 | |||
| [1,1] | [2,1] | 10; 12775 | 142; 13910 | 453; 15323 | 1847; 14433 | |
| 2.313,2.205 | 2.380,2.263 | 2.446,2.320 | 2.882,2.672 | |||
| [1,1] | [2,1] | 49 ; 14903 | 10; 15877 | 166; 17164 | 3400; 17963 | |
| 2.323,2.197 | 2.391,2.255 | 2.460,2.314 | 2.903,2.654 | |||
| [,] | [] | |||||
| (II) quenching | ||||||
| [1,1] | [1,1] | 1680; 25174 | 818; 25263 | 261; 25775 | 9416; 32606 | |
| 2.360,2.159 | 2.435,2.222 | 2.501,2.278 | 2.978,2.612 | |||
| [1,1] | [1,1] | 1701; 25229 | 819; 25306 | 266; 25825 | 9425; 32652 | |
| 2.364,2.162 | 2.435,2.222 | 2.504,2.280 | 2.978,2.612 | |||
| [1,1] | [1,1] | 2561; 28179 | 1389; 27976 | 570; 28256 | 12846; 38050 | |
| 2.375,2.154 | 2.444,2.212 | 2.510,2.267 | 3.025,2.612 | |||
| [,] | [] | |||||
| [2,1] | [1,1] | 76; 10570 | 385; 10909 | 912; 11470 | 2838; 13393 | |
| 2.306,2.209 | 2.367,2.268 | 2.433,2.331 | 2.914,2.675 | |||
| [1,2] | [1,1] | 55.5; 10818 | 347; 11067 | 878; 11567 | 2853; 13494 | |
| 2.308,2.209 | 2.369,2.268 | 2.434,2.331 | 2.916,2.676 | |||
| [,] | [] | |||||
| [2,1] | [2,1] | 1650; 24868 | 800; 25051 | 262; 25646 | 9491; 32595 | |
| 2.360,2.160 | 2.431,2.220 | 2.503,2.280 | 2.978,2.612 | |||
| [1,2] | [2,1] | 1774; 25264 | 861; 25307 | 277; 25792 | 9522; 32712 | |
| 2.365,2.162 | 2.436,2.222 | 2.564,2.241 | 2.979,2.612 | |||