G305.136+0.068: A massive and dense cold core in an early stage of evolution
Abstract
We report molecular line observations, made with ASTE and SEST, and dust continuum observations at 0.87 mm, made with APEX, towards the cold dust core G305.136+0.068. The molecular observations show that the core is isolated and roughly circularly symmetric and imply that it has a mass of . A simultaneous model fitting of the spectra observed in four transitions of CS, using a non-LTE radiative transfer code, indicates that the core is centrally condensed, with the density decreasing with radius as , and that the turbulent velocity increases towards the center. The dust observations also indicate that the core is highly centrally condensed and that the average column density is 1.1 g cm-2, value slightly above the theoretical threshold required for the formation of high mass stars. A fit to the spectral energy distribution of the emission from the core indicates a dust temperature of K, confirming that the core is cold. Spitzer images show that the core is seen in silhouette from 3.6 to 24.0 m and that is surrounded by an envelope of emission, presumably tracing an externally excited photo-dissociated region. We found two embedded sources within a region of 20″ centered at the peak of the core, one of which is young, has a luminosity of 66 and is accreting mass with a high accretion rate, of yr-1. We suggest that this object corresponds to the seed of a high mass protostar still in the process of formation. The present observations support the hypothesis that G305.136+0.068 is a massive and dense cold core in an early stage of evolution, in which the formation of a high mass star has just started.
1 Introduction
Several single dish surveys of molecular line emission in high density tracers (Plume et al., 1992, 1997; Juvela, 1996) and of dust continuum emission (Beuther et al., 2002; Mueller et al., 2002; Faúndez et al., 2004; Williams et al., 2004; Garay et al., 2007) carried out toward luminous sources, either ultra compact (UC) H II regions and/or luminous IRAS sources, have revealed that young high mass stars are usually found in massive (M ) and dense ( cm-3) cores with sizes of typically 0.4 pc and temperatures of typically 32 K. Since high mass stars have already been formed in these cores, which may have appreciably affected their natal environment through stellar winds and radiation, it is not clear whether or not the properties of these cores are representative of the initial conditions for the formation of high mass stars at the scale of parsecs.
The observational search for massive dense cold cores, capable of forming high mass stars but in a stage before star formation begins, started only recently, with the advent of telescopes that allow to identify them (Garay et al., 2004; Hill et al., 2005; Sridharan et al., 2005; Schuller et al., 2009; Contreras et al., 2013). The bulk of their luminosity is expected to be emitted at mm and sub-mm wavelengths. Since high mass stars are formed in clusters, the determination of the initial conditions of massive star formation is key to understand the formation process that produces a cluster of stars.
In this paper we report observations of molecular line emission and of continuum emission at 0.87 mm toward G305.136+0.068, a massive dust core identified by Garay et al. (2004) from mm observations. The absence of emission in any of the MSX and IRAS bands from this core suggested it is cold, and therefore a bonafide candidate for being a core in an early stage of evolution. Archival data from the Spitzer Space Telescope GLIMPSE survey and from the Herschel Space Observatory Hi-GAL project were analyzed to search for embedded sources and to determine the dust temperature of the core, respectively.
2 Observations
2.1 Molecular lines
The molecular line observations were made using the 10-m Atacama Submillimeter Telescope Experiment (ASTE) located in Pampa La Bola, Chile, and the 15-m Swedish–ESO Submillimetre Telescope (SEST) located on La Silla, Chile. The observed transitions and basic observational parameters are summarized in Table 1.
| Line | Frequency | Tel. | Beam | Map | Spacing | Channel width | Noise | |
|---|---|---|---|---|---|---|---|---|
| (MHz) | (″) | () | (″) | (km s-1) | (K) | |||
| CS) | 97980.968 | SEST | 52 | 0.73 | 30 | 0.103 | 0.040 | |
| CS) | 149969.049 | SEST | 34 | 0.66 | 30 | 0.087 | 0.076 | |
| CS) | 244935.606 | SEST | 22 | 0.40 | 30 | 0.156 | 0.123 | |
| CS) | 342882.950 | ASTE | 22 | 0.65 | 20 | 0.109 | 0.094 | |
| CO | 345795.990 | ASTE | 22 | 0.65 | 30 | 0.108 | 0.090 | |
| 13CO | 330587.960 | ASTE | 23 | 0.65 | 30 | 0.113 | 0.086 |
The ASTE observations were carried out during December 2004 and July 2005. A detailed description of the characteristics of ASTE is given by Ezawa et al. (2004). The frontend consisted of a single pixel heterodyne SiS receiver operating in the 345 GHz band. The backend consisted of four digital autocorrelation spectrometers, each with 1024 spectral channels. The half-power beam width of the telescope at 345 GHz is . The main beam efficiency, during night observations, was 0.65. We mapped the CO(32) and 13CO(32) emission within a region of ″ in size, with angular spacings of 30″, centered at the peak of the dust core. On-source integration times per map position were 1 and 3 minutes for CO(32) and 13CO(32), respectively. System temperatures were typically K and K at the frequencies of the CO(32) and 13CO(32) lines, respectively. In addition, we mapped the CS) emission within a region of in size, with 20″ angular spacing. The system temperature was typically K and the on-source integration time per map position was 4 minutes. The data were reduced with the program NEWSTAR and then converted to fits format for further processing with CLASS.
The SEST observations were carried out during March 2003. We used the high resolution acousto-optical spectrometers which provided a channel separation of 43 kHz and a total bandwidth of 43 MHz. We mapped the CS(21) and CS(32) emission across a region of 2′ in diameter, with angular spacings of 30″, centered at the peak of the dust core. On-source integration times per map position were 6 and 3 minutes for the CS(21) and CS(32) lines, respectively. The CS(54) emission was mapped across a region of 1.5′ in diameter, with angular spacing of 30″. On-source integration time per map position was 6 minutes. System temperatures were typically K at 3 mm, K at 2 mm and K at 1 mm.
2.2 Dust continuum
The 0.87 mm continuum observations were made using the 12-m Atacama Pathfinder Experiment Telescope (APEX) located at Llano de Chajnantor, Chile. As receiver we used the Large Array Bolometer Camera (LABOCA), which is an array made of 295 bolometers arranged in a hexagonal pattern, with two-beam spacing between bolometers (Siringo et al., 2009). The passband of the bolometers has an equivalent width of GHz and is centered at GHz. The HPBW of a single element is 19.2″. The observations were carried out during May of 2008, covering to deg in longitude, and from to in latitude and are part of the Apex Telescope Large Area Survey of the Galactic Plane (ATLASGAL) survey at 850 m (Schuller et al., 2009). Off-line data reduction was performed using the software package BoA following the steps described in Siringo et al. (2009). The flux calibration was derived from maps of Uranus. We estimate that the uncertainty in the absolute calibration and pointing accuracy are and 3″, respectively. The noise level achieved in the image is 59 mJy/beam.
2.3 Ancillary public data
In addition to the above observations, we made use of publicly available mid-infrared images taken with the Spitzer Space Telescope and far-infrared images taken with the Herschel Space Observatory. Mid-infrared images at 3.6, 4.6, 5.8 and 8.0 m were obtained with the Infrared Array Camera (IRAC, Fazio et al., 2004) as part of the GLIMPSE Legacy Program. Data at 24 m were obtained with the Multi-band Imaging Photometer as part of the MIPSGAL survey (Carey et al., 2006). The far-infrared images were taken as part of the Herschel Hi-GAL key project (Molinari et al., 2010) using the parallel fast-scanning mode and obtained through the Herschel Science Archive. Images at 70 and 160 m were observed using the PACS bolometer (Poglitsch et al., 2010) and images at 250, 350 and 500 m were obtained using the SPIRE bolometer (Griffin et al., 2010). The two orthogonal scan directions were combined into a single map using the Herschel Interactive Processing Environment (HIPE, v9.2). Cross-scan combination and de-striping was performed using the standard HIPE tools over the Hi-GAL maps.
3 Results
3.1 Molecular lines
Figure 1 shows the CO and 13CO spectra observed with ASTE within a 150″150″ region, centered at the peak position of the dust core. In both transitions the profiles of the emission from the core ambient gas, centered at km s-1, are nearly Gaussian, except in the CO line at the central position. Toward the whole observed region, the CO spectra show weak emission at smaller velocities than that of the ambient cloud, which most likely arises from foreground or background molecular clouds.
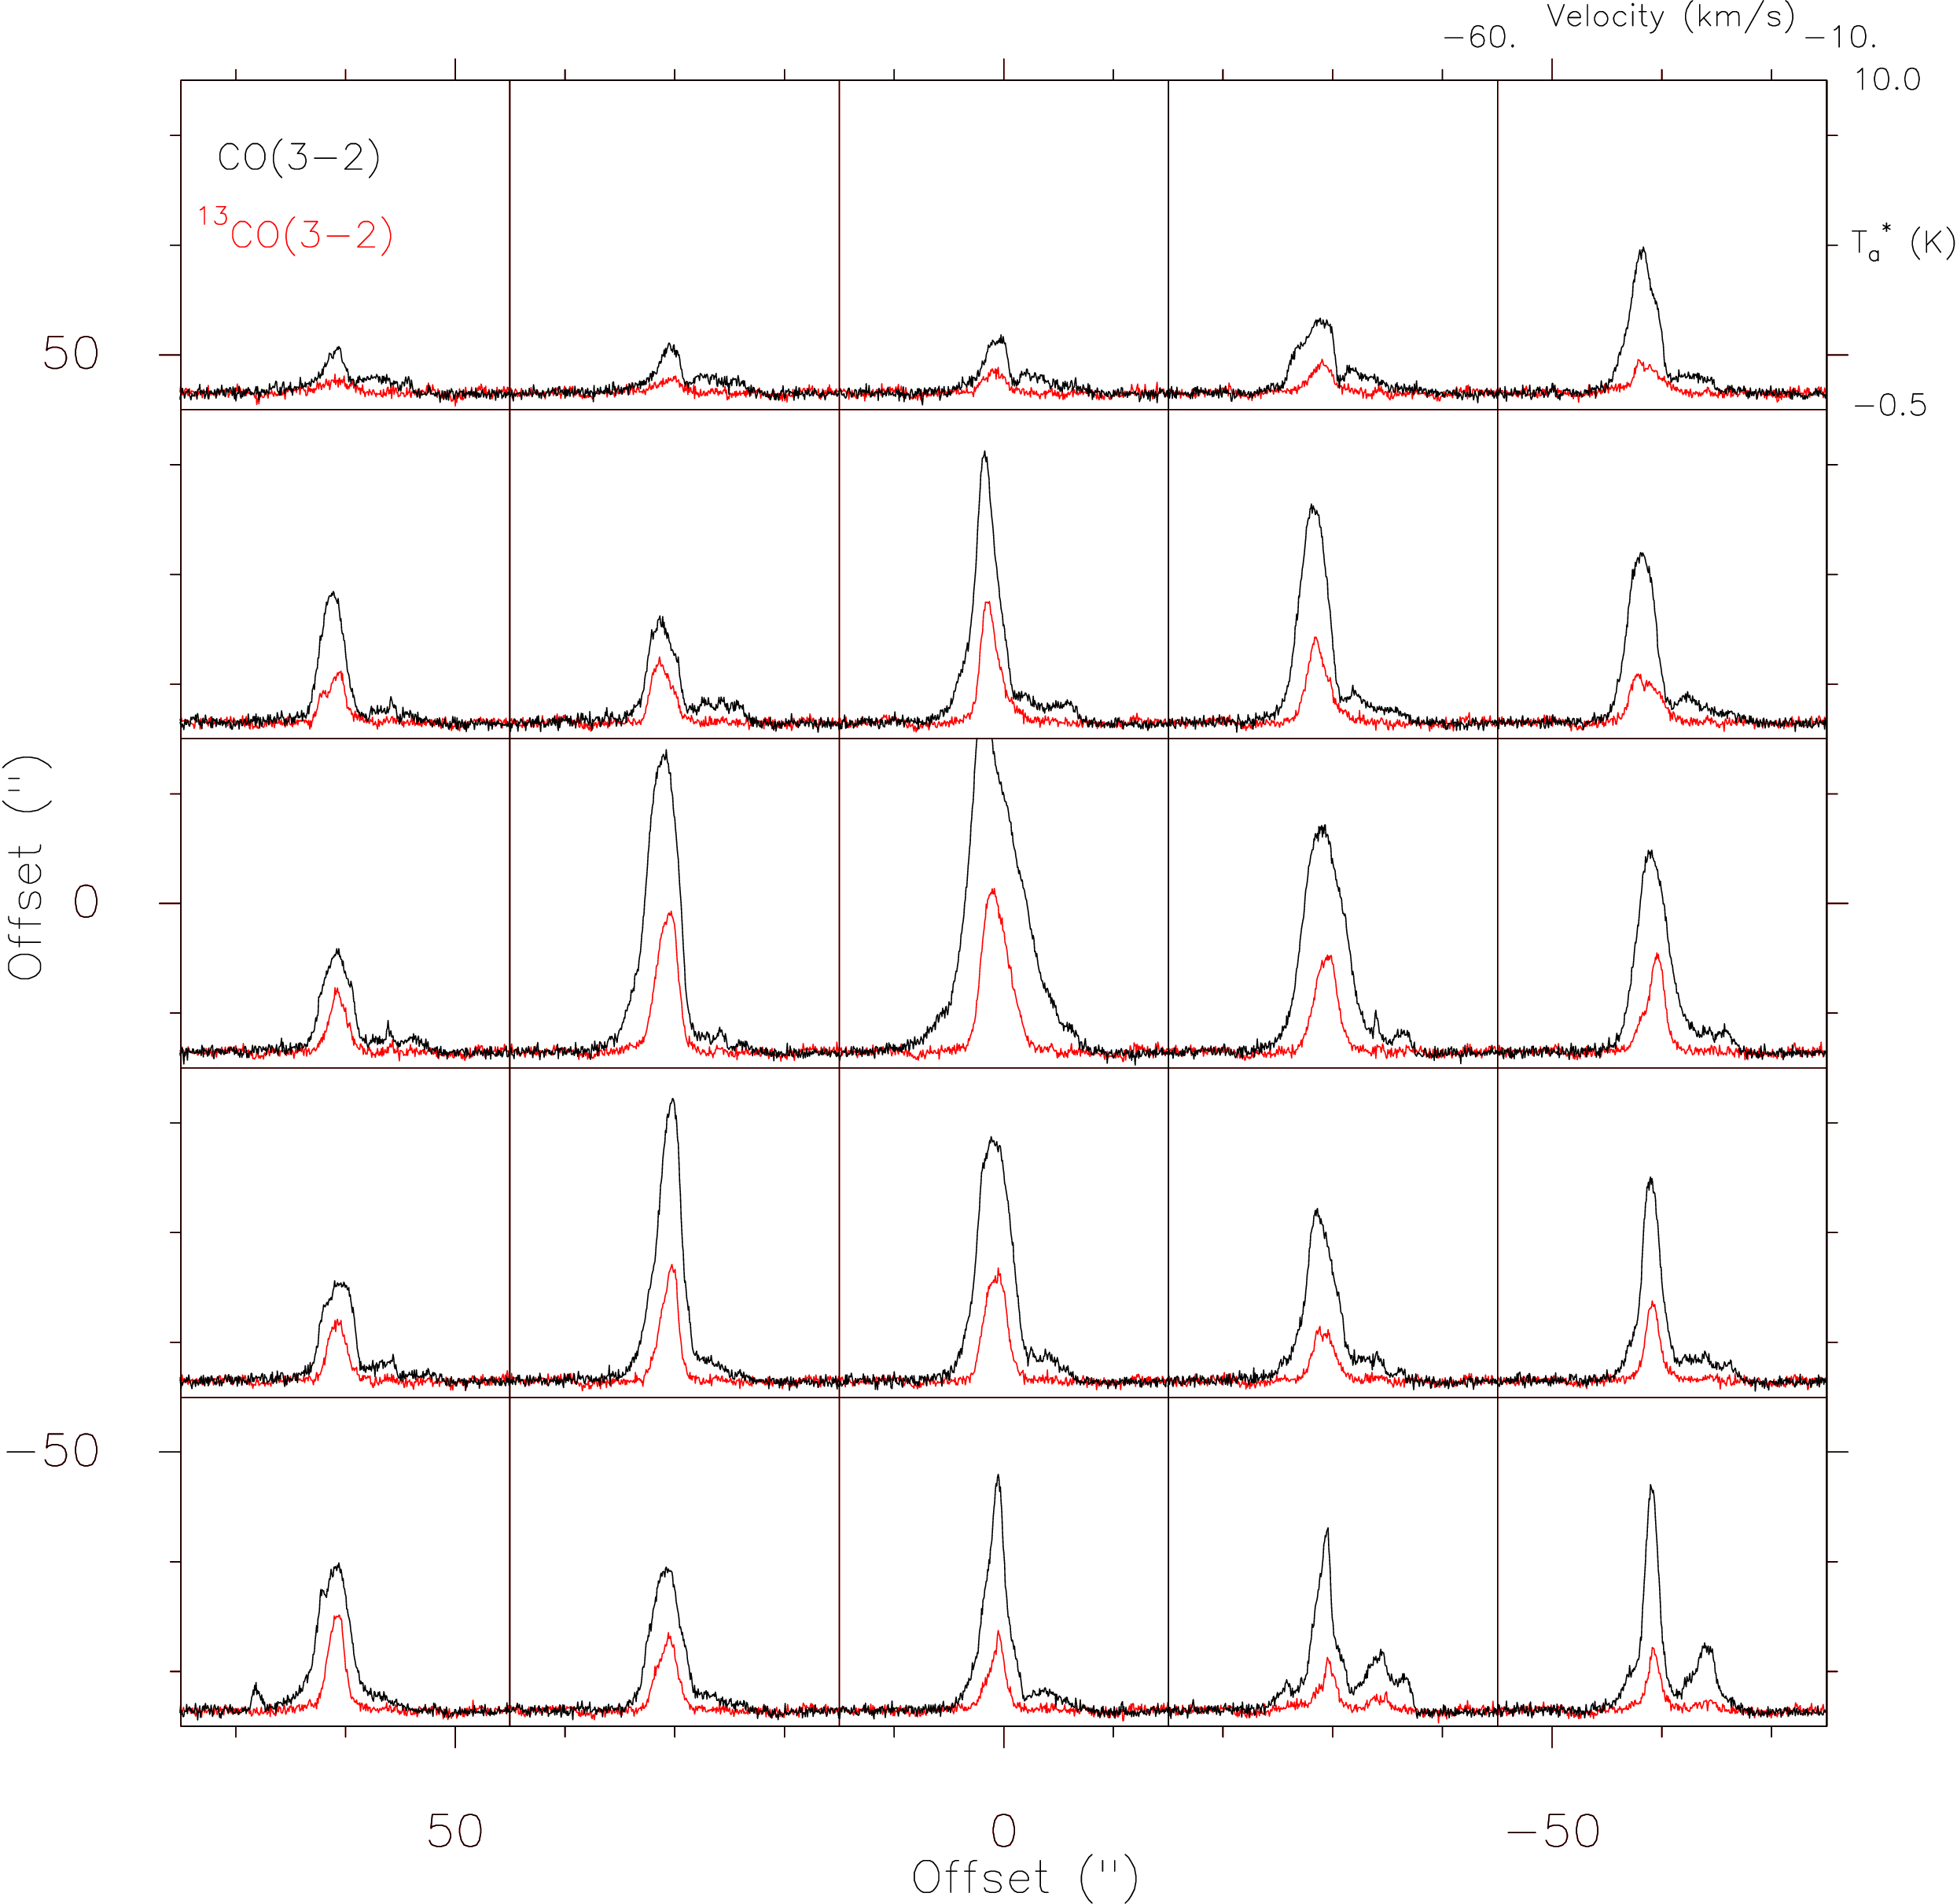
Table 2 gives the observed parameters of the spatially averaged emission in all the observed transitions. Columns 2 – 5 give, respectively, the peak antenna temperature, line center velocity, line width, and velocity integrated antenna temperature, determined from a Gaussian fit to the source averaged spectra. The observed line widths are broad, typically km s-1, much larger than the thermal width expected for a cloud with T K, indicating that the G305.136+0.068 core is highly turbulent. At the peak position of the core the CO and CS) spectra show an excess wing emission which may indicate the presence of outflowing gas.
| Line | T | VLSR | v (FWHM) | ||
|---|---|---|---|---|---|
| (K) | (km s-1) | (km s-1) | (K km s-1) | (″) | |
| CS) | 0.763 | 48 | |||
| CS) | 0.378 | 38 | |||
| CS) | 0.156 | 31 | |||
| CS) | 0.108 | 18 | |||
| CO | 4.79 | 64 | |||
| 13CO | 2.06 | 59 |
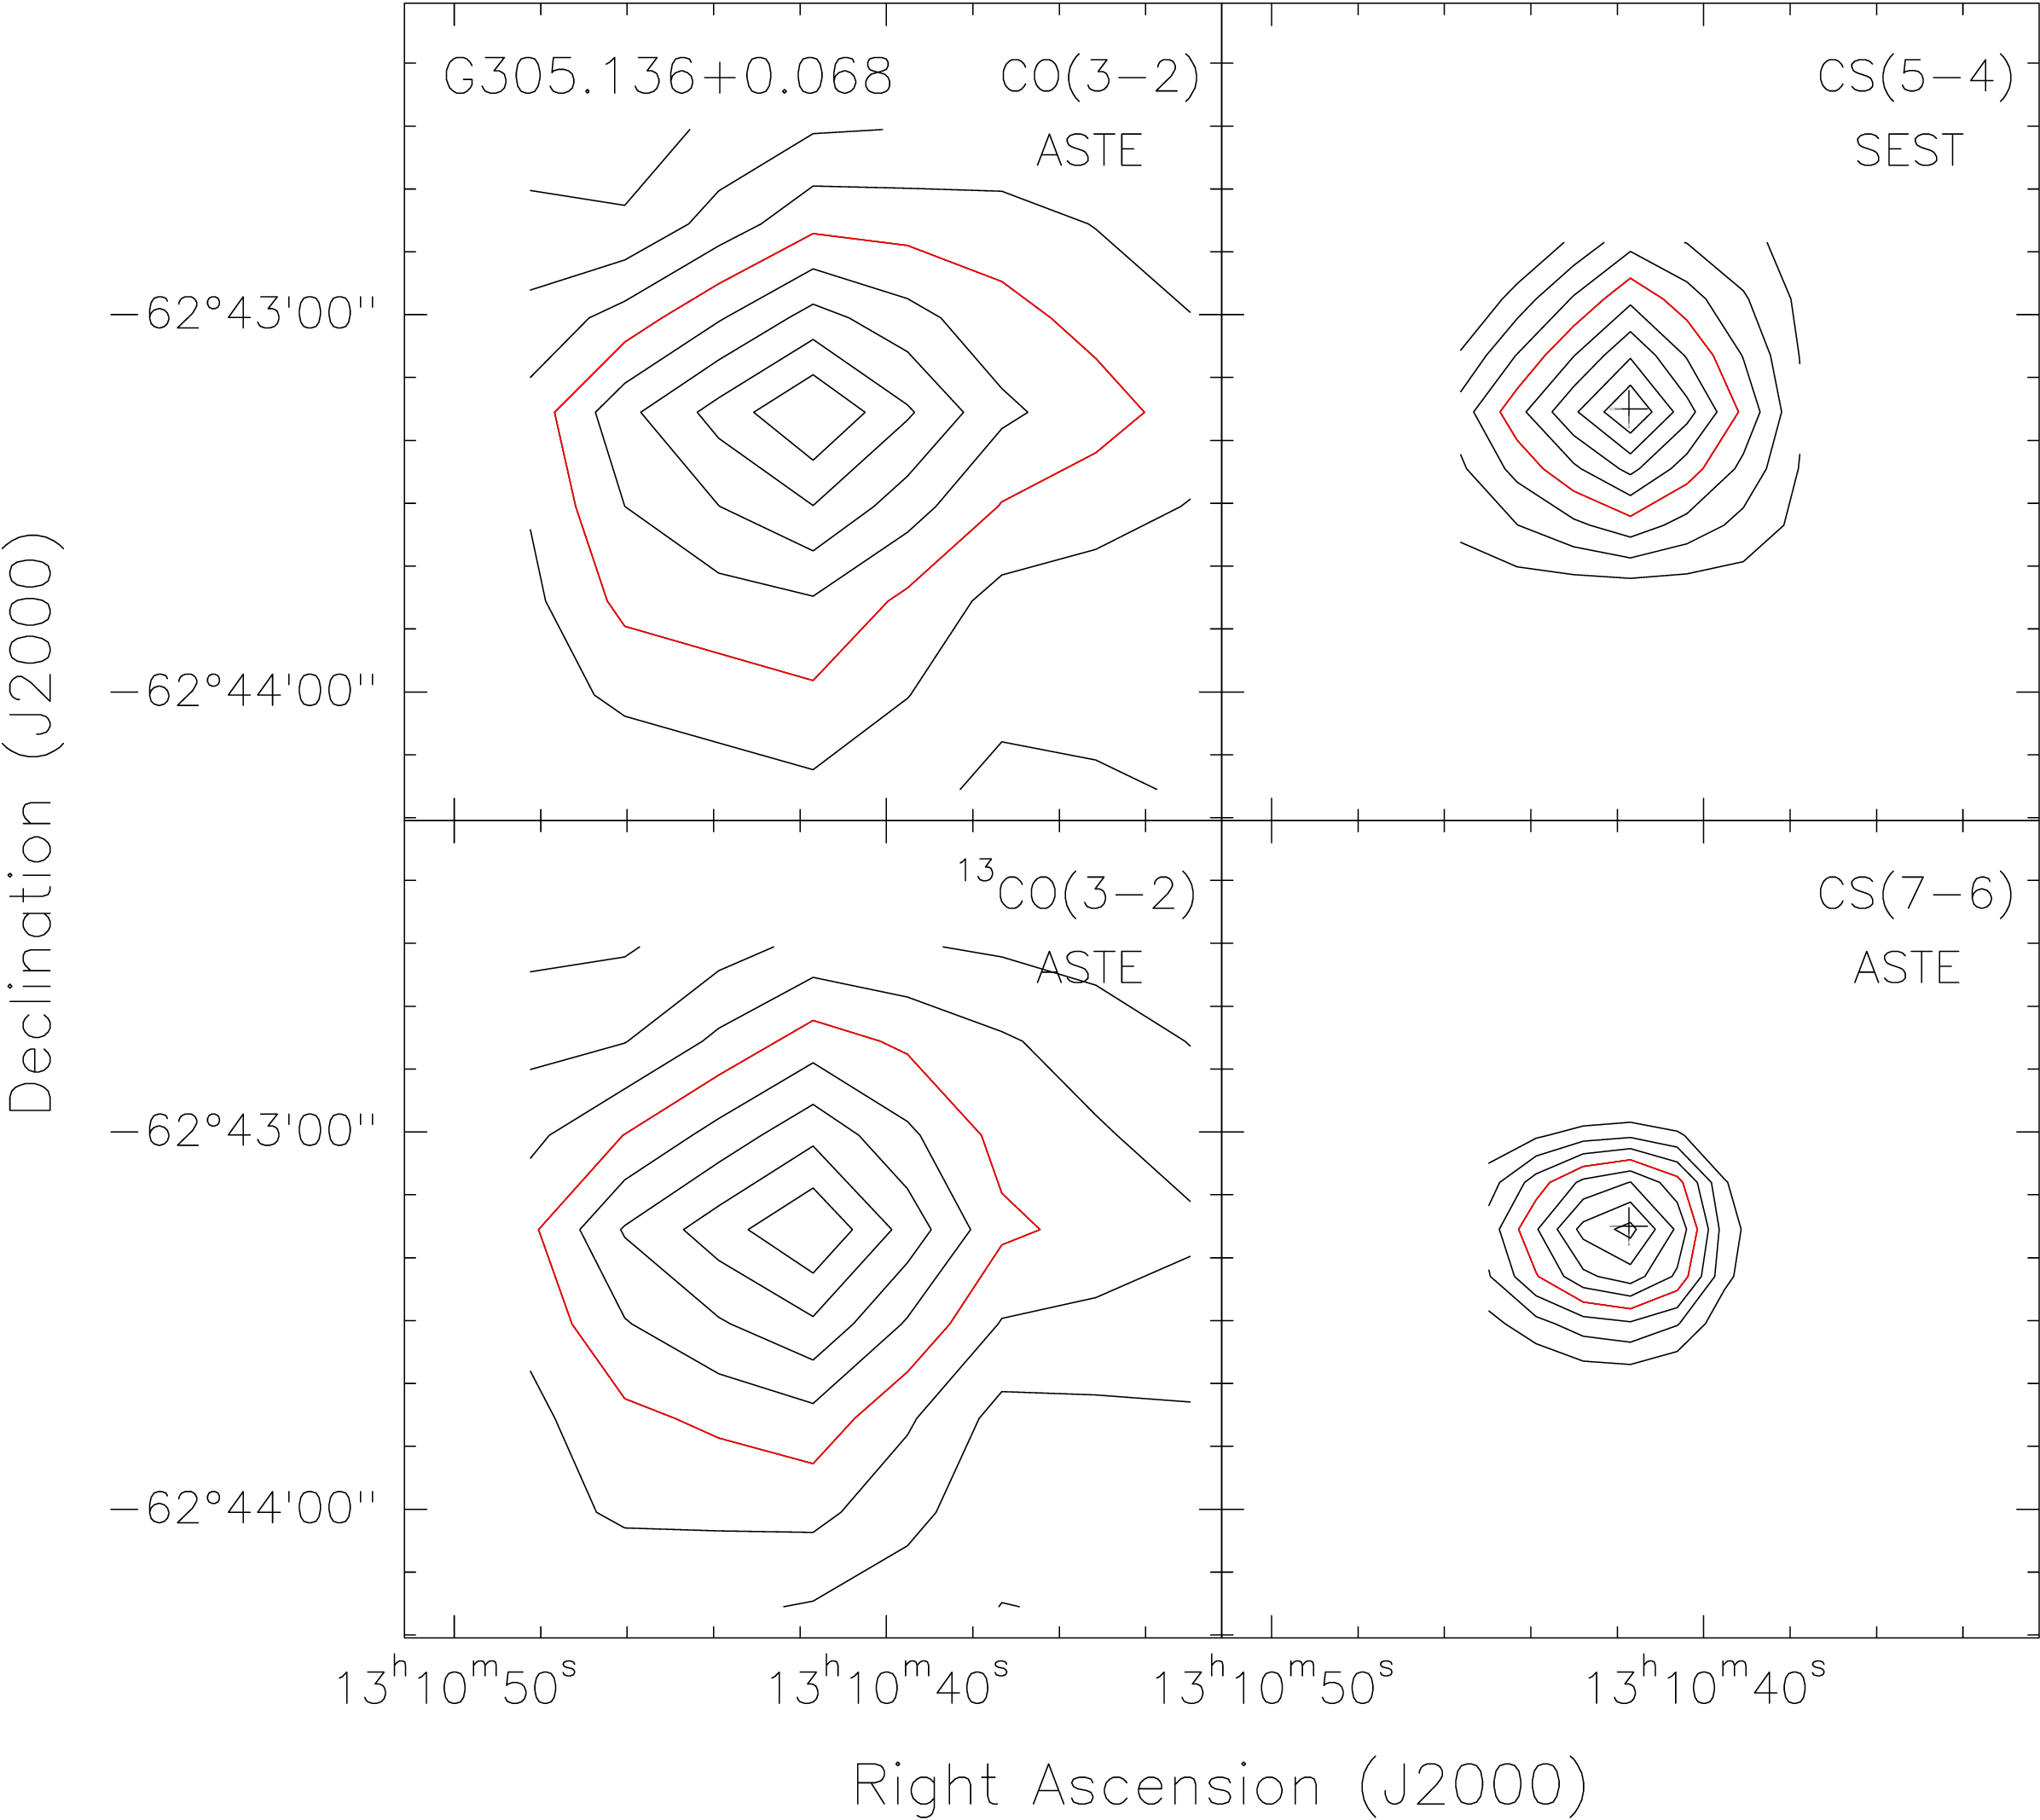
Figure 2 presents contour maps of the velocity integrated ambient gas emission in the CO, 13CO, CS) and CS) lines. The range of velocity integration is from to km s-1 for the CO lines and from to km s-1 for the CS transitions. G305.136+0.068 appears as a distinct isolated molecular core. Column 6 of Table 2 gives the FWHM angular size of the core in each observed transition. Assuming that the core is at a distance of 3.4 kpc (Garay et al., 2004), the radius in the different transitions range from 0.15 to 0.5 pc.
3.2 Dust emission
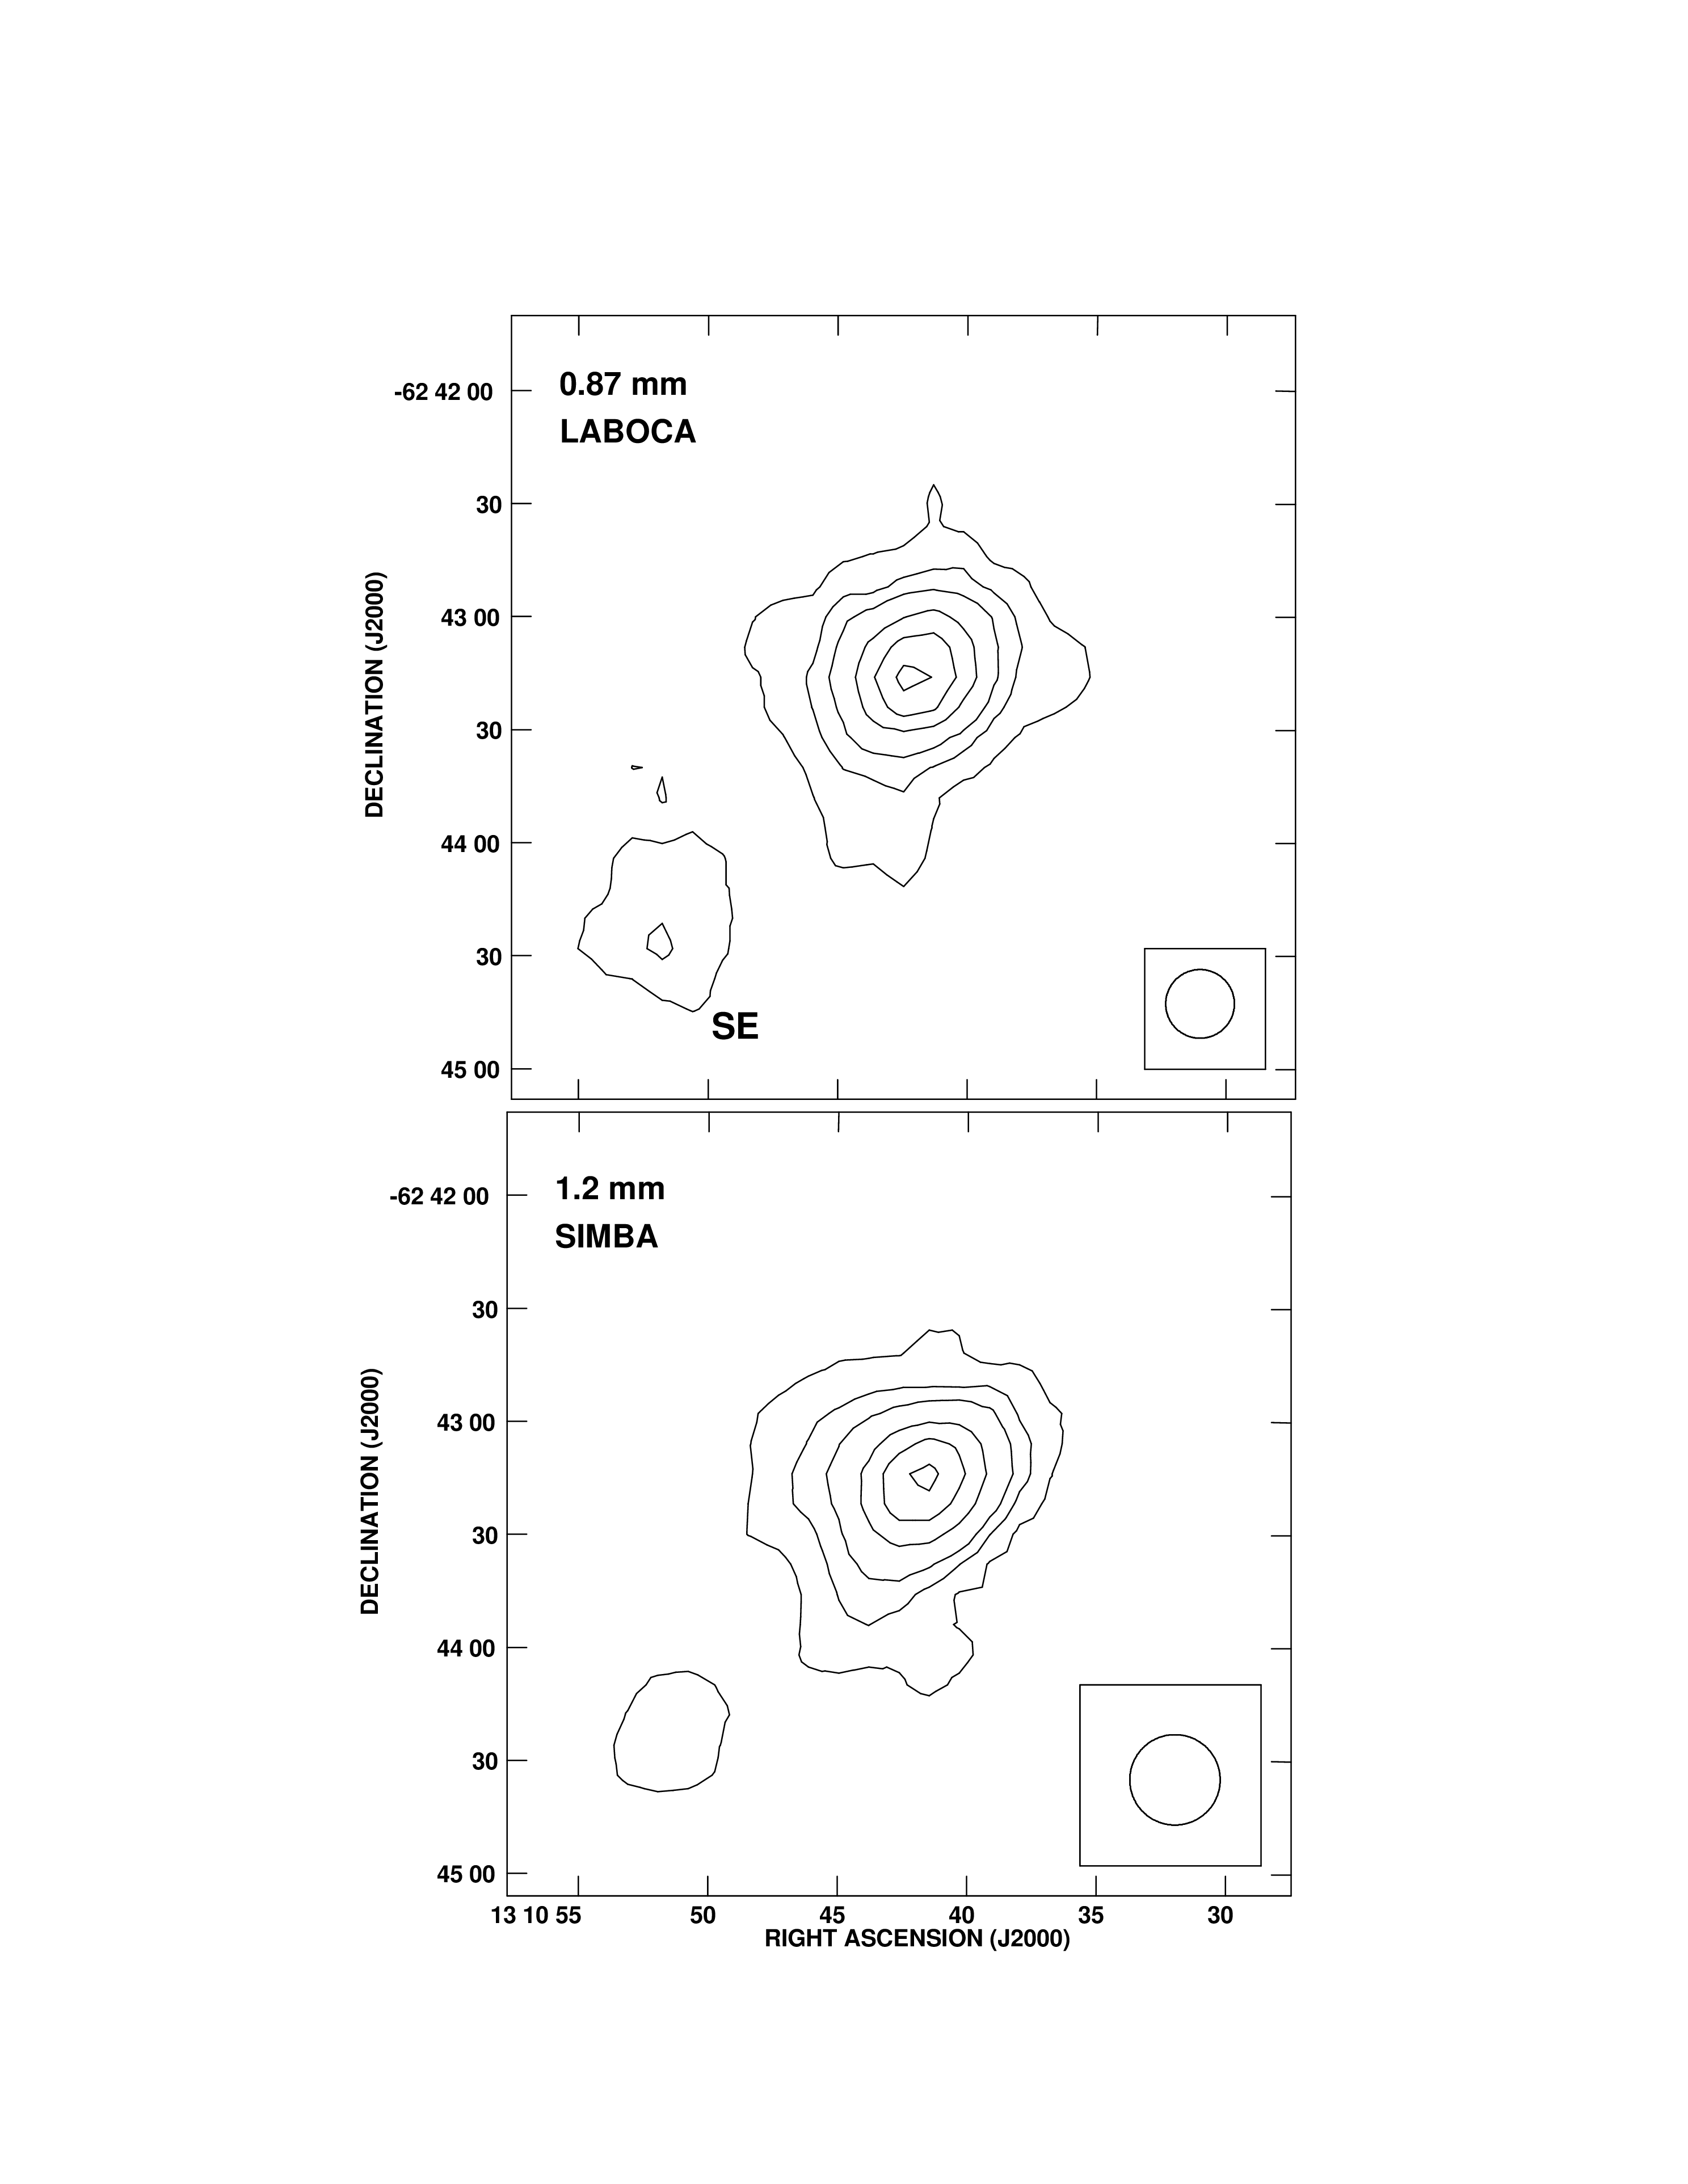
Figure 3 presents a contour map of the 0.87 mm continuum emission observed towards the G305.136+0.068 core (upper panel) and, for comparison, a contour map of the 1.2 mm continuum emission (lower panel; Garay et al. (2004)). The extent and morphology of the dust continuum emission is similar at both wavelengths. The observed parameters of the cold core at 0.87 mm are given in Table 3. Also given in this Table are the parameters of the weak 0.87-mm source located ′ SE of G305.136+0.06. Columns 2 and 3 give the peak position. Columns 4 and 5 give, respectively, the peak flux density and the total flux density, and column 6 gives the deconvolved major and minor FWHM angular sizes determined by fitting a single Gaussian profile to the spatial distribution. We note, however, that Gaussian fits to the spatial distribution of the dust continuum emission do not give good fits.
| Source | Peak position | Flux densityaaFrom Gaussian fits to the spatially averaged emission. | Angular size bbErrors in the angular sizes are typically 10%. | |||
|---|---|---|---|---|---|---|
| (2000) | (2000) | Peak | Total | (″) | ||
| h m s | (Jy/beam) | (Jy) | ||||
| G305.136+0.068 | 13 10 42.06 | -62 43 15.6 | 3.37 | 16.1 | ||
| G305.136+0.068SE | 13 10 51.97 | -62 44 24.2 | 0.76 | 3.2 | ||
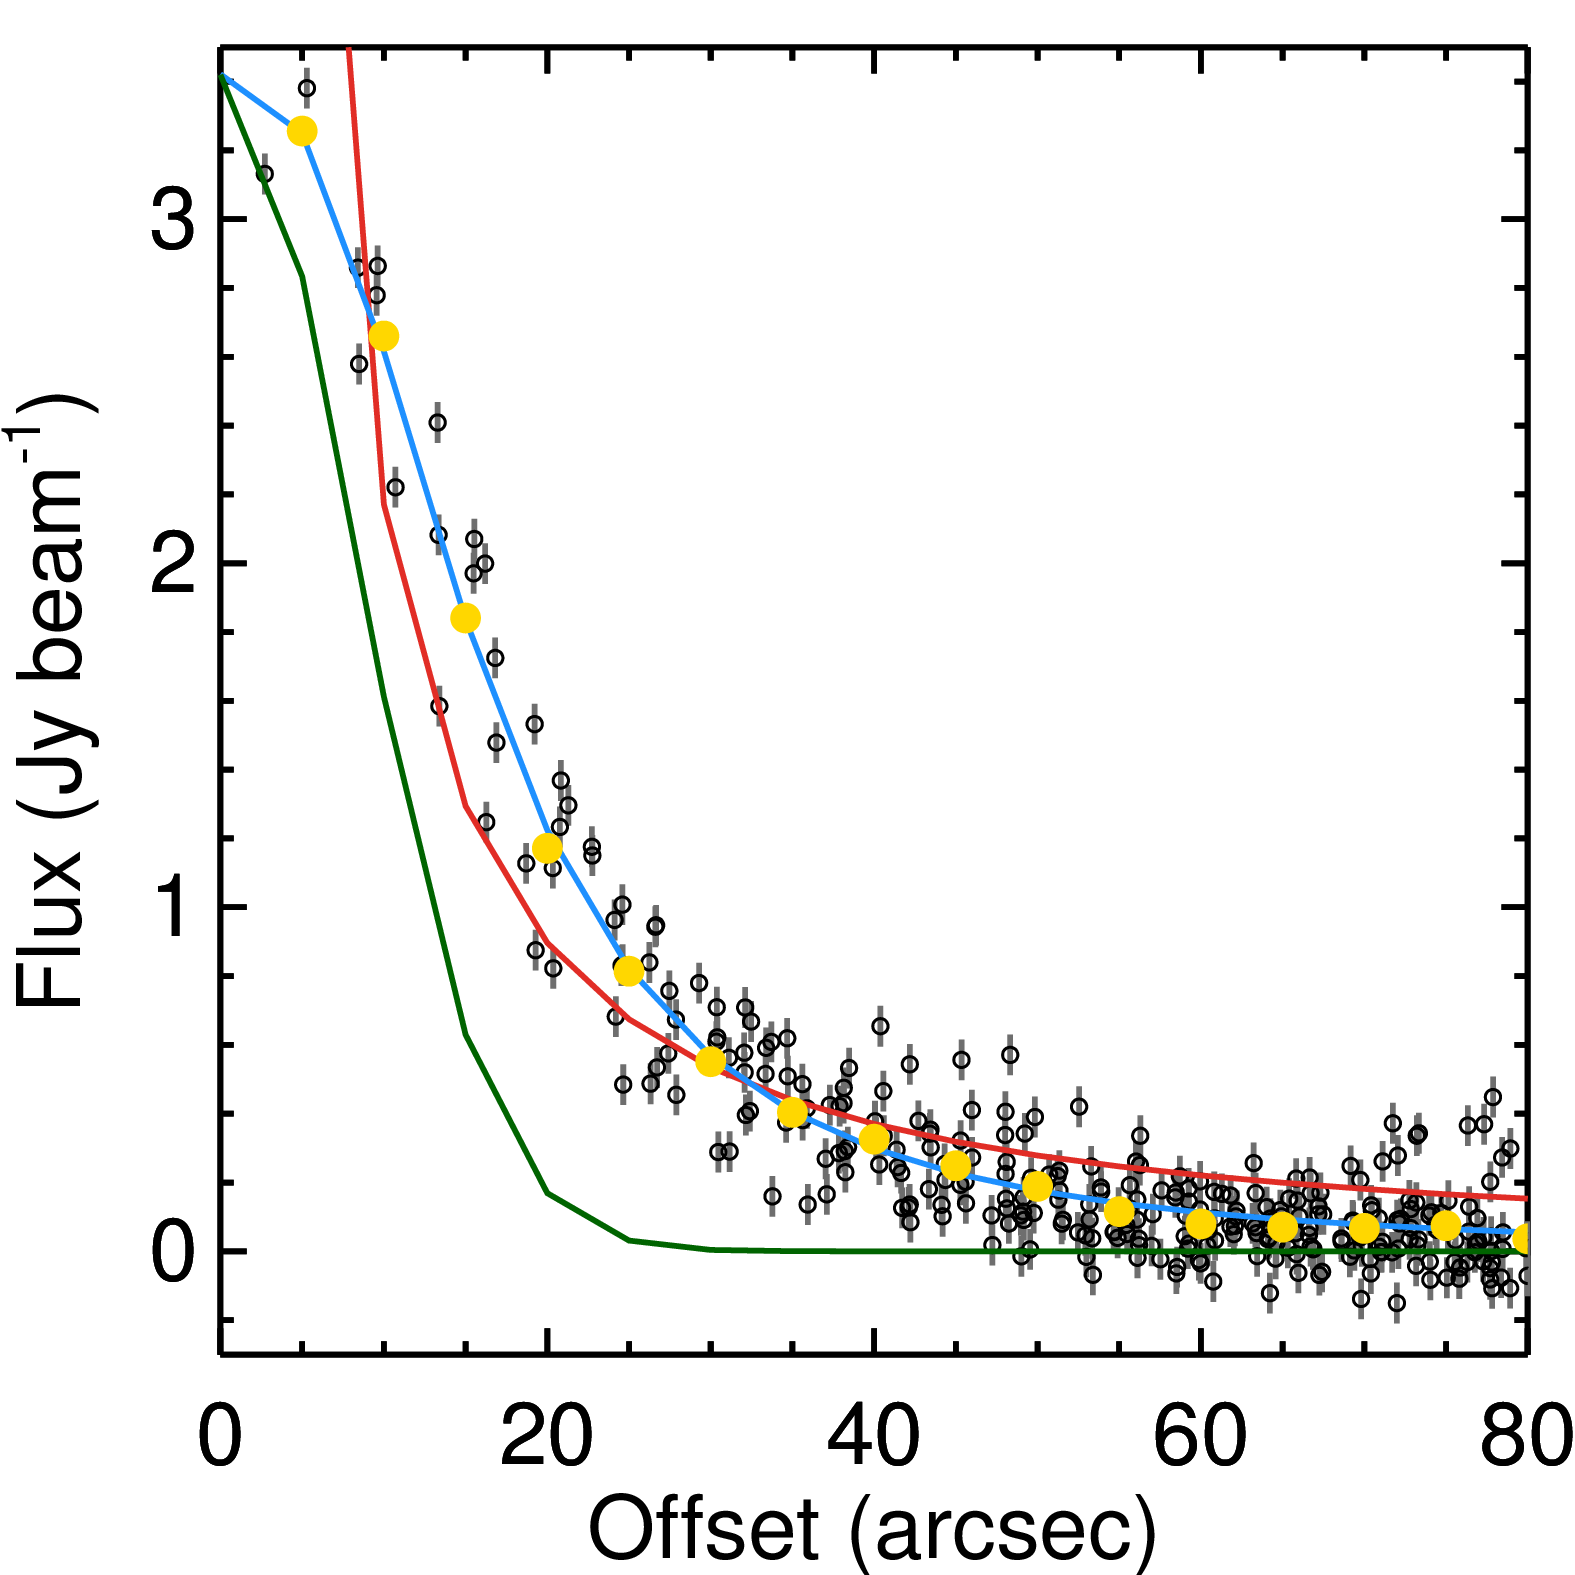
Figure 4 shows the observed flux density per beam at 0.87 mm as a function of radial distance from the peak position of the core, within a region of radius. The yellow circles show the average flux at uniformly spaced annuli of 5″ width. A power-law fit to the radial intensity profile, shown by the red curve, does not provide a good fit to the central and outer regions. We find that the observed radial intensity profile, , is best reproduced with the function,
| (1) |
where is the distance from the center, is the asymptotic power-law exponent, is the central intensity, and is the radius of the central “flat” region. The best fit, shown by the blue curve in Figure 4, gives the following parameters ″, Jy beam-1, and . If we assume that the temperature and opacity does not change much as a function of radius then , where is the column density, suggesting that the core has a steep density profile. Tafalla et al. (2004), using the same parametrization, found similar density profiles for starless low-mass dense cores.
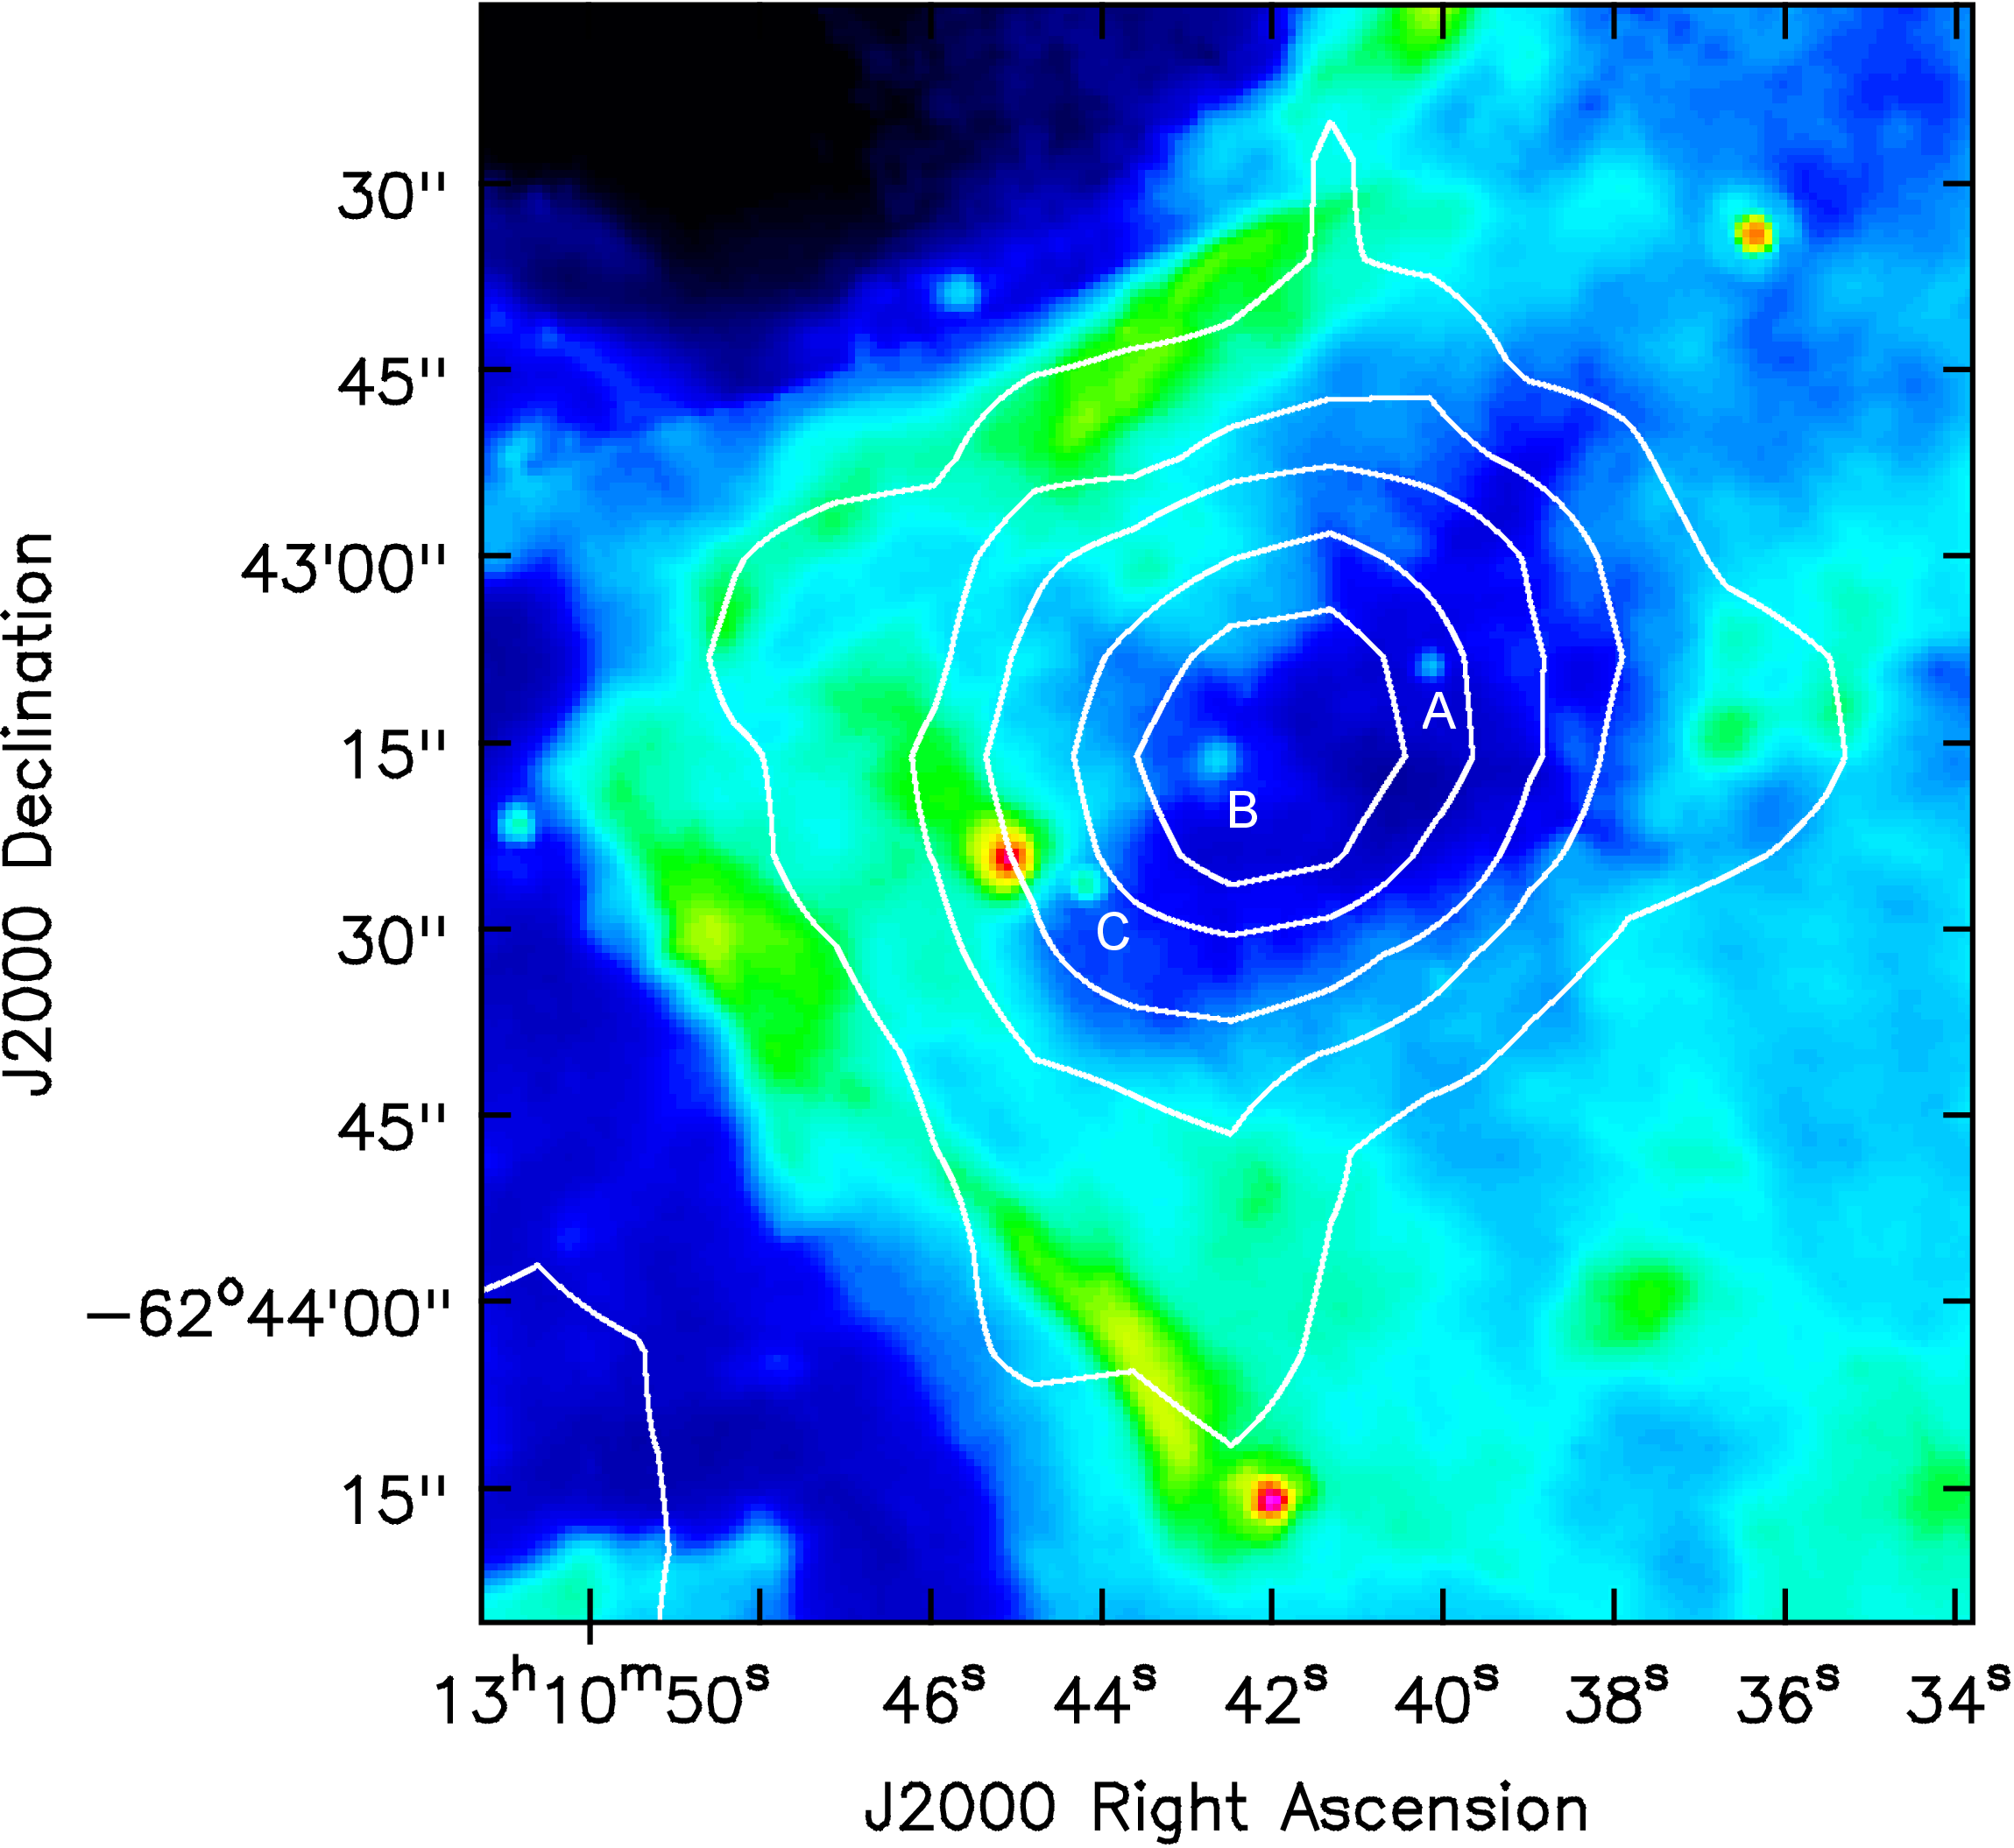
The mid-infrared GLIMPSE and MIPS images show that the molecular core is seen in silhoutte against the Galactic background emission, indicating that is cold and that has opacities greater than 1 at all wavelengths shorter than m. Furthermore, in all bands the core appears to be surrounded by an envelope of emission, with an angular radius of 45”. This is illustrated in Figure 5 which presents the 8.0 m GLIMPSE image image towards the G305.136+0.068 core. The envelope is most prominent in the 5.8 and 8.0 m images and is weak in the 4.5 m image. The 5.8 and 8.0 m bands are sensitive to emission from polycyclic aromatic hydrocarbon (PAH) molecules, whereas the 4.5 m band does not contain any PAH emission feature. Thus, the envelope emission is most likely to arise from a photo-dissociated region externally heated by the Galactic UV radiation field.
4 Discussion
4.1 Parameters derived from molecular line observations
Optical depths, column densities and total mass of the core were derived from the observations of the CO and 13CO lines as follows. From the ratio of the observed brightness temperatures in the CO and 13CO lines, we derived the opacity in the 13CO line as a function of the velocity in each of the observed positions of the core (see expressions [A2] and [A3] of Bourke et al. (1997). We assumed an excitation temperature of 18 K and a [CO/13CO] abundance ratio of 50.
The total column density of the 13CO molecule, in each of the observed positions, was then computed from the opacity in the 13CO line, , and excitation temperature, , using the expression (e.g., Garden et al., 1991)
| (2) |
where is measured in km s-1. This expression assumes that all energy levels are populated according to local thermodynamic equilibrium at the temperature . We find that the 13CO column density at the peak position of the core is cm-2. Integrating the column densities over the solid angle subtended by the core and assuming a [H2/13CO] abundance ratio of (Pineda et al., 2008), we derive that the core has a total mass of . The molecular density derived from this mass and the observed radius in the line, of 0.49 pc, assuming that the core has uniform density, is cm-3.
Another estimate of the total mass using the molecular line observations can be made assuming that the core is in virial equilibrium (MacLaren et al., 1988). From the observed size and average line width in the 13CO and CS) transitions, we derive virial masses of and , respectively.
4.2 Parameters derived from dust observations
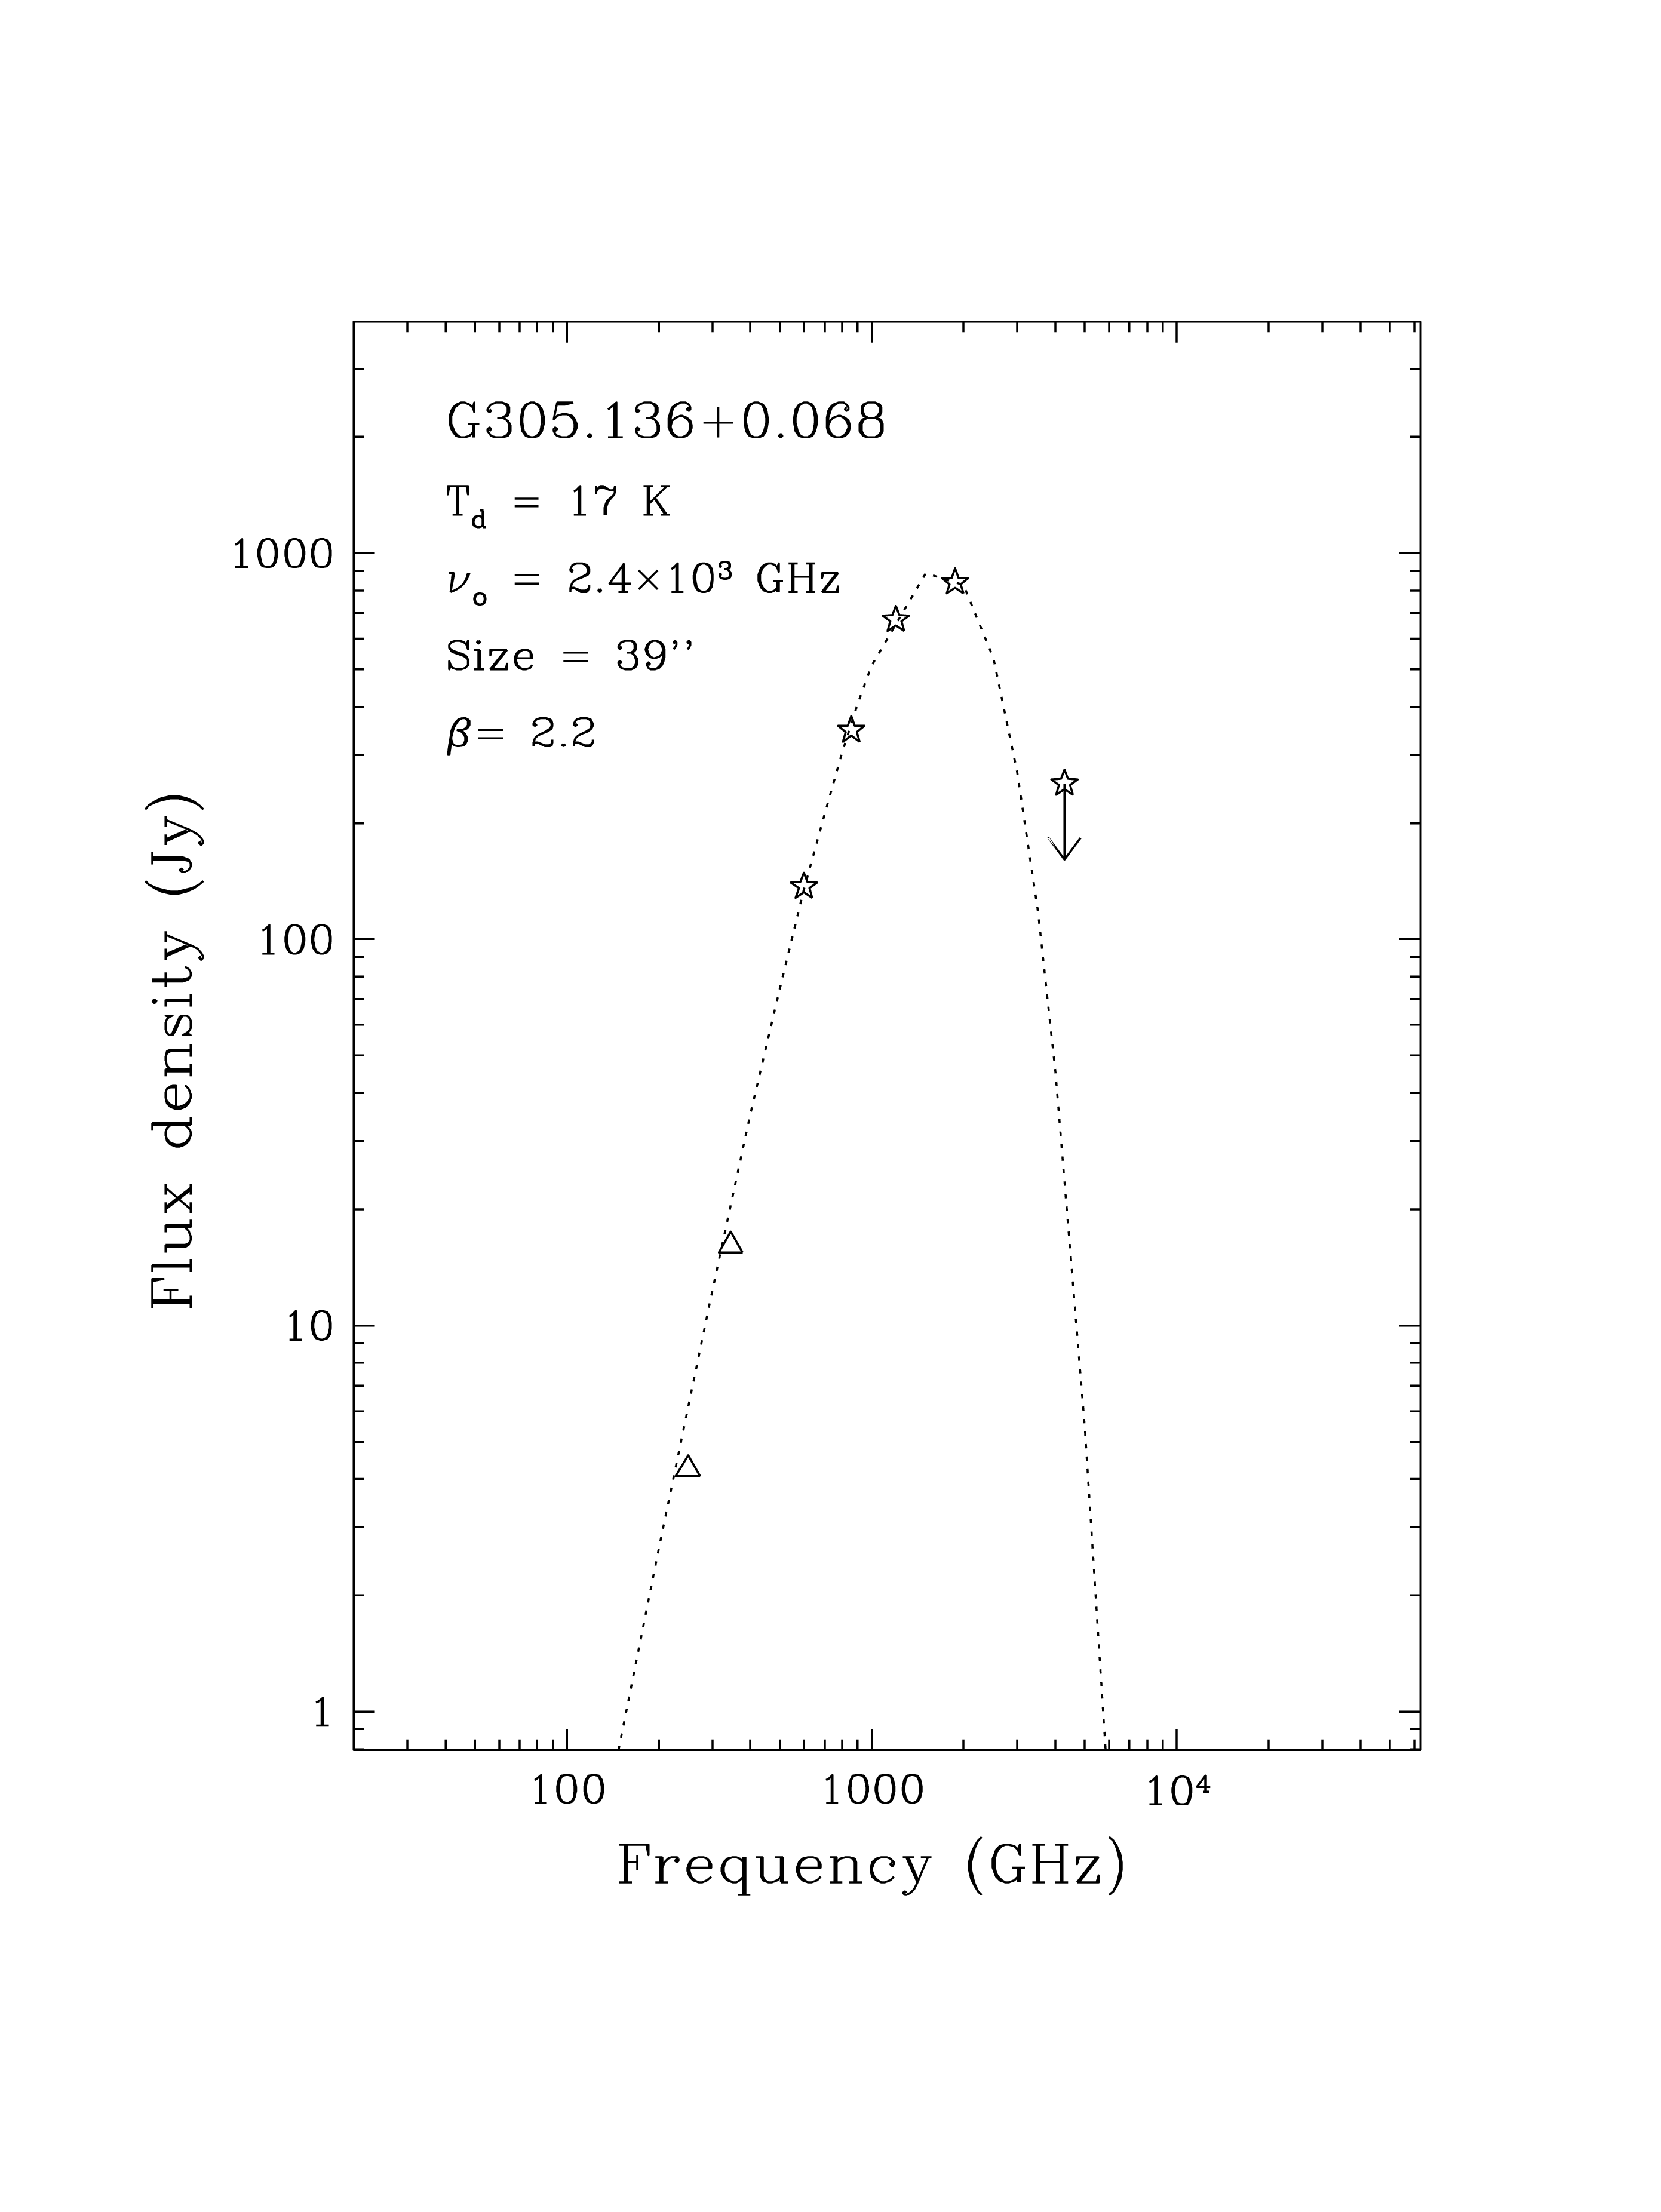
The parameters of the core derived from the 0.87 mm observations are summarized in Table 4. To determine the core dust temperature we made use of the publicly available Herschel images in the wavelength range from 70 to 500 m. Figure 6 shows the spectral energy distribution (SED) from 70 m to 1.2 mm. In this wavelength range the emission is mainly due to thermal dust emission. The flux density at 70 µm correspond to an upper limit. We fitted the SED using a modified blackbody function of the form where is the dust optical depth, is the Planck function at the dust temperature , and is the solid angle subtended by the dust emitting region. The opacity was assumed to vary with frequency as , i.e. , where is the frequency at which the optical depth is unity, refered as the turnover frequency. The best fit to the SED, shown as dotted line in Figure 6, indicates a dust temperature of 17 K, a turnover frequency of GHz, an angular size of 39 and a dust opacity power law index of 2.2. The column density derived from the turnover frequency is cm-2. This value, equivalent to 1.1 g cm-2, is slightly above the theoretical threshold required for the formation of high mass stars (Krumholz & McKee, 2008), suggesting that the G305.136+0.068 core will form high mass stars.
| Source | Td | Radius | Mass | n(H2) | N(H2) | |
|---|---|---|---|---|---|---|
| (K) | (pc) | (M⊙) | (cm | (cm-2) | ||
| G305.136+0.068 | 17. | 0.29 | 0.02 |
Assuming that the observed flux density at 0.87 mm, , corresponds to optically thin, isothermal dust emission, then the mass of the core, given in Column 4 of Table 4, was determined using the expression (e.g. Chini et al., 1987),
| (3) |
where is the dust-to-gas mass ratio (assuming 10% He) with a value of , is the mass absorption coefficient of dust with a value of 2 cm2 g-1 (Ossenkopf & Henning, 1994), and is the Planck function at the dust temperature . The mass derived is , in good agreement with the LTE mass and the virial masses. The average molecular density and average column density, derived from the mass and radius assuming that the core has uniform density, are given in columns 5 and 6 of Table 4. We stress that these values should be taken with caution, since as discussed in §3.2, the G305.1360.068 cold core exhibits a steep density gradient. Finally, column 7 of Table 4 gives the average continuum optical depth at 0.87 mm. It takes a value of 0.02, consistent with the optically thin assumption.
The similar values of the molecular gas mass (derived from both the dust continuum emission and LTE analysis) and the virial mass (which measures the gas plus stellar mass), suggest that a significant fraction of the total mass of this massive dense cold core is in the form of molecular gas, and hence that the gas dominates the gravitational potential.
4.3 Parameters derived from line profile modelling
As previously discussed, the physical conditions in the core are unlikely to be uniform, but depend with the distance from the central region. To determine the physical structure of the cloud, model profiles in the CS J=21, 32, 54, and 76 lines were computed and compared with the observed profiles. The model profiles were obtained using a Monte Carlo radiative transfer code (Mardones, 1998) based on Bernes (1979). To obtain a reliable CS (76) profile we used 14 levels and 13 transitions in the Monte Carlo simulation. The robustness of the Monte Carlo method is widely discussed by van van Zadelhoff et al. (2002).
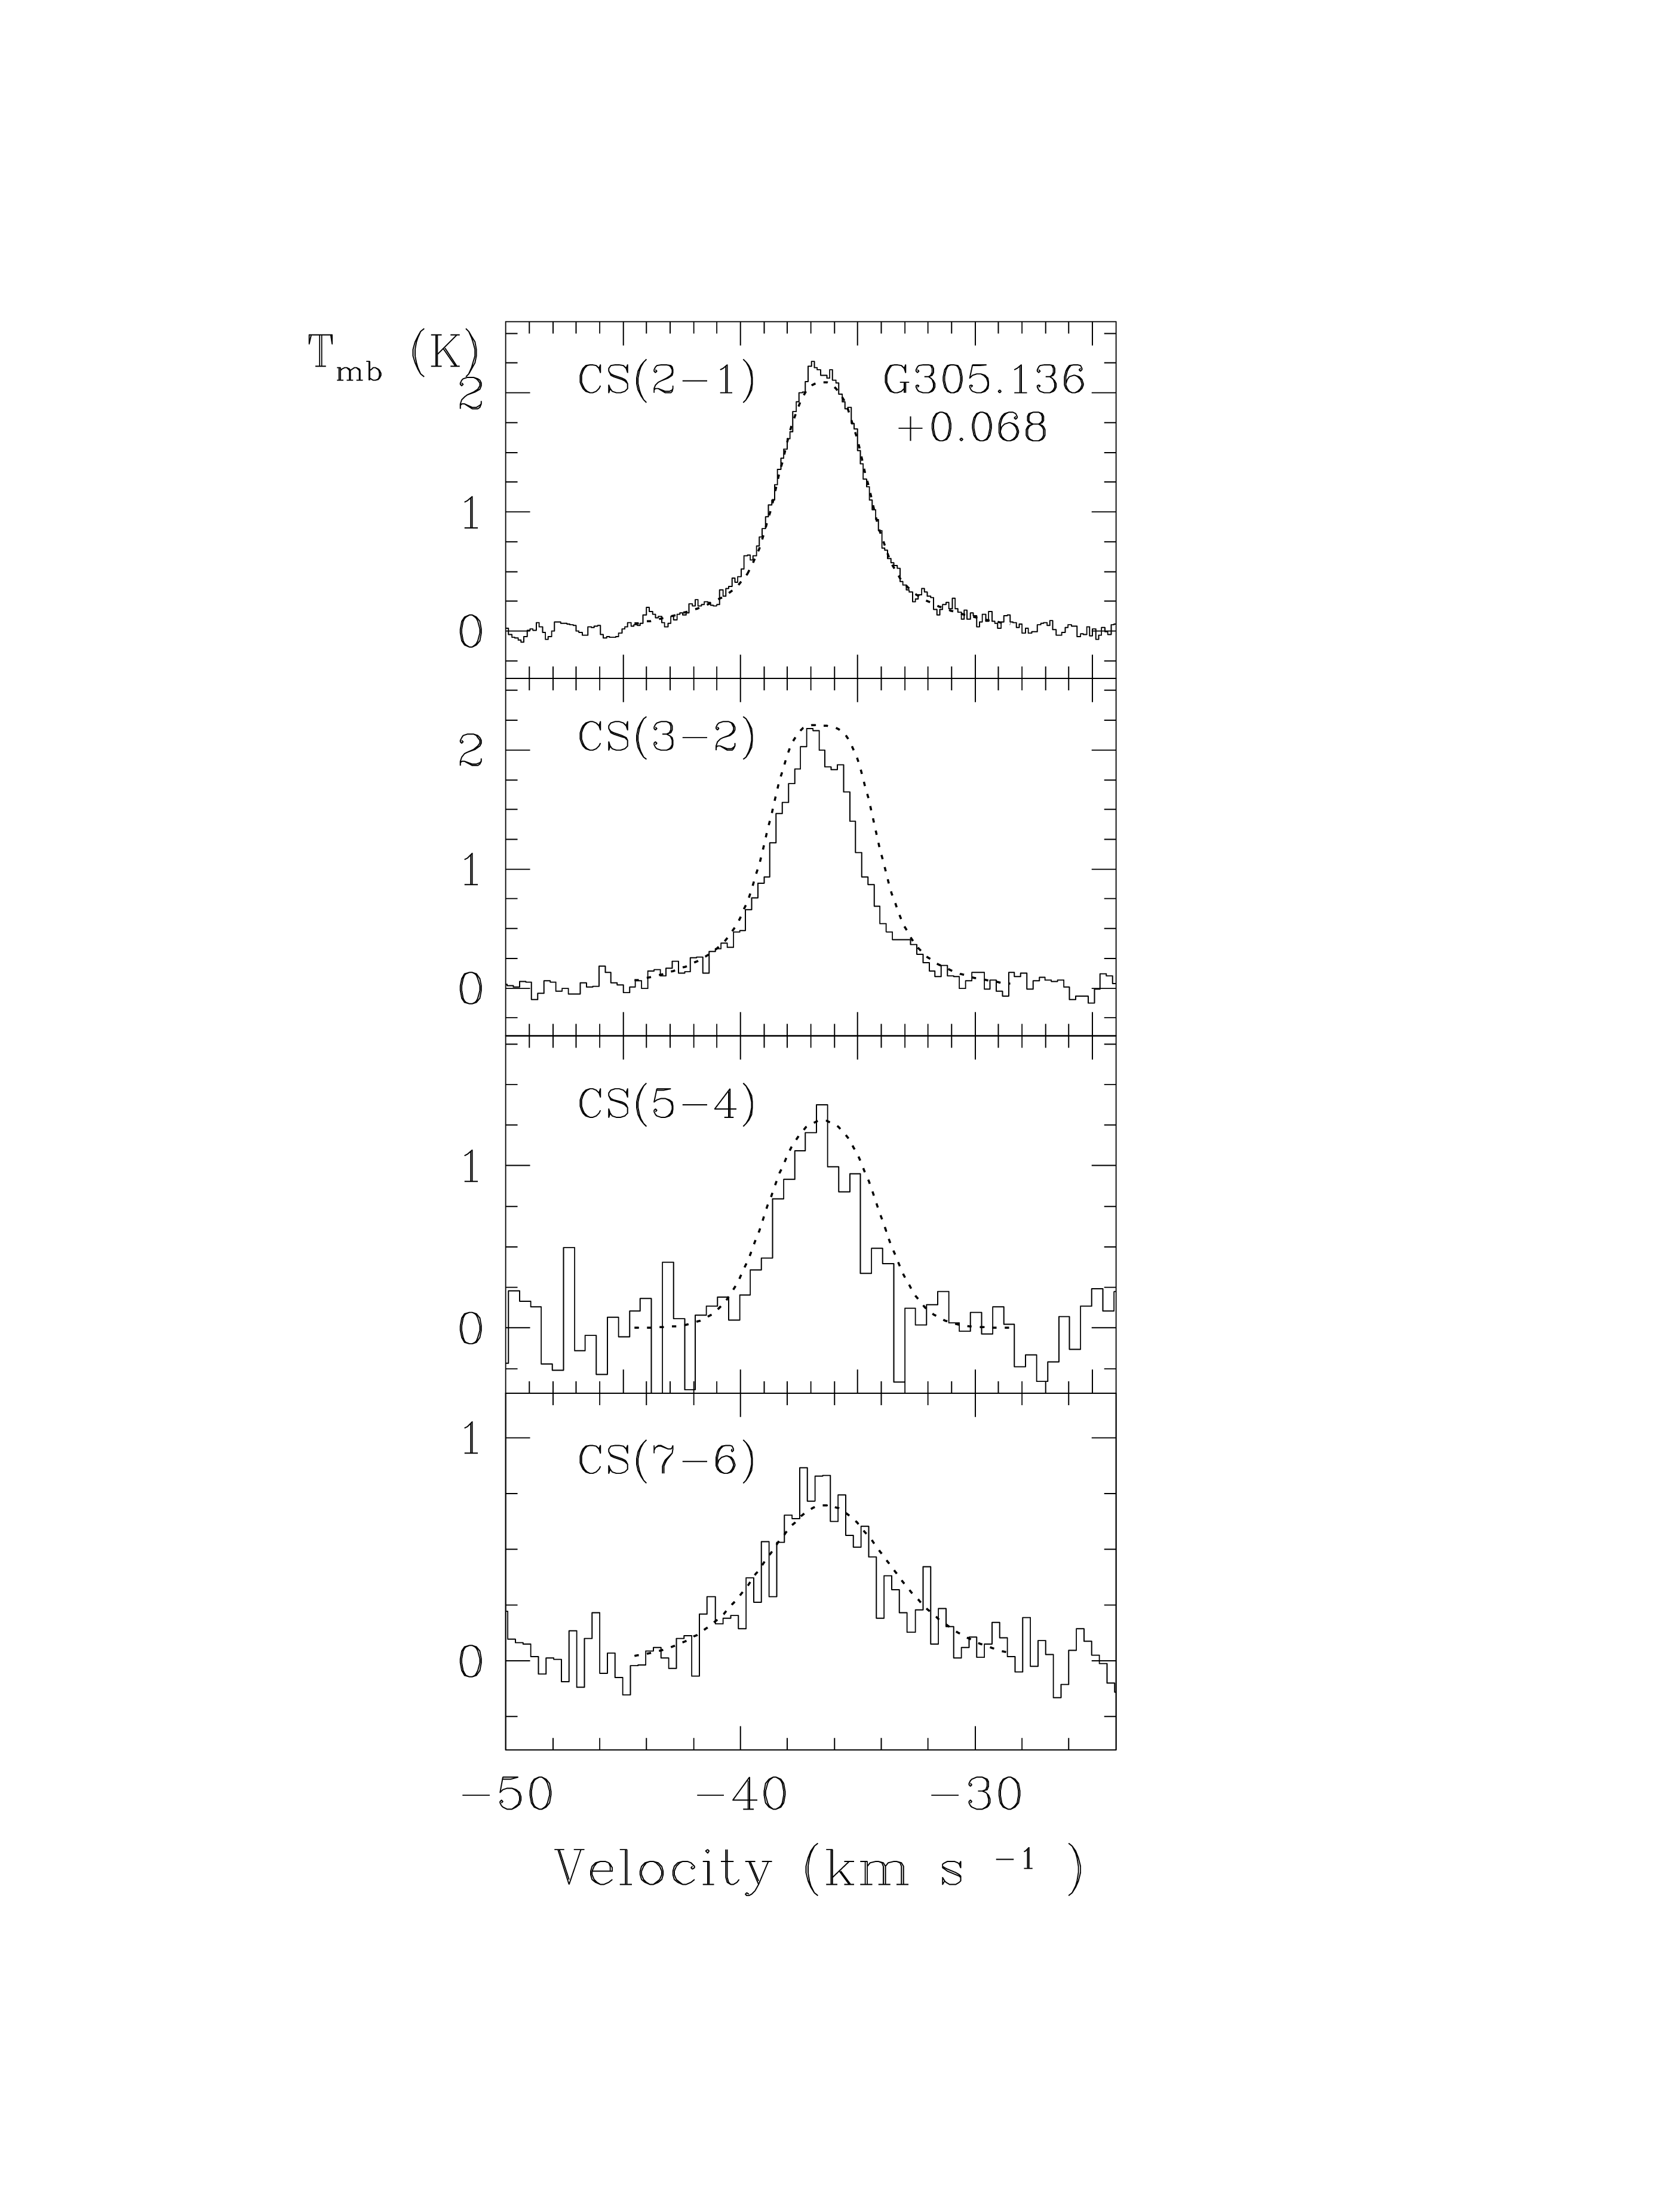
To model a cloud requires us to adopt the dependences of the physical parameters with radius. Here we assume that the density, kinetic temperature, velocity field and turbulent velocity follow power-law dependencies with radius. Besides the great simplicity and flexibility in the program provided by this choice, these are realistic assumptions. We find that the simple power-law model can very well fit the observed data. This is illustrated in Figure 7 which shows the four CS spectra observed at the peak position of the core and in dotted line the results of the best fit model. We assumed a [CS/H2] abundance ratio of (Tafalla et al., 2004). The model fit implies that the core is very dense and highly centrally condensed, with the density depending with radius as,
with minimum and maximum radius of 0.01 and 1 pc, respectively. The model fit also indicates that the turbulent velocity increases toward the center of the core as,
This result is supported by recent observations which show that the linewith increases toward the center (Servajean et al., private communication). Finally, the model fit also implies that the core is cold, and that the temperature slightly increases towards the center as,
4.4 Embedded sources
| Source | RA(J2000) | Dec.(J2000) | Flux density (mJy) | ||||
|---|---|---|---|---|---|---|---|
| 3.6 m | 4.5 m | 5.8 m | 8.0 m | 24.0 m | |||
| A | 13 10 40.212 | 43 9.03 | 0.8673 | 4.219 | 9.852 | 13.91 | 21.515 |
| B | 13 10 42.713 | 43 16.52 | -a | 14.56 | 21.18 | 18.45 | 95.281 |
| C | 13 10 44.158 | 43 26.46 | 11.52 | 20.12 | 27.05 | 29.12 | -b |
We searched for embedded sources within the core by inspecting all images available to the public taken with the Spitzer telescope. Within a region of 20″ in radius centered at the peak position of the dust core, we identified three compact sources that appear in both the 8 m and the 24 m images, making them good candidates for embedded objects. These sources, labeled A, B and C in Figure 5, were also detected in all the other IRAC bands. The observed parameters of the three objects are given in Table 5. Columns give the coordinates, columns the flux densities measured at 3.6, 4.6, 5.8, 8.0 and 24 m, respectively.
The spectral energy distributions of these objects were analyzed by fitting model SEDs using a large grid of precomputed models (Robitaille et al., 2007). The SED fitting indicates that two of the three sources (A and B) correspond to embedded objects. Source B, which is located closest to the peak position of the dust core, is most likely a very young protostellar object (age of yr) with a mass of 2.6 , a luminosity of 66 and associated with an envelope accreting at a high rate of yr-1. Given its large envelope accretion rate, it is possible that object B is the seed of a high mass protostar. Observational support for the presence of infalling gas within the central region of the G305.1360.068 cold core may be found in the observed profiles of the CO and 13CO lines, the former one exhibiting a broad asymmetric blueshifted profile and the later a narrower Gaussian profile. Clearly, further observations are needed to investigate this hypothesis. The SED fitting indicates that source A corresponds to a slightly older object (age of yr), with a mass of 5.8 , a luminosity of , without an envelope but with an accretion disk. The SED fitting indicates that source C is not embedded, and that it has an age of yr, a mass of 3.2 , a luminosity of 88 and that is associated with a disk with an outer radius of 80 AU.
5 Summary
We observed molecular line emission in the transitions of CO and 13CO and in several transitions of CS toward the G305.136+0.068 cold dust core. Also observed was the 0.87 millimeter continuum emission. The main results and conclusions are summarized as follows.
The molecular core is isolated and roughly circularly symmetric. However, the angular size (FWHM) of the core depends on the transition observed, ranging from 18″ in the CS) transition to 64″ in the CO transition. This indicates that the core exhibits a steep density dependence with radius. From the CO and 13CO observations we derive an LTE mass of , in good agreement with the mass derived from the dust observations of .
Model fit of the CS emission using a Monte-Carlo radiative transfer code indicates that the G305.136+0.068 core is very dense and centrally condensed, with a density dependence with radius following a power law with an index of . The model fit also indicates that the turbulent velocity and temperature increases toward the center of the core following power law with indices of and , respectively.
A fit to the SED of the emission from millimeter to far infrared wavelengths gives a dust temperature of 17 K, confirming that the core is cold, and an average column density of cm-2 or equivalently 1 gr cm-2. This value is slightly above the theoretical threshold value required for the formation of high mass stars (Krumholz & McKee, 2008).
We found two embedded sources within a region of ″ centered at the core. The object closest to the core center is young, has a luminosity of 66 and is accreting mass with a high accretion rate, of yr-1. This object may correspond to the seed of a high mass protostar still in the process of formation. All the above results indicate that G305.136+0.068 corresponds to a massive and dense cold molecular core, in a very early evolutionary stage, in which the formation of a central massive object may have just started.
References
- Bernes (1979) Bernes, C. 1979, A&A, 73, 67
- Beuther et al. (2002) Beuther, H., Schilke, P., Menten, K. M., Motte, F., Sridharan, T. K., & Wyrowski, F. 2002, ApJ, 566, 945
- Bourke et al. (1997) Bourke, T. L., et al. 1997, ApJ, 476, 781
- Carey et al. (2006) Carey, S. J., et al. 2006, in Bulletin of the American Astronomical Society, Vol. 38, American Astronomical Society Meeting Abstracts, 1023
- Chini et al. (1987) Chini, R., Kruegel, E., & Wargau, W. 1987, A&A, 181, 378
- Contreras et al. (2013) Contreras, Y., et al. 2013, A&A, 549, A45
- Ezawa et al. (2004) Ezawa, H., Kawabe, R., Kohno, K., & Yamamoto, S. 2004, in Society of Photo-Optical Instrumentation Engineers (SPIE) Conference Series, Vol. 5489, Ground-based Telescopes, ed. J. M. Oschmann, Jr., 763–772
- Faúndez et al. (2004) Faúndez, S., Bronfman, L., Garay, G., Chini, R., Nyman, L.-Å., & May, J. 2004, A&A, 426, 97
- Fazio et al. (2004) Fazio, G. G., et al. 2004, ApJS, 154, 10
- Garay et al. (2004) Garay, G., Faúndez, S., Mardones, D., Bronfman, L., Chini, R., & Nyman, L.-Å. 2004, ApJ, 610, 313
- Garay et al. (2007) Garay, G., Mardones, D., Brooks, K. J., Videla, L., & Contreras, Y. 2007, ApJ, 666, 309
- Garden et al. (1991) Garden, R. P., Hayashi, M., Hasegawa, T., Gatley, I., & Kaifu, N. 1991, ApJ, 374, 540
- Griffin et al. (2010) Griffin, M. J., et al. 2010, A&A, 518, L3
- Hill et al. (2005) Hill, T., Burton, M. G., Minier, V., Thompson, M. A., Walsh, A. J., Hunt-Cunningham, M., & Garay, G. 2005, MNRAS, 363, 405
- Juvela (1996) Juvela, M. 1996, A&AS, 118, 191
- Krumholz & McKee (2008) Krumholz, M. R., & McKee, C. F. 2008, Nature, 451, 1082
- MacLaren et al. (1988) MacLaren, I., Richardson, K. M., & Wolfendale, A. W. 1988, ApJ, 333, 821
- Mardones (1998) Mardones, D. 1998, PhD thesis, Harvard University
- Molinari et al. (2010) Molinari, S., et al. 2010, PASP, 122, 314
- Mueller et al. (2002) Mueller, K. E., Shirley, Y. L., Evans, II, N. J., & Jacobson, H. R. 2002, ApJS, 143, 469
- Ossenkopf & Henning (1994) Ossenkopf, V., & Henning, T. 1994, A&A, 291, 943
- Pineda et al. (2008) Pineda, J. E., Caselli, P., & Goodman, A. A. 2008, ApJ, 679, 481
- Plume et al. (1992) Plume, R., Jaffe, D. T., & Evans, II, N. J. 1992, ApJS, 78, 505
- Plume et al. (1997) Plume, R., Jaffe, D. T., Evans, II, N. J., Martín-Pintado, J., & Gómez-González, J. 1997, ApJ, 476, 730
- Poglitsch et al. (2010) Poglitsch, A., et al. 2010, A&A, 518, L2
- Robitaille et al. (2007) Robitaille, T. P., Whitney, B. A., Indebetouw, R., & Wood, K. 2007, ApJS, 169, 328
- Schuller et al. (2009) Schuller, F., et al. 2009, A&A, 504, 415
- Siringo et al. (2009) Siringo, G., et al. 2009, A&A, 497, 945
- Sridharan et al. (2005) Sridharan, T. K., Beuther, H., Saito, M., Wyrowski, F., & Schilke, P. 2005, ApJ, 634, L57
- Tafalla et al. (2004) Tafalla, M., Myers, P. C., Caselli, P., & Walmsley, C. M. 2004, A&A, 416, 191
- van Zadelhoff et al. (2002) van Zadelhoff, G.-J., et al. 2002, A&A, 395, 373
- Williams et al. (2004) Williams, S. J., Fuller, G. A., & Sridharan, T. K. 2004, A&A, 417, 115