Finding the First Cosmic Explosions. IV. 90 - 140 Pair-Instability Supernovae
Abstract
Population III stars that die as pair-instability supernovae are usually thought to fall in the mass range of 140 - 260 . But several lines of work have now shown that rotation can build up the He cores needed to encounter the pair instability at stellar masses as low as 90 . Depending on the slope of the initial mass function of Population III stars, there could be 4 - 5 times as many stars from 90 - 140 in the primordial universe than in the usually accepted range. We present numerical simulations of the pair-instability explosions of such stars performed with the MESA, FLASH and RAGE codes. We find that they will be visible to supernova factories such as Pan-STARRS and LSST in the optical out to 1 - 2 and to JWST and the 30 m-class telescopes in the NIR out to 7 - 10. Such explosions will thus probe the stellar populations of the first galaxies and cosmic star formation rates in the era of cosmological reionization. These supernovae are also easily distinguished from more massive pair-instability explosions, underscoring the fact that there is far greater variety to the light curves of these events than previously understood.
Subject headings:
early universe – galaxies: high-redshift – galaxies: quasars: general – stars: early-type – supernovae: general – radiative transfer – hydrodynamics – black hole physics – cosmology:theory1. Introduction
Pair-instability supernovae (PI SNe) are the most energetic thermonuclear explosions known, and can be detected near the edge of the observable universe. They have now been studied by several groups for their potential to probe the properties of the first stars and galaxies (Turk et al., 2009; Stacy et al., 2010; Clark et al., 2011; Hosokawa et al., 2011; Smith et al., 2011; Greif et al., 2011, 2012; Stacy et al., 2012; Whalen, 2013; Glover, 2013; Hirano et al., 2014; Susa, 2013; Greif et al., 2008; Johnson et al., 2009; Greif et al., 2010; Jeon et al., 2012; Pawlik et al., 2011; Wise et al., 2012; Pawlik et al., 2013; Johnson et al., 2014). They can also shed light on the origins of supermassive black holes and early cosmological reionization and chemical enrichment (Alvarez et al., 2009; Tanaka & Haiman, 2009; Park & Ricotti, 2011; Whalen & Fryer, 2012; Park & Ricotti, 2012; Johnson et al., 2012; Volonteri, 2012; Agarwal et al., 2012; Johnson et al., 2013b; Park & Ricotti, 2013; Latif et al., 2013a, b; Schleicher et al., 2013; Choi et al., 2013; Reisswig et al., 2013; Johnson et al., 2014; Whalen et al., 2004, 2008a, 2010; Abel et al., 2007; Wise & Abel, 2008; Mackey et al., 2003; Smith & Sigurdsson, 2007; Smith et al., 2009; Chiaki et al., 2013; Ritter et al., 2012; Safranek-Shrader et al., 2014). PI SN candidates such as SN 2007bi (Gal-Yam et al., 2009; Kozyreva et al., 2014) and SN 2213 - 1745 (Cooke et al., 2012) have now been discovered at 0.126 and 2.05, respectively.
These studies have shown that 140 - 260 Population III (Pop III) PI SNe are visible in the near infrared (NIR) at 30 to the James Webb Space Telescope (JWST; Fryer et al., 2010; Kasen et al., 2011; Joggerst & Whalen, 2011; Whalen et al., 2013a, e; Hummel et al., 2012; Pan et al., 2012; Whalen et al., 2014; de Souza et al., 2013, 2014) (see also Heger & Woosley, 2002; Scannapieco et al., 2005; Kitayama & Yoshida, 2005; Whalen et al., 2008c; Chen et al., 2014c, a). They, along with Pop III gamma-ray bursts (GRBs; e.g., Whalen et al., 2008b; Nakauchi et al., 2012; Mesler et al., 2012, 2014), will also be visible at 10 - 20 to the Wide-Field Infrared Survey Telescope (WFIRST) and Wide-field Imaging Surveyor for High Redshift (WISH), and at 10 to Euclid. Less energetic Pop III SNe will be visible to JWST at 10 - 20, depending on explosion type (Tominaga et al., 2011; Moriya et al., 2013; Tanaka et al., 2012; Whalen et al., 2013b, f; Tanaka et al., 2013; Whalen et al., 2013i, 2014; Smidt et al., 2014) (see also Whalen et al., 2013c; Johnson et al., 2013a; Whalen et al., 2013h, g; Chen et al., 2014b, for new work on supermassive Pop III SNe).
This picture changes at higher metallicities. New explosion models of 150 - 500 PI SNe at Large Magellanic Cloud (LMC) and Small Magellanic Cloud (SMC) metallicities (Whalen et al., 2013d) have light curves that are quite different from those of zero-metallicity explosions, for two reasons. First, stars at these metallicities lose most of their mass to strong winds or outbursts that form structures around the star that can either quench or brighten emission from the shock. Mass loss also reduces the star to a compact He core by the time it dies, with 1% of the original radius of the star. yields and radiation diffusion timescales out of the ejecta are very different for explosions of bare He cores than for stars that retain their H envelope. Such explosions can therefore either be dim events that can only be seen in the local universe or superluminous events that are visible out to high redshifts. These new studies underscore the fact that there is far more variety to PI SN light curves than previously imagined.
How does rotation alter the energies and luminosities of Pop III PI SNe? It is now known that rotation can build up He cores massive enough to encounter the pair instability at stellar masses well below 140 . Chatzopoulos & Wheeler (2012) (hereafter CW12) have shown that 90 - 135 Pop III stars can explode as PI SNe if they if they are born with rotation rates at 50% of the breakup velocity. They die as compact He cores because rotational mixing dredges heavier elements up to the outer layers of the star and drives mass loss. Their compact geometries guarantee that their light curves will be different from those of more massive stars that have retained their envelopes. Rotation can also induce bulging in the equators and flattening in the poles of such stars, which could introduce an azimuthal dependence to their light curves (Chatzopoulos et al., 2013).
How rotation affects the luminosities of ancient PI SNe is important because recent studies suggest that some massive Pop III stars may have been born with angular velocities close to the breakup limit (Greif et al., 2011; Stacy et al., 2013). Rotation may also have enabled much higher numbers of PI SNe at high redshift because 90 - 135 Pop III stars could be 4 - 5 times more numerous as those previously studied, depending on their initial mass function (IMF). Given their compact explosion geometries and variety of energies and yields, can these events also probe the properties of the first stars? We have now modeled light curves and spectra for 90 - 135 PI SNe with the Los Alamos RAGE and SPECTRUM codes. In Section 2 we review our stellar evolution and initial explosion models along with our RAGE and SPECTRUM simulations. The blast profiles are examined in Section 3, and NIR light curves and detection limits for these explosions as a function of redshift are presented in Section 4. We conclude in Section 5.
2. Numerical Models
We calculate light curves and spectra for PI SNe in five stages. First, the stars are evolved from the zero-age main sequence (ZAMS) in the MESA code up to the onset of the PI. At this point the models are mapped into the FLASH code and exploded. When nuclear burning is complete, typically within a few tens of seconds, we port the profile for the shock, the surrounding star, and the ambient wind into the RAGE code and evolve the SN out to 3 yr. We then post process our RAGE profiles with the SPECTRUM code to construct light curves and spectra. Finally, these spectra are cosmologically redshifted and dimmed to obtain NIR light curves in the observer frame.
2.1. MESA / FLASH Simulations
The progenitor stars considered here are those from CW12, who studied the effects of rotation on the minimum masses of both pair-pulsational (PP) and PI SNe. These stars were evolved in the one-dimensional (1D) Lagrangian stellar evolution code MESA (Paxton et al., 2011, 2013), which includes a parametrized treatment of rotation and magnetic fields. How rotation induces mixing and angular momentum transport in these stars is discussed in detail in CW12. Although mass loss for highly-evolved massive Pop III stars is not observationally constrained, it must be included because it can affect rotation by allowing the star to shed excess angular momentum over time as it evolves. In lieu of actual observations, we adopt the prescription of de Jager et al. (1988) and Vink et al. (2001) for mass loss from the stars in our models.
We modify this loss rate, which the star would have even if it was stationary, to account for rotation according to the method of Heger et al. (2000):
| (1) |
where is the mass-loss rate from de Jager et al. (1988) and Vink et al. (2001) and is the surface angular velocity at the stellar equator. When 1 diverges, so the mass loss timescale in MESA is limited to the thermal timescale of the star, : , where is an efficiency factor taken to be 0.3 (Yoon et al., 2010). To be consistent with Greif et al. (2011) and Stacy et al. (2013), we consider only stars that rotate at 50% of the breakup velocity at ZAMS. CW12 found that the minimum mass for a zero-metallicity PI SN progenitor at this initial rotation rate is 85 (see also Yoon et al., 2012). Our grid of models therefore ranges from 90 - 140 , in 5 increments. The stars all die as compact cores ( 1010 - 1011 cm) that are H and, sometimes, He deficient.
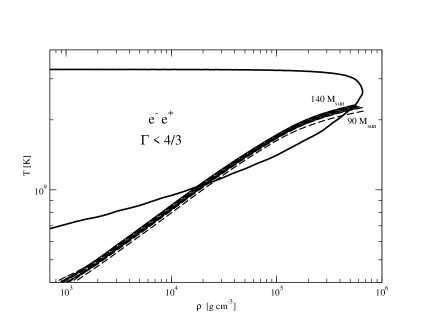
In MESA, we adopt the Schwarzschild criterion for convection with 2, the Timmes & Swesty (2000) “Helmholtz” equation of state (HELM EOS), which includes contributions from e-e+ pairs, and the “approx21” nuclear reaction network (Timmes, 1999), which has the -chain elements and the intermediate elements linking them through reactions from neutrons and protons all the way up to (mass numbers from 1 to 56). The number of radial zones in the models was 800 – 1,200 (the “mesh_delta_coeff” variable in MESA was set to 0.75 – 0.95). The stars are evolved from the ZAMS until the CO core encounters the PI and the adiabatic index, , drops below 4/3 and triggers collapse. Collapse usually proceeds by the time the core reaches 20Ne exhaustion ( 0.01, where is the Ne mass fraction in the central zone of the model) but before the start of 16O burning. At this point we halt MESA. The final properties of the stars are listed in Table 1, and their density and temperature structures prior to explosion are shown in Figure 1. The interiors of the cores all clearly cross into the PI regime at the end of their lives. The energies of the explosions range from 10 - 90 foe, where 1 foe 1051 erg.
The MESA profiles are then conservatively mapped onto a 1D radial mesh in the FLASH 4.0 adaptive mesh refinement (AMR) code (Fryxell et al., 2000; Dubey et al., 2009). Since the stars are mapped from a Lagrangian grid in mass to an Eulerian mesh in space, care was taken to conserve total mass and energy. The resolution we chose in FLASH was higher than that in the MESA models, 105 – 106 cm. FLASH was run with the HELM EOS and the richest nuclear reaction network in the code, “approx19”. The omission of two neutron rich isotopes, 56Fe and 56Cr, and relevant neutronization reactions has little effect in these simulations because PI SN progenitors never evolve past C/O burning as do core-collapse (CC) SN progenitors.
The angular velocities in the MESA models are set to zero in FLASH because Chatzopoulos et al. (2013) found that for a given CO core mass (and all else being equal), only extreme rotation can change PI SN energies and production. Our models exhibit only modest degrees of rotation in the core when they reach the pair-instability regime ( 0.02 – 0.06). We therefore only need to consider the effects of rotation on the structure of the star when evaluating its impact on light curves and spectra. We evolve the shock out just below the surface of the star. Terminating FLASH at this stage ensures that no photons from the shock have broken out of the surface of the star. Radiation transport is not required in this calculation because the mean free paths of the photons in the star are so short that they are simply advected along by fluid flows, but we include their contribution to the EOS.
| (cm) | (erg) | ||||
|---|---|---|---|---|---|
| 90 | 3.9e10 | 59.3 | 0.14 | 9.9e51 | |
| 95 | 5.6e10 | 63.5 | 0.34 | 1.1e52 | |
| 100 | 5.6e10 | 65.6 | 0.44 | 1.2e52 | |
| 105 | 4.7e10 | 69.1 | 0.90 | 2.8e52 | |
| 110 | 5.7e10 | 70.4 | 1.14 | 3.9e52 | |
| 120 | 6.6e10 | 72.6 | 1.57 | 4.3e52 | |
| 125 | 8.0e10 | 76.8 | 3.26 | 5.0e52 | |
| 130 | 1.1e11 | 77.7 | 3.87 | 5.2e52 | |
| 135 | 1.8e11 | 79.8 | 4.52 | 6.2e52 | |
| 140 | 7.7e10 | 83.7 | 7.30 | 8.0e52 |
Note. — All masses are in . † is the mass of the carbon-oxygen core defined within the radius where 0.5.
2.2. RAGE
The explosion is evolved from breakout from the surface of the star out to 3 yr with the Los Alamos code RAGE (Gittings et al., 2008; Frey et al., 2013). RAGE is an AMR radiation hydrodynamics code with grey or multigroup flux-limited diffusion and a second-order conservative Godunov hydro scheme. RAGE uses Los Alamos OPLIB opacities111http://aphysics2/www.t4.lanl.gov/cgi-bin/opacity/tops.pl (Magee et al., 1995) and includes multispecies advection and 2-temperature (2T) radiation transport, in which matter and radiation temperatures, although coupled, are evolved separately. We include the self gravity of the ejecta and point mass gravity for any material that falls back to the center of the grid. We evolve mass fractions for 15 elements: H, He, C, N, O, Ne, Mg, Si, S, Ar, Ca, Ti, Cr, Fe and Ni.
2.2.1 Model Setup
Our 1D spherical coordinate root grid has 100,000 uniform zones with an initial resolution that varies from 4 105 cm to 3 106 cm. We set outflow and reflecting boundary conditions on the fluid and radiation flows at the inner boundary of the mesh (which is at 0 cm), respectively. Outflow conditions are set on the gas and radiation at the outer boundary. Up to 2 levels of refinement are applied to the initial interpolation of the profiles onto the setup grid and then during the simulation. We initialize radiation energy densities in RAGE from the temperatures in the FLASH profiles:
| (2) |
where 7.564 10-15 erg cm-3 K-4 is the radiation constant and is the gas temperature. We also construct the specific internal energy from :
| (3) |
where 1.2472 108 erg gm-1 K-1 is the specific heat of the gas.
Our choice of mesh places the shock about a quarter of the way across the grid at launch. To accommodate the expansion of the ejecta and speed up the simulation, we resize the grid by a factor of 2.5 every 106 time steps or when the leading edge of the radiation front has crossed 90% of the grid, whichever happens first. The time step on which the new series initially evolves scales approximately as the ratio of the new and old resolutions. We join a simple low-mass wind profile to the surface of the star:
| (4) |
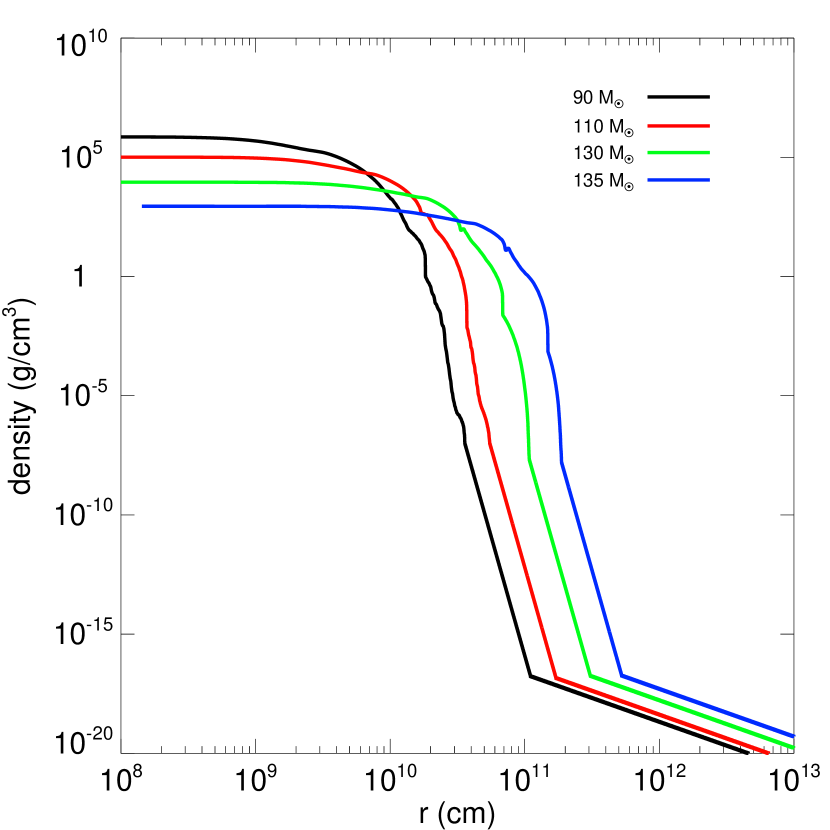
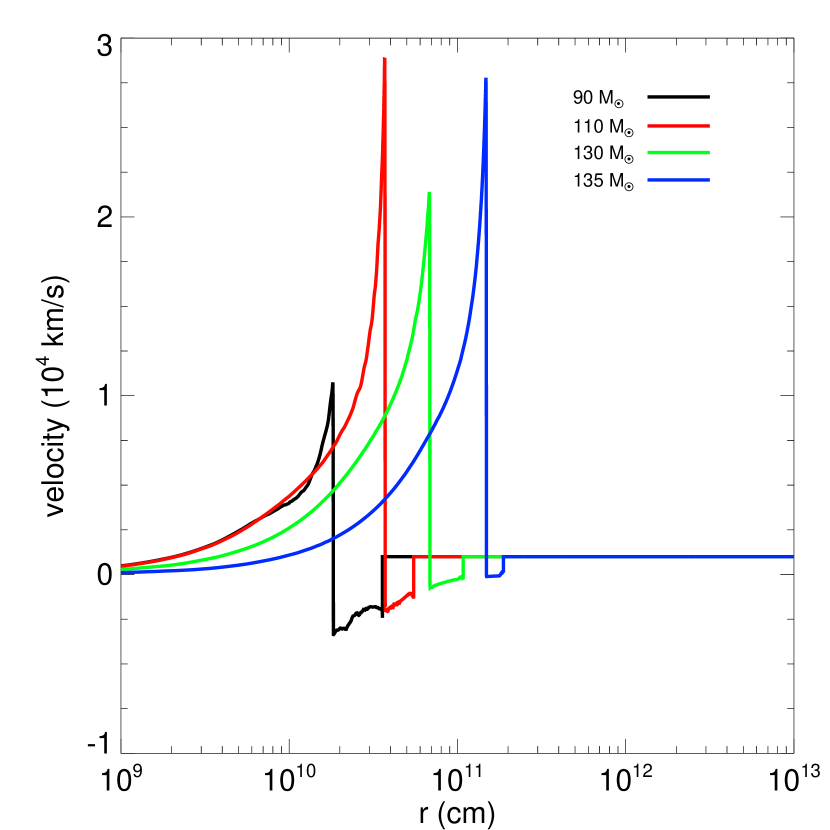
where is the mass loss rate of the wind and is its speed. We take to be 1000 km s-1 and the H and He mass fractions in the wind to be 76% and 24% for simplicity. The abrupt density drop between the star and wind is bridged by an density gradient to avoid numerical instabilities at shock breakout. We chose so that 2 10-18 g cm-3 at the bottom of the density bridge, so that it is optically thin there but still dense enough to prevent numerical instabilities in the radiation solution. The wind profile is continued outward until its density falls to that of the H II region of the star (e.g., Whalen et al., 2004). It is then replaced by the H II region, which is assumed to have a uniform density 0.1 cm-3 and mass fractions of 76% H and 24% He. We show density and velocity profiles for a few of our models in Figure 2.
2.3. SPECTRUM
We calculate a spectrum from a RAGE profile by mapping its densities, temperatures, mass fractions and velocities onto a 2D grid in and cos in the Los Alamos SPECTRUM code. SPECTRUM directly sums the luminosity of each fluid element in the discretized profile to obtain the total flux escaping the ejecta along the line of sight at every wavelength. Our method, which is described in detail in Frey et al. (2013), includes Doppler shifts and time dilation due to the relativistic expansion of the ejecta and the intensities of emission lines. SPECTRUM also accounts for the attenuation of flux along the line of sight, capturing both limb darkening and absorption lines imprinted on the flux by intervening material in the ejecta and wind. Each spectrum has 14899 energies.
Velocities, densities, mass fractions and radiation temperatures are extracted from every level of the AMR hierarchy in RAGE and sequentially ordered by radius. Because of limitations on machine memory and time, only a subset of this data is mapped into SPECTRUM. We first determine the position of the radiation front, which is taken to be where rises above 10-4 erg/cm3. Next, we find the radius of the 40 surface by integrating the optical depth due to Thomson scattering in from the outer edge of the grid, taking to be 0.288 for H and He gas at the mass fractions in the wind (see Section 2.4 of Whalen et al., 2013f). This is the greatest depth from which most of the photons can escape the ejecta.
The extracted fluid variables are then interpolated onto the SPECTRUM grid. The region from the center of the grid to the 40 surface is divided into 800 uniform zones in log and the region from the 40 surface to the radiation front is partitioned into 6200 uniform zones in . Five hundred uniform zones in log are placed between the front and the outer edge of the grid, for a total of 7500 radial bins. The variables in these new radial bins are mass averaged to capture sharp features from the RAGE profile. The mesh is uniformly divided into 160 bins in from -1 to 1. Its inner radial boundary is the same as for the RAGE grid and its outer boundary is 1018 cm. The SPECTRUM grid fully resolves regions of the ejecta from which photons can escape and only lightly samples those from which most cannot.
3. Explosion Profiles
 |
 |
 |
 |
 |
 |
 |
 |
 |
We show density, temperature and velocity profiles for the a120 PI SN at shock breakout, at intermediate times, and at later times in Figure 3. As it breaks out of the surface of the compact core and descends the density bridge, the shock accelerates to 2.2 1010 cm s-1. As it approaches the bottom of the bridge, the shock begins to gradually slow down as it plows up the envelope. Within 1 - 2 seconds of breakout, photons that were previously advected along by the flow abruptly break free of the shock, as shown in the center left panel of Figure 3. The breakout transient is visible as the flat plateau in gas energy ahead of the shock at 7.2 and 9.8 seconds. This radiation front initially heats the gas to 500 eV. As the fireball expands, it cools by emitting radiation and performing work on the surrounding envelope. As it cools, its spectrum softens, and the temperature to which the radiation pulse heats the gas also decreases.
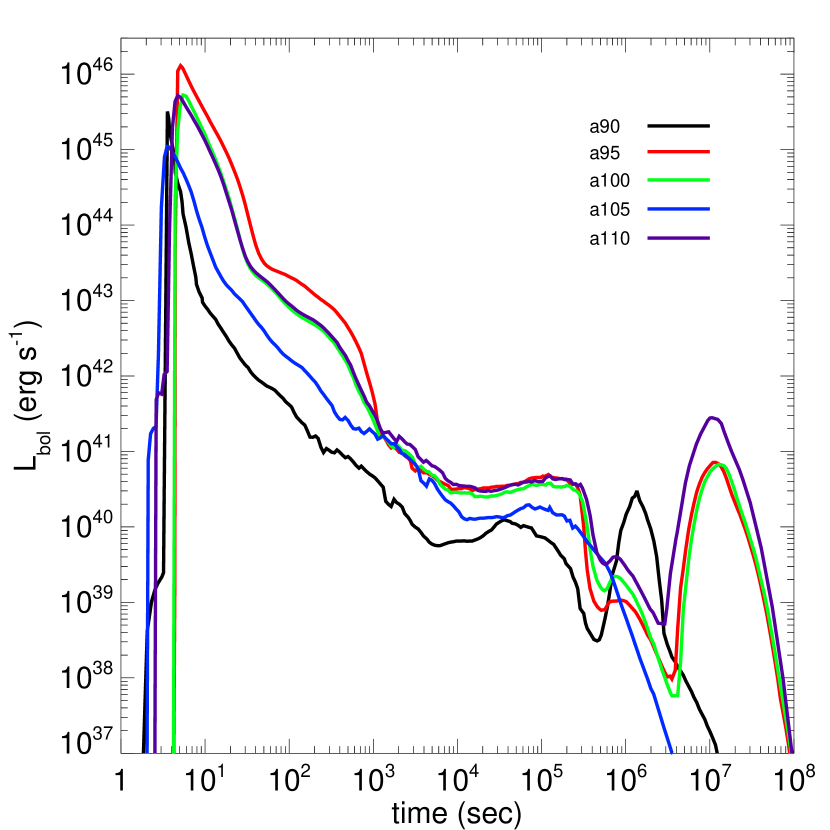
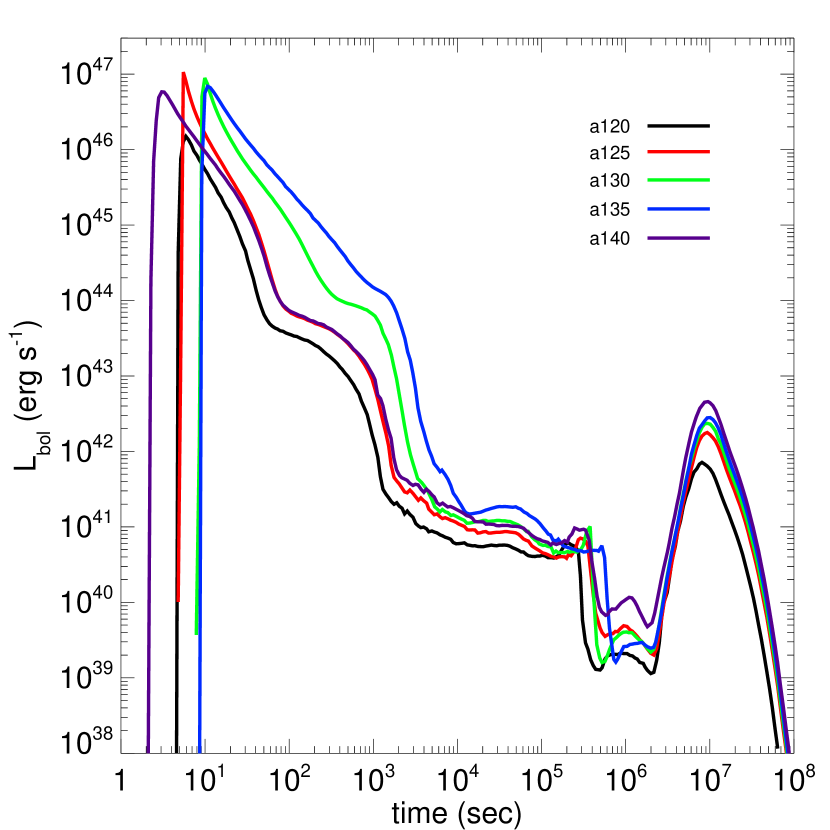
Bolometric luminosities for all 10 PI SNe in are shown in Figure 4. The duration of the breakout transient is greater than the light crossing time of the star, in part because the radiation remains partially coupled to the outer layers of the star that are blown off by the pulse. As photons diffuse out through these outermost layers (the radiative precursor) they break free over a range of times and then become visible to an external observer. The opacity of the ejecta is also frequency dependent, so photons escape at different times according to their wavelengths (Bayless et al., 2014). As shown in Figure 4, breakout luminosities vary from 1046 - 1047 erg s-1, and they generally rise with explosion energy. Shock breakout also generally happens sooner in less massive stars because of their smaller radii. The breakout pulse itself is composed mostly of X-rays and hard UV. At the pulse would last up to 1 - 2 days today, in principle making it much easier to detect at this epoch than in the local universe. But although it is also the most luminous phase of the SN, shock breakout is least visible at high redshifts due to absorption by the neutral intergalactic medium (IGM). Any X-rays that are not absorbed would redshifted into the far UV and absorbed in the outer layers of our Galaxy.
Radiation continues to drive the precursor ahead of the shock for 600 seconds, as shown in the center panels of Figure 3. It is visible as the complex velocity and density structure at 2 1012 cm at 302 s and 5 1012 cm at 533 s. No strong reverse shocks form in the flow. The shock eventually overtakes and merges with the precursor because as it expands and cools it dims, and its flux can no longer sustain it. As shown in the panels on the right in Figure 3, the expansion of the flow is mostly homologous after 105 seconds. All 10 PI SNe evolve through these stages in a similar manner.
At 106 - 107 s, the SNe rebrighten as photons from decay begin to diffuse out of the ejecta. The range in peak times is due to the range in diffusion times from the layer to the surface for the progenitors in our study, with later times corresponding to larger ejecta masses. Peak luminosities rise with mass, and the rebrightening typically lasts several hundred days in the rest frame of the SN. RAGE predicts somewhat lower luminosities than SN codes that assume homologous expansion of the ejecta, as we show in Figure 5. Here, we plot bolometric luminosities for the a140 run calculated with the RAGE, Phoenix (van Rossum, 2012), and STELLA (Blinnikov et al., 2006) codes. The Phoenix model is a 1D Lagrangian calculation with detailed SN radiative transfer in a homologously expanding medium with 125 zones in mass. The STELLA model is a 1D Lagrangian radiation hydrodynamics simulation with 100 energy groups and 125 zones in mass.
As shown in Figure 5, Phoenix predicts peak luminosities that are about an order of magnitude greater than those in RAGE. This discrepancy is most likely due to two factors. First, rebrightening begins at about 70 days after the SN, by which time 75% of the total energy due to and decay has been released ( 1.3 1051 erg for the 7.3 of formed in the a140 explosion). In RAGE, this energy is first deposited as heat locally in the ejecta and then transformed into kinetic energy as the hot bubble performs work on its surroundings. After the heat is transformed into kinetic energy it is difficult to recover it as luminosity later on when the layer is exposed to the IGM, unless the ejecta crashes into some kind of circumstellar structure. This departure from the homologous expansion assumed in Phoenix is subtle because the total energy release due to radioactive decay is only 2% of the kinetic energy of the ejecta, but it results in significantly less luminosity during rebrightening.
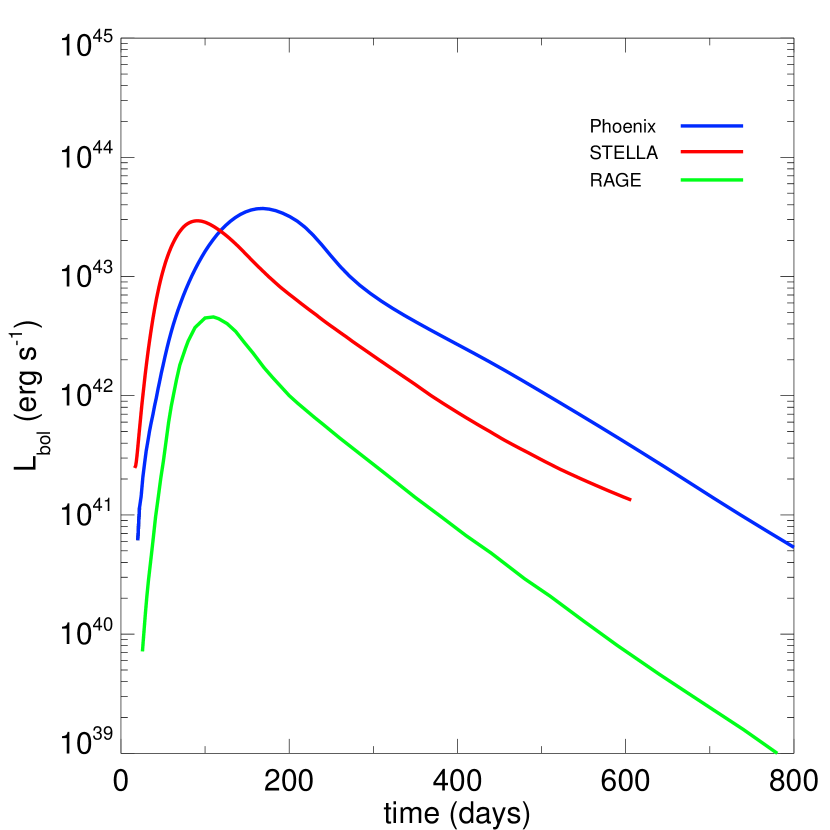
The rebrightening in RAGE is therefore almost entirely due to decay after 70 days, which is 25% of the total decay energy. On these numbers alone, one might expect the peak luminosity to be a factor of up to 4 lower in RAGE than in homologous expansion codes, which account for adiabatic expansion of the SN as a whole but do not capture the additional work done by the decay bubble. The additional factor of 2 - 3 less luminosity may be due to the lower density of the more expanded decay bubble in RAGE when it is exposed to the IGM. We also note that both Lagrangian models may not have fully resolved the flow of radiation through the PI SN ejecta, allowing more of it to escape than really does. When there are ten of thousands of optical depths in a given mesh point, numerical diffusion can allow photons to flow through the zone that should actually be absorbed. This may partially explain the discrepancy between RAGE and STELLA, which is also a radiation hydrodynamical calculation that does not assume homologous expansion. Opacities, minor differences in which can have substantial effects on luminosities, may also contribute to the differences between these two codes. More tests are now underway to study both effects on luminosity in a variety of SNe.
4. NIR Light Curves / Detection Limits
Detections of SNe prior to the era of reionization ( 6) require observations in the NIR because any flux blueward of the Lyman limit at higher redshifts is absorbed by the partially neutral IGM. This likewise restricts detections in the optical to events at 6. All-sky surveys have the most potential to detect large numbers of high- SNe because their large survey areas can compensate for low star formation rates (SFRs) at early epochs (e.g., Figure 3 of Whalen et al., 2013i). But extremely sensitive telescopes with more narrow fields such as JWST, the Thirty-Meter Telescope (TMT), the Giant Magellan Telescope (GMT) and the European Extremely Large Telescope (E-ELT) are still expected to detect appreciable numbers of Pop III SNe (Hummel et al., 2012). We now consider detection limits in redshift for our PI SNe in the NIR for SNe at 6 and in the optical for events below this redshift.
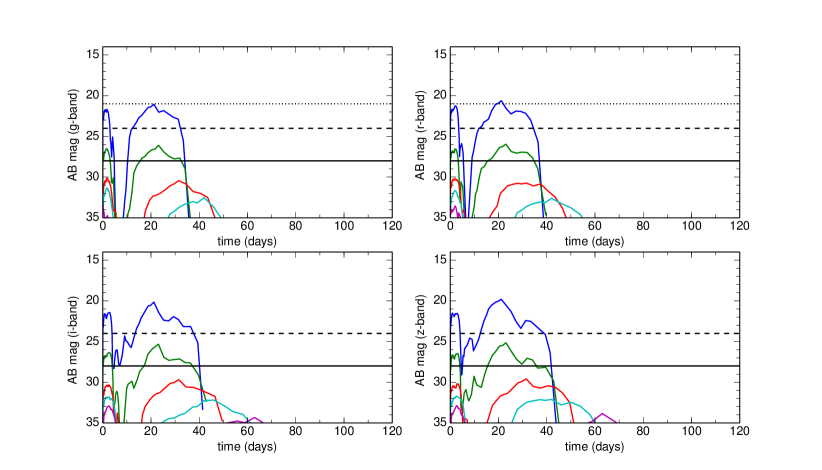
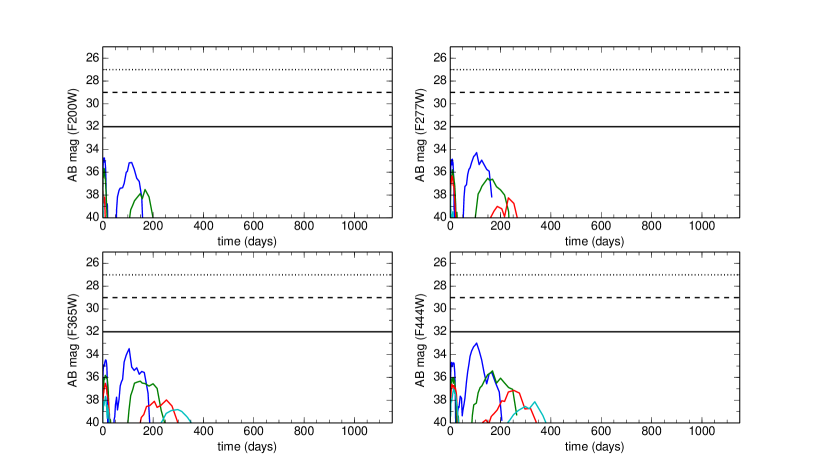
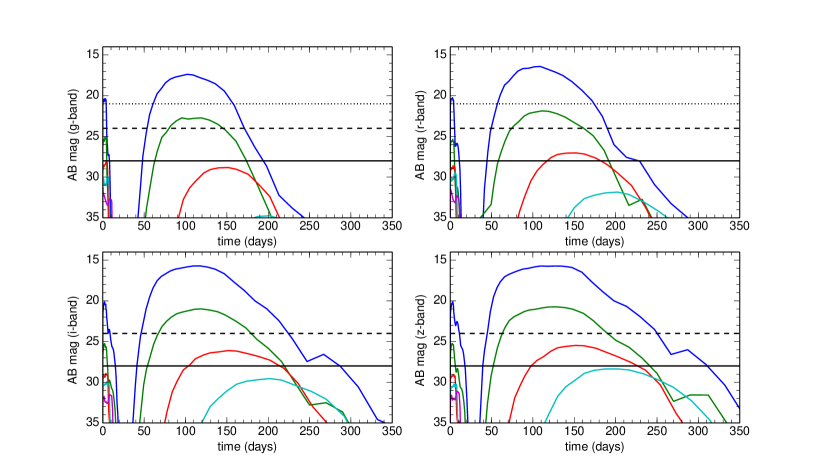
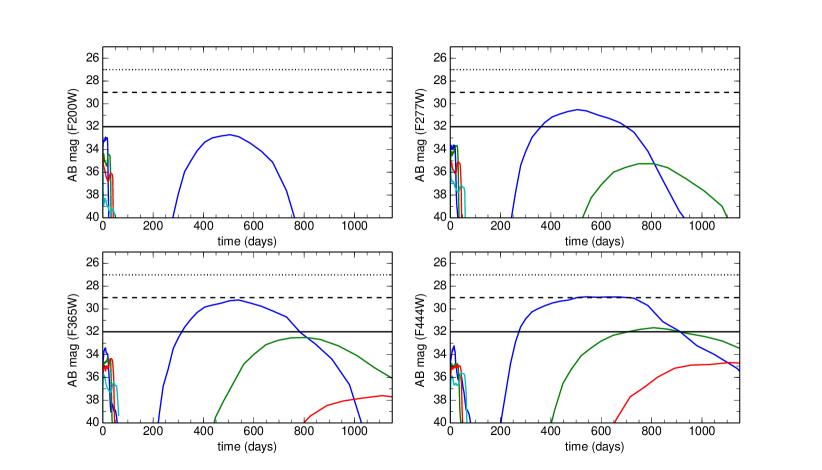
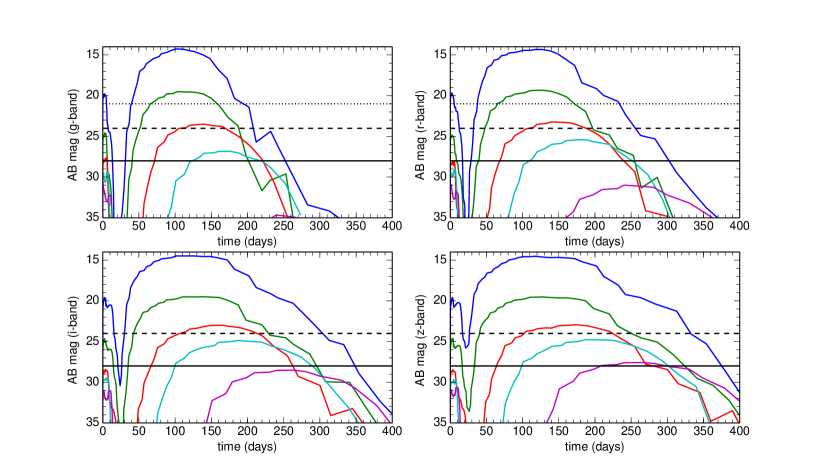
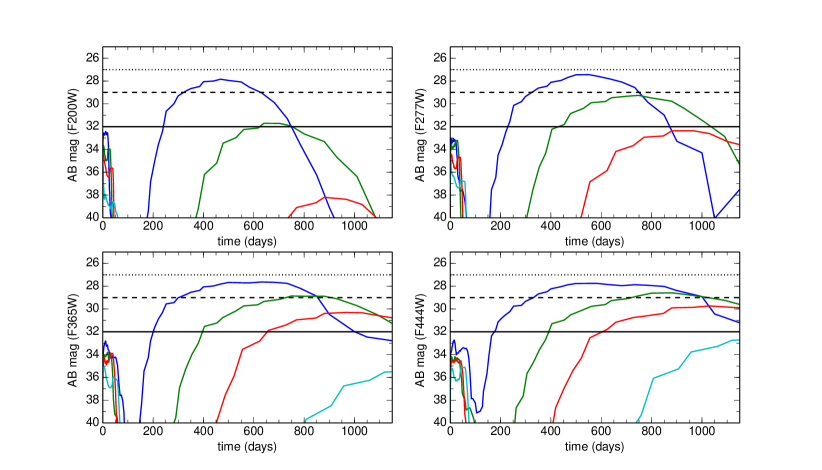
We show optical and NIR light curves for the a90, a120 and a140 PI SNe in Figures 6 - 8 at low and high redshifts along with detection limits for JWST, WFIRST and the SN factories: the Palomar Transient Factory (PTF), the Panoramic Survey Telescope & Rapid Response System (Pan-STARRS) and the Large Synoptic Survey Telescope (LSST). The light curves all have an initial short lived transient that lasts up to 50 days. It is followed by a decline and then a second brighter and much longer lived phase that can last several hundred days or more depending on the filter. This second broad peak is due to rebrightening. Detection limits in the NIR for these events vary widely with mass and explosion energy but range from a140 being visible to JWST out to 7 - 10 for 500 - 600 days to a90 only being visible at 7. Only the most energetic SNe are visible to WFIRST at 4, and only if their spectra can be stacked.
In the optical, detection limits in redshift vary from 0.1 for the a90 PI SN to 1 - 2 for a140. In the g, r, i and z bands the light curves exhibit similar rise and fall times at a given redshift, but their durations increase with wavelength. They are visible in these bands for 50 - 250 days and exhibit enough variation to be recognized as transients, given the short cadences of the factories. It is clear that the SN factories will not detect primordial PI SNe in this mass range, but JWST could find them out to 7 - 10, when Pop III stars could still be forming in pockets of metal-free gas (Trenti et al., 2009; Fumagalli et al., 2011). But determining whether or not such SNe are from Pop III stars would be problematic for several reasons. First, the high shock temperatures in these explosions would obscure the spectral lines that would differentiate these events from Pop II SNe. There are also degeneracies in light curve structure between these SNe and the PI SNe of 0.1 - 0.3 stars studied by Whalen et al. (2013d). By 7 - 10 most stars are expected to be contaminated by metals from the first few generations of SNe in the universe. Nevertheless, because these PI SNe can be easily distinguished from CC SNe they can be used to probe the masses of stars in the era of first galaxy formation and reionization.
 |
 |
 |
 |
 |
 |
5. Conclusion
We find that 90 - 140 Pop III PI SNe whose progenitors have lost their H envelopes are only visible in the optical to PTF, Pan-STARRS and LSST out to 1 - 2 but can be detected out to 7 - 10 by JWST and the coming generation of 30 m telescopes. These SNe fall into a now familiar pattern for highly energetic explosions of compact, massive Pop III stars that have shed their outer envelopes. Although they exhibit very high luminosities and shock temperatures at breakout, 90 - 140 PI SNe, hypernovae (HNe; Smidt et al., 2014), and the PI SNe studied by Whalen et al. (2013d) are all much dimmer in the NIR at high redshift than 140 - 260 Pop III PI SNe with similar explosion energies, which can be detected at 30 (Whalen et al., 2013a). None of the compact core Pop III SNe in these three studies can be seen at , the era of the first stars. Like the PI SNe considered here, HNe are only visible out to 7 - 10 to JWST and 4 - 5 to WFIRST, with detections of 0.1 - 0.3 PI SNe by JWST being restricted to similar redshifts. However, they could all easily appear in future surveys of the first galaxies, which will be principal targets of JWST and the 30 m-class telescopes.
This picture could change if ejecta from the explosion crashes into the mass lost by the star prior to its death, which can result in a superluminous SN (SLSN) like SN 2006gy. These events can be far brighter in the NIR than the original explosion (Smith et al., 2007; Moriya et al., 2010b; Chevalier & Irwin, 2011; Moriya et al., 2013). Their high luminosities are due to the large radius of the shell upon impact, 1 - 2 AU. Much less energetic Type IIn SNe (1 - 2 foe) are visible to JWST at 15 - 20 and to WFIRST at 7 (Whalen et al., 2013b), so it is quite possible that the much more energetic collisions of the SNe in our study with shells may be visible to all-sky NIR missions out to 10 - 15. This would greatly increase their probability of detection at high because the wide survey areas of these missions could overcome low PI SN rates. We are now simulating such explosions with RAGE.
We have only considered PI SNe in very diffuse envelopes, in which all vestiges of the H layer have been driven beyond the immediate reach of the ejecta, as a first case. How this gas is actually distributed in radius around the star when it dies depends on how its mass loss evolved over time, and the impact of such profiles on SN light curves has only begun to be studied. The large number of possibilities for PI SN progenitor structure, metallicity and envelope highlights the difficulty of matching any one PI SN candidate to current models. Studies to date have only considered red supergiants, blue compact giants, and stripped He cores. Stars of intermediate radius, such as yellow supergiants (YSGs), are only now being studied (see Kozyreva et al., 2014, who have found that the PI SN of a 250 YSG yields a bolometric light curve that is a good fit to SN 2007bi).
Although these less massive PI SNe will not be visible among the first generation of stars, they can be used to probe the stellar populations of the first galaxies and cosmic SFRs in the era of cosmological reionization. They, together with a growing number of other types of SNe, will soon open a direct window on star formation in the primeval universe.
References
- Abel et al. (2007) Abel, T., Wise, J. H., & Bryan, G. L. 2007, ApJ, 659, L87
- Agarwal et al. (2012) Agarwal, B., Khochfar, S., Johnson, J. L., Neistein, E., Dalla Vecchia, C., & Livio, M. 2012, MNRAS, 425, 2854
- Alvarez et al. (2009) Alvarez, M. A., Wise, J. H., & Abel, T. 2009, ApJ, 701, L133
- Bayless et al. (2014) Bayless, A. J., Even, W., Frey, L. H., Fryer, C. L., Roming, P. W. A., & Young, P. A. 2014, arXiv:1401.5565
- Blinnikov et al. (2006) Blinnikov, S. I., Röpke, F. K., Sorokina, E. I., Gieseler, M., Reinecke, M., Travaglio, C., Hillebrandt, W., & Stritzinger, M. 2006, A&A, 453, 229
- Chatzopoulos & Wheeler (2012) Chatzopoulos, E. & Wheeler, J. C. 2012, ApJ, 748, 42
- Chatzopoulos et al. (2013) Chatzopoulos, E., Wheeler, J. C., & Couch, S. M. 2013, ApJ, 776, 129
- Chen et al. (2014a) Chen, K.-J., Heger, A., Woosley, S., Almgren, A., & Whalen, D. J. 2014a, ApJ, 792, 44
- Chen et al. (2014b) Chen, K.-J., Heger, A., Woosley, S., Almgren, A., Whalen, D. J., & Johnson, J. L. 2014b, ApJ, 790, 162
- Chen et al. (2014c) Chen, K.-J., Woosley, S., Heger, A., Almgren, A., & Whalen, D. J. 2014c, ApJ, 792, 28
- Chevalier & Irwin (2011) Chevalier, R. A. & Irwin, C. M. 2011, ApJ, 729, L6+
- Chiaki et al. (2013) Chiaki, G., Yoshida, N., & Kitayama, T. 2013, ApJ, 762, 50
- Choi et al. (2013) Choi, J.-H., Shlosman, I., & Begelman, M. C. 2013, ApJ, 774, 149
- Clark et al. (2011) Clark, P. C., Glover, S. C. O., Smith, R. J., Greif, T. H., Klessen, R. S., & Bromm, V. 2011, Science, 331, 1040
- Cooke et al. (2012) Cooke, J., Sullivan, M., Gal-Yam, A., Barton, E. J., Carlberg, R. G., Ryan-Weber, E. V., Horst, C., Omori, Y., & Díaz, C. G. 2012, Nature, 491, 228
- de Jager et al. (1988) de Jager, C., Nieuwenhuijzen, H., & van der Hucht, K. A. 1988, A&AS, 72, 259
- de Souza et al. (2013) de Souza, R. S., Ishida, E. E. O., Johnson, J. L., Whalen, D. J., & Mesinger, A. 2013, MNRAS, 436, 1555
- de Souza et al. (2014) de Souza, R. S., Ishida, E. E. O., Whalen, D. J., Johnson, J. L., & Ferrara, A. 2014, MNRAS, 442, 1640
- Drout et al. (2013) Drout, M. R., Soderberg, A. M., Mazzali, P. A., Parrent, J. T., Margutti, R., Milisavljevic, D., Sanders, N. E., Chornock, R., Foley, R. J., Kirshner, R. P., Filippenko, A. V., Li, W., Brown, P. J., Cenko, S. B., Chakraborti, S., Challis, P., Friedman, A., Ganeshalingam, M., Hicken, M., Jensen, C., Modjaz, M., Perets, H. B., Silverman, J. M., & Wong, D. S. 2013, ApJ, 774, 58
- Dubey et al. (2009) Dubey, A., Reid, L. B., Weide, K., Antypas, K., Ganapathy, M. K., Riley, K., Sheeler, D., & Siegal, A. 2009, ArXiv e-prints
- Frey et al. (2013) Frey, L. H., Even, W., Whalen, D. J., Fryer, C. L., Hungerford, A. L., Fontes, C. J., & Colgan, J. 2013, ApJS, 204, 16
- Fryer et al. (2009) Fryer, C. L., Brown, P. J., Bufano, F., Dahl, J. A., Fontes, C. J., Frey, L. H., Holland, S. T., Hungerford, A. L., Immler, S., Mazzali, P., Milne, P. A., Scannapieco, E., Weinberg, N., & Young, P. A. 2009, ApJ, 707, 193
- Fryer et al. (2007) Fryer, C. L., Hungerford, A. L., & Young, P. A. 2007, ApJ, 662, L55
- Fryer et al. (2010) Fryer, C. L., Whalen, D. J., & Frey, L. 2010, in American Institute of Physics Conference Series, Vol. 1294, American Institute of Physics Conference Series, ed. D. J. Whalen, V. Bromm, & N. Yoshida, 70–75
- Fryxell et al. (2000) Fryxell, B., Olson, K., Ricker, P., Timmes, F. X., Zingale, M., Lamb, D. Q., MacNeice, P., Rosner, R., Truran, J. W., & Tufo, H. 2000, ApJS, 131, 273
- Fumagalli et al. (2011) Fumagalli, M., O’Meara, J. M., & Prochaska, J. X. 2011, Science, 334, 1245
- Gal-Yam et al. (2009) Gal-Yam, A., Mazzali, P., Ofek, E. O., Nugent, P. E., Kulkarni, S. R., Kasliwal, M. M., Quimby, R. M., Filippenko, A. V., Cenko, S. B., Chornock, R., Waldman, R., Kasen, D., Sullivan, M., Beshore, E. C., Drake, A. J., Thomas, R. C., Bloom, J. S., Poznanski, D., Miller, A. A., Foley, R. J., Silverman, J. M., Arcavi, I., Ellis, R. S., & Deng, J. 2009, Nature, 462, 624
- Gittings et al. (2008) Gittings, M., Weaver, R., Clover, M., Betlach, T., Byrne, N., Coker, R., Dendy, E., Hueckstaedt, R., New, K., Oakes, W. R., Ranta, D., & Stefan, R. 2008, Computational Science and Discovery, 1, 015005
- Glover (2013) Glover, S. 2013, in Astrophysics and Space Science Library, Vol. 396, Astrophysics and Space Science Library, ed. T. Wiklind, B. Mobasher, & V. Bromm, 103
- Greif et al. (2012) Greif, T. H., Bromm, V., Clark, P. C., Glover, S. C. O., Smith, R. J., Klessen, R. S., Yoshida, N., & Springel, V. 2012, MNRAS, 424, 399
- Greif et al. (2010) Greif, T. H., Glover, S. C. O., Bromm, V., & Klessen, R. S. 2010, ApJ, 716, 510
- Greif et al. (2008) Greif, T. H., Johnson, J. L., Klessen, R. S., & Bromm, V. 2008, MNRAS, 387, 1021
- Greif et al. (2011) Greif, T. H., Springel, V., White, S. D. M., Glover, S. C. O., Clark, P. C., Smith, R. J., Klessen, R. S., & Bromm, V. 2011, ApJ, 737, 75
- Heger et al. (2000) Heger, A., Langer, N., & Woosley, S. E. 2000, ApJ, 528, 368
- Heger & Woosley (2002) Heger, A. & Woosley, S. E. 2002, ApJ, 567, 532
- Hirano et al. (2014) Hirano, S., Hosokawa, T., Yoshida, N., Umeda, H., Omukai, K., Chiaki, G., & Yorke, H. W. 2014, ApJ, 781, 60
- Hosokawa et al. (2011) Hosokawa, T., Omukai, K., Yoshida, N., & Yorke, H. W. 2011, Science, 334, 1250
- Hummel et al. (2012) Hummel, J. A., Pawlik, A. H., Milosavljević, M., & Bromm, V. 2012, ApJ, 755, 72
- Jeon et al. (2012) Jeon, M., Pawlik, A. H., Greif, T. H., Glover, S. C. O., Bromm, V., Milosavljević, M., & Klessen, R. S. 2012, ApJ, 754, 34
- Joggerst & Whalen (2011) Joggerst, C. C. & Whalen, D. J. 2011, ApJ, 728, 129
- Johnson et al. (2009) Johnson, J. L., Greif, T. H., Bromm, V., Klessen, R. S., & Ippolito, J. 2009, MNRAS, 399, 37
- Johnson et al. (2014) Johnson, J. L., Whalen, D. J., Agarwal, B., Paardekooper, J.-P., & Khochfar, S. 2014, arXiv:1405.2081
- Johnson et al. (2013a) Johnson, J. L., Whalen, D. J., Even, W., Fryer, C. L., Heger, A., Smidt, J., & Chen, K.-J. 2013a, ApJ, 775, 107
- Johnson et al. (2012) Johnson, J. L., Whalen, D. J., Fryer, C. L., & Li, H. 2012, ApJ, 750, 66
- Johnson et al. (2013b) Johnson, J. L., Whalen, D. J., Li, H., & Holz, D. E. 2013b, ApJ, 771, 116
- Kasen et al. (2011) Kasen, D., Woosley, S. E., & Heger, A. 2011, ApJ, 734, 102
- Kitayama & Yoshida (2005) Kitayama, T. & Yoshida, N. 2005, ApJ, 630, 675
- Kleiser & Kasen (2014) Kleiser, I. K. W. & Kasen, D. 2014, MNRAS, 438, 318
- Kozyreva et al. (2014) Kozyreva, A., Blinnikov, S., Langer, N., & Yoon, S.-C. 2014, A&A, 565, A70
- Latif et al. (2013a) Latif, M. A., Schleicher, D. R. G., Schmidt, W., & Niemeyer, J. 2013a, MNRAS, 433, 1607
- Latif et al. (2013b) —. 2013b, MNRAS, 430, 588
- Mackey et al. (2003) Mackey, J., Bromm, V., & Hernquist, L. 2003, ApJ, 586, 1
- Magee et al. (1995) Magee, N. H., Abdallah, Jr., J., Clark, R. E. H., Cohen, J. S., Collins, L. A., Csanak, G., Fontes, C. J., Gauger, A., Keady, J. J., Kilcrease, D. P., & Merts, A. L. 1995, in Astronomical Society of the Pacific Conference Series, Vol. 78, Astrophysical Applications of Powerful New Databases, ed. S. J. Adelman & W. L. Wiese, 51
- Mesler et al. (2012) Mesler, R. A., Whalen, D. J., Lloyd-Ronning, N. M., Fryer, C. L., & Pihlström, Y. M. 2012, ApJ, 757, 117
- Mesler et al. (2014) Mesler, R. A., Whalen, D. J., Smidt, J., Fryer, C. L., Lloyd-Ronning, N. M., & Pihlström, Y. M. 2014, ApJ, 787, 91
- Moriya et al. (2010a) Moriya, T., Tominaga, N., Tanaka, M., Nomoto, K., Sauer, D. N., Mazzali, P. A., Maeda, K., & Suzuki, T. 2010a, ApJ, 719, 1445
- Moriya et al. (2010b) Moriya, T., Yoshida, N., Tominaga, N., Blinnikov, S. I., Maeda, K., Tanaka, M., & Nomoto, K. 2010b, in American Institute of Physics Conference Series, Vol. 1294, American Institute of Physics Conference Series, ed. D. J. Whalen, V. Bromm, & N. Yoshida, 268–269
- Moriya et al. (2013) Moriya, T. J., Blinnikov, S. I., Tominaga, N., Yoshida, N., Tanaka, M., Maeda, K., & Nomoto, K. 2013, MNRAS, 428, 1020
- Nakauchi et al. (2012) Nakauchi, D., Suwa, Y., Sakamoto, T., Kashiyama, K., & Nakamura, T. 2012, ApJ, 759, 128
- Pan et al. (2012) Pan, T., Kasen, D., & Loeb, A. 2012, MNRAS, 422, 2701
- Park & Ricotti (2011) Park, K. & Ricotti, M. 2011, ApJ, 739, 2
- Park & Ricotti (2012) —. 2012, ApJ, 747, 9
- Park & Ricotti (2013) —. 2013, ApJ, 767, 163
- Pawlik et al. (2011) Pawlik, A. H., Milosavljević, M., & Bromm, V. 2011, ApJ, 731, 54
- Pawlik et al. (2013) —. 2013, ApJ, 767, 59
- Paxton et al. (2011) Paxton, B., Bildsten, L., Dotter, A., Herwig, F., Lesaffre, P., & Timmes, F. 2011, ApJS, 192, 3
- Paxton et al. (2013) Paxton, B., Cantiello, M., Arras, P., Bildsten, L., Brown, E. F., Dotter, A., Mankovich, C., Montgomery, M. H., Stello, D., Timmes, F. X., & Townsend, R. 2013, ApJS, 208, 4
- Reisswig et al. (2013) Reisswig, C., Ott, C. D., Abdikamalov, E., Haas, R., Moesta, P., & Schnetter, E. 2013, arXiv:1304.7787
- Ritter et al. (2012) Ritter, J. S., Safranek-Shrader, C., Gnat, O., Milosavljević, M., & Bromm, V. 2012, ApJ, 761, 56
- Safranek-Shrader et al. (2014) Safranek-Shrader, C., Milosavljević, M., & Bromm, V. 2014, MNRAS, 438, 1669
- Scannapieco et al. (2005) Scannapieco, E., Madau, P., Woosley, S., Heger, A., & Ferrara, A. 2005, ApJ, 633, 1031
- Schleicher et al. (2013) Schleicher, D. R. G., Palla, F., Ferrara, A., Galli, D., & Latif, M. 2013, arXiv:1305.5923
- Smidt et al. (2014) Smidt, J., Whalen, D. J., Even, W., Wiggins, B., Johnson, J. L., & Fryer, C. L. 2014, arXiv:1401.5837
- Smith & Sigurdsson (2007) Smith, B. D. & Sigurdsson, S. 2007, ApJ, 661, L5
- Smith et al. (2009) Smith, B. D., Turk, M. J., Sigurdsson, S., O’Shea, B. W., & Norman, M. L. 2009, ApJ, 691, 441
- Smith et al. (2007) Smith, N., Li, W., Foley, R. J., Wheeler, J. C., Pooley, D., Chornock, R., Filippenko, A. V., Silverman, J. M., Quimby, R., Bloom, J. S., & Hansen, C. 2007, ApJ, 666, 1116
- Smith et al. (2011) Smith, R. J., Glover, S. C. O., Clark, P. C., Greif, T., & Klessen, R. S. 2011, MNRAS, 414, 3633
- Stacy et al. (2010) Stacy, A., Greif, T. H., & Bromm, V. 2010, MNRAS, 403, 45
- Stacy et al. (2012) —. 2012, MNRAS, 422, 290
- Stacy et al. (2013) Stacy, A., Greif, T. H., Klessen, R. S., Bromm, V., & Loeb, A. 2013, MNRAS, 431, 1470
- Susa (2013) Susa, H. 2013, ApJ, 773, 185
- Tanaka et al. (2013) Tanaka, M., Moriya, T. J., & Yoshida, N. 2013, MNRAS, 435, 2483
- Tanaka et al. (2012) Tanaka, M., Moriya, T. J., Yoshida, N., & Nomoto, K. 2012, MNRAS, 422, 2675
- Tanaka & Haiman (2009) Tanaka, T. & Haiman, Z. 2009, ApJ, 696, 1798
- Timmes (1999) Timmes, F. X. 1999, ApJS, 124, 241
- Timmes & Swesty (2000) Timmes, F. X. & Swesty, F. D. 2000, ApJS, 126, 501
- Tominaga et al. (2011) Tominaga, N., Morokuma, T., Blinnikov, S. I., Baklanov, P., Sorokina, E. I., & Nomoto, K. 2011, ApJS, 193, 20
- Trenti et al. (2009) Trenti, M., Stiavelli, M., & Michael Shull, J. 2009, ApJ, 700, 1672
- Turk et al. (2009) Turk, M. J., Abel, T., & O’Shea, B. 2009, Science, 325, 601
- van Rossum (2012) van Rossum, D. R. 2012, ApJ, 756, 31
- Vink et al. (2001) Vink, J. S., de Koter, A., & Lamers, H. J. G. L. M. 2001, A&A, 369, 574
- Volonteri (2012) Volonteri, M. 2012, Science, 337, 544
- Whalen et al. (2004) Whalen, D., Abel, T., & Norman, M. L. 2004, ApJ, 610, 14
- Whalen et al. (2010) Whalen, D., Hueckstaedt, R. M., & McConkie, T. O. 2010, ApJ, 712, 101
- Whalen et al. (2008a) Whalen, D., O’Shea, B. W., Smidt, J., & Norman, M. L. 2008a, ApJ, 679, 925
- Whalen et al. (2008b) Whalen, D., Prochaska, J. X., Heger, A., & Tumlinson, J. 2008b, ApJ, 682, 1114
- Whalen et al. (2008c) Whalen, D., van Veelen, B., O’Shea, B. W., & Norman, M. L. 2008c, ApJ, 682, 49
- Whalen (2013) Whalen, D. J. 2013, Acta Polytechnica, 53, 573
- Whalen et al. (2013a) Whalen, D. J., Even, W., Frey, L. H., Smidt, J., Johnson, J. L., Lovekin, C. C., Fryer, C. L., Stiavelli, M., Holz, D. E., Heger, A., Woosley, S. E., & Hungerford, A. L. 2013a, ApJ, 777, 110
- Whalen et al. (2013b) Whalen, D. J., Even, W., Lovekin, C. C., Fryer, C. L., Stiavelli, M., Roming, P. W. A., Cooke, J., Pritchard, T. A., Holz, D. E., & Knight, C. 2013b, ApJ, 768, 195
- Whalen et al. (2013c) Whalen, D. J., Even, W., Smidt, J., Heger, A., Chen, K.-J., Fryer, C. L., Stiavelli, M., Xu, H., & Joggerst, C. C. 2013c, ApJ, 778, 17
- Whalen et al. (2013d) Whalen, D. J., Even, W., Smidt, J., Heger, A., Hirschi, R., Yusof, N., Stiavelli, M., Fryer, C. L., Chen, K.-J., & Joggerst, C. C. 2013d, arXiv:1312.5360
- Whalen & Fryer (2012) Whalen, D. J. & Fryer, C. L. 2012, ApJ, 756, L19
- Whalen et al. (2013e) Whalen, D. J., Fryer, C. L., Holz, D. E., Heger, A., Woosley, S. E., Stiavelli, M., Even, W., & Frey, L. H. 2013e, ApJ, 762, L6
- Whalen et al. (2013f) Whalen, D. J., Joggerst, C. C., Fryer, C. L., Stiavelli, M., Heger, A., & Holz, D. E. 2013f, ApJ, 768, 95
- Whalen et al. (2013g) Whalen, D. J., Johnson, J. L., Smidt, J., Heger, A., Even, W., & Fryer, C. L. 2013g, ApJ, 777, 99
- Whalen et al. (2013h) Whalen, D. J., Johnson, J. L., Smidt, J., Meiksin, A., Heger, A., Even, W., & Fryer, C. L. 2013h, ApJ, 774, 64
- Whalen et al. (2014) Whalen, D. J., Smidt, J., Even, W., Woosley, S. E., Heger, A., Stiavelli, M., & Fryer, C. L. 2014, ApJ, 781, 106
- Whalen et al. (2013i) Whalen, D. J., Smidt, J., Johnson, J. L., Holz, D. E., Stiavelli, M., & Fryer, C. L. 2013i, arXiv:1312.6330
- Wise & Abel (2008) Wise, J. H. & Abel, T. 2008, ApJ, 684, 1
- Wise et al. (2012) Wise, J. H., Turk, M. J., Norman, M. L., & Abel, T. 2012, ApJ, 745, 50
- Yoon et al. (2012) Yoon, S.-C., Dierks, A., & Langer, N. 2012, A&A, 542, A113
- Yoon et al. (2010) Yoon, S.-C., Woosley, S. E., & Langer, N. 2010, ApJ, 725, 940