Time-monitoring Observations of Br Emission from Young Stars
Abstract
We present multiple epochs of near-IR spectroscopy for a sample of 25 young stars, including T Tauri, Herbig Ae/Be, and FU Ori objects. Using the FSPEC instrument on the Bok 90-inch telescope, we obtained -band spectra of the Br transition of hydrogen, with a resolution of . Epochs were taken over a span of 1 year, sampling time-spacings of roughly one day, one month, and one year. The majority of our targets show Br emission, and in some cases these are the first published detections. Time-variability is seen in approximately half of the targets showing Br emission. We compare the observed variability with expectations for rotationally-modulated accretion onto the central stars and time-variable continuum emission or extinction from matter in the inner disk. Our observations are not entirely consistent with models of rotationally-modulated magnetospheric accretion. Further monitoring, over a larger number of epochs, will facilitate more quantitative constraints on variability timescales and amplitudes, and a more conclusive comparison with theoretical models.
Subject headings:
accretion, accretion discs—infrared: stars—circumstellar matter—techniques: spectroscopic—stars: variables: T Tauri, Herbig Ae/BeI. INTRODUCTION
Young stellar objects have long been known as variable from UV to IR wavelengths (e.g., Joy 1942; Herbst et al. 1994; Skrutskie et al. 1996; Carpenter et al. 2001; Eiroa et al. 2002; Forbrich et al. 2007; Flaherty et al. 2012). In addition to continuum variability, changes in spectral features with time have been observed in some sources, with the first time-monitoring spectroscopy conducted soon after the discovery of T Tauri stars (Joy 1945). Subsequent spectroscopic monitoring of T Tauri stars, predominantly at optical wavelengths, has continued to the present day, providing constraints on gas kinematics and variability around young stars.
Variability in the line profile shapes of Balmer transitions, for example the appearance or disappearance of inverse P Cygni profiles, has been linked to changes in winds from, or infall onto, T Tauri stars (e.g., Bertout et al. 1977). The characteristic timescale of this variability is often observed to be hours to days, similar to expectations for magnetically mediated accretion (e.g., Bertout et al. 1988; Guenther & Hessman 1993). In particular, optical spectroscopic variability on timescales comparable to stellar rotation periods has been interpreted as evidence for rotationally-modulated accretion along stellar magnetic field lines (e.g., Giampapa et al. 1993; Johns & Basri 1995; Bouvier et al. 2007). Later studies extended similar monitoring, and results, to the higher-mass analogs of T Tauri stars, the Herbig Ae/Be stars (e.g., Mendigutía et al. 2011; Costigan et al. 2014).
Not all young stars exhibit spectroscopic variability consistent with changes in the magnetospheric accretion process. In a handful of objects, notably those characterized as UX Ori variables (e.g., Grinin et al. 1994), spectroscopic variability has been attributed to time-variable extinction from dusty clouds orbiting in the inner circumstellar disk (e.g., Rodgers et al. 2002; Schisano et al. 2009; Rush et al. 2011). Variability in accretion rate may also lead to changes in inner disk structure that cause time-variable extinction (e.g., Stone et al. 2014).
Observed variability of optical emission lines—notably H and other Balmer series lines—is often interpreted in terms of accretion variability, which is reasonable given the empirical correlation of line luminosities with accretion rates (e.g., Gullbring et al. 1998; Rigliaco et al. 2012). However, optical line profiles for many young stars appear to trace a combination of infalling and outflowing matter (e.g., Reipurth et al. 1996; Kurosawa et al. 2006). This need not destroy the statistical correlation of optical line flux and accretion rate, since the outflow rate generally traces the accretion rate (with a multiplier of about 0.1; e.g., Hartigan et al. 1995). However for any given object, it may be hard to distinguish whether observed variability is due to a variable accretion flow, a variable outflow, or a combination of both.
One way to distinguish infall and outflow variability is to monitor Br emission. Br emission is also empirically correlated with accretion rate (Muzerolle et al. 1998; Mendigutía et al. 2011). While H line profiles often show blue-shifted absorption components, suggestive of outflowing matter, this absorption is typically absent in Br profiles. Br lines also generally show blue-shifted emission centroids. Overall, the line profiles of Br are more consistent with pure infall than H and other optical lines (e.g., Najita et al. 1996; Folha & Emerson 2001; Muzerolle et al. 2001). Br has the additional advantage that it suffers less extinction from foreground material; this can be particularly important for younger, more embedded sources.
A handful of young stars have multiple epochs of Br emission in the literature. For some of these, the epochs were observed with the same instrument and analyzed in a consistent manner (Folha & Emerson 2001; Eisner et al. 2007, 2010a; Sitko et al. 2012; Pogodin et al. 2012; Mendigutía et al. 2013; Stone et al. 2014). Two of these works obtained simultaneous observations of optical and near-IR emission lines, clearly demonstrating the wind-like line profiles of H along with the infall-like line profiles of Br (Pogodin et al. 2012; Mendigutía et al. 2013). These studies show that the variability of the optical and near-IR lines are correlated, but suggest that the variability amplitude may be (marginally) smaller for Br emission than for H emission.
To better constrain the physical mechanism behind near-IR spectroscopic variability, we seek monitoring observations over a range of timescales, for a large, diverse sample of young stars. Here we present multi-epoch observations of Br emission from young stars spanning a wide range of both stellar and circumstellar properties. This paper presents a larger sample, with better temporal coverage, than existing work. We also present the first observations of Br emission from a number of sources, expanding significantly the existing sample of early-type young stars.
II. SAMPLE
We selected a sample of T Tauri and Herbig Ae/Be stars that were visible from Tucson during the summer months111Data for this program were acquired during the summer to allow undergraduate students (co-authors on the paper) to participate in the observations on Kitt Peak.. The sample includes: 5 T Tauri stars, pre-main-sequence analogs of solar-type stars; 17 Herbig Ae/Be stars, which are young, intermediate mass stars surrounded by circumstellar material; 2 FU Orionis stars, thought to be young stars surrounded by particularly active accretion disks; and one heavily-veiled object whose spectral type is uncertain. We provide some basic information about our sample below.
The T Tauri stars in our sample are AS 205 N, V1002 Sco, V2508 Oph, AS 209, and V521 Cyg. The first four are in the Ophiucus or Upper Sco regions, all at an assumed distance of 160 pc (e.g., Chini 1981; Walter et al. 1994). V521 Cyg is located in the “Gulf of Mexico” region (Herbig 1958; Armond et al. 2011), at an estimated distance of pc (Laugalys et al. 2006). These sources have spectral types between K6 and K0 (Eisner et al. 2005; Walter et al. 1994; Torres et al. 2006; Herbig 1958), corresponding to stellar masses of –1.5 M⊙ (e.g., Eisner et al. 2005; Hartigan et al. 1995).
The Herbig Ae/Be stars in our sample include 6 Herbig Ae stars: HD 141569, MWC 863, 51 Oph, MWC 275, VV Ser, and V2020 Cyg; and 11 Herbig Be stars: EU Ser, MWC 297, V1685 Cyg, V1972 Cyg, AS 442, V2019 Cyg, LkH 169, V645 Cyg, V380 Cep, V361 Cep, and MWC 1080. These sources have spectral types between A2 and O7 (e.g., Hillenbrand et al. 1992; Mora et al. 2001; Cohen 1977), corresponding to a stellar mass range of –10 M⊙ (e.g., Palla & Stahler 1993). These targets are located in several different regions, at distances between and 3500 pc (Herbig 1958; Strom et al. 1972; Chavarria-K. 1981; Goodrich 1986; de Lara et al. 1991; Hillenbrand et al. 1992; Perryman et al. 1997; Miroshnichenko & Corporon 1999; Laugalys & Straižys 2002; Straižys et al. 2014).
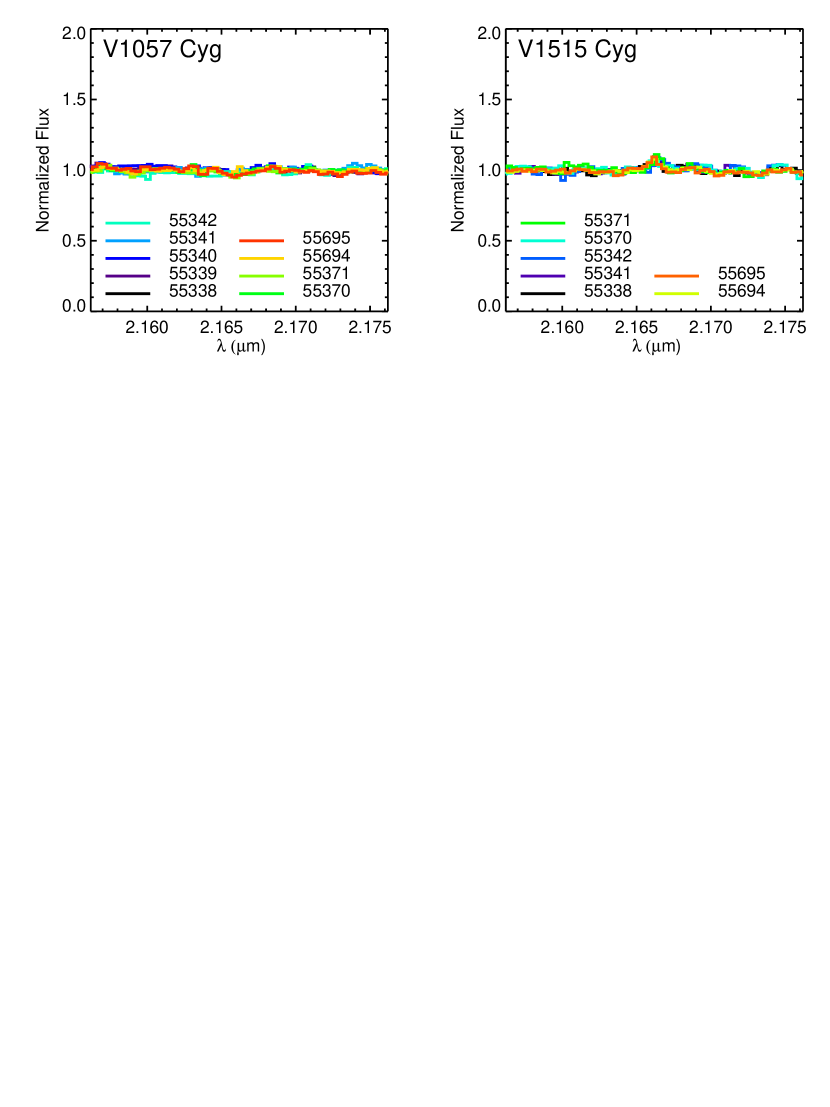
We included two FU Orionis objects in our sample: V1057 Cyg and V1515 Cyg. These are two of the prototypical FU Orionis objects (Herbig 1966), and are thought to represent circumstellar disks in the midst of enhanced accretion events (e.g., Hartmann & Kenyon 1996). V1057 Cyg is in the North American nebula at a distance of 600 pc (Laugalys & Straižys 2002), while V1515 is found in the Cyg R1 region at pc (Racine 1968).
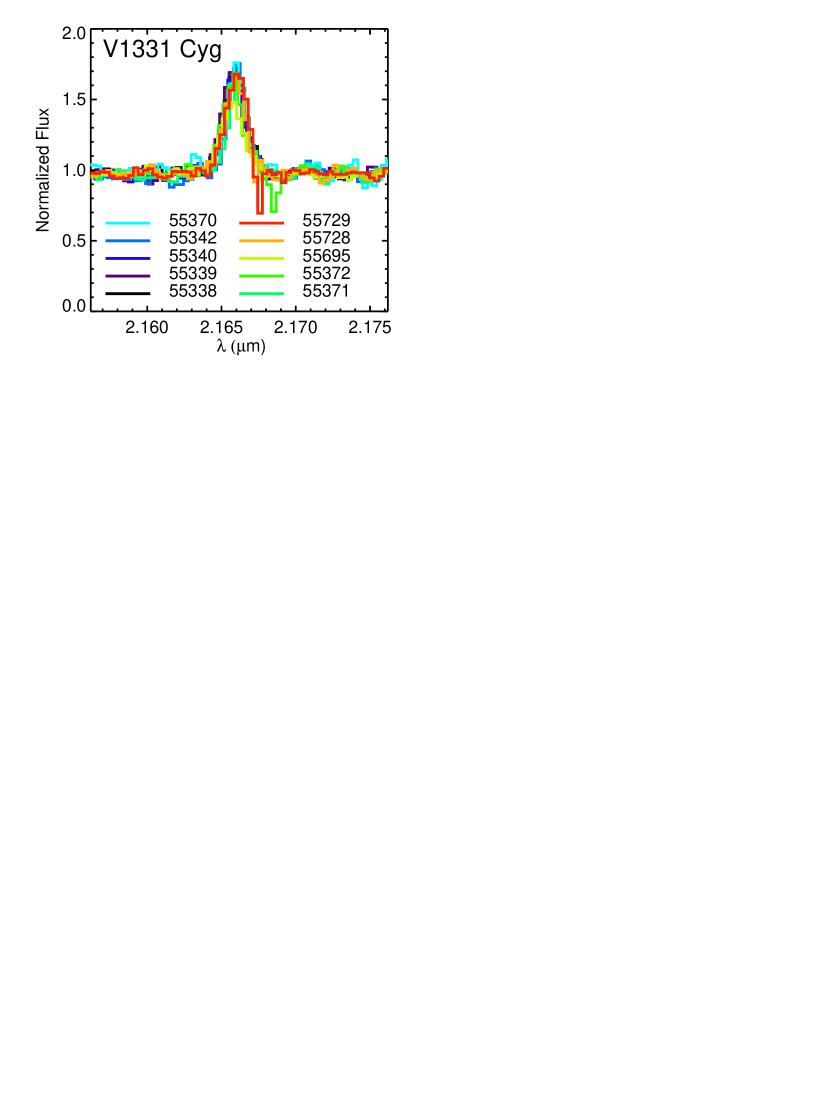
V1331 Cyg is a heavily veiled object lacking clear stellar photospheric absorption features (e.g., Eisner et al. 2007), and hence its spectral type is unknown. However it is known to be an actively accreting object, as traced by strong Br emission. V1331 Cyg is one of the few young stars known to exhibit strong CO overtone emission (e.g., Carr 1989), perhaps indicating a particularly active accretion flow for this source (e.g., Eisner et al. 2014). V1331 Cyg is found in the NGC 7000 region, at a distance of pc (e.g., Herbig 1958; Chavarria-K. 1981).
Most objects in our sample have existing Br spectra in the literature. We compare these existing data with our measurements below in Section IV. We also present the first observations of Br emission in 10 sources: 2 T Tauri stars (AS 209 and V521 Cyg); one Herbig Ae star (V2020 Cyg); and 7 Herbig Be stars (EU Ser, V1972 Cyg, V2019 Cyg, LkH 169, V645 Cyg, V380 Cep, and V361 Cep). These Br spectra of Herbig Be stars result in a sample of early-type young stars approximately twice the size of previous work (e.g., Garcia Lopez et al. 2006).
III. OBSERVATIONS AND DATA REDUCTION
We used the near-IR spectrograph FSPEC at the Bok 90-inch telescope to monitor the Br emission around our sample of young stars (Section II). We employed a grating with 600 grooves per mm, providing a resolving power of (per pixel). FSPEC provides a slit, with pixels. The slit is pixels wide, and the actual spectral resolution is closer to 3500.
In our observations we nodded along the slit, observing each object at 5–6 distinct slit positions. Total integration times (including all slit pointings) for each observation are listed in Table 1. Observations of target objects were interleaved with observations of telluric calibrators. We selected dwarf calibrators with spectral types later than G6V; in fact all calibrators except HD 174719—used to calibrate targets in Serpens—have spectral types later than G8V. Such late-type calibrator stars do not show photospheric Br absorption, so no spurious signals are introduced into the target spectra.
We developed an IDL-based data reduction pipeline to produce calibrated spectra (described in detail in Eisner et al. 2013). The pipeline works on an entire night of data as a block, producing telluric-corrected, wavelength-calibrated spectra for each object observed during the night. Because we work with the entire night of data at once, we can use a weighted sum of all the data to produce higher signal-to-noise in certain calibrations.
The data reduction procedure includes: creation of median flat and dark images; generation of a bad pixel mask; correction of bad pixels in the data; sky subtraction; shifting-and-adding nod sets; spectral extraction; telluric calibration; and wavelength calibration. Our observations were not taken under photometric conditions, so we do not attempt to associate real continuum fluxes with our reduced spectra. Rather, we divide each spectrum by its continuum level so that all spectra for a given object share a common normalization. We thus ignore any potential variability in the continuum flux of our targets. Such variations would not be surprising given the known infrared variability of many young stars (e.g., Skrutskie et al. 1996; Eiroa et al. 2002).
IV. RESULTS
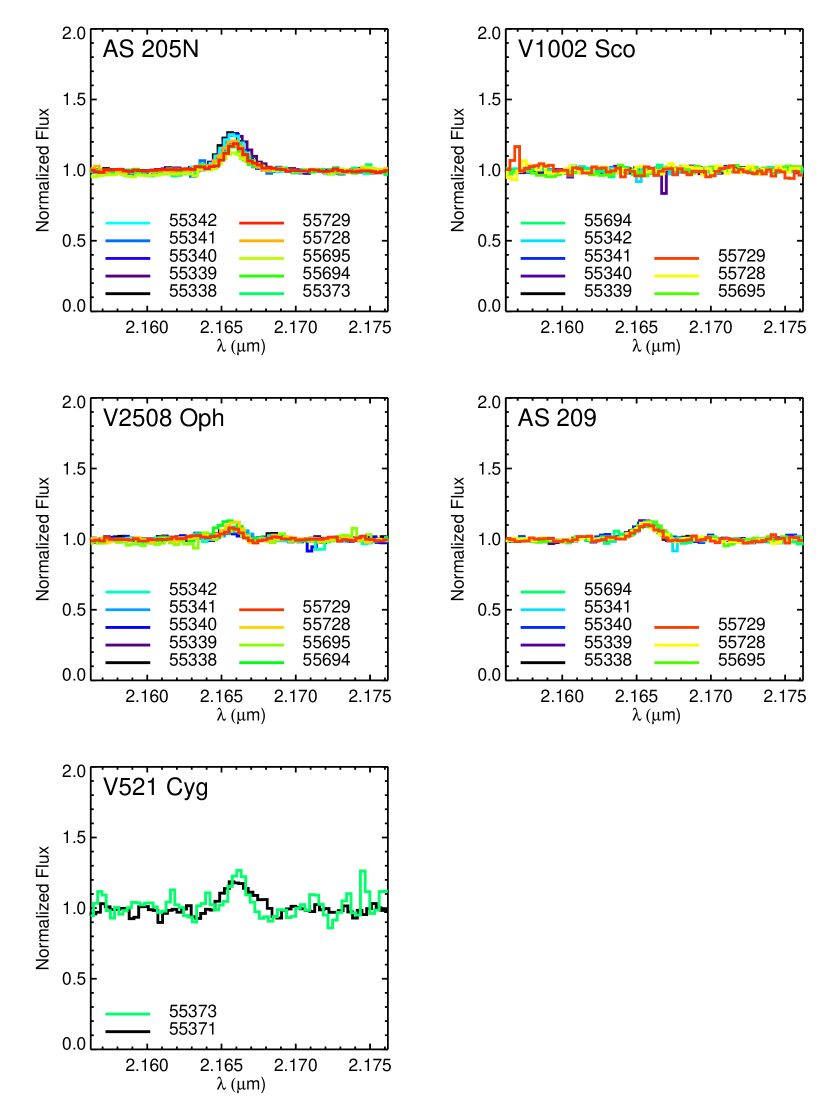
Spectra of our targets are plotted in Figures 1–5. Nearly all targets show Br emission. A few targets show absorption features, while two show no discernible Br features. A number of objects show differences in spectra from epoch-to-epoch.
The random uncertainties in each spectrum can be judged from the channel-to-channel variations in continuum regions. While the uncertainties are different from epoch to epoch, typical error bars are of the continuum level. Even for the faintest objects in our sample (EU Ser and V521 Cyg), the uncertainties are of the continuum level.
Because we do not calibrate the continuum flux level of our observations, we can not calculate Br line fluxes for our targets. Rather we determine equivalent widths (EWs), which provide a measurement of line flux relative to the continuum level. Although some fraction of inner disk continuum emission may trace gas, perhaps free-free emission from H or H- (e.g., Tannirkulam et al. 2008; Eisner et al. 2009), to first approximation, the continuum emission in the near-IR traces dust. Within this approximation, one can view EW as a measure of Br gas to dust emission.
After subtracting the continuum level, EWs are measured by simply integrating the flux across the Br feature, from 2.159 to 2.174 m. We do not attempt to correct the spectra for any photospheric absorption, and so measured EWs may include both stellar absorption and circumstellar emission (or absorption). To estimate errors in measured EWs, we simulate 1000 noise realizations for each spectrum. Each simulated spectrum consists of the observed spectrum plus Gaussian noise, where the of the noise is determined from line-free regions of the observed spectrum. In addition, we include the effects of bad pixels at random locations, multiplying two pixel values in each synthetic spectrum by 5. The uncertainty in the EW measurement is estimated as the 1 confidence level of the EWs determined for the 1000 synthetic spectra. EWs and uncertainties for each target and observed epoch are listed in Table 1.
Two objects in the sample show no evidence of Br emission (or absorption) in any observed epoch: V1002 Sco and V361 Cep. Another source, V1057 Cyg, shows only hints of Br features in its spectra, with most epochs consistent with an EW=0. Br emission or absorption features are detected in the remaining 22 targets in our sample. For 8 objects, these are the first reported detections of Br emission: AS 209, EU Ser, V1972 Cyg, V2019 Cyg, V2020 Cyg, V521 Cyg, V645 Cyg, V380 Cep. Br absorption is reported for the first time in LkH 169, although the origin of this spectral feature is presumably the stellar photosphere rather than circumstellar gas.
About half of the objects with detected Br emission show variability, as traced by measured EWs, across the observed epochs (Table 1). The sub-sample exhibiting significant Br variability includes AS 205 N, V2508 Oph, MWC 863, MWC 297, VV Ser, V1695 Cyg, V1972 Cyg, AS 442, V2019 Cyg, and V1331 Cyg. Several objects also show some variability in observed Br line profiles from epoch to epoch. A notable example is V1331 Cyg, where inverse P Cygni absorption features appear in some epochs (Figure 5).
In the following subsections, we describe the line profiles and measured EWs for each target in the sample individually. We also compare with previous Br measurements in the literature, for sources where such data exist.
IV.1. T Tauri Sources
IV.1.1 AS 205 N
Our measurements of the EW varied between and Å over the year baseline of the observations. However, more modest variations are detected on day-to-day and month-to-month timescales as well (Table 1). Previous observations determined EWs of -4.7 Å in 1994 (Najita et al. 1996), and -3.7 Å around 2009 (Eisner et al. 2014), consistent with the range of EW seen in the FSPEC data.
IV.1.2 V1002 Sco
We see no Br absorption or emission features in any observed epochs. This contrasts with a previous measurement from 2005, which showed a broad, asymmetric Br feature with EW = Å (Eisner et al. 2007).
IV.1.3 V2508 Oph
The Br emission from V2508 Oph exhibits variability in EW beyond the uncertainties over the year observed time-baseline. The largest emission feature observed has an EW of Å, while the weakest emission gives an EW of Å (Table 1). This very weak emission feature occurs one day after, and one month before, stronger features with EWs of Å. We also see some change in the line profile shapes on the same timescales, with additional blue emission, or red absorption, in some epochs (Figure 1). Thus, variability appears to be occurring on short timescales. However, a previous measurement of Br emission with an EW of -6.5 Å in 2005 (Eisner et al. 2014) suggests that the emission may also vary on longer timescales.
IV.1.4 AS 209
IV.1.5 V521 Cyg
V521 Cyg is one of the fainter objects in our sample (), and thus the signal-to-noise of the FSPEC data are lower for this object. However, we clearly detect Br emission in two separate observations (Figure 1). These are the first detections of Br emission in this source.
IV.2. Herbig Ae Sources
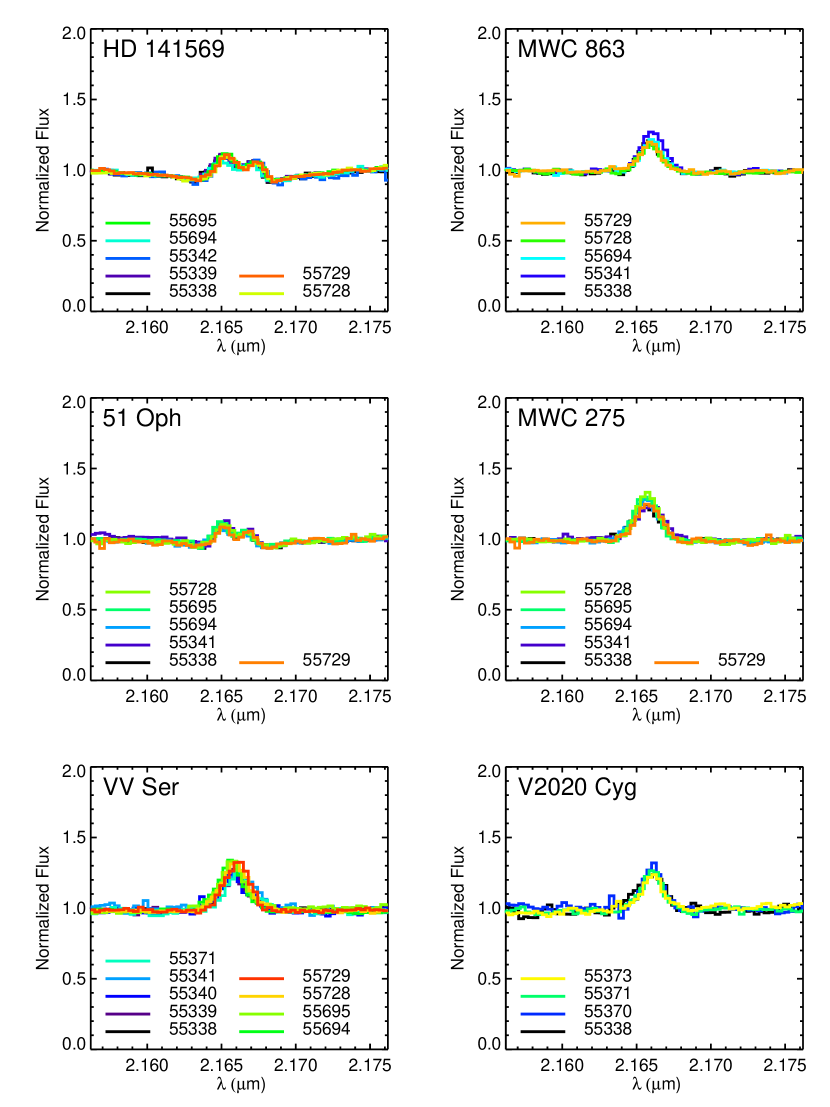
IV.2.1 HD 141569
The Br emission from HD 141569 appears to be constant, within uncertainties, across our observed epochs (Figure 2). The Br profiles include a broad stellar photospheric absorption component and a double-peaked circumstellar emission component, consistent with previous observations (Garcia Lopez et al. 2006; Brittain et al. 2007). The EWs listed in Table 1 include the stellar and circumstellar components, and are compatible with the earlier measurements. For example, Garcia Lopez et al. (2006) measured an EW of 6 Å, but if the stellar absorption is removed, the circumstellar Br EW is estimated as -4.5 Å. Since we do not expect the stellar photospheric absorption to vary, the lack of observed variability in the Br spectra implies a lack of variability in the cirumstellar component as well.
IV.2.2 MWC 863
Measured EWs for MWC 863 range from to Å over a year timescale (Table 1). However, the characteristic timescale for variability may be shorter, as suggested by the marginally significant night-to-night variations. The line profile also appears to show additional red emission during the epoch with the highest measured EW (Figure 2). Previous measurements of the EW for MWC 863 are between -5.5 and -6.2 Å (Garcia Lopez et al. 2006; Eisner et al. 2014), consistent with the range seen here.
IV.2.3 51 Oph
The line profiles of Br emission observed for 51 Oph show no significant changes across the year time-baseline (Figure 2), and measured EWs do not vary significantly (Table 1). As for HD 141569, the EWs include both a broad stellar absorption component and a double-peaked circumstellar emission component. An existing spectrum of 51 Oph in the literature yields an EW of 1.3 Å (Garcia Lopez et al. 2006), consistent with the measurements presented here.
IV.2.4 MWC 275
MWC 275 shows no significant variations in Br EW or line profiles across the observed epochs (Table 1; Figure 2). Previous determinations of the EW, -6.9 Å (Garcia Lopez et al. 2006), -7.1 Å (Donehew & Brittain 2011), and -6.3 Å (Eisner et al. 2014) are compatible with our measurements. However, Mendigutía et al. (2013) measured EWs between -4.8 Å in October of 2011 and -3.5 Å in February of 2012; these values are outside the range seen in the present work. While the EW estimates and quoted error bars of Mendigutía et al. (2013) imply variability, the amplitude would fall within our measurement uncertainties. Kraus et al. (2008) also cited evidence for modest line profile changes, consistent with low-level variability in this object.
IV.2.5 VV Ser
During the epochs we observed VV Ser, between 22 May 2010 and 16 June 2011, the Br EW ranged from to Å, with variations apparent on night-to-night timescales (Table 1). Line profiles show slight variations on similar timescales (Figure 2). While we also observe shifts in the line centroids, these shifts are km s-1, and may simply reflect a combination of Earth motion and uncertainties in the wavelength calibration. Previous measurements of Br emission determined EWs of -9.0 Å in 2004 (Garcia Lopez et al. 2006), -3.7 Å in 2008 (Donehew & Brittain 2011), and -5.1 Å in 2011 (Eisner et al. 2014), generally consistent with the range we observe here.
IV.2.6 V2020 Cyg
We detect Br emission from V2020 Cyg over four epochs, with three epochs separated by about a day, and the fourth a month before (Figure 2). To the best of our knowledge this is the first detection of Br emission in this object. No significant variability is observed (Table 1).
IV.3. Herbig Be Sources
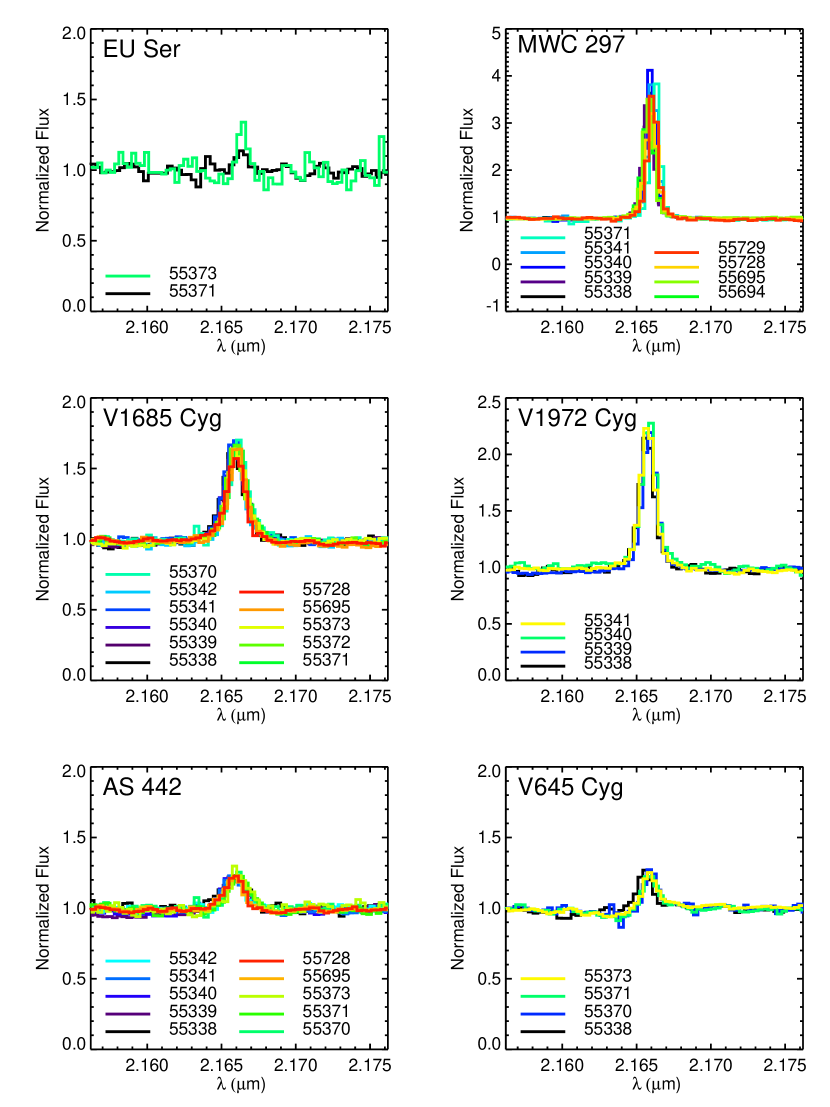
IV.3.1 EU Ser
EU Ser is the faintest object in our sample, with . As illustrated in Figure 3, our measured spectra are quite noisy. However, there is clear evidence for the presence of Br emission; this is the first observation of Br emission from this source. We obtained two epochs of FSPEC data separated by 2 nights, which suggest different line profiles. With the low signal-to-noise of the data, however, this hint of variability is not significant (Table 1).
IV.3.2 MWC 297
MWC 297 is the brightest object in our sample, with , and also the target with the largest observed Br EW (Table 1). The emission does appear somewhat variable, with EWs ranging between Å and Å during the year span of our observations. This large variation is seen on monthly and yearly timescales, while night-to-night variations are less significant. The line profiles may also differ from epoch to epoch, although it is difficult to constrain this well, since the line is fairly narrow for this source (Figure 3). Our measurements for MWC 297 differ significantly from previous measurements in the literature: -16.0 Å in 2004 (Garcia Lopez et al. 2006), and -17.2 Å in 2008 (Weigelt et al. 2011). Thus, we see evidence for variations on timescales of months and years in this target.
IV.3.3 V1685 Cyg
V1685 Cyg shows strong Br emission with a line profile whose shape does not vary significantly over 11 epochs observed over the course of year (Figure 3). However, the strength of the emission, as traced by the measured EW, does change. Variations in EW between and Å are seen over a range of timescales (Table 1). A previous measurement of Br emission in V1685 Cyg determined an EW of -12.1 Å (Eisner et al. 2014), within the range of values determined here.
IV.3.4 V1972 Cyg
IV.3.5 AS 442
AS 442 shows variability in Br emission, with measured EWs between and Å (Table 1). The variability occurs on night-to-night timescales. Line profiles also vary slightly from epoch to epoch (Figure 3). A previous measurement of Br emission in AS 442 determined an EW of -4.5 Å (Eisner et al. 2014), within the range of values determined here.
IV.3.6 V645 Cyg
We detect Br emission from V645 Cyg over four epochs, with three epochs separated by about a day, and the fourth a month before (Figure 3). To the best of our knowledge this is the first detection of Br emission in this object. No significant variability is observed in the EW (Table 1). However, the spectra for some epochs suggest absorption on the blue side of the line (Figure 3), as in P Cygni wind profiles. Such a profile is not seen in one spectrum, which was taken about a year apart from all other epochs. While this observation hints at the possibility of a time-variable wind, with the noise in the data we cannot make a confident statement about variability.
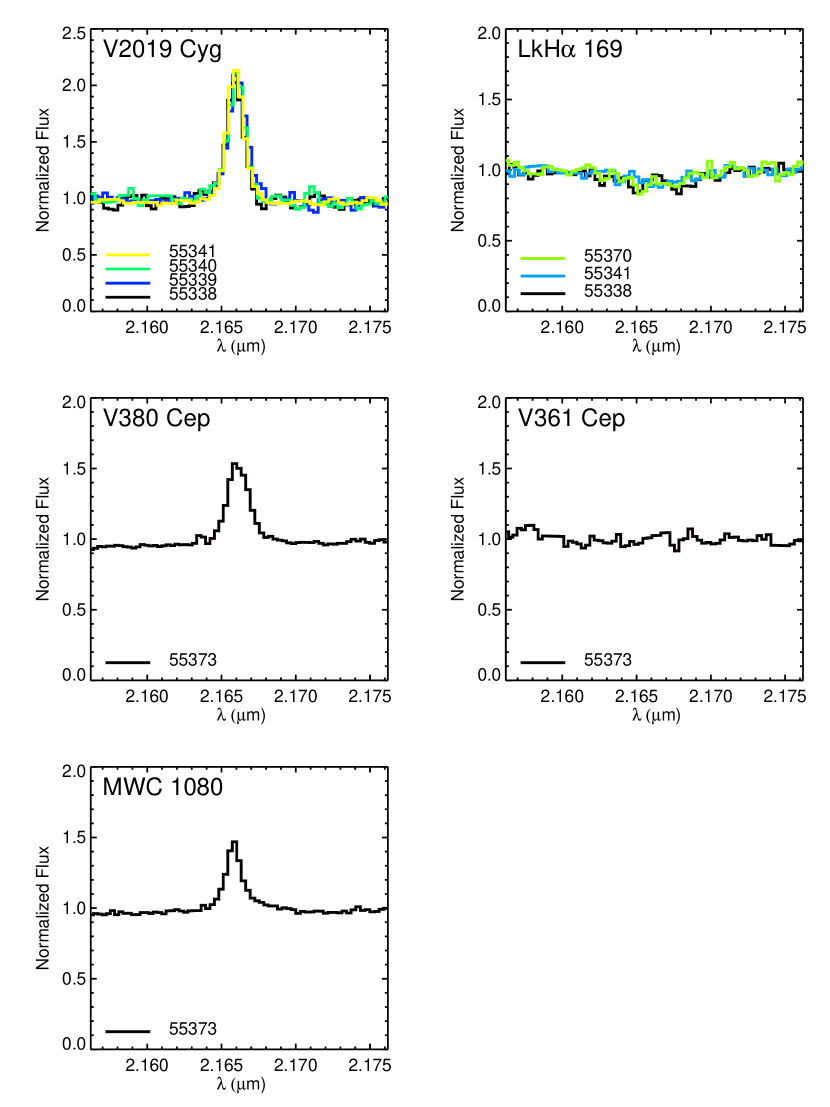
IV.3.7 V2019 Cyg
IV.3.8 LkH 169
We observed LkH 169 three times, with epochs separated by two days, and about a month. No Br emission is detected, although we do see broad Br absorption in all epochs (Figure 3). The spectral type of LkH 169 is B8, and we expect broad, photospheric Br absorption. These spectra are fairly noisy (this object is relatively faint, with ), and the measured EWs are consistent with no variability.
IV.3.9 V380 Cep
We present only a single epoch of Br emission for V380 Cep (Figure 3; Table 1). This is the first published Br emission for this source.
IV.3.10 V361 Cep
IV.3.11 MWC 1080
IV.4. FU Ori Objects
IV.4.1 V1057 Cyg
The spectra for V1057 Cyg, observed over 9 epochs spanning about a year, show no significant variability (Table 1). Indeed, measured EWs are consistent with 0 for most epochs, indicating that no Br emission or absorption was detected. However, Figure 4 shows hints of an absorption feature at the expected wavelength of the Br transition with some excess red emission, perhaps consistent with previous observations (Eisner & Hillenbrand 2011).
IV.4.2 V1515 Cyg
IV.5. The heavily-veiled source, V1331 Cyg
As one of the fainter objects in our sample, the spectra for V1331 Cyg have somewhat lower signal-to-noise. However, the Br emission from this target is strong and easily detectable above the noise level (Figure 5). The EWs vary from to Å across the year of observations (Table 1). Previous measurements of Br emission estimated EWs of -15.3 Å in 1994 (Najita et al. 1996), and -14.4 Å in 2009 (Eisner et al. 2014). While these previous measurements, and most of our spectra, show single-peaked emission line profiles, red absorption features appear strongly in one epoch and tentatively in another epoch (Figure 5). Such line profiles resemble inverse P Cygni profiles, and may indicate that we are seeing red absorption from infalling matter along the line of sight.
V. DISCUSSION
V.1. Br Emission and Variability Across the Sample
Our sample spans a broad range of spectral type, from solar-type T Tauri stars to M⊙ stars. The sample also includes heavily-veiled objects, which are presumably surrounded by massive, active accretion disks. The extreme end of the sample comprises FU Ori sources, where the central stars are completely invisible underneath the hot, active accretion disks. Here we examine measured Br EWs and line profiles, and their variability, across this diverse sample.
We detect Br emission around 4/5 of the T Tauri stars in our sample: only V1002 Sco shows no emission. The Br emission from these sources has a typical EW with absolute value smaller than about Å (consistent with previous Br spectroscopy; e.g., Muzerolle et al. 1998). Variability, when detected, is modest, at the level of Å.
Among the Herbig Ae sources in our sample, 6/6 objects have detected Br emission. Typical EWs and variability amplitudes are similar to those seen in the T Tauri sub-sample. We do, however, note the broad, double-peaked line profiles seen in the Herbig Ae sources HD 141569 and 51 Oph, perhaps suggesting a different morphology of the emission in these objects.
Br emission is detected toward all Herbig Be sources except two: photospheric absorption is seen in LkH 169 and no emission or absorption is detected toward V361 Cep. In contrast to the T Tauri and Herbig Ae stars, Br emission from the Herbig Be sample tends to be stronger and more variable. For example, a number of objects have Br EWs of -10 to -20 Å, and variability up to 5 Å is observed in some targets. The strongest Br emission is observed from the early-type objects in our sample, consistent with previous results (e.g., Garcia Lopez et al. 2006).
The most massive star in the sample, Herbig Be source V645 Cyg, exhibits a line profile suggestive of outflow (Figure 3). In particular, the blue absorption feature seen in most epochs indicates outflowing matter in the observed line-of-sight that is absorbing background emission. MWC 297, the second-most-massive star in the sample, does not show such a line profile. However viewing geometry may lead to outflows outside the line-of-sight, and hence a lack of absorption features. Indeed, spatially resolved spectroscopy of MWC 297 has suggested that Br gas arises in a magnetocentrifugally-launched wind on scales of AU (Malbet et al. 2007; Weigelt et al. 2011). Thus, the Br emission we observe from the most massive Herbig Be stars in our sample may trace outflows more commonly than the emission seen in less massive objects.
V1331 Cyg is an unusual object compared to others in the sample. It is heavily veiled, and hence its spectral type is unknown. It also exhibits strong CO overtone emission. These properties suggest a massive and/or hot accretion disk around the central star. As in previous work, we find strong Br emission from V1331 Cyg, consistent with the hypothesis of an active accretion disk around the source. We also see red absorption features in some observed epochs, suggesting infalling matter along the line-of-sight. The observed line-profile and EW variability indicates that this infall may be sporadic.
Finally, we included two FU Ori stars in our sample: V1057 Cyg and V1515 Cyg. These objects are characterized by spectra that resemble stellar photospheres at several thousand degrees (e.g., Hartmann & Kenyon 1996). At such temperatures, one does not expect significant Br absorption or emission. That is essentially what we see in the FSPEC data. However, both objects show hints of features, with possible weak absorption with redward emission in V1057 Cyg, and a weak emission feature in V1515 Cyg (Figure 4).
V.2. Br Emission and Variability as a Tracer of Magnetospheric Accretion
As discussed in Section I, Br is empirically correlated with mass accretion rate onto young stars (Muzerolle et al. 1998; Mendigutía et al. 2011). While this is also true for optical emission lines like H (e.g., Gullbring et al. 1998), comparison of optical and near-IR line profiles suggests that the former are more likely to trace wind emission, and the latter more likely to trace infalling matter (e.g., Najita et al. 1996; Folha & Emerson 2001; Muzerolle et al. 2001).
Imaging observations have suggested that Br may still trace outflowing gas near the magnetospheric scale (e.g., Eisner et al. 2010b, 2014), or in some cases on considerably larger scales (e.g., Malbet et al. 2007; Beck et al. 2010). However, in nearly all objects where Br emission has been spatially resolved, some of the emission traces very compact scales consistent with accretion flows (e.g., Eisner et al. 2014). Furthermore, spatially extended emission is generally found to constitute only a small fraction of the total Br line flux (e.g., Beck et al. 2010). Thus, despite evidence that some Br emission originates in outflows, it appears that Br is still a better tracer of accretion flows than optical lines like H.
Variability in Br emission can occur for a variety of reasons. Since hydrogen line emission traces infalling material, when accretion rates are higher more hydrogen gas is excited and produces more Br emission. Alternatively, a steady global disk accretion rate may interact with a rotating, magnetic star and produce time-variable hotspots or accretion streams (e.g., Romanova et al. 2004, 2008). Indeed, models of disk/magnetosphere interactions show that Br line profiles and EWs can vary on stellar rotation timescales (e.g., Kurosawa et al. 2008). However variations on shorter timescales are also possible for unstable accretion, where multiple, thin, variable accretion flows impact the star (Kurosawa & Romanova 2013).
Magnetically-mediated accretion models thus predict that Br emission should vary on timescales comparable to or shorter than stellar rotation periods. Measured rotation periods for young stars are typically –10 days (e.g., Herbst et al. 2007). While we argued in Section IV that many objects show variations on night-to-night timescales, a rigorous comparison with models requires quantification of the observed variability periods.
Quantitative constraints are difficult with the limited time-sampling of our data. We therefore restrict our quantitative analysis to those objects with the most data. We select targets with significant variability in their Br emission, for which we obtained epochs of data. We then determine frequency distributions of measured EWs using periodograms (Lomb 1976; Scargle 1982).
Figure 6 shows the calculated periodograms for 8 of our sample objects. In general we see more power on the shortest periods ( days) than on other timescales. This is consistent with the observation that variability appears to occur on night-to-night timescales in many sources, and is compatible with variability associated with magnetospheric accretion processes (e.g., Kurosawa & Romanova 2013).

However the time-sampling of the observations alone can lead to power at short periods in the periodograms. To test this, we calculated the periodograms for 1000 realizations of Gaussian noise, with the same time-sampling as our observations. The average of these 1000 periodograms is included in Figure 6. The periodograms for several targets, most notably V1685 Cyg and AS 442, resemble the one computed for Gaussian noise. For these sources, the variability may be random, with no preferred timescale.
The periodograms for other objects appear distinct from the one determined for Gaussian noise, and suggest variability on longer timescales. V1331 Cyg shows a peak in its periodogram on a timescale days. MWC 297 also shows power on timescales days at approximately the same level as the power seen on shorter variability timescales. We noted in Section IV that our observed EWs for MWC 297 differ significantly from previously published measurements from several years earlier. These long-term variations are probably not associated with star/disk interactions. However secular changes in the accretion rate may be associated with this longer-timescale variability.
Magnetospheric accretion models also make predictions about Br line profiles and their variability (Kurosawa et al. 2008; Kurosawa & Romanova 2013). Synthetic Br emission lines show redshifted absorption components. Redshifted absorption may appear and disappear as accretion flows rotate in and out of the observed line-of-sight, or may persist for accretion in the unstable regime where multiple, thin, variable accretion flows impact the star. These absorption components are weaker, or absent, in synthetic spectra of H and other optical lines. The Br absorption features are stronger, and variability amplitudes of line profiles higher, because Br traces matter near the base of the accretion stream at high velocities, while H traces Stark-broadened emission from a much larger area.
While the redshifted absorption components and line profile changes predicted by models would be easily detectable in our FSPEC data, we observe a paucity of either. We see little redshifted absorption in the Br lines for our sample. V1331 Cyg shows strong redshifted absorption—in only some epochs—and V2508 Oph shows weak redshifted absorption. This represents a detection rate of for the sources in our sample exhibiting Br emission. For comparison, Folha & Emerson (2001) saw redshifted Br absorption components around 20% of their sample. Given the lower spectral resolution and signal-to-noise in our data compared to those of Folha & Emerson (2001), and the fairly weak absorption features seen in some objects by those authors, our detection rate is probably consistent with theirs.
Studies of optical emission lines, including those in the Balmer series, often claim much higher rates of redshifted absorption. For example, a study of multiple optical emission lines found redshited H absorption in of observed objects (e.g., Edwards et al. 1994). Red absorption features are seen to persist across multiple epochs in some sources (e.g., Edwards et al. 1994) or to appear and disappear in other objects (e.g., Bertout et al. 1977). Simultaneous monitoring of optical and near-IR lines shows that the amplitude of variability in optical lines is similar to, or marginally larger than the variability amplitude of near-IR lines like Br (e.g., Mendigutía et al. 2013).
Magnetospheric accretion models thus make several predictions (e.g., Kurosawa & Romanova 2013) that can be compared with our observations. Expected variability timescales are on the order of stellar rotation periods, and our inferred variability timescales are roughly consistent with this expectation. However the predicted red absorption features, and their time-variability, is not consistent with our data. Furthermore, the greater occurence rate of such spectral features in optical lines compared to Br is also inconsistent with models. Thus it appears that the models must be modified to account for both the optical and near-IR emission lines, or that a different physical process may be responsible for the Br emission variability seen from young stars.
V.3. Time-Variable Extinction or Continuum Level
Extinction can complicate the picture outlined above by obscuring the central stars or accretion flows, especially for nearly edge-on disks where the line of sight to the central star intersects part of the dusty inner disk. This obscuration may actually increase for higher accretion rates, since increased viscous dissipation heats the inner disk and causes a hydrostatic increase in the disk scale height (e.g., Stone et al. 2014). In this scenario, Br emission from infalling matter may be observed to decrease even as increases, because of the increased extinction.
Extinction may also lead to a situation where observed variability in Br emission is dominated by variability in outflows rather than accretion streams. Since the inner disk scale height is large compared to the size of the central star, even magnetospheric accretion flows onto polar regions of the star can be obscured by a nearly edge-on disk. While the mass accretion rate is typically higher than the mass outflow rate (by about a factor of 10; e.g., Hartigan et al. 1995), if the accretion flow is extincted while the outflow is not, then any observed variability may be dominated by processes in the outflow. Since extinction of the inner accretion stream could increase with , the relative contributions of infall and outflow to the observed Br line profile might also vary with .
Finally, extinction may obscure the central star while leaving more of the accretion flow visible. In this case, the continuum level might decrease while the Br line flux (and line profile) remained approximately constant. For the majority of our sample, the -band continuum flux is dominated by emission from circumstellar matter (e.g., Eisner et al. 2014), and thus any variable obscuration of the central star is expected to be a minor effect.
However, changes in continuum level due to variations in the structure of the inner disk (e.g., Flaherty et al. 2013; Cody et al. 2014), may also be important for interpreting our observations. Continuum changes would cause variability in the Br line-to-continuum ratios, and hence in the measured EWs.
Some studies have found evidence for photometric and spectroscopic variability due to time-variable obscuration by a warped inner disk on stellar rotation (or equivalently, corotation) timescales (e.g., Bouvier et al. 2007). In general, however, one might expect variability on the dynamical timescales corresponding to the inner edge of the dust disk, which is typically larger (by factors up to a few) than the corotation radius (e.g., Eisner et al. 2005). It is this dusty inner disk that dominates the continuum emission and the potential extinction.
With the time-sampling of our data, we are not sensitive to the difference in period expected for variability near the inner edge of the dust disk and variability linked to the magnetospheric scale. However, the lack of line profile variability seen in many objects is consistent with time-variable extinction or continuum level, but not with models of variable, magnetically-mediated accretion.
VI. Conclusions
We presented spectra of a sample of 25 young stars, covering the Br feature at a resolution of . For 10 of these targets, the data presented here are the first observations of the Br spectral region, and emission was detected from 8 for the first time. For the other targets in our sample, which had been previously observed, we presented multiple epochs of new data, which we used to constrain the time-variability of Br emission from our sample.
For most targets, observations were taken over a span of 1 year, sampling time-spacings of roughly one day, one month, and one year. We detected Br emission from 21 sources, and saw significant variability in 10 of them (approximately 50%). This variability is constrained quantitatively through measurements of EW. In some objects, we also observed changes in line profiles with time.
The observed variability seems to occur over a range of timescales. Night-to-night variations were detected in some objects, and a periodogram analysis suggested that some variability occurs on such timescales. These timescales are similar to stellar rotation periods, and are compatible with those expected for rotationally-modulated accretion onto the central stars. However the line profiles—which typically lack redshifted absorption across all observed epochs—are inconsistent with rotationally-modulated accretion models. Furthermore, some targets in our sample show evidence for substantial variations in Br EW and line profiles on timescales of months or years, much longer than stellar rotation periods.
An alternative explanation for observed Br variability is time-variable extinction or changes in the continuum flux level. Such variability might occur on inner disk dynamical timescales, which are typically days to weeks, or on longer timescales if there are orbiting clouds of dust at larger radii. While continuum changes or time-variable extinction could lead to variability in Br EW, line profiles would remain approximately constant. This scenario appears consistent with the observed variability for many of our targets.
Acknowledgments. JAE gratefully acknowledges support from an Alfred P. Sloan Research Fellowship. Support for this work, largely for students affiliated with the project, comes from the National Science Foundation under Award No. AST-0847170, a PAARE Grant for the California-Arizona Minority Partnership for Astronomy Research and Education (CAMPARE). Any opinions, findings, and conclusions or recommendations expressed in this material are those of the author(s) and do not necessarily reflect the views of the National Science Foundation.
References
- Armond et al. (2011) Armond, T., Reipurth, B., Bally, J., & Aspin, C. 2011, A&A, 528, A125
- Beck et al. (2010) Beck, T. L., Bary, J. S., & McGregor, P. J. 2010, ApJ, 722, 1360
- Bertout et al. (1988) Bertout, C., Basri, G., & Bouvier, J. 1988, ApJ, 330, 350
- Bertout et al. (1977) Bertout, C., Krautter, J., Moellenhoff, C., & Wolf, B. 1977, A&A, 61, 737
- Bouvier et al. (2007) Bouvier, J., Alencar, S. H. P., Boutelier, T., Dougados, C., Balog, Z., Grankin, K., Hodgkin, S. T., Ibrahimov, M. A., Kun, M., Magakian, T. Y., & Pinte, C. 2007, A&A, 463, 1017
- Brittain et al. (2007) Brittain, S. D., Simon, T., Najita, J. R., & Rettig, T. W. 2007, ApJ, 659, 685
- Carpenter et al. (2001) Carpenter, J. M., Hillenbrand, L. A., & Skrutskie, M. F. 2001, AJ, 121, 3160
- Carr (1989) Carr, J. S. 1989, ApJ, 345, 522
- Chavarria-K. (1981) Chavarria-K., C. 1981, A&A, 101, 105
- Chini (1981) Chini, R. 1981, A&A, 99, 346
- Cody et al. (2014) Cody, A. M., Stauffer, J., Baglin, A., Micela, G., Rebull, L. M., Flaccomio, E., Morales-Calderón, M., Aigrain, S., Bouvier, J., Hillenbrand, L. A., Gutermuth, R., Song, I., Turner, N., Alencar, S. H. P., Zwintz, K., Plavchan, P., Carpenter, J., Findeisen, K., Carey, S., Terebey, S., Hartmann, L., Calvet, N., Teixeira, P., Vrba, F. J., Wolk, S., Covey, K., Poppenhaeger, K., Günther, H. M., Forbrich, J., Whitney, B., Affer, L., Herbst, W., Hora, J., Barrado, D., Holtzman, J., Marchis, F., Wood, K., Medeiros Guimarães, M., Lillo Box, J., Gillen, E., McQuillan, A., Espaillat, C., Allen, L., D’Alessio, P., & Favata, F. 2014, AJ, 147, 82
- Cohen (1977) Cohen, M. 1977, ApJ, 215, 533
- Costigan et al. (2014) Costigan, G., Vink, J. S., Scholz, A., Ray, T., & Testi, L. 2014, MNRAS, 440, 3444
- de Lara et al. (1991) de Lara, E., Chavarria-K., C., & Lopez-Molina, G. 1991, A&A, 243, 139
- Donehew & Brittain (2011) Donehew, B. & Brittain, S. 2011, AJ, 141, 46
- Edwards et al. (1994) Edwards, S., Hartigan, P., Ghandour, L., & Andrulis, C. 1994, AJ, 108, 1056
- Eiroa et al. (2002) Eiroa, C., Oudmaijer, R. D., Davies, J. K., de Winter, D., Garzón, F., Palacios, J., Alberdi, A., Ferlet, R., Grady, C. A., Cameron, A., Deeg, H. J., Harris, A. W., Horne, K., Merín, B., Miranda, L. F., Montesinos, B., Mora, A., Penny, A., Quirrenbach, A., Rauer, H., Schneider, J., Solano, E., Tsapras, Y., & Wesselius, P. R. 2002, A&A, 384, 1038
- Eisner et al. (2010a) Eisner, J. A., Doppmann, G. W., Najita, J. R., McCarthy, D., Kulesa, C., Swift, B. J., & Teske, J. 2010a, ApJ, 722, L28
- Eisner et al. (2009) Eisner, J. A., Graham, J. R., Akeson, R. L., & Najita, J. 2009, ApJ, 692, 309
- Eisner & Hillenbrand (2011) Eisner, J. A. & Hillenbrand, L. A. 2011, ApJ, 738, 9
- Eisner et al. (2014) Eisner, J. A., Hillenbrand, L. A., & Stone, J. M. 2014, MNRAS, 443, 1916
- Eisner et al. (2005) Eisner, J. A., Hillenbrand, L. A., White, R. J., Akeson, R. L., & Sargent, A. I. 2005, ApJ, 623, 952
- Eisner et al. (2007) Eisner, J. A., Hillenbrand, L. A., White, R. J., Bloom, J. S., Akeson, R. L., & Blake, C. H. 2007, ApJ, 669, 1072
- Eisner et al. (2010b) Eisner, J. A., Monnier, J. D., Woillez, J., Akeson, R. L., Millan-Gabet, R., Graham, J. R., Hillenbrand, L. A., Pott, J., Ragland, S., & Wizinowich, P. 2010b, ApJ, 718, 774
- Eisner et al. (2013) Eisner, J. A., Rieke, G. H., Rieke, M. J., Flaherty, K. M., Arnold, T. J., Stone, J. M., Cortes, S. R., Cox, E., Hawkins, C., Cole, A., Zajac, S., & Rudolph, A. L. 2013, MNRAS, 434, 407
- Flaherty et al. (2013) Flaherty, K. M., Muzerolle, J., Rieke, G., Gutermuth, R., Balog, Z., Herbst, W., & Megeath, S. T. 2013, AJ, 145, 66
- Flaherty et al. (2012) Flaherty, K. M., Muzerolle, J., Rieke, G., Gutermuth, R., Balog, Z., Herbst, W., Megeath, S. T., & Kun, M. 2012, ApJ, 748, 71
- Folha & Emerson (2001) Folha, D. F. M. & Emerson, J. P. 2001, A&A, 365, 90
- Forbrich et al. (2007) Forbrich, J., Preibisch, T., Menten, K. M., Neuhäuser, R., Walter, F. M., Tamura, M., Matsunaga, N., Kusakabe, N., Nakajima, Y., Brandeker, A., Fornasier, S., Posselt, B., Tachihara, K., & Broeg, C. 2007, A&A, 464, 1003
- Garcia Lopez et al. (2006) Garcia Lopez, R., Natta, A., Testi, L., & Habart, E. 2006, A&A, 459, 837
- Giampapa et al. (1993) Giampapa, M. S., Basri, G. S., Johns, C. M., & Imhoff, C. 1993, ApJS, 89, 321
- Goodrich (1986) Goodrich, R. W. 1986, ApJ, 311, 882
- Grinin et al. (1994) Grinin, V. P., The, P. S., de Winter, D., Giampapa, M., Rostopchina, A. N., Tambovtseva, L. V., & van den Ancker, M. E. 1994, A&A, 292, 165
- Guenther & Hessman (1993) Guenther, E. & Hessman, F. V. 1993, A&A, 268, 192
- Gullbring et al. (1998) Gullbring, E., Hartmann, L., Briceno, C., & Calvet, N. 1998, ApJ, 492, 323
- Hartigan et al. (1995) Hartigan, P., Edwards, S., & Ghandour, L. 1995, ApJ, 452, 736
- Hartmann & Kenyon (1996) Hartmann, L. & Kenyon, S. J. 1996, ARA&A, 34, 207
- Herbig (1958) Herbig, G. H. 1958, ApJ, 128, 259
- Herbig (1966) —. 1966, Vistas in Astronomy, 8, 109
- Herbst et al. (2007) Herbst, W., Eislöffel, J., Mundt, R., & Scholz, A. 2007, Protostars and Planets V, 297
- Herbst et al. (1994) Herbst, W., Herbst, D. K., Grossman, E. J., & Weinstein, D. 1994, AJ, 108, 1906
- Hillenbrand et al. (1992) Hillenbrand, L. A., Strom, S. E., Vrba, F. J., & Keene, J. 1992, ApJ, 397, 613
- Johns & Basri (1995) Johns, C. M. & Basri, G. 1995, ApJ, 449, 341
- Joy (1942) Joy, A. H. 1942, PASP, 54, 15
- Joy (1945) —. 1945, ApJ, 102, 168
- Kraus et al. (2008) Kraus, S., Hofmann, K.-H., Benisty, M., Berger, J.-P., Chesneau, O., Isella, A., Malbet, F., Meilland, A., Nardetto, N., Natta, A., Preibisch, T., Schertl, D., Smith, M., Stee, P., Tatulli, E., Testi, L., & Weigelt, G. 2008, A&A, 489, 1157
- Kurosawa et al. (2006) Kurosawa, R., Harries, T. J., & Symington, N. H. 2006, MNRAS, 370, 580
- Kurosawa & Romanova (2013) Kurosawa, R. & Romanova, M. M. 2013, MNRAS, 431, 2673
- Kurosawa et al. (2008) Kurosawa, R., Romanova, M. M., & Harries, T. J. 2008, MNRAS, 385, 1931
- Laugalys & Straižys (2002) Laugalys, V. & Straižys, V. 2002, Baltic Astronomy, 11, 205
- Laugalys et al. (2006) Laugalys, V., Straižys, V., Vrba, F. J., Boyle, R. P., Davis Philip, A. G., & Kazlauskas, A. 2006, Baltic Astronomy, 15, 483
- Lomb (1976) Lomb, N. R. 1976, Ap&SS, 39, 447
- Malbet et al. (2007) Malbet, F., Benisty, M., de Wit, W.-J., Kraus, S., Meilland, A., Millour, F., Tatulli, E., Berger, J.-P., Chesneau, O., Hofmann, K.-H., Isella, A., Natta, A., Petrov, R. G., Preibisch, T., Stee, P., Testi, L., Weigelt, G., Antonelli, P., Beckmann, U., Bresson, Y., Chelli, A., Dugué, M., Duvert, G., Gennari, S., Glück, L., Kern, P., Lagarde, S., Le Coarer, E., Lisi, F., Perraut, K., Puget, P., Rantakyrö, F., Robbe-Dubois, S., Roussel, A., Zins, G., Accardo, M., Acke, B., Agabi, K., Altariba, E., Arezki, B., Aristidi, E., Baffa, C., Behrend, J., Blöcker, T., Bonhomme, S., Busoni, S., Cassaing, F., Clausse, J.-M., Colin, J., Connot, C., Delboulbé, A., Domiciano de Souza, A., Driebe, T., Feautrier, P., Ferruzzi, D., Forveille, T., Fossat, E., Foy, R., Fraix-Burnet, D., Gallardo, A., Giani, E., Gil, C., Glentzlin, A., Heiden, M., Heininger, M., Hernandez Utrera, O., Kamm, D., Kiekebusch, M., Le Contel, D., Le Contel, J.-M., Lesourd, T., Lopez, B., Lopez, M., Magnard, Y., Marconi, A., Mars, G., Martinot-Lagarde, G., Mathias, P., Mège, P., Monin, J.-L., Mouillet, D., Mourard, D., Nussbaum, E., Ohnaka, K., Pacheco, J., Perrier, C., Rabbia, Y., Rebattu, S., Reynaud, F., Richichi, A., Robini, A., Sacchettini, M., Schertl, D., Schöller, M., Solscheid, W., Spang, A., Stefanini, P., Tallon, M., Tallon-Bosc, I., Tasso, D., Vakili, F., von der Lühe, O., Valtier, J.-C., Vannier, M., & Ventura, N. 2007, A&A, 464, 43
- Mendigutía et al. (2013) Mendigutía, I., Brittain, S., Eiroa, C., Meeus, G., Montesinos, B., Mora, A., Muzerolle, J., Oudmaijer, R. D., & Rigliaco, E. 2013, ApJ, 776, 44
- Mendigutía et al. (2011) Mendigutía, I., Eiroa, C., Montesinos, B., Mora, A., Oudmaijer, R. D., Merín, B., & Meeus, G. 2011, A&A, 529, A34
- Miroshnichenko & Corporon (1999) Miroshnichenko, A. & Corporon, P. 1999, A&A, 349, 126
- Mora et al. (2001) Mora, A., Merín, B., Solano, E., Montesinos, B., de Winter, D., Eiroa, C., Ferlet, R., Grady, C. A., Davies, J. K., Miranda, L. F., Oudmaijer, R. D., Palacios, J., Quirrenbach, A., Harris, A. W., Rauer, H., Cameron, A., Deeg, H. J., Garzón, F., Penny, A., Schneider, J., Tsapras, Y., & Wesselius, P. R. 2001, A&A, 378, 116
- Muzerolle et al. (2001) Muzerolle, J., Calvet, N., & Hartmann, L. 2001, ApJ, 550, 944
- Muzerolle et al. (1998) Muzerolle, J., Hartmann, L., & Calvet, N. 1998, AJ, 116, 2965
- Najita et al. (1996) Najita, J., Carr, J. S., & Tokunaga, A. T. 1996, ApJ, 456, 292
- Palla & Stahler (1993) Palla, F. & Stahler, S. W. 1993, ApJ, 418, 414
- Perryman et al. (1997) Perryman, M. A. C., Lindegren, L., Kovalevsky, J., Hoeg, E., Bastian, U., Bernacca, P. L., Crézé, M., Donati, F., Grenon, M., van Leeuwen, F., van der Marel, H., Mignard, F., Murray, C. A., Le Poole, R. S., Schrijver, H., Turon, C., Arenou, F., Froeschlé, M., & Petersen, C. S. 1997, A&A, 323, L49
- Pogodin et al. (2012) Pogodin, M. A., Hubrig, S., Yudin, R. V., Schöller, M., González, J. F., & Stelzer, B. 2012, Astronomische Nachrichten, 333, 594
- Racine (1968) Racine, R. 1968, AJ, 73, 233
- Reipurth et al. (1996) Reipurth, B., Pedrosa, A., & Lago, M. T. V. T. 1996, A&AS, 120, 229
- Rigliaco et al. (2012) Rigliaco, E., Natta, A., Testi, L., Randich, S., Alcalà, J. M., Covino, E., & Stelzer, B. 2012, A&A, 548, A56
- Rodgers et al. (2002) Rodgers, B., Wooden, D. H., Grinin, V., Shakhovsky, D., & Natta, A. 2002, ApJ, 564, 405
- Romanova et al. (2008) Romanova, M. M., Kulkarni, A. K., & Lovelace, R. V. E. 2008, ApJ, 673, L171
- Romanova et al. (2004) Romanova, M. M., Ustyugova, G. V., Koldoba, A. V., & Lovelace, R. V. E. 2004, ApJ, 610, 920
- Rush et al. (2011) Rush, B. W., Wisniewski, J. P., & Bjorkman, K. S. 2011, AJ, 142, 58
- Scargle (1982) Scargle, J. D. 1982, ApJ, 263, 835
- Schisano et al. (2009) Schisano, E., Covino, E., Alcalá, J. M., Esposito, M., Gandolfi, D., & Guenther, E. W. 2009, A&A, 501, 1013
- Sitko et al. (2012) Sitko, M. L., Day, A. N., Kimes, R. L., Beerman, L. C., Martus, C., Lynch, D. K., Russell, R. W., Grady, C. A., Schneider, G., Lisse, C. M., Nuth, J. A., Curé, M., Henden, A. A., Kraus, S., Motta, V., Tamura, M., Hornbeck, J., Williger, G. M., & Fugazza, D. 2012, ApJ, 745, 29
- Skrutskie et al. (1996) Skrutskie, M. F., Meyer, M. R., Whalen, D., & Hamilton, C. 1996, AJ, 112, 2168
- Stone et al. (2014) Stone, J. M., Eisner, J. A., Salyk, C., Kulesa, C., & McCarthy, D. 2014, ApJ, 792, 56
- Straižys et al. (2014) Straižys, V., Maskoliūnas, M., Boyle, R. P., Prada Moroni, P. G., Tognelli, E., Zdanavičius, K., Zdanavičius, J., Laugalys, V., & Kazlauskas, A. 2014, MNRAS, 438, 1848
- Strom et al. (1972) Strom, K. M., Strom, S. E., Breger, M., Brooke, A. L., Yost, J., Grasdalen, G., & Carrasco, L. 1972, ApJ, 173, L65+
- Tannirkulam et al. (2008) Tannirkulam, A., Monnier, J. D., Millan-Gabet, R., Harries, T. J., Pedretti, E., ten Brummelaar, T. A., McAlister, H., Turner, N., Sturmann, J., & Sturmann, L. 2008, ApJ, 677, L51
- Torres et al. (2006) Torres, C. A. O., Quast, G. R., da Silva, L., de La Reza, R., Melo, C. H. F., & Sterzik, M. 2006, A&A, 460, 695
- Walter et al. (1994) Walter, F. M., Vrba, F. J., Mathieu, R. D., Brown, A., & Myers, P. C. 1994, AJ, 107, 692
- Weigelt et al. (2011) Weigelt, G., Grinin, V. P., Groh, J. H., Hofmann, K.-H., Kraus, S., Miroshnichenko, A. S., Schertl, D., Tambovtseva, L. V., Benisty, M., Driebe, T., Lagarde, S., Malbet, F., Meilland, A., Petrov, R., & Tatulli, E. 2011, A&A, 527, A103
| Source | MJD | Airmass | Calibrators | Airmass | Br EW | ||||
|---|---|---|---|---|---|---|---|---|---|
| (J2000) | (J2000) | (s) | (s) | (Å) | |||||
| T Tauri Stars | |||||||||
| AS 205 N | 16 11 31.40 | -18 38 24.5 | 55338 | 450 | 1.6 | HD 144253 | 96 | 1.6 | |
| 55339 | 900 | 1.6 | HD 144253 | 240 | 1.7 | ||||
| 55340 | 300 | 1.6 | HD 144253 | 96 | 1.6 | ||||
| 55341 | 300 | 1.6 | HD 144253 | 120 | 1.7 | ||||
| 55342 | 300 | 1.7 | HD 144253 | 192 | 1.7 | ||||
| 55373 | 300 | 1.6 | HD 144253 | 160 | 1.7 | ||||
| 55694 | 150 | 1.6 | HD 144253 | 120 | 1.6 | ||||
| 55695 | 300 | 1.7 | HD 144253 | 120 | 1.8 | ||||
| 55728 | 250 | 1.6 | HD 144253 | 125 | 1.7 | ||||
| 55729 | 250 | 1.6 | HD 144253 | 125 | 1.7 | ||||
| V1002 Sco | 16 12 40.51 | -18 59 28.1 | 55339 | 900 | 1.6 | HD 144253 | 240 | 1.7 | |
| 55340 | 450 | 1.6 | HD 144253 | 96 | 1.6 | ||||
| 55341 | 600 | 1.6 | HD 144253 | 120 | 1.7 | ||||
| 55342 | 450 | 1.6 | HD 144253 | 192 | 1.7 | ||||
| 55694 | 300 | 1.6 | HD 144253 | 120 | 1.6 | ||||
| 55695 | 300 | 1.7 | HD 144253 | 120 | 1.8 | ||||
| 55728 | 375 | 1.6 | HD 144253 | 125 | 1.7 | ||||
| 55729 | 375 | 1.6 | HD 144253 | 125 | 1.7 | ||||
| V2508 Oph | 16 48 45.63 | -14 16 40.0 | 55338 | 450 | 1.5 | HD 144253 | 96 | 1.6 | |
| 55339 | 900 | 1.4 | HD 144253 | 240 | 1.7 | ||||
| 55340 | 450 | 1.5 | HD 144253 | 96 | 1.6 | ||||
| 55341 | 300 | 1.5 | HD 144253 | 120 | 1.7 | ||||
| 55342 | 450 | 1.5 | HD 144253 | 192 | 1.7 | ||||
| 55694 | 450 | 1.5 | HD 144253 | 120 | 1.6 | ||||
| 55695 | 300 | 1.6 | HD 144253 | 120 | 1.8 | ||||
| 55728 | 250 | 1.4 | HD 144253 | 125 | 1.7 | ||||
| 55729 | 250 | 1.4 | HD 144253 | 125 | 1.7 | ||||
| AS 209 | 16 49 15.30 | -14 22 08.6 | 55338 | 450 | 1.5 | HD 151528 | 120 | 1.5 | |
| 55339 | 600 | 1.5 | HD 151528 | 300 | 1.5 | ||||
| 55340 | 300 | 1.5 | HD 151528 | 240 | 1.5 | ||||
| 55341 | 300 | 1.5 | HD 151528 | 150 | 1.5 | ||||
| 55694 | 300 | 1.5 | HD 151528 | 240 | 1.5 | ||||
| 55695 | 300 | 1.6 | HD 151528 | 150 | 1.6 | ||||
| 55728 | 250 | 1.5 | HD 151528 | 125 | 1.5 | ||||
| 55729 | 375 | 1.5 | HD 151528 | 125 | 1.5 | ||||
| V521 Cyg | 20 58 23.81 | 43 53 11.4 | 06/24/10 | 300 | 1.1 | HD 192164 | 60 | 1.0 | |
| 55373 | 200 | 1.0 | HD 192164 | 80 | 1.1 | ||||
| Herbig Ae Stars | |||||||||
| HD 141569 | 15 49 57.75 | -03 55 16.3 | 55338 | 600 | 1.3 | HD 135204 | 96 | 1.2 | |
| 55339 | 840 | 1.3 | HD 135204 | 120 | 1.2 | ||||
| 55342 | 240 | 1.3 | HD 135204 | 120 | 1.2 | ||||
| 55694 | 420 | 1.3 | HD 135204 | 180 | 1.2 | ||||
| 55695 | 300 | 1.3 | HD 135204 | 150 | 1.2 | ||||
| 55728 | 250 | 1.2 | HD 135204 | 125 | 1.2 | ||||
| 55729 | 250 | 1.2 | HD 135204 | 125 | 1.2 | ||||
| MWC 863 | 16 40 17.92 | -23 53 45.2 | 55338 | 120 | 1.8 | HD 154088 | 84 | 2.0 | |
| 55341 | 120 | 1.8 | HD 154088 | 84 | 2.0 | ||||
| 55694 | 240 | 1.8 | HD 154088 | 90 | 2.0 | ||||
| 55728 | 125 | 1.8 | HD 154088 | 125 | 2.0 | ||||
| 55729 | 250 | 1.9 | HD 154088 | 125 | 2.0 | ||||
| 51 Oph | 17 31 24.95 | -23 57 45.5 | 55338 | 60 | 1.8 | HD 157172 | 120 | 1.6 | |
| 55341 | 120 | 1.8 | HD 157172 | 150 | 1.6 | ||||
| 55694 | 120 | 1.8 | HD 157172 | 270 | 1.6 | ||||
| 55695 | 150 | 1.8 | HD 157172 | 300 | 1.6 | ||||
| 55728 | 125 | 1.9 | HD 157172 | 250 | 1.6 | ||||
| 55729 | 250 | 1.8 | HD 157172 | 250 | 1.6 | ||||
| MWC 275 | 17 56 21.29 | -21 57 21.9 | 55338 | 216 | 1.7 | HD 157172 | 120 | 1.6 | |
| 55341 | 120 | 1.7 | HD 157172 | 150 | 1.6 | ||||
| 55694 | 120 | 1.7 | HD 157172 | 270 | 1.6 | ||||
| 55695 | 150 | 1.8 | HD 157172 | 300 | 1.6 | ||||
| 55728 | 125 | 1.7 | HD 157172 | 300 | 1.6 | ||||
| 55729 | 125 | 1.7 | HD 157172 | 250 | 1.6 | ||||
| VV Ser | 18 28 47.90 | 00 08 40.0 | 55338 | 120 | 1.2 | HD 174719 | 120 | 1.2 | |
| 55339 | 600 | 1.2 | HD 174719 | 300 | 1.2 | ||||
| 55340 | 120 | 1.2 | HD 174719 | 120 | 1.2 | ||||
| 55341 | 120 | 1.2 | HD 174719 | 120 | 1.2 | ||||
| 55371 | 360 | 1.2 | HD 174719 | 120 | 1.1 | ||||
| 55694 | 270 | 1.2 | HD 174719 | 120 | 1.2 | ||||
| 55695 | 300 | 1.2 | HD 174719 | 150 | 1.3 | ||||
| 55728 | 250 | 1.2 | HD 174719 | 250 | 1.1 | ||||
| 55729 | 250 | 1.2 | HD 174719 | 125 | 1.1 | ||||
| V2020 Cyg | 20 48 20.35 | 43 39 48.2 | 55338 | 120 | 1.1 | HD 204814 | 60 | 1.0 | |
| 55370 | 300 | 1.0 | HD 192164 | 120 | 1.0 | ||||
| 55371 | 300 | 1.0 | HD 192164 | 120 | 1.0 | ||||
| 55373 | 300 | 1.0 | HD 192164 | 80 | 1.1 | ||||
| Herbig Be Stars | |||||||||
| EU Ser | 18 19 09.38 | -13 50 41.1 | 55371 | 450 | 1.5 | HD 174719 | 120 | 1.1 | |
| 55373 | 200 | 1.4 | HD 174719 | 80 | 1.1 | ||||
| MWC 297 | 18 27 39.53 | -03 49 52.1 | 55338 | 36 | 1.2 | HD 174719 | 120 | 1.2 | |
| 55339 | 144 | 1.3 | HD 174719 | 300 | 1.2 | ||||
| 55340 | 36 | 1.2 | HD 174719 | 120 | 1.2 | ||||
| 55341 | 36 | 1.2 | HD 174719 | 120 | 1.2 | ||||
| 55371 | 72 | 1.2 | HD 174719 | 120 | 1.1 | ||||
| 55694 | 126 | 1.2 | HD 174719 | 120 | 1.2 | ||||
| 55695 | 78 | 1.3 | HD 174719 | 150 | 1.3 | ||||
| 55728 | 80 | 1.2 | HD 174719 | 250 | 1.1 | ||||
| 55729 | 36 | 1.2 | HD 174719 | 125 | 1.1 | ||||
| V1685 Cyg | 20 20 28.24 | 41 21 51.6 | 55338 | 96 | 1.1 | HD 204814 | 60 | 1.0 | |
| 55339 | 240 | 1.0 | HD 204814 | 240 | 1.1 | ||||
| 55340 | 120 | 1.0 | HD 204814 | 96 | 1.1 | ||||
| 55341 | 120 | 1.1 | HD 204814 | 96 | 1.2 | ||||
| 55342 | 120 | 1.0 | HD 192164 | 60 | 1.0 | ||||
| 55370 | 120 | 1.0 | HD 192164 | 120 | 1.0 | ||||
| 55371 | 120 | 1.0 | HD 192164 | 120 | 1.0 | ||||
| 55372 | 120 | 1.0 | HD 192164 | 60 | 1.0 | ||||
| 55373 | 80 | 1.1 | HD 192164 | 80 | 1.1 | ||||
| 55695 | 150 | 1.1 | HD 192164 | 90 | 1.2 | ||||
| 55728 | 125 | 1.0 | HD 192164 | 100 | 1.0 | ||||
| V1972 Cyg | 20 23 03.61 | 39 29 50.1 | 55338 | 60 | 1.0 | HD 204814 | 60 | 1.0 | |
| 55339 | 240 | 1.0 | HD 204814 | 240 | 1.1 | ||||
| 55340 | 60 | 1.0 | HD 204814 | 96 | 1.1 | ||||
| 55341 | 60 | 1.0 | HD 204814 | 96 | 1.2 | ||||
| AS 442 | 20 47 37.47 | 43 47 24.9 | 55338 | 240 | 1.1 | HD 204814 | 60 | 1.0 | |
| 55339 | 300 | 1.0 | HD 204814 | 240 | 1.1 | ||||
| 55340 | 240 | 1.1 | HD 204814 | 96 | 1.1 | ||||
| 55341 | 240 | 1.1 | HD 204814 | 96 | 1.2 | ||||
| 55342 | 240 | 1.0 | HD 192164 | 60 | 1.0 | ||||
| 55370 | 120 | 1.0 | HD 192164 | 120 | 1.0 | ||||
| 55371 | 120 | 1.0 | HD 192164 | 120 | 1.0 | ||||
| 55373 | 160 | 1.0 | HD 192164 | 80 | 1.1 | ||||
| 55695 | 150 | 1.2 | HD 192164 | 90 | 1.2 | ||||
| 55728 | 375 | 1.0 | HD 192164 | 100 | 1.0 | ||||
| V645 Cyg | 21 39 58.24 | 50 14 21.2 | 55338 | 120 | 1.1 | HD 192164 | 60 | 1.0 | |
| 55370 | 150 | 1.1 | HD 192164 | 120 | 1.0 | ||||
| 55371 | 150 | 1.1 | HD 192164 | 120 | 1.0 | ||||
| 55373 | 400 | 1.1 | HD 192614 | 80 | 1.1 | ||||
| V2019 Cyg | 20 48 04.79 | 43 47 25.8 | 55338 | 270 | 1.1 | HD 204814 | 60 | 1.0 | |
| 55339 | 480 | 1.0 | HD 204814 | 240 | 1.1 | ||||
| 55340 | 450 | 1.0 | HD 204814 | 96 | 1.1 | ||||
| 55341 | 300 | 1.1 | HD 204814 | 96 | 1.2 | ||||
| LkH 169 | 20 52 07.65 | 44 03 44.4 | 55338 | 150 | 1.1 | HD 190113 | 36 | 1.0 | |
| 55341 | 240 | 1.0 | HD 204814 | 90 | 1.1 | ||||
| 55370 | 450 | 1.0 | HD 192164 | 120 | 1.0 | ||||
| V380 Cep | 21 01 36.92 | 68 09 47.8 | 55373 | 300 | 1.2 | HD 199476 | 80 | 1.4 | |
| V361 Cep | 21 42 50.18 | 66 06 35.1 | 55373 | 400 | 1.2 | HD 199476 | 80 | 1.4 | |
| MWC 1080 | 23 17 25.57 | 60 50 43.3 | 55373 | 200 | 1.2 | HD 215500 | 80 | 1.2 | |
| FU Ori Objects | |||||||||
| V1057 Cyg | 20 58 53.73 | 44 15 28.5 | 55338 | 120 | 1.2 | HD 192164 | 120 | 1.1 | |
| 55339 | 600 | 1.2 | HD 192164 | 120 | 1.1 | ||||
| 55340 | 120 | 1.1 | HD 192164 | 60 | 1.0 | ||||
| 55341 | 120 | 1.2 | HD 192164 | 60 | 1.1 | ||||
| 55342 | 240 | 1.1 | HD 192164 | 60 | 1.0 | ||||
| 55370 | 150 | 1.0 | HD 192164 | 120 | 1.0 | ||||
| 55371 | 150 | 1.1 | HD 192164 | 120 | 1.0 | ||||
| 55694 | 270 | 1.1 | HD 192164 | 60 | 1.1 | ||||
| 55695 | 150 | 1.3 | HD 192164 | 90 | 1.2 | ||||
| V1515 Cyg | 20 23 48.02 | 42 12 25.8 | 55338 | 240 | 1.1 | HD 190113 | 156 | 1.1 | |
| 55341 | 360 | 1.1 | HD 190113 | 276 | 1.0 | ||||
| 55342 | 450 | 1.1 | HD 190113 | 300 | 1.1 | ||||
| 55370 | 600 | 1.1 | HD 190113 | 270 | 1.1 | ||||
| 55371 | 300 | 1.0 | HD 190113 | 120 | 1.0 | ||||
| 55694 | 300 | 1.1 | HD 190113 | 270 | 1.1 | ||||
| 55695 | 300 | 1.2 | HD 190113 | 150 | 1.2 | ||||
| Heavily Veiled Source | |||||||||
| V1331 Cyg | 21 01 09.21 | 50 21 44.8 | 55338 | 450 | 1.1 | HD 192164 | 120 | 1.1 | |
| 55339 | 900 | 1.1 | HD 192164 | 120 | 1.1 | ||||
| 55340 | 450 | 1.1 | HD 192164 | 60 | 1.0 | ||||
| 55342 | 300 | 1.1 | HD 192164 | 60 | 1.0 | ||||
| 55370 | 150 | 1.1 | HD 192164 | 120 | 1.0 | ||||
| 55371 | 450 | 1.1 | HD 192164 | 120 | 1.0 | ||||
| 55372 | 450 | 1.1 | HD 192164 | 60 | 1.0 | ||||
| 55695 | 450 | 1.3 | HD 192164 | 90 | 1.2 | ||||
| 55728 | 375 | 1.1 | HD 192164 | 100 | 1.0 | ||||
| 55729 | 375 | 1.1 | HD 192164 | 100 | 1.0 | ||||
Note. — Within each group (T Tauri stars, Herbig Ae stars, Herbig Be stars, FU Ori Sources, and heavily-veiled objects), sources are listed roughly in order or right ascension, keeping targets that share common calibration in consecutive order. Uncertainties in measured EW include statistical uncertainties and uncertainties related to uncorrected bad pixels, but do not include errors in estimation of continuum level.