Discovery of true, likely and possible symbiotic stars in the dwarf spheroidal NGC 205††thanks: Based on observations obtained at the Gemini Observatory, which is operated by the Association of Universities for Research in Astronomy, Inc., under a cooperative agreement with the NSF on behalf of the Gemini partnership.
Abstract
In this paper we discuss the photometric and spectroscopic observations of newly discovered (symbiotic) systems in the dwarf spheroidal galaxy NGC 205. The Gemini Multi-Object Spectrograph on-off band [O iii] 5007Å emission imaging highlighted several [O iii] line emitters, for which optical spectra were then obtained (Gonçalves et al. 2014). The detailed study of the spectra of three objects allow us to identify them as true, likely and possible symbiotic systems (SySts), the first ones discovered in this galaxy. SySt-1 is unambiguously classified as a symbiotic star, because of the presence of unique emission lines which belong only to symbiotic spectra, the well known O vi Raman scattered lines. SySt-2 is only possibly a SySt because the Ne vii Raman scattered line at 4881Å, recently identified in a well studied Galactic symbiotic as another very conspicuous property of symbiotic, could as well be identified as N III or [Fe III]. Finally, SySt-3 is likely a symbiotic binary because in the red part of the spectrum it shows the continuum of a late giant, and forbidden lines of moderate- to high-ionization, like [Fe v] 4180Å. The main source for skepticism on the symbiotic nature of the latter systems is their location in the PN region in the [O iii]4363/H vs [O iii]5007/H diagnostic diagram (Gutierrez-Moreno et al. 1995). It is worth mentioning that at least another two confirmed symbiotics, one of the Local Group dwarf spheroidal IC 10 and the other of the Galaxy, are also misplaced in this diagram.
keywords:
binaries: symbiotics - galaxies: individual: NGC 205 - Local Group1 Introduction
Symbiotic stars (SySts) are binary systems composed by a cool giant star and a hot companion, which can be a white dwarf, a main sequence star with accretion disc, or a neutron star. The wind expelled by the cool giant star accretes onto the hot companion powering the symbiotic activity, including occasional eruptions and jets.
Symbiotic systems display characteristic spectra, which allow their detection with on-off band techniques, in which narrow-band filters are tuned in to one or more typical emission lines. In an attempt to separate symbiotic systems from their most common mimic Magrini, Corradi & Munari (2003) used several diagnostic diagrams based on the fluxes obtained with the narrow-band filters H and [O iii] at 5007Å. They concluded that it is, indeed, possible to discover symbiotic systems using their proposed diagrams, but it is not easy to discriminate them from planetary nebulae (PNe) or compact H ii regions without a spectroscopic follow-up. They also estimated the expected number of symbiotic stars in a given galaxy, finding that it increases with the luminosity (mass) of the galaxy. For a galaxy like NGC 205, the second most massive dwarf companion of Andromeda (3.3108M⊙; McConnachie 2012), the predicted number of symbiotic stars is 1.7104 (Magrini et al. 2003), including both active and inactive systems. Active systems are spectroscopically detectable because their stars are interacting and exchanging matter.
This figure is an absolute estimation, and, obviously, it has to be rescaled to obtain the number of SySts that can actually be observed. If the ratio of known (up to 300, Miszalski et al. 2014; Rodríguez-Flores et al. 2014) versus expected ( 400,000, Magrini et al. 2003) SySts in our Galaxy is assumed to be valid in NGC 205, around 12 SySts are expected to be active and detectable in NGC 205. In general, SySts are expected to be more abundant in dwarf spheroidal (dSph) than in dwarf irregular (dIrr) galaxies (Magrini et al. 2003).
In the present work, the discovery of the first three (true, likely and possible) SySts of NGC 205 is reported as a result of our spectroscopic study of the emission-line population of the galaxy. The paper is organized as follows: in Sec.2 we describe our observations, while in Sec.3 we present the spectroscopic characterization of the three systems. In Sec.4 we give an estimate of the stellar parameters of the hot and cool companions in the objects. The location of the newly discovered systems in the Gutierrez-Moreno et al. (1995) diagnostic diagram, aimed to separate SySts from PNe, is discussed in Sec.5. We summarize our work and give our conclusions in Sect. 6.
2 Observational Data
| Field-ID | Name | RA | Dec | C05α |
| J2000.0 | J2000.0 | |||
| F2-9 | NGC 205 SySt–1 | 00:40:17.60 | +41:41:53.30 | - |
| F2-8 | NGC 205 SySt–2 | 00:40:07.97 | +41:45:23.64 | PN18 |
| F1-18 | NGC 205 SySt–3 | 00:40:20.97 | +41:41:42.60 | PN36 |
| α PN ID used by Corradi et al. (2005, C05). | ||||
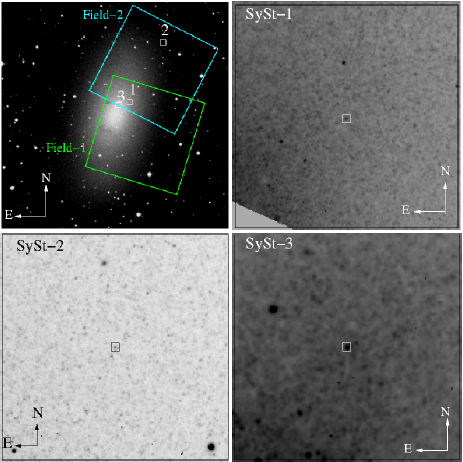
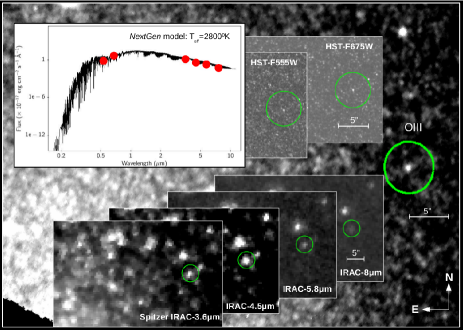
We obtained the present data by using the imager and spectrograph GMOS, Gemini Multi-Object Spectrograph, at the GEMINI North telescope, in 2010 (Program GN-2010B-Q-107). The GMOS has a 5.55.5 arcmin2 field of view, which was centred at the RA/DEC 00:40:12.50/+41:40:03 (Field-1; F1) and 00:40:10.50/+41:43:47.0 (Field-2; F2) of NGC 205, as indicated in Fig. 1.
We adopted the on-off band imaging technique to identify strong emission-line objects (mainly PNe) with the on-band filter [O iii], OIII_G0318, and the off-band one, [O iii]-Continuum, being OIII_G0319. The central wavelength and width of these two filters are 499 nm/5 nm, and 514 nm/10 nm, respectively. Three exposures of 540(810) seconds using the on-band(off-band) filter were taken, in July 9 (F1) and September 2-3 (F2) of 2010. We then used the two combined narrow-band frames to build an [O iii] continuum-subtracted image of the field, from which we identified a number of objects to be spectroscopically observed, including previously known PNe and other [O iii] emission-line objects. In Table 1 we also give the Field-ID of the symbiotics, for the sake of consistence with the results for the PNe, which were discussed in a previous paper (Gonçalves et al. 2014, hereafter G14).
The spectroscopy of F1 and F2 was obtained with two gratings, R400+G5305 and B600, from 8th to 11th of October 2010. The effective spectral coverage of the spectra is 3600–9400 400 Å, with initial and final depending on the location of the slit. Exposure times were of 32,400 sec per grating. The disperser central wavelength was slightly varied from exposure to exposure (750 nm for R400+G5305, and B600 was centred at 460 nm). The slit width was 1′′, while the slit height was 56. The final (binned) spatial scale and reciprocal dispersions of the spectra are as follows: 0161 and 0.09 nm per pixel, with B600; and 0161 and 0.134 nm per pixel, with R400+G5305. The seeing varied from 042 to 057. CuAr lamp exposures were obtained with both gratings, in the day before or after the science exposures, for wavelength calibration. On October 8th and 12th, 2010 we obtained spectra of spectrophotometric standards (Massey et al. 1988; Massey & Gronwall 1990) with the same instrumental setups as for science exposures and we used them to flux calibrate the spectra. The whole reduction and calibration was performed in the standard way by using the Gemini gmos data reduction script and long-slit tasks, both being part of IRAF. We refer the reader to G14 for further details on the observations and reduction where we described, among others details, the effects of the differential atmospheric refraction on the present data. In G14 we also show the good agreement between our measured spectroscopic fluxes and those extracted from the literature for common objects.
2.1 Spectroscopic Measurements and Analysis
The emission-line fluxes were measured with the IRAF package SPLOT. Errors on the fluxes were calculated taking into account the statistical errors in the measurement of the fluxes, as well as systematic errors (flux calibrations, background determination and sky subtraction). The resulting errors are given in the fluxes table (Table 2). The Balmer Decrement was used as an estimation of the internal dust attenuation of the SySts. Given that H and H were measured at a relatively noisier part of the spectrum, they are not useful for deriving the extinction correction constant, Ṫhus, was determined comparing the observed Balmer I (H)/I (H) ratio with its theoretical value, 2.85 (Osterbrock & Ferland 2006). The =0.445 obtained with the Balmer Decrement, for NGC 205 SySt–1, compares nicely with the mean we found in G14 for the PNe of NGC 205, 0.380.09. The for the other two systems, on the other hand, are very low: 0.1680.078 and 0.00 for NGC 205 SySt–2 and 3, respectively. Though low, such values are not uncommon within those of the nebular systems either in F1 or in F2 of G14 (see their Table A1).
The H flux (FHβ), the extinction correction constant (), all the other extinction corrected line intensities (Iλ) as well as emission-line fluxes (Fλ), are shown in Table 2.
3 The Systems’ Discovery
The three emission-line objects were serendipitously discovered in the spectroscopic study of NGC 205. Their spectra revealed features that are characteristic of symbiotic systems (see, e.g., Belczyński et al. 2000). In the optical, the spectra of symbiotics are indeed notable due to the absorption features and continuum of late-type M giants, strong nebular emission lines of Balmer H i, the recombination lines of He i and He ii and the forbidden lines of [O ii], [Ne iii], [Ne v] and [Fe vii]. In more detail, the well-known criteria to identify symbiotic stars (Belczyński et al. 2000) are the following: i) The presence of the absorption features of a late-type giant (like titanium and vanadium oxides, TiO and VO, H2O, CO and CN bands, as well as Ca i, Ca ii, Fe i and Na i absorption lines). ii) The presence of strong H i and He i emission lines and either emission lines of ions with an ionization potential of at least 35 eV (e.g. [O iii]), or an A- or F-type continuum with additional shell absorption lines from H i, He i, and singly-ionized metals. The latter corresponds to the appearance of a symbiotic star in outburst. iii) The presence of the 6830Å emission feature, even if no feature of the cool star is found. Also, very recently, Lee, Heo & Lee (2014) identified another Raman–scattered Ne vii 973 at 4881Å line, in the spectrum of the Galactic symbiotic star V1016 Cygni. The latter scattering process is again a unique characteristic of symbiotic systems.
The three systems in NGC 205, hereafter NGC 205 SySt–1, NGC 205 SySt–2, NGC 205 SySt–3, show the following characteristics that led us to classify them, respectively, as true, possible and likely symbiotic binaries:
-
1.
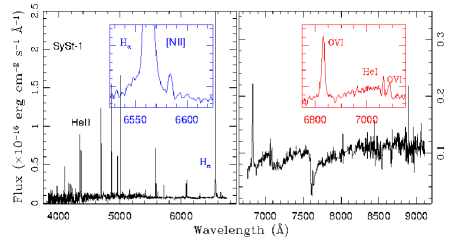
NGC 205 SySt-1 shows the O vi Raman scattered lines at 6830Å, 7088Å, unique signatures seen only in symbiotic stars (Schmid 1989). These emission lines provide a firm classification criterion of symbiotic systems, even when the red giant continuum is not directly observed, as discussed above. Moreover, in the present case the absorption features of the M giant component are clearly seen. The discovery of NGC 205 SySt-1 is similar to that of other SySts in the Local Group (LG) galaxies, as in the case of NGC 6822 (Kniazev et al. 2009) and NGC 185 (Gonçalves et al. 2012), in which the O vi Raman scattered lines were also detected.
-
2.
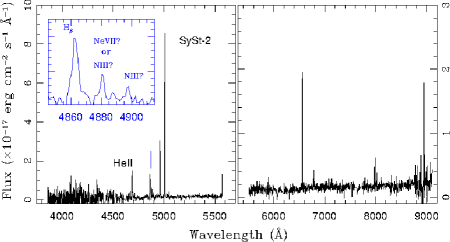
NGC 205 SySt-2, on the other hand, has an extremely intense He ii 4686Å emission line, property that is included among the classification criteria of SySts (Fig. 2, middle panel). As a consequence of such an intense doubly ionized He emission, the effective temperature () of the star that ionizes the gas should be tremendously high (see next section; 4.1). In spite of a high , it is puzzling the fact that higher ionization forbidden lines are not detected in its spectrum, unlike in SySt-1. A possible reason would be the fact that the present system is significantly fainter than the latter (Table 2 shows H fluxes of 3.70 and 0.74 10-16 erg cm-2 s-1 for SySt-1 and 2, respectively). In addition, and as far as we know for the first time in an extragalactic SySt, we tentatively identified the Ne vii 973 at 4881Å Raman-scattered line in the spectrum of SySt-2. This feature can be clearly seen in the inset of the middle panel of Figure 2 (and in Table 2). However, also considering the fact that in the present case only Ne vii is present, with no sign of the O vi Raman scattered line (both were found at the same epoch in V1016; Lee et al. 2014), the emission line at 4881Å could as well be a N iii line. In this case the line at 4898Å, also present in the spectrum and for which we could not easily find an identification, might be associated with N iii too. Considering the low-resolution of the present spectrum, the other lines from the N iii multiplet are blended with H, further complicating a strong identification as N iii. And, a third possible identification for the 4881Å emission-line would be [Fe iii]. Altogether the latter arguments imply that the other possible identifications (N iii and [Fe iii]) are at least equally possible as Ne vii 973 at 4881Å Raman-scattered line.
-
3.
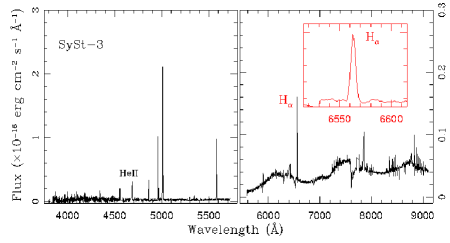
NGC 205 SySt–3 was discovered because of the clear presence of a cool stellar continuum in the red part of its spectrum, compatible with that of a M giant. This symbiotic star, as well as the one discovered in the LG dwarf irregular galaxy IC10 (Gonçalves et al. 2008), though not showing the Raman scattered lines, shares some other properties of Galactic sources. The latter includes the moderate to high-ionization [Fe v] line, at 4181Å (see, for instance, Gutierrez-Moreno & Moreno 1996). These two conspicuous properties of SySts lead us to conclude that SySt-3 is, likely, a symbiotic system.
We compare our detections with other literature surveys in NGC 205 also interested in emission-line populations, in particular PNe: Ford et al. (1973), Ciardullo et al. (1989), Richer & McCall (1995), Corradi et al. (2005), Merrett et al. (2006) and Richer & McCall (2008). All these surveys studied this galaxy using narrow-band imaging and/or optical spectroscopy. From these works, only the spectroscopic survey of Richer & McCall (1995 and 2008) could had found out our symbiotics. However, targets in Table 1 are not included among theirs. The NGC 205 SySt–1 is also not listed among the objects analysed– via narrow-band imaging– by Corradi et al. (2005), while they detected the other two systems and the correspondent ID in their survey are also given in Table 1. The most probable reason why SySt–1 was not detected by Corradi et al. (2005) is that the completeness limit of their survey was only 50% in mag([O iii])= 24.5 – where mag([O iii])=-2.5 F([O iii]5007) - 13.74 (Ciardullo et al. 1989). [O iii] magnitudes of 24.8, 24.4 and 23.6 are the present magnitudes of SySt–1, 2 and 3, respectively.
In Figure 1 we show the fields we observed with GMOS, and the finding charts of the three newly discovered symbiotic stars. Their coordinates, as well as their IDs in G14 and Corradi et al. (2005) are given in Table 1. Compositions of the blue plus red portions of the GMOS spectra of NGC 205 symbiotics are shown in Figure 2, where the main properties that make of them symbiotic systems are highlighted.
4 Characterization of the Symbiotic Systems
4.1 The Ionised Nebulae and the Ionising Sources
We have determined the above discussed extinction coefficient, and corrected all the measured fluxes for further analysis, despite the fact that the Balmer line ratios in many symbiotic nebulae indicate self-absorption effects (due to high densities). In those circumstances, the standard methods to estimate reddening would not apply (possibly the case in SySt–2 and 3). Though most of the line ratios that would provide electron temperatures and densities comes to be out of the sensitive range (see Osterbrock & Ferland 2006), the sulphur doublet [S ii] 6716, 6731 allowed us to estimate an electron density of 6,000 cm-3 for SySt–1 (since the [O iii]-temperature sensitive ratio is below the lower limit, for the above calculation we adopted =21,000 K). The density sensitive lines were not measured in the remaining cases. [O iii] electron temperatures can be derived from the [O iii] 4959,5007 doublet to the 4363 line ratio. Relatively high [O iii] were found for SySt–2 and 3, of 21,000 K and 14,500 K, respectively. Also, using the extinction-corrected integrated flux of He ii 4686 (Kaler & Jacoby 1989), we derived Teff of 340,000, 340,000 and 270,000 K as the temperature of the hot companion, which represents the main nebular ionising source, of SySt–1, 2 and 3, respectively.
The above derived diagnostics constitute further evidences in favour of our targets being representative of symbiotic systems, since and Teff are much higher than the typical values for these parameters found either in PNe or compact H ii regions.
4.2 The Spectral Classification of the Cool Companions

| FHβ | Ion | (Å) | Iλ | Fλ | |
| NGC 205 SySt–1 | |||||
| 3.700 | 0.4450.04 | [Ne iii] | 3868 | 16.60 | 12.30 |
| [Ne iii]+He i | 3968 | 22.20 | 16.87 | ||
| N iii | 4003 | 19.66 | 15.08 | ||
| - | 4084 | 10.27 | 8.064 | ||
| H | 4100 | 36.41 | 28.73 | ||
| H | 4340 | 72.00 | 61.22 | ||
| [O iii] | 4363 | 42.92 | 36.77 | ||
| He i | 4437 | 9.926 | 8.706 | ||
| C ii+O ii | 4491 | 8.156 | 7.280 | ||
| Fe ii | 4584 | 5.230 | 4.810 | ||
| O ii | 4638 | 5.040 | 4.713 | ||
| He ii | 4686 | 124.2 | 117.8 | ||
| H | 4861 | 100.0 | 100.0 | ||
| [O iii] | 4959 | 34.19 | 35.06 | ||
| [O iii] | 5007 | 102.2 | 106.1 | ||
| He i | 5016 | 4.032 | 4.200 | ||
| [Fe vii] | 5159 | 7.891 | 8.500 | ||
| [Fe ii] | 5261 | 3.112 | 3.429 | ||
| Fe iii | 5275 | 3.756 | 4.151 | ||
| [Ca v] | 5308 | 3.113 | 3.493 | ||
| [Fe ii] | 5376 | 1.384 | 1.562 | ||
| He ii | 5412 | 4.917 | 5.587 | ||
| [Fe ii ] | 5496 | 2.219 | 2.562 | ||
| [Fe ii] | 5582 | 21.25 | 24.93 | ||
| V ii | 5618 | 4.195 | 4.950 | ||
| [Fe vii] | 5720 | 10.19 | 12.23 | ||
| [N ii] | 5755 | 2.189 | 2.648 | ||
| He i | 5876 | 11.12 | 13.70 | ||
| [Ca v]+[Fe ii] | 6086 | 12.84 | 16.29 | ||
| [O i] | 6300 | 3.534 | 4.621 | ||
| [S iii] | 6312 | 1.414 | 1.853 | ||
| H | 6563 | 307.2 | 416.4 | ||
| [N ii] | 6584 | 2.774 | 3.770 | ||
| He i | 6678 | 2.253 | 3.101 : | ||
| [S ii] | 6717 | 0.508 | 0.703 : | ||
| [S ii] | 6731 | 0.865 | 1.199 : | ||
| [Fe vi] | 6739 | 0.610 | 0.847 : | ||
| O vi Raman | 6830 | 28.41 | 39.93 : | ||
| He i | 7065 | 2.841 | 4.123 : | ||
| O vi Raman | 7088 | 5.426 | 7.899 : | ||
| [O ii] | 7320. | 0.890 | 1.338 : | ||
| [O ii] | 7330. | 0.982 | 1.478 : | ||
| [O i] | 8447. | 3.776 | 6.550 : | ||
| NGC 205 SySt–2 | |||||
| 0.740 | 0.1680.078 | H | 4340 | 80.42 | 75.69 |
| [O iii] | 4363 | 52.24 | 49.31 | ||
| He ii | 4686 | 137.4 | 134.8 | ||
| H | 4861 | 100.0 | 100.0 | ||
| Ne vii Raman ?, N iii ?, [Fe iii] ? | 4881 | 30.11 | 30.16 | ||
| N iii? | 4898 | 13.37 | 13.42 | ||
| [O iii] | 4959 | 233.5 | 235.8 | ||
| [O iii] | 5007 | 694.3 | 704.5 | ||
| He i | 5876 | 12.44 | 13.45 | ||
| H | 6563 | 293.9 | 329.7 : | ||
| - | 6783 | 34.00 | 38.58 : | ||
| - | 7167 | 11.06 | 12.80 : | ||
| - | 8107 | 19.82 | 24.05 : | ||
| - | 8782 | 40.42 | 50.41 : | ||
| [S iii] | 9069 | 24.79 | 31.19 : | ||
| NGC 205 SySt–3 | |||||
| 1.263 | 0.000.54 | [O ii] | 3729 | 21.6 | 21.6 |
| [Ne iii] | 3868 | 32.7 | 32.7 | ||
| H | 4100 | 25.3 | 25.3 | ||
| [Fe v] | 4180 | 35.3 | 35.3 | ||
| H | 4340 | 54.8 | 54.8 | ||
| [O iii] | 4363 | 16.4 | 16.4 | ||
| - | 4553 | 82.89 | 82.89 | ||
| He ii | 4686 | 84.8 | 84.8 | ||
| H | 4861 | 100.0 | 100.0 | ||
| [O iii] | 4959 | 295.4 | 295.4 | ||
| [O iii] | 5007 | 860.1 | 860.1 | ||
| - | 5343 | 22.1 | 22.1 | ||
| [Fe ii] | 5582 | 220.5 | 220.5 | ||
| - | 5586 | 76.0 | 76.0 | ||
| H | 6563 | 179.2 | 179.2 : | ||
Having only the optical spectrum of the system it is hard to obtain the properties of the cool companion. However, limits to the spectral types based on the red part of the optical spectrum of symbiotic stars are possible (Kenyon & Fernández-Castro 1987). The latter authors, using their own data as well as the literature, pointed out that:
-
•
there is no evidence for measurable TiO absorption in stars earlier than the spectral type K4;
-
•
TiO indices increase monotonically with spectral type from K4 to M6;
-
•
VO bands, like the one at 7865Å, appear only in giants cooler than M5;
-
•
the amount of VO absorption is negligible for stars earlier than M4, but rises rapidly for M4-M7.
Taking all these limits into account, and the spectra we show in Figure 3 (on which neither the 7865Å, nor any other VO features are present), it is clear that the stars there represented have spectral types from K4 to M4. In order to avoid the tricky task of defining a common continuum, below which the TiO absorption indices could be measured (Kenyon & Fernández-Castro 1987), we refer the reader to Kirkpatrick et al. (1991), who provide an extensive spectral catalogue for late-type stars from classes K5-M9, covering the wavelengths from 6900 to 9000Å. This region encompasses TiO and VO bands –key bands to classify early and late M stars. Table 5 and Figure 5 of their paper give the features found in late-K to late-M red spectra, and provide us with a more accurate range of spectral classes for the cool stars of NGC 205 SySt–1 and SySt–3, as being K5 to M2 red giant (see Kirkpatrick’s Fig. 5a and 5b against our Figure 3). To perform this classification, our GMOS spectra had their spectral resolution smoothed to 18 Å per pixel, in order to better compare to Kirkpatrick et al. (1991) catalogue. To close this analysis, we remember that the of K and M stars ranges, roughly, from 3,700 to 5,200 K and from 2,400 to 3,700 K, respectively.
4.3 The Spectral Energy Distribution for SySt-1
Due to the extragalactic location of the stars, resolved photometric information is only available from selected telescope-instrument combinations, producing small PSFs over pixels of an appropriate scale. Neither optical nor IR counterparts had been found for SySt-2 and SySt-3, probably because they are significantly much fainter than SySt-1 (the FHβ of these two sources are 7 and 3 times lower than in SySt-1).
The Spectral Energy Distribution (SED) of SySt-1 has been constructed with available information from the optical and IR spectral ranges. In addition to our optical [O iii] image of SySt-1, presented in Section 2, the object has been unambiguously detected by HST-WFPC2 and Spitzer-IRAC. All images have been retrieved from public archives, those from the HST come from the Mikulski Archive for Space Telescopes (MAST), while those from Spitzer-IRAC have been obtained from the NASA/IPAC Infrared Science Archive (IRSA). The HST-WFPC2 images, with detections in four filters (F255W, F336W, F555W and F675W) have a 0.0996′′/pixel scale, with a PSF of typically 2 pixels FWHM. Aperture photometry was carried out by ourselves using the IRAF package APPHOT and converted into flux density. The IR images from Spitzer-IRAC provide object detections in the four IRAC (Infrared Array Camera) wavelengths (3.6, 4.5, 5.8 and 8m). The Spitzer-IRAC pixel size is 12 /pixel and the typical FWHM of the IRAC-1 PSF is 2.7 pixels. The IR photometric values for the flux density are taken directly from the Spitzer-IRAC pipeline. We have carefully checked that the lack of detection of the SySt-1 in several popular surveys as, SDSS, 2MASS, WISE is simply due to insufficient spatial resolution.
The final SED has been constructed with six points from both the HST-WFPC2 (2) and Spitzer-IRAC (4). The SED points corresponding to filters HST-F255W and F336W have been excluded. Although visually discernible, their photometric signal to noise is too low ( 2). Flux values have been corrected for Galactic extinction, which according to Schlafly & Finkbeiner (2011) amounts to AV=0.170 mag. In addition to Galactic extinction, internal dust attenuation in the SySt-1 has an extinction constant =0.45 (see Section 2.1), calculated via the Balmer Decrement. Assuming a RV=3.1 extinction law, we deduce an AV=0.955 mag, also used to correct the observed SED values for reddening.
Model fitting has been carried out with the VOSpec tool from the ESAC Virtual Observatory Project. In addition to the crude Black Body fitting, which gives Teff = 2,455 K, we have fitted cool-star NextGen Models (Hauschildt et al. 1999), which produce best fitting for Teff = 2,800 K. We must emphasize that –though the agreement of the latter effective temperatures with the M red giant classification we obtained in Section 3.2 is very good– fittings are just indicative, because the HST optical SED points are probably overestimations of the continuum, as they include intense emission lines in their passbands, [O iii]5007 in the F555W and H in the F675W.
4.4 Diagnostic Diagram: Separating SySts from PNe
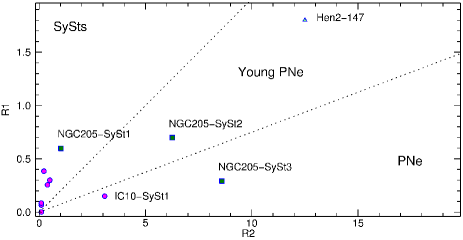
Gutierrez-Moreno et al. (1995) demonstrated that SySt can be separated from PNe in [O iii]4363/H vs. [O iii]5007/H diagram, being this separation mainly due to difference in physical conditions of the two kind of objects, especially the significantly lower density in PNe. The same is true for all the 35 recently discovered SySts in M31 (see Fig. 5 in Mikolajewska et al., 2014).
In Figure 5 we place in the Gutierrez-Moreno et al. (1995) diagram all the SySt of the LG dwarf galaxies, for which the emission-line ratios are available. Most of them are indeed located in the loci of the SySts as studied by Gutierrez-Moreno et al. (1995) in the Galaxy, and by Mikolajewska et al. (2014) in M31. From this figure it is clear that our SySt-1 is a true symbiotic system, and, at a first glance, the other two objects would be discarded as such.
However it is important to note that another symbiotic discovered in IC10, a LG dwarf irregular galaxy (Gonçalves et al. 2008), is also misplaced in this diagram. In the case of the IC10 SySt-1, alike SySt-2 and 3 of NGC 205, neither highly ionized emission-lines nor Raman scattered lines are found in the spectrum. The basis for the classification of the IC10 SySt-1 was the extreme similarity of its red spectrum with that of a well-known Galactic symbiotic, Hen 2-147 (Munari and Zwitter 2002), on which the cool companion features are clearly present. We also searched in the literature the emission-line ratios of Hen 2-147 to properly place it in the Gutierrez-Moreno et al. (1995) diagnostic diagram. Unfortunately, these ratios were not available in the literature. Thus, we used the Munari and Zwitter (2002) online spectrum of the system to roughly estimate the ratios. The result ([O iii]4363/H 1.5 and [O iii]5007/H 12-15) again moves this Galactic SySt in the loci of PNe, more exactly in the regime of young PNe. Because of their high densities, young PNe and SySts occupy the same region in this diagram, as pointed out by Gutierrez-Moreno et al. (1995) and Pereira & Miranda (2005). Therefore, what we show in Fig. 5 is that our SySt-2 as well as the known Galactic SySt Hen 2-147 occupy the young PN region of the diagram, whereas our SySt-3 and the known SySt-1 of IC10 are placed in the region of the evolved PNe. Altogether this seems to indicate that not only 2 of the (possible and likely) SySts in NGC 205, but also other known SySts are misplaced in this diagram, probably due to other effects than the density. Gutierrez-Moreno et al. (1995) also pointed out the fact that very young PNe and D-Type SySts are sometimes impossible to be separated in their diagram.
Noting that the Milky Way has similar metallicity as M31 (Mikolajewska et al. 2014), and that most of the SySts of these two spiral galaxies are placed in similar regions of the Gutierrez-Moreno et al. (1995) diagnostic diagram, we also investigate the possible metallicity effects in the diagram. We did so by placing on it the SySts of the lower-metallicity LG dwarf galaxies. Fig. 5 shows that, even at the lower metallicities of the LG dwarf galaxies, this effect is insufficient to significantly change the loci of PNe and SySts in the diagram.
Finally, it is worth mentioning the fact that, at variance with most of the SySt candidates that were identified as so via H narrow-band imaging –and then their spectra were taken to confirm the classification of the objects– in the present paper the narrow-band images were centred on the [O iii] 5007 filter. This is probably why our SySts are much brighter in [O iii] than the majority of the known SySts.
5 Summary
In this letter, we report the discovery of the first three true, likely and possible SySts of the dwarf spheroidal galaxy NGC 205. Photometric and spectroscopic data of these objects were obtained with the Gemini Multi–Object Spectrograph (GMOS), installed on the Gemini North 8.1–m telescope. Among the detection of several [O iii] line emitters in the NGC 205, three objects were identified as SySts.
The classification of these sources as SySts was done based on the identification of the Raman scattering O vi lines around 6830,7088Å and Ne vii of 4881Å (SySt-1 & SySt-2), the direct observation of the red continuum of the cool companion (SySt-1 & SySt-3), the extremely high intensity of the He II 4846Å recombination line (SySt-1, SySt-2 & SySt-3), and the presence of moderate to high-ionization forbidden lines (for instance [Fe v] and [Fe vii]), in SySt-1 and 3. If confirmed as a true symbiotic binary, SySt-2 will be the second known symbiotic star (and the first extragalactic one) that shows the Ne vii Raman scattering line at 4881Å.
The effective temperature of the hot companions were estimated 340,000 K for SySt-1 and SySt-2 and 270,000 K for SySt-3. These extremely high temperatures are consistent with the detection of high excitation emission lines in the spectra of SySt-1 and 3 (e.g O vi, [Fe vii], Ne vii). Being the faintest of the three systems here studied, SySt-2 is an exception in having [O iii] as its highest ionization forbidden line.
By examining the red continuum spectra of the cool companions, they were classified as K5 to M2 red giants. It is worth mentioning that the classification of the cool companion in SySt-1 as a M2 III is consistent with a cool–star NextGen stellar atmospheric model of Teff = 2,800 K. This kind of analysis as well as the classification of the cool companion is, unfortunately, not feasible for SySt-2.
We discuss the location of the newly discovered systems in the Gutierrez-Moreno et al. (1995) diagram, meant to separate SySts from PNe in [O iii]4363/H vs. [O iii]5007/H plane. From their location in this diagnostic diagram, only SySt-1 would be a true symbiotic system. Our SySt-2 as well as the known Galactic SySt Hen 2-147 occupy the young PN region of this diagram, whereas our SySt-3 and the known SySt-1 of IC10 are placed in the region of the evolved PNe. Altogether this seems to indicate that not only 2 of the (possible and likely) SySts in NGC 205 but also other known SySts are misplaced in this diagram, probably because of the interplay of other effects than the physical conditions of the two kinds of nebulae. Gutierrez-Moreno et al. (1995) also pointed out the fact that very young PNe and D-Type SySts are sometimes impossible to be separated in their diagram. We finally note that though the different metallicities of the spirals (Milky Way and M31) versus the dwarf galaxies of the LG might play a role in the diagram, the use of available data indicates that this effect does not appear to be strong enough to significantly change the location of SySts and PNe in the Gutierrez-Moreno et al. (1995) diagram.
6 Acknowledgments
Authors are very grateful to Joanna Mikolajewska, the referee, for her criticisms to the manuscript that allow us to correct mistakes of the first version and add the important discussios to the paper. We also thanks Claudio P. Bastos and Roberto Costa for their critical reading of the manuscript and a number of fruitful discussions. DRG kindly acknowledges the Instituto de Astrofísica de Canarias (IAC), for their hospitality, where part of this work was done. LM acknowledges financial support from PRIN MIUR 2010-2011, project “The Chemical and Dynamical Evolution of the Milky Way and Local Group Galaxies”, prot. 2010LY5N2T. SA is supported by CAPES post-doctoral scholarship under the program “Youth Talents”, A035/2013. This work was partially supported by FAPERJ’s grant E-26/111.817/2012 and CAPES’s grant A035/2013.
References
- Allen (1980) Allen D. A., 1980, ApL, 20, 131
- Belczyński et al. (2000) Belczyński K., Mikolajewska J., Munari U., Ivison R. J., & FriedjungX M., 2000, A&AS, 146, 407
- Ciardullo et al. (1989) Ciardullo R., Jacoby G. H., Ford H., & Neill J.D., 1989, ApJ, 339, 53
- Corradi et al. (2005) Corradi R. L. M., et al., 2005, A&A, 431, 555
- Corradi & Magrini (2006) Corradi R. L. M., & Magrini L., 2006, in “Planetary nebulae beyond the Milky Way”, Proceedings of the ESO workshop, Springer, 2006, p.36
- Ford, Jacoby & Jenner (1973) Ford H. C., Jenner D. C., & Epps, Harland W., 1973, ApJ, 183, L73
- Gonçalves et al. (2008) Gonçalves D. R., Magrini L., Munari U., Corradi R. L. M., & Costa R. D. D., 2008, MNRAS, 391, L84
- Gonçalves et al. (2012) Gonçalves D. R., Magrini L., Martins L. P., Teodorescu A. M., Quireza C., 2012, MNRAS, 419, 854
- Gonçalves et al. (2014) Gonçalves D. R., Magrini L., Teodorescu A. M., & Carneiro C. M., 2014, MNRAS, 444, 1705
- Gutierrez-Moreno et al. (1995) Gutierrez-Moreno A., Moreno H., & Corte G., 1995, PASP, 107, 462
- Gutierrez-Moreno & Moreno (1996) Gutierrez-Moreno A., & Moreno H., 1996, PASP, 108, 972
- Hauschildt et al. (1999) Hauschildt P. H., Allard F., Baron E., & Schweitzer A., 1999, ApJ, 312, 377
- Kaler & Jacoby (1989) Kaler J. B., Jacoby G. H., 1989, ApJ, 345, 871
- Kenyon & Fernandez-Castro (1987) Kenyon S. J., & Fernandez-Castro T., 1987, AJ, 93, 938
- Kirkpatrick et al. (1991) Kirkpatrick J. D., Henry T. J., & McCarthy D. W. Jr., 1991, ApJSS, 77, 419
- Kniazev et al. (2009) Kniazev A. Y., et al., 2009, MNRAS, 395, 1121
- Lee et al. (2014) Lee H-W, Heo J-E, & Lee B-C, 2014, MNRAS, 442, 1956
- Leedjärv et al. (2004) Leedjärv L., Burmeister M., Mikoĺajewski M., Puss A., Annuk K., Gaĺan C., 2004, A&A, 415, 273
- Magrini et al. (2003) Magrini L., Corradi R. L. M., & Munari U., 2003, ASPC, 303, 539
- Mikolajewska et al. (2014) Mikolajewska J, Caldwell N., & Shara M. M., 2014, MNRAS, 444, 586
- Morgan (1992) Morgan D. H., 1992, MNRAS, 258, 639
- Magrini, Corradi, & Munari (2003) Magrini L., Corradi R. L. M., Munari U., 2003, ASPC, 303, 539
- Massey et al. (1988) Massey P., Strobel K., Barnes J. V., Anderson E., 1988, ApJ, 328, 315
- Massey & Gronwal (1990) Massey P., Gronwall C., 1990, ApJ, 358, 344
- Mathis (1990) Mathis J. S., 1990, ARA&A, 28, 37
- McConnachie (2012) McConnachie A. W., 2012, AJ, 144, 4
- Merrett et al. (2006) Merrett H. R., et al., 2006, MNRAS, 369, 120
- Mikolajewska et al. (1997) Mikolajewska J., Acker A., & Stenholm B., 1997, A&A, 327, 191
- Mikolajewska et al. (2014) Mikolajewska J., Caldwell N., & Shara M. M., 2014, MNRAS, 444, 586
- Munari & Zwitter (2002) Munari U., & Zwitter T., 2002, A&A, 383, 188
- Osterbrock & Ferland (2006) Osterbrock D. E. & Ferland G. J., in Astrophysics of gaseous nebulae and active galactic nuclei, 2nd. ed. Sausalito, CA: University Science Books, 2006
- Pereira & Miranda (2005) Pereira C. B., & Miranda L. F., 2005, A&A, 433, 579
- Richer & McCall (1995) Richer M. G., McCall M. L., 1995, ApJ, 445, 642
- Richer & McCall (2008) Richer M. G., McCall M. L., 2008, ApJ, 684,1190
- Schlafly & Finkbeiner (2011) Schlafly E. F., & Finkbeiner D. P., 2011, ApJ, 737, 103
- Schmid (1989) Schmid H. M., 1989, A&A, 211, L31
- Schmid et al. (1999) Schmid H. M., et al., 1999, A&A, 348, 950
- Tomova & Tomov (1999) Tomova M. T., Tomov N. A., 1999, A&A, 347, 151