Solar Radio Bursts with Spectral Fine Structures in Preflares
Abstract
A good observation of preflare activities is important for us to understand the origin and triggering mechanism of solar flares, and to predict the occurrence of solar flares. This work presents the characteristics of microwave spectral fine structures as preflare activities of four solar flares observed by Ondřejov radio spectrograph in the frequency range of 0.8–2.0 GHz. We found that these microwave bursts which occurred 1–4 minutes before the onset of flares have spectral fine structures with relatively weak intensities and very short timescales. They include microwave quasi-periodic pulsations (QPP) with very short period of 0.1-0.3 s and dot bursts with millisecond timescales and narrow frequency bandwidths. Accompanying these microwave bursts, there are filament motions, plasma ejection or loop brightening on the EUV imaging observations and non-thermal hard X-ray emission enhancements observed by RHESSI. These facts may reveal certain independent non-thermal energy releasing processes and particle acceleration before the onset of solar flares. They may be conducive to understand the nature of solar flares and predict their occurrence.
1 Introduction
As early as 1959, Bumba & Křivský found a small flare (or luminosity increase) preceding a main solar flare and introduced a term preflare to address the weak effects on the solar atmosphere produced by them. Early studies have been reviewed by Martin (1980) and Gaizauskas (1989). Thanks to the development of recent advanced observing technique for obtaining high spatial and temporal resolution data, preflare activities are frequently identified. The common preflare activities include formation of sigmoid in soft X-ray (Liu et al. 2010), filament activities, such as rise, oscillation, and eruption (Chifor et. al. 2006; Isobe, & Tripathi 2006; Vemareddy et. al. 2012), and transient brightening in multi-wavelengths (H (Contarino et al. 2003), UV and EUV (Cheng et al. 1985), 1600 Å continuum emission (Warren & Warshall 2001), soft X-ray (Fárník et al. 1998), hard X-ray (Harrison et al. 1985; Tappin 1991; Asai et al. 2005; Chifor et al. 2007)). These multi-wavelengths studies settle with the questions concerning the geometry of the magnetic field, the changing physical properties of the plasma trapped in those fields, particle accelerations, and the relationship between the preflare and the main activities.
It is imperative to improve our knowledge of magnetic field and plasma conditions in current sheets at preflare phase for resolving the flare problems. Such studies can be guided by radio observations, which often carry details of the dynamical plasma processes not visible at other wavelengths. Especially in the microwave frequency range, it is always regarded as direct signal of flaring primary energy-releasing and particle accelerations. Preflare activities in microwave are discovered long ago to consist of changes in intensity and/or polarization of the microwaves emitted from an active region some tens of minutes before the onset of a flare (Kundu, 1965; Lang, 1980; Hurford & Zirin, 1982; Kai, Nakajima, and Kosugi, 1983; Xie et al., 1994). Recently, many fine structures of narrow bandwidth and short duration which are usually superimposed on smooth background continuum emission were recorded frequently for the development of broadband radio spectrometers with high temporal and frequency resolution (Fu et al. 2004a; Fu et al. 2004b; Huang et al. 2008; Huang & Tan 2012; Tan 2013). They are important signatures for understanding energy release and particle acceleration in solar flares. Most detailed analyses of microwave fine structures reported in the literature focus mainly on the impulsive or decay phase of the flare, with little attention paid to the preflare phase. Successful observations for doing study on preflare phase require a high sensitivity and signal to noise ratio of data, and simultaneous image observations to determine the host region.
The microwave emissions (especially at centimeter and decimeter wavelengths) originate in the lower corona and the chromosphere, which provide an independent means of exploring the solar atmosphere. A good observational understanding of preflare activities, based on high-sensitivity spectrograms with broadband in microwave, and high spatial and temporal resolution filtergrams in multi-wavelengths will certainly help us to understand the nature of solar flares. After a recent advanced upgrading, the Ondřejov radio spectrographs (ORSC) have the capability to observe solar microwave emission with high frequency resolution, high temporal resolution, and high sensitivity. Additionally, with the launch of Solar Dynamics Observatory (SDO), full disk filtergrams of the Sun from chromosphere to the corona up to 0.5 above the solar limb with 0.6 arcsecond spatial resolution and 12 seconds temporal resolution can be obtained daily at EUV wavelengths by the Atmospheric Imaging Assembly (AIA, Lemen et al. 2012). Preflare activities which recorded by ORSC and AIA simultaneously will provide a unique opportunity to reveal some key processes of flares, such as the causality consequence, the actual trigger mechanism and the primary energy release region. Moreover, despite the differences in size, energy and morphology, solar eruptions in the solar atmosphere, such as flare, filament eruption and coronal mass ejection (CME), may be different aspects of a common physical process involving plasma ejection and magnetic reconnection (e.g. Shibata, 1999; Priest & Forbes 2002). So the preflare activities are important not only for the initiation of flares, but also for all accompanying eruptive phenomena. Studying the distinct preflare phenomena could shed new light on one of the most important puzzle of space weather which is understanding why flares, filaments and CMEs erupt.
Both from a theoretical point of view (for understanding the flare phenomenon) and a practical point of view (for forecasting where and when a flare will occur), it is essential to make a closer study of preflare conditions in active regions. In this work, we report the observations of preflare activities in the form of microwave fine structure of four solar flares. Here, preflare activity is defined as a transient event preceding the GOES flare at the site of the flare region for which direct physical associations with flare are implied. The observations and sample will present in Section 2. The main results will be addressed in Section 3. Conclusions and discussions will be listed in Section 4.
2 Observations and Sample
2.1 Observations
In this work, the preflare microwave fine structures were recorded by ORSC, which are broadband spectrometers located at Ondřejov, the Czech Republic (Jiřička et al. 1993). ORSC includes two dedicated spectrographs, e.g RT4 and RT5. The frequency range of RT4 and RT5 is from 2.0 to 5.0 GHz and 0.8 to 2.0 GHz, respectively. After an advanced upgrading in 2006, ORSC has high spectral and temporal resolution, and high sensitivity in broadband microwave frequency range. The spectral resolution is 5 MHz and the temporal resolution is 10 ms. The quick look images can be obtained from website (http://www.asu.cas.cz/radio/info.htm).
In order to get a comprehensive understanding to the preflares, we also use other multi-wavelength observations from several instruments, including:
(1) Phoenix-4 at Bleien Observatory
Since all preflare activities in our sample occurred at the low frequency side of RT5, we adopt the radio observations in the low frequency range of 200-800 MHz recorded by a seven meters dish with a crossed logarithmic periodic antenna (Phoenix-4) at Bleien observatory (east) to get the full information of the spectral properties of radio bursts in preflares. Its frequency resolution is several MHz and temporal resolution is 250 ms. The temporal resolution of Phoenix-4 is much longer than that of microwave fine structures. So here, we just use it to show the profile of the fully radio burst and as a complementary observation to determine the low frequency limit of some bursts.
(2) the Atmospheric Imaging Assembly on Solar Dynamics Observatory (AIA/SDO)
AIA/SDO provides multiple simultaneous high resolution full-disk images of the corona and transition region up to 0.5 R⊙ above the solar limb with 1.5 arcsecond spatial resolution and 12 seconds temporal resolution (Lemen et al. 2011). Seven narrow EUV bandpasses centered on specific lines: Fe XVIII (94 Å), Fe VIII, XXI (131 Å), Fe IX (171 Å), Fe XII, XIIV (193 Å), Fe XIV (211 Å), He II (304 Å), and Fe XVI (335 Å) have been employed. The temperature diagnostics of the EUV emissions cover the range from K to K (Lemen et al. 2011). It provides the topological evolution information in the related source regions associated to the preflare activities. We choose four wavelengths of 1600 Å, 304 Å, 171 Å and 193 Å, which contain the emission from the solar photosphere, chromosphere, corona and hot flare plasma.
(3) Nancay Radioheliograph (NRH)
NRH is operated by the Observatoire de Paris at 10 frequencies between 150 and 450 MHz. It consists of 44 antennas of size ranging from 2-10m, spread over two arms (EW and NS) with respective lengths of 3200 m and 2440 m. The resolution of the 2 dimensional (2D) images depends on the frequency and the season. Roughly speaking, the resolution is approximately 5.5 - 3.2 (164 MHz) and 2.2- 1.25 (432 MHz). NRH observations will help to determine the source region of the radio emission.
(4) The Reuven Ramaty High Energy Solar Spectroscopic Imager (RHESSI)
RHESSI is a NASA Small Explorer Mission, launched on February 5, 2002. It images solar flares from soft X rays (3 keV) to gamma rays (up to 17 MeV) and provides high resolution spectroscopy up to gamma-ray energies of 17 MeV. Furthermore, it has the capability to perform spatially resolved spectroscopy with high spectral resolution. From RHESSI observation, we may get information about the non-thermal processes associated to the preflares. (Lin et al. 2002).
(5) Soft X-ray (SXR) telescope on Geostationary Operational Environmental Satellites (GOES)
SXR/GOES provides continuous monitoring of full-disk solar SXR intensity at 0.5-4 Å and 1-8 Å channel with a minimum cadence of 2 s. It is the most important indicator to show the whole processes of solar flares.
2.2 Sample
The sample of radio bursts which we studied in this work is during the time period from 2010 April (after the launch of SDO) to 2013 June. During this time period, 2996 flares (including C, M, and X class flares) were recorded by GOES and 240 radio bursts were recorded by ORSC. Out of the 240 radio bursts, 156 radio bursts were associated with GOES flares. Out of the 156 flares associated radio bursts, 18 radio bursts started prior to the associated GOES flares. In order to determine the spatial correlation between radio bursts and flares without corresponding image observations, we delete events which occurred on the solar surface with numerous active regions at first. Then, 14 events remained. For the 14 events, the following steps were used to confirm the spatial correlation between radio bursts and the corresponding flare events: (1) Radio images of Nancay Radioheliograph (NRH) were used if preflare radio bursts occurred at NRH observational frequencies. Even though the spatial resolution of NRH is about several arcminutes, it is enough to determine whether radio burst has the same host region with the flare or not; (2) the flare host region is an isolated active region on the solar disk and there are no other activities which can be identified from SDO observations at wavelengths of 304 Å and 193 Å. Finally, four flares remained. We show the event list in Table 1. Out of the four events, three events (C3.2 flare event on 2010 August 14, C5.5 flare event on 2011 December 25, and M1.9 flare on 2012 May 07) can be confirmed by both criteria. And the C4.4 flare on 2010 August 01 is confirmed by SDO data.
| GOES | Flare | Radio | burst | HXR | |||||||||||
|---|---|---|---|---|---|---|---|---|---|---|---|---|---|---|---|
| Date | Position | class | start | peak | End | Type | start | t | fhigh | flow | P | 12–25 | EUV | ||
| (UT) | (UT) | (UT) | (UT) | (s) | (GHz) | (GHz) | (s) | (KeV) | |||||||
| 2010-08-01 | N20E36 | C3.2 | 07:56 | 08:26 | 09:46 | dot | 07:53:50 | 0.9 | 0.8 | I | LB | ||||
| 2010-08-14 | N17W52 | C4.4 | 09:41 | 09:59 | 11:10 | dot | 09:37:12 | 40 | 0.9 | 0.5 | I | FE,LB | |||
| dot | 09:40:00 | 2.0 | 0.35 | I | |||||||||||
| 2011-12-25 | S32W16 | C5.5 | 08:49 | 08:55 | 09:01 | QPP | 08:47:16 | 3.5 | 1.35 | 1.035 | 0.2 | I | FE,LB | ||
| QPP | 08:47:20 | 2.3 | 1.00 | 0.6 | 0.2 | I | |||||||||
| QPP | 08:47:26 | 0.5 | 1.00 | 0.6 | 0.1 | I | |||||||||
| QPP | 08:47:32 | 1.2 | 1.00 | 0.8 | 0.1 | I | |||||||||
| QPP | 08:47:36 | 1.4 | 1.10 | 0.8 | 0.3 | I | |||||||||
| QPP | 08:47:39 | 0.5 | 1.00 | 0.72 | 0.1 | I | |||||||||
| QPP | 08:48:35 | 1.05 | 0.8 | 0.3 | I | ||||||||||
| 2012-05-07 | S19W46 | M1.9 | 14:03 | 14:31 | 14:52 | dot | 14:02:09 | 10.4 | 1.45 | 0.55 | FE,LB | ||||
| dot | 14:02:24 | 18.4 | 1.45 | 0.55 |
Note. — t: duration of the burst group; : no RHESSI data; I: RHESSI flux (12–25 keV energy band) increases associated with the preflare radio bursts; FE: filament eruption; LB: loop brightening
3 Analysis Results
3.1 The Properties of the Preflare in a C5.5 Event on 2011 December 25
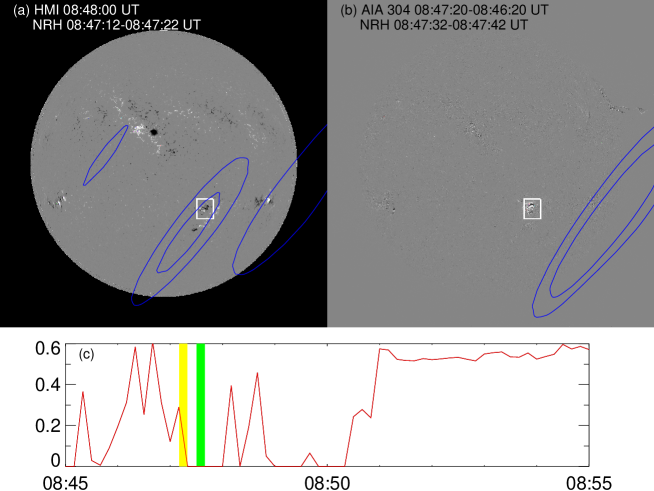
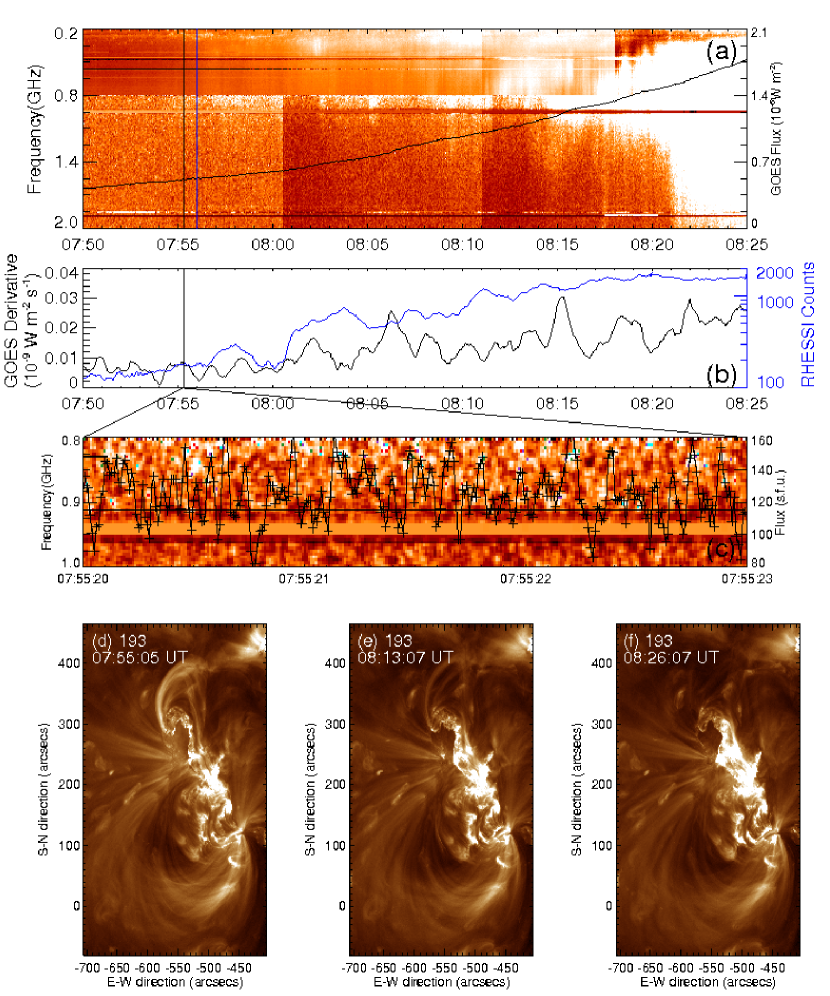
On 2011 December 25, a C5.5 flare occurred in a newly emerging active region NOAA 11387 (S32W16). According to the GOES record, the flare started at 08:49 UT, peaked at 08:55 UT and ended at 09:01 UT. It is an impulsive flare with the impulsive phase lasting for about 6 minutes. According to ORSC record, the main radio burst which associated with the GOES flare appears around 08:48:35 UT. Meanwhile, there are some impulsive radio bursts with relatively weak intensity and very short duration occurred prior to the main radio burst. Fig. 1a is the line of sight magnetic field observed by HMI, with the flare host region outlined by white square. It shows that the active regions on solar surface at that time are few and far apart. Fig. 1b is a running difference image of 304 Å observed by AIA at 08:47:20 UT. Its base image is taken at 08:46:40 UT. It shows that the initial brighting, which occurred in the flare host region and temporal correlated with the microwave burst, is the unique activity on the solar surface at that time. This event was observed by NRH at several frequencies. Blue contours in Fig. 1a and b show the source regions of the microwave observed by NRH at 228 MHz. They are set at 50% and 80% of the maximum brightness. The NRH contours shown in Fig. 1 were integrated during the time period from 08:47:12 to 08:47:22 UT (Fig. 1a) and from 08:47:32 to 08:47:42 UT (Fig. 1b). These time period were also outlined by yellow shadow and green shadow in Fig. 1c, respectively. Contours in Fig. 1b show a unique source region which is persistent and slowly varying during NRH observations. And even during the flaring phase, this source region can be identified from time to time. Contours in Fig. 1a show two additional transient source regions. The one located on the south side is co-spatial with flare host region. The time profile of the flare host region recorded by NRH at 228 MHz was shown in Fig. 1c. In plotting this time profile, only pixels whose flux is greater than 50% of the maximum are counted. This time profile shows that the emission from the source region changes very rapidly during the preflare phase and then maintains at a high level during the flare. It is known that active regions can emit radio signals without a flare at 228 MHz, possibly through the thermal bremsstrahlung mechanism, but it varies very slowly. So we suggest that the rapidly varying emission which emit from the flare source region is related with the preflare activities.
3.1.1 Microwave Spectral Structures in the Preflare
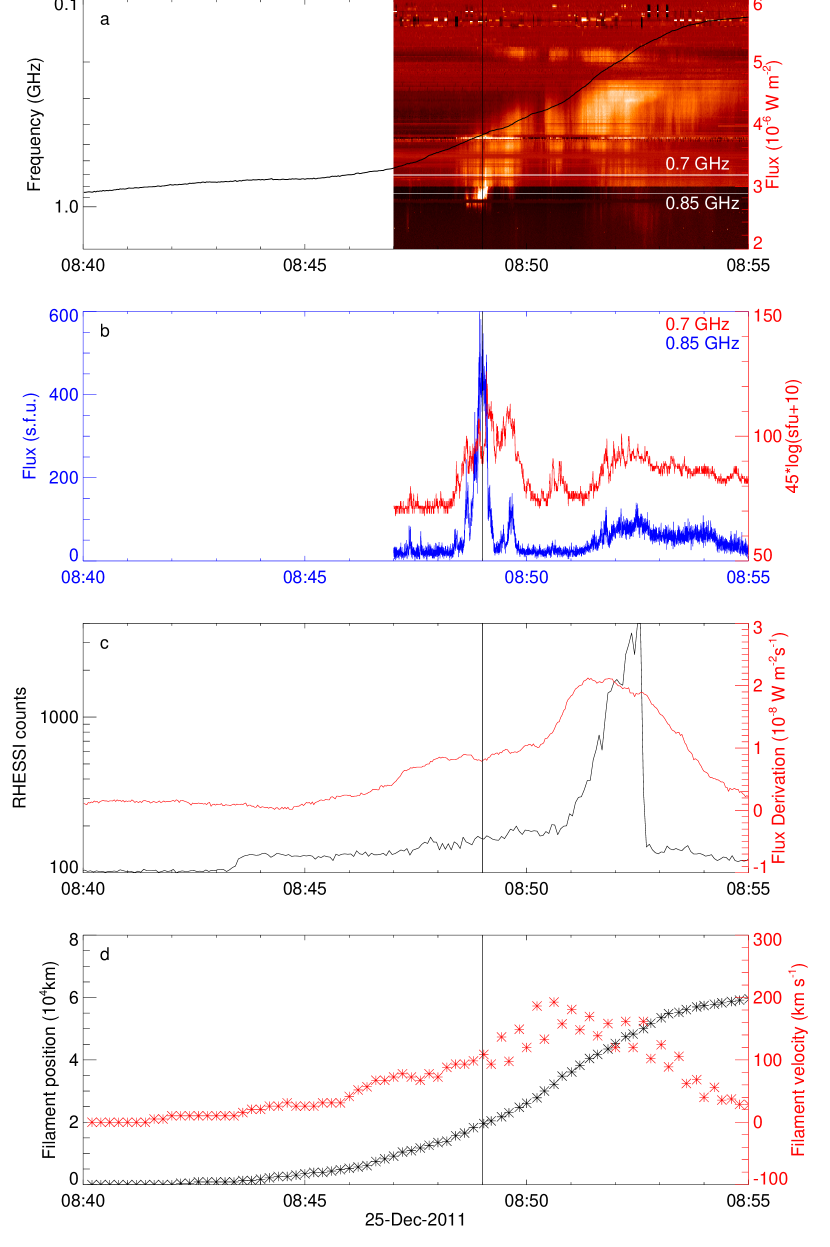
Fig. 2a shows the dynamic microwave spectrum during the preflare and impulsive phase in the frequency range from 0.2 to 1.4 GHz. The black vertical line indicates the starting time of the flare. The microwave spectrum shows that several independent radio bursts appear about 2 minutes before the GOES flare, eg. around 08:47 UT. They have relatively weak intensity with very short durations (several second). And around 08:48 UT, less than 1 minute before the flare, the main radio burst begins to appear. The main burst is a slow drifting structure, with long duration (more than six minutes) and strong intensity. The spectrum shows that the preflare microwave bursts are in the form of individual bursts. Meanwhile the early phase of the main burst starts prior to the flare and lasts during the whole impulsive phase.
The temporal profile of the radio bursts at 0.85 GHz recorded by ORSC and at 0.7 GHz recorded by Phoenix-4 are shown in Fig. 2b. The former profile shows abundant of substructures while the latter not. Moreover, the flux of the preflare is only about 7% of the maximum intensity of the main burst.
The detailed dynamic spectrum of the independent radio bursts recorded by ORSC during the period from 08:47:16 to 08:47:39 UT are expanded in Fig. 3a. From the spectrum, six groups of drifting structures are identified. The frequency bandwidth of the bursts were calculated by following steps. Firstly, we integrated the radio burst through its duration. The background flux is defined as the sum of the mean value of the quiet sun and 3 times of its standard deviation () at the corresponding frequency. Then the start and end frequency is defined as the frequency at which the flux is greater than the background flux. Meanwhile, the duration is defined as the time interval that the radio flux greater than the background flux. The middle panel shows the first group burst with fully temporal resolution. The radio flux at 1.2 GHz were overlapped on it. The transverse line indicates the background flux at that frequency. Stars represent the start and the end of the burst. It shows that the first burst group occurred around 08:47:16 UT, with duration of about 3.5 s and the frequency range from 1.035 GHz to 1.35 GHz. The properties of other burst groups are listed in Table 1.
Meanwhile, Fig. 3b shows that the radio burst is composed of many drifting pulsations. These pulsations scatter over the image along the temporal axis with different time interval at the early stage and then overlap each other. Careful examination of the first few pulses revealed that they first occur at low frequency and then shift to the high frequency rapidly. The magnitude of the frequency drifting rate is about -10 GHz s-1. For a single pulse, the duration is about several tens of milliseconds and the bandwidth is about 0.3 GHz. To study the periodic property of the pulsating structure, we adopt wavelet analysis on the observational data. The wavelet power spectrum shown in Fig. 3c was computed from time series at frequency of 1.15 GHz. The solid black contour is the 95% confidence level for the red noise. Areas outside the contour are regions of the wavelet spectrum where edge effects become important, the so called cone of influence. The wavelet power spectra shows that there is a strong periodic component at 0.2 s. This periodicity is relatively stable. There is another periodic component within 95% confidence level which occurs at 0.4 s. After two seconds later, these two periodic components shift slightly from a period near 0.4 s to a period closer to 0.7 s, and from a period near 0.4 s to a period closer to 0.3 s, respectively. The wavelet power spectra confirms that the pulsating structures are quasi-periodic pulsations (QPP). There is no obvious global frequency drifting when we considered the burst as a whole pulsation structure.
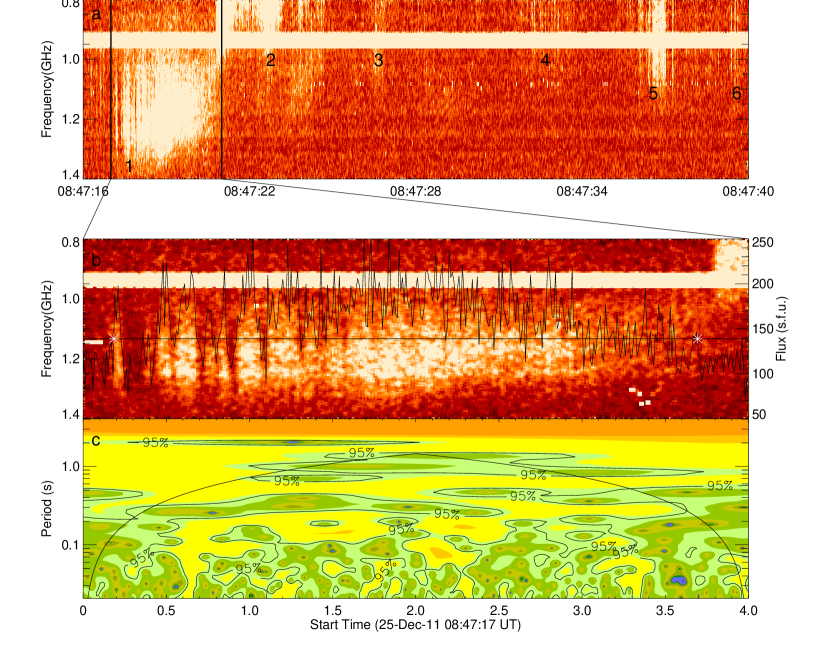
Table 1 shows the main properties of the six QPPs occurred in the preflare. In this table, we do not give the duration time of radio burst which occurred prior to the flare and lasted during the impulsive phase. From Table 1, we find that all the preflare QPPs are occurred in the frequency range from 0.6 to 1.3 GHz, the durations are in the time period from 0.5 to 3.5 s. Their periods are in the range of 0.1 – 0.3 s, which belong to very short period pulsation (Tan et al. 2010).
3.1.2 The Properties of the Source Region in the Preflare
In order to get the information of the source region in the preflare, here we adopt the multi-wavelength observations. Fig. 4 shows the dynamic evolution of the preflare activities in the UV and EUV imaging observations recorded by AIA/SDO. Magnetic field obtained by Helioseismic and Magnetic Imager on SDO (HMI/SDO) was overlaid on 1600 Å and 171 Å images around 08:44 UT, with blue for negative polarities and red for positive polarities. The most distinctive feature of the host region is that there is an S-shaped filament (positive magnetic helicity) crossing over the neutral line, with the ends near (260, -340) and (310, -330) in the solar disk coordinate system. The presence of an S-shape filament is regarded as the evidence for current-carrying twisted or sheared magnetic fields which possess magnetic helicity. Active regions with this kind of morphology are more likely to erupt than others (Canfield, et al., 1999).
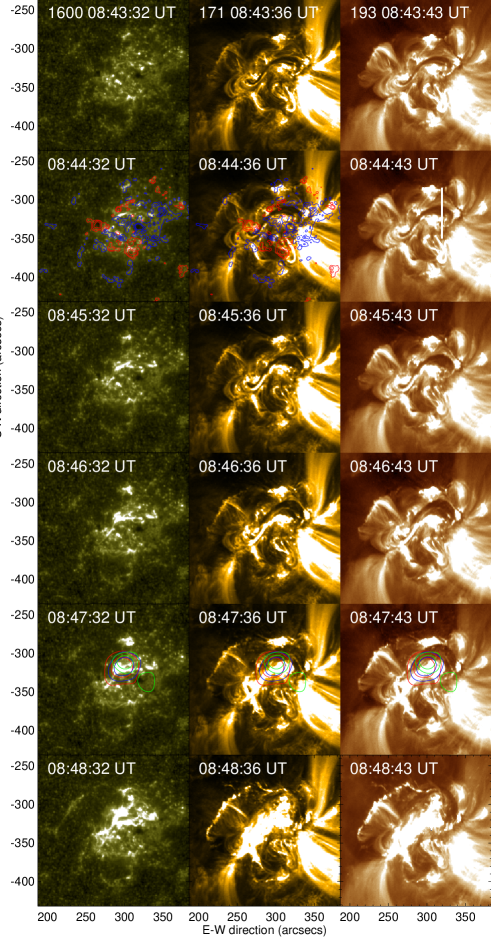
The beginning of the eruption is marked by a very gradual but noticeable rise of the right part of the S-shape filament as early as 08:42 UT. The displacement of the filament was traced along a slice as indicated by a white vertical line in 193 Å image at 08:44:43 UT. A time-distance diagram of the filament along the slice was shown in Fig. 2c. It shows that the slow-rising of the filament can be best observed between 08:42 - 08:47 UT with a steady upward motion of the filament. Its speed is around 20 km s-1. The initial intensity enhancements of the flare can be found easily from 1600 Å image, which is situated under the middle of the filament around 08:44:43 UT. The EUV brightening propagated in the direction along the polarity inverse line from the initial brightening area, and extended away from the polarity inverse line. The development of two flare ribbons can be seen clearly in 1600 Å images. Brightenings extended in 171 Å and 193 Å images associated with the two ribbons are the dynamic evolution loops in low atmosphere which locate under the filament. Associated with the flaring process, the microwave bursts occurred around 08:47 UT. The filament speed was found to increase around the same time, and to reach a maximum of 200 km s-1 around 08:51 UT.
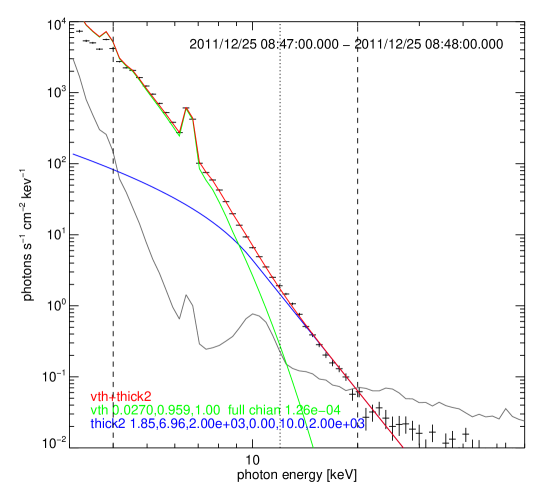
We analysed the X-ray spectrum of the preflare brightening observed with RHESSI by means of imaging spectroscopy with the Object Spectral Executive (OSPEX) (Dere et al. 1997; Landi et al. 2006). Fig. 5 shows the spectrum of thermal and non-thermal X-ray emission associated with the individual bursts during the period from 08:47 to 08:48 UT. Thermal (low energy) portion is fitted with the variable thermal component while the non-thermal (high energy) portion is fitted with a single power law. Fig. 5 shows that at energies above 9 Kev, the non-thermal contribution dominates over the thermal component. The temporal profile of non-thermal emission which recorded by RHESSI at 12–25 KeV energy band, is shown in Fig. 1c. Meanwhile, the red curve shows the time derivative of the GOES 1–8 Å flux. Both curves show obviously increase right after the first group of microwave burst. The RHESSI flux increase in the preflare phase is small, so the integration time of the flux curve which is shown in Fig. 2d is 4 seconds. It is too long to find a counterpart of the QPP in RHESSI observation. However, the microwave QPPs, which occurred just before the maximum of an X6.9 class flare, accompanying hard X-ray QPPs were studied by Tan & Tan (2012).
The X-ray brightening, between 08:47 – 08:48 UT, observed at energy of 3 – 6 keV (red), 6 – 12 keV (blue), and 12 – 25 keV (green) are overlaid on 304 Å , 171 Å and 193 Å image around 08:47 UT. Contour levels are set at 60% and 80% of the maximum brightness of each energy band. It reveals the presence of single source in 3 – 6 keV and 6 – 12 keV. Single source at difference energy band was found location on the polarity inversion line and spatially coincident with the initial brightening. The HXR emission in the energy band of 12 – 25 keV has two sources. One is spatially consistent with the low energy sources, which covers the initial brightening at the preflare phase and locates on the top of the two ribbons. The figure indicates that the maximum of X-rays sources at softer energies (3 – 6 keV and 6 – 12 keV) and harder energy (12 – 25 keV) are at the top of loops (that may be formed below rising filament). The other source at 12–25 KeV energy band encircle the foot of other loops. While no intensity enhancement at EUV wavelengths (1600 Å, 171 Å, and 193 Å) was identified spatial corrected with this source. These X-ray sources remained at the same place through the whole flaring process.
Briefly, in the preflare phase of the C5.5 event on 2011 December 25, microwave QPPs with period of subsecond appeared in the frequency range of 0.6 GHz - 1.35 GHz. Accompanying these microwave QPPs, nonthermal hard X ray emission and the motion of a sigmoid filament is observed by multiple wavelength imaging observations.
3.2 The Properties of Preflares in Other Three Events
Here, we present other three flare events which are also discerned to have microwave spectral fine structures in their preflare phases.
3.2.1 C3.2 Event on 2010 August 01
The C3.2 flare on 2010 August 01 occurred on the heliographic location 20N 36E. The flare started at 07:56 UT, peaked at 08:26 UT and ended at 09:46 UT. It is a long duration flare with the impulsive phase lasting for 30 minutes. The Fig. 6a shows the dynamic microwave spectrum during its preflare and impulsive phase in the frequency range from 0.2 GHz to 2.0 GHz. Since the microwave flux varies greatly during the flare period and the sensitivity of two instruments is different, the spectrum is shown in different contrast to show the fine structures of the microwave bursts in difference phase. The overlapped black curve is GOES flux profile at 1–8 Å. It shows that GOES flux increases very slowly. The blue vertical line indicates the start of the GOES flare. The spectrum shows that radio burst appeared around 07:53:30 UT at frequency of about 0.3 GHz observed by Phoenix-4 and 0.8 GHz observed by ORSC. The radio bursts in Phoenix-4 is a narrow band burst, which extends to the main burst. While the radio burst in ORSC first appears at the low frequency side and is confined in a narrow frequency band for several minutes. Its counterpart in the lower frequency can not be identified in Phoenix-4, because the different sensitivity between the two instruments. Associated with the development of the flare, the intensity of the radio burst increases and the frequency band extends.
The simultaneous hard X-ray flux recorded by RHESSI at 12–25 KeV energy band was shown in Fig. 6 b with blue curve. It shows that the hard X-ray flux begins to increase from 07:55 UT. The black curve shows the time derivative of the GOES 1–8 Å flux.
The fully temporal resolution dynamic spectrum during the time period from 07:55:20 to 07:55:23 is shown in Fig. 6 c. The vertical black line in Fig. 6 a and b indicates the time point which is shown in Fig. 6 c. Radio flux at 0.83 GHz is overlapped on the spectrum and the horizontal line shows the background flux. From the spectrum, it is easy to find that the microwave spectral fine structures in the form of dots scattering in the frequency range of 0.8–0.9 GHz. The dot bursts appear as a group of individual bursts with short duration and narrow frequency bandwidth. The figure shows that for the single dot burst, the time period is about several tens milliseconds and the frequency range is several tenth MHz. Associated with the development of the flare, these dots occurred more frequently and brightness, and extended from low frequency side to high frequency side. Fig. 6 d–f show the initial brightening at EUV wavelengths in preflare phase and the bright flare loops in the impulsive phase of the flare observed by AIA/SDO.
3.2.2 C4.4 Event on 2010 August 14
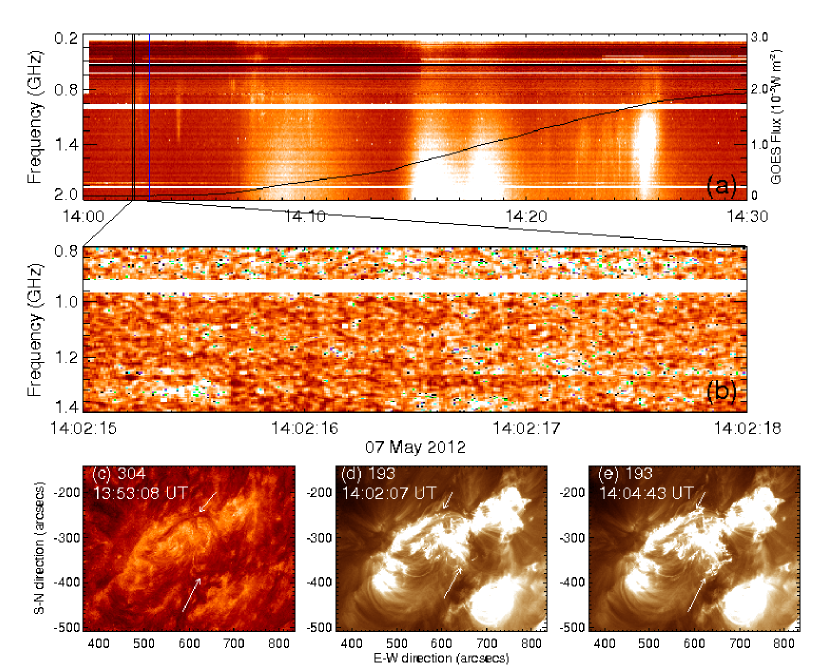
The C4.4 flare event on 2010 August 14 appeared near the western limb of solar disk(N17W52) and was associated with a filament eruption. It is a long duration flare with impulsive phase as long as 18 minutes. The erupted filament locates along the boundary of two active regions as a sigmoid shape observed by EUV images in AIA/SDO. The beginning of the activity can be marked as the slowly rising of the filament, which occurred about forty minutes before the GOES flare. Fig. 7a shows the dynamic microwave spectrum during the preflare and impulsive phase in the frequency range from 0.2 GHz to 2.0 GHz. Black line marks a weak, short time duration radio burst, which occurred about 4 minutes before the flare. The GOES flux in 1–8 Å energy band was shown by the black curve. Blue line indicates the beginning of the flare. Fig. 7b shows the time derivative of GOES flux in 1–8 Å (black curve) and RHESSI flux at 12–25 KeV energy band (blue curve). Both curves show the slow increase of the flux in the preflare phase. The microwave fine structure in the preflare phase was shown in Fig. 7c. Radio flux at 0.87 GHz is overlapped on the spectrum and the horizontal line shows the background flux. It shows a group of dot bursts near frequency of 0.8 GHz. The frequency bandwidth for each single dot is about several tenth MHz, and the duration is about several tens of millisecond. Fig. 7d shows the morphology of the filament at its initial activities. And Fig. 7e shows the filament eruption during the preflare microwave bursts.
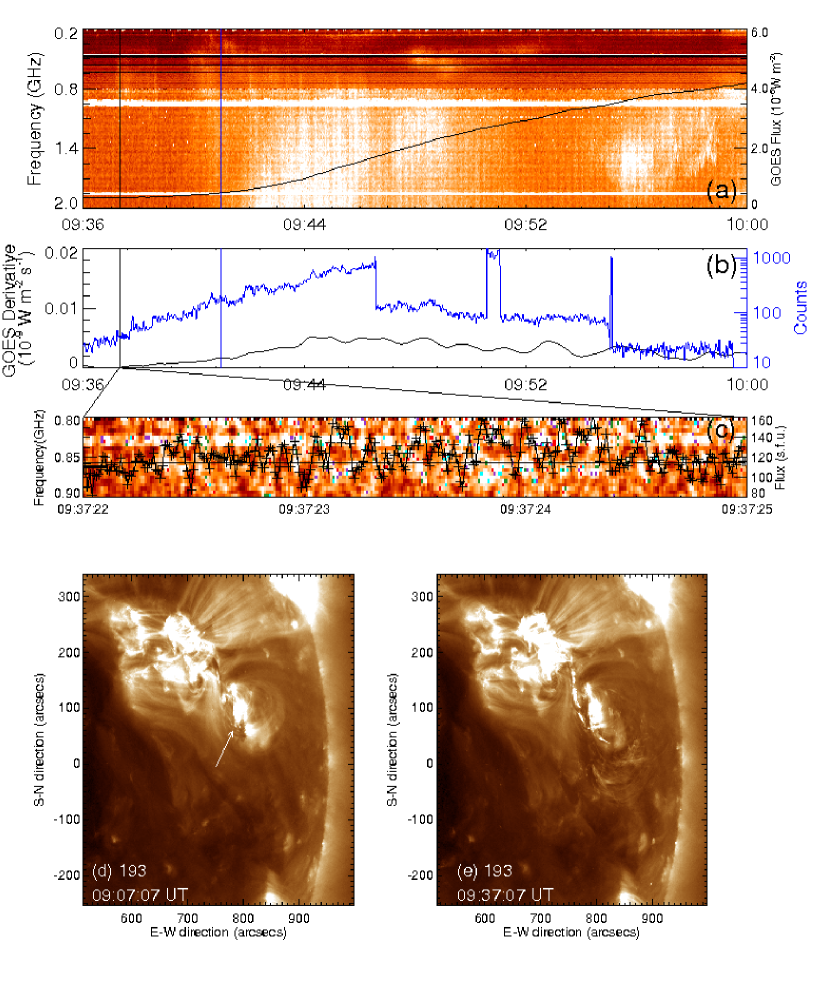
3.2.3 M1.9 Event on 2012 May 07
The M1.9 flare event on 2012 May 7 is also a long duration event with the impulsive phase of 28 minutes. Fig. 8a shows the dynamic microwave spectrum of the flare from the very beginning to its peak. It shows that some weak and independent radio bursts occurred just one minute before the flare in the frequency range of 0.55–1.4 GHz. The fine structures of the preflare microwave burst are shown by the expanded fully temporal resolution spectrum in Fig. 8b. It shows that fine structures in the form of dots crowded in a narrow band. For a single dot, the bandwidth is about several tenth MHz, and the duration is about several tens of millisecond. Fig. 8c-e show that the eruption begins as the activity of a small filament, which locates along the margin of the host region as indicated by arrows. The filament can not be identified in 193 Å before its eruption, while it can be identified in 193 Å as some brightening fiber with obvious twisting during the eruption.
3.3 Brief Summary of Observational Results
We have studied the properties of microwave fine structures in the preflare phase and the associated activities in the source regions observed at multiple wavelengths (such as hard X-ray of RHESSI, UV and EUV of AIA/SDO, etc.). The results derived from the analysis of four sampled events are summarized in Table 1. The main observational results are as follows:
(1) There are some microwave bursts with spectral fine structures occurring in the preflare phase of the mentioned flare events. These fine structures appeared at about 1 – 4 minutes before the start of GOES flares in the flare host region, for which direct physical associations with flares are implied. Among the four events, very short period QPPs occurred in one short duration flare (C5.5 flare on 2011 December 25), while small-scale burst, like dot burst groups, occurred in other three long duration flares (C4.4 flare on 2010 August 01, C3.2 flare event on 2010 August 14, and M1.9 flare on 2012 May 07).
(2) There is only one type of microwave spectral fine structure which was identified in the preflare phase for each flare. The microwave QPPs appeared at about 2 minutes before the flare. Their durations are in the time period from several tenth to several seconds, and their frequency bandwidths are in the range of several hundreds MHz. Their periods are of several tenth seconds which belong to very short period QPPs. While the microwave dot bursts appeared at about 1–4 minutes before the flare. They are all in great cluster with duration longer than 10 seconds. Meanwhile, the duration and frequency range for each dot is about several tens milliseconds and several tenth MHz.
(4) For all four events, except one occurred in the RHESSI night time, the other three events have an obviously HXR flux enhancement. As for the C5.5 flare on 2011 December 25, accompanying the microwave QPPs in the preflare, the RHESSI HXR images were obtained in 3 – 6 keV, 6 – 12 keV, and 12 – 25 keV. It shows the presence of single source in 3 – 6 keV and 6 – 12 keV and double sources in 12 – 25 keV. The RHESSI sources were located on the polarity inverse line and near the initial brightening in UV/EUV images.
(5) From SDO observations, we found that for all events, the beginning of the flare can be marked by filament arise or plasma ejection, and simultaneously associated with the loop brightening or loops interactions.
4 Conclusions and Discussions
This work investigated a series of solar flares and confirmed the relationships between the preflare radio bursts and the flare activities in four flares. From these investigations, we find that there are several observational activities occurring several minutes before the flare start. These activities include:
1. Microwave bursts with spectral fine structures at relatively weak intensity and very short timescales. These fine structures occurred in the frequency range of 0.3 GHz – 1.5 GHz, including microwave QPPs with very short period of 0.1-0.3 s and dot bursts with millisecond timescales and narrow frequency bandwidths.
2. Filament motions, especially behaved as sigmoid filament ascending, plasma ejections, and plasma loop brightening. These motions can be observed by the EUV images of AIA/SDO.
3. Non-thermal processes, such as the HXR enhancement at the energy channel of 12 – 25 keV observed by RHESSI or the rapid growth of the temporal derivative of GOES soft X-ray flux.
In fact, the above three different observational activities are closely related to each other essentially. Both of the subsecond microwave spectral fine structures and HXR enhancements indicate the activities of electron acceleration and primary energy release. Consequently, these releasing energy and the energetic electrons may trigger the plasma motion in the source region, and result in the sigmoid filament ascending, plasma ejections, and plasma loop brightening which can be observed by the EUV imaging observations.
Previous literatures showed that microwave bursts with spectral fine structures frequently occurred in the impulsive and decay phases of solar flares(Chernov 2006; Huang et al. 2008; Huang & Tan 2012). In this work, we find that microwave bursts with spectral fine structures also occur in the preflare phase, especially the microwave QPP with subseconds and dot bursts with millisecond timescales which have similar properties as observed in previous works. Many people have pointed out that it is very difficult to adopt the general MHD oscillation mechanism to explain the formation of microwave QPP with subsecond time scales (see review of Aschwanden 1987; Nakariakov & Milnikov 2009). Tan et al. (2007) proposed that the resistive tearing-mode oscillations in current-carrying flare loops may modulate the nonthermal microwave emission and form QPP at subsecond periods. In this new mechanism, the plasma loops carry electric currents with finite resistivity which may excite resistive tearing-mode instability and produce a series of magnetic islands. Electrons can be accelerated near the X-points between each two adjacent islands and form energetic electron beams. The plasma may produce coherent emission when the energetic electron beams interact with the adjacent plasmas. When acceleration from X-points is modulated by the tearing-mode oscillation, microwave QPP can occur (Tan et al. 2007). The occurrence of subsecond microwave QPP implies that the electron acceleration is quasi-periodic. When acceleration from X-points are stochastic, microwave dot bursts may occur with a random distribution in the spectrogram (Tan 2013). Because the accelerating site is located around each X-point, it lasts very short and occurs in a small region. The microwave QPPs with period of 0.1-0.3 s and dot bursts in the preflare reveal the following information in the flare source region: the flare loops carry electric currents, and therefore there are considerable accumulation of non-potential free energy which may consequently trigger the magnetic reconnection and electron acceleration in the flare source region. Therefore, energy release may take place in the preflare as well as in the impulsive phase of the flares, although their intensities are relatively weaker than the later.
When we investigate preflare microwave signature to understand and predict the solar flare, we always meet two critical problems. One is the definition of the start time of a flare, and the other is whether the preflare microwave signatures are rare or general. In this work, the start time of flares were extracted from GOES list. The GOES satellites provide continuous monitoring of the integrated full disk solar X-ray intensity in a hard (0.5 – 4 Å) channel and a soft (1 – 8 Å) channel. The flare start defined by SXR/GOES is when four consecutive 1 minute SXR values meet all following three conditions: (1) all four values are above the background threshold; (2) all four values are strictly increasing; and (3) the last value is greater than 1.4 times of the first value that occurred 3 minutes earlier. Meanwhile, the start time is defined as the first minute in the sequence of 4 minutes. According to this definition, it is quite natural that some small, gradual or impulsive flux enhancement which associated with small activities do exist before the GOES flare.
As for the second problem, preflare activities in microwave are discovered as early as 1950s by Bumba & Křivský (1959). They found that about 20% of flares in their sample are preceded by much smaller bursts on wavelength 130 cm and 56 cm. By using interferometric solar microwave data recorded by the Owens Valley at 10.6 GHz between Feb 19, 1980 and March 31, 1981, Hurford & Zirin (1982) found that 15% of the flares are preceded by similar preflare signatures. The most common signature was a step-like increase in signal amplitude, accompanied by a decrease or reversal in the degree of polarization. Later Kai, Nakajima, and Kosugi (1983) also found about 26% of the flares are associated with the preflare microwave activities which related to the subsequent main energy release. Xie et al. (1994) studied microwave flux variation of flares at four frequency (1.42, 2.13, 2.84, 4.26 GHz) and found that around 30% of flares are preceded by narrow banded preflare activities. Meanwhile, they found that the preflare activity occurs at the low frequencies more frequently than at the high frequencies. The rare previous studies show that radio preflare activities do not occur in a majority of cases. Hurford, Read, & Zirin (1984) have shown that preflare bursts may occur in such narrow spectral band that they can easily be missed by instruments responding to a single frequency. Here in the present work, we found that out of the 156 flare associated radio bursts, 12% (18 events) of them were preceded by microwave fine structures. For the lack of corresponding image observations, only 4 events are confirmed that located in the same host region as the main flare. Such preflare activities appear to be as a narrow-banded (not greater than 1 GHz), short duration (the longest duration is 40 s for impulsive radio burst), and weak intensity (about 10% of the maximum flux of the main flare). So they can easily be missed by narrow band spectrometers.
Preflare activities appeared in multi-wavelength have been considered as a potential clue to understand the physical conditions in the solar atmosphere that leads to a flare eruption. Especially the spectral fine structures in microwave bursts, the preflare activities can provide insights into the magnetic fields, plasma condition, and the initial motion and interaction of the plasma loops, and the primary magnetic reconnection process in the flare cradle regions. Additionally, as the microwave signals are much more sensitive than the other wavelength observations, a systematic summary of the preflare characteristics can help us to predict the catastrophe solar eruptive events. However, there is no corresponding imaging observations at the related frequencies in our study, some important parameters of the source regions, such as the spatial scale, height, configurations of the source region are not clear. And without the polarization information, the parameters of the magnetic field and plasma in the source region can not be deduced, either. These information is very important for us to establish the direct connections of the microwave bursts and the multi-wavelengths activities. The forthcoming snapshot imaging observations at broad frequency bandwidth of the next generation radio telescopes (CSRH, 0.4 – 15 GHz, Yan et al. 2009; FASR, 0.05 – 20 GHz, Bastian 2003) will provide much more abundant and confirmable information about the preflares. And then we will do further investigations on this topic, and get more insight of the flare triggering mechanism.
References
- Asai (2005) Asai, A., Nakajima, H., Shimojo, M., White, S. M., Hudson, H. S., 2005, Proceedings of 9th Asian-Pacific Regional IAU meeting, 1
- Aschwanden (1987) Aschwanden, M.J.: 1987, SoPh 111, 113
- Bastian (1998) Bastian, T., Benz, A.O., & Gary, S.E.: 1998, Ann. Rev. Astron. Astrophys 36, 131.
- Ben (2009) Ben, A. O., Monstein, C., Meter, H., Manoharan, P. K., Ramesh, R., Altyntsev, A., et al., 2009, Earth Moon Planet, 104, 277
- Bumba (1959) Bumba, V., & Křiviský, L. 1959, Bull. Astron. Inst. Czech, 10, 221
- Canfield (1999) Canfield, R. C., Hudson, H. S, McKenzie, D. E., 1999, Geophys Res Lett, 26, 627
- Cheng (1985) Cheng, C. C., Pallavicini, R., Acton, L. W., Tandberg-Hanssen, E., 1985, ApJ, 298, 887
- Chernov (2006) Chernov, G. P., 2006, SSRv, 127, 195
- Chifor (2006) Chifor, C., Mason, H. E., Tripathi, D., Isobe, H., and Asai, A., 2006, A&A, 458, 965
- Chifor (2007) Chifor, C., Tripathi, D., Mason, H. E., & Dennis, B. R., 2007, A&A, 472, 967
- Contarino (2003) Contarion, L., Romano, P., Yurchyshyn, V. B., Zuccarello, F., 2003, Sol. Phy, 216, 173
- Dere (1997) Dere, K. P., Landi, E., Mason, H. E., Monsignori Fossi, B. C., & Young, P. R., 1997, A&AS, 125,149
- Farnik (1989) Fárník, F., & Savy, S. K., 1998, Sol. Phy, 183, 339
- Fu (2004) Fu, Q.J., Ji, H.R., Qin, Z.H. et al., 2004a, SoPh, 222, 167
- Fu (2004) Fu, Q. J., Yan, Y. H., Liu, Y. Y., Wang, M., & Wang, S. J., 2004b, CHJAA, 4, 176
- Gaizauskas (1989) Gaizauskas, V., 1989, Sol. Phy, 121, 135
- Harrison (1985) Harrison, R. A., Waggett, P. W., Bentley, R. D., et al. 1985, Sol. Phy, 97, 387
- Huang (2008) Huang, J., Yan, Y. H., & Liu, Y. Y., 2008, Solar Phys., 253, 143
- Huang (2012) Huang, J., & Tan, B. L., 2012, ApJ, 745, 186
- Hurford (1984) Hurford, G. J., Read, J. B., & Zirin, H., 1984, Sol. Phy, 94, 413
- Hurford (1982) Hurford, G. J., & Zirin, H., 1982, AFGL-TR-82-0117
- Isobe (2006) Isobe, H., & Tripathi, D., 2006, A&A, 449, L17
- jiricka (1993) Jiřic̆ka, M., Karlický, M., Kepka, O., Tlamicha, A., 1993, Sol. Phy, 147, 203
- Kai (1983) Kai, K., Nakajima, H., & Kosugi, T., 1983, Pulb. Astron. Soc. Japan, 35, 285
- Landi (2006) Landi, E., Del Zanna, G., Young, P. R., et al., 2006 ApJS, 162, 261
- Lemen (2012) Lemen, J. R., Title, A. M., Akin, D. J., et al., 2012, Sol. Phy, 275, 17
- Lin (2002) Lin, R. P., et al., 2002, Sol. Phy, 210, 3
- Liu (2010) Liu, R., Liu, C., Wang, S., Deng, N., & Wang, H. M., 2010, ApJ, 725, L84
- Martin (1980) Martin, S. 1980, Sol. Phy, 68, 217
- Nakariakov and Milnikov (2009) Nakariakov, V.M., & Milnikov, V.F.: 2009, Space Sci. Rev. 149, 119.
- Priest (2002) Priest, E. R., & Forbes, T. G., 2002, A&ARv, 10, 313
- Shibata (1999) Shibata, K., 1999, Ap&SS, 264, 129
- Tan (2007) Tan, B.L., Yan, Y.H., Tan, C.M., & Liu, Y.Y.: 2007, ApJ, 671, 964
- Tan (2010) Tan, B. L., Zhang, Y., Tan, C. M., & Liu, Y. Y., 2010, ApJ, 723, 25
- Tan (2012) Tan, B.L., Tan, C.M., 2012, ApJ, 749, 28
- Tan (2013) Tan, B.L., 2013, ApJ, 773, 165
- Tappin (1991) Tappin, S. J., 1991, A&As, 87, 2Tan, C.M.77
- Vemareddy (2012) Vemareddy, P., Maurya, R. A., & Ambastha, A., Sol. Phy, 277, 337
- warren (2001) Warren, H. P, Warshall, A. D., 2001, ApJ, 560, L87
- xie (1994) Xie, R. X., Song, Q., Wang, M., Chen, G. Q., 1994, Sol. Phy, 155, 113
- Yan et al (2009) Yan, Y.H., Zhang, J., & Wang, W., et al. 2009, EMP 104, 97.