Herschel imaging of the dust in the Helix Nebula (NGC 7293)††thanks: Herschel is an ESA space observatory with science instruments provided by European-led Principal Investigator consortia and with important participation from NASA.
Abstract
Aims. In our series of papers presenting the Herschel imaging of evolved planetary nebulae, we present images of the dust distribution in the Helix nebula (NGC 7293).
Methods. Images at 70, 160, 250, 350, and 500 m were obtained with the PACS and SPIRE instruments on board the Herschel satellite.
Results. The broadband maps show the dust distribution over the main Helix nebula to be clumpy and predominantly present in the barrel wall. We determined the spectral energy distribution of the main nebula in a consistent way using Herschel, IRAS, and Planck flux values. The emissivity index of , in combination with the carbon rich molecular chemistry of the nebula, indicates that the dust consists mainly of amorphous carbon. The dust excess emission from the central star disk is detected at 70 m and the flux measurement agrees with previous measurement. We present the temperature and dust column density maps. The total dust mass across the Helix nebula (without its halo) is determined to be 3.5 M⊙ at a distance of 216 pc. The temperature map shows dust temperatures between 22 K and 42 K, which is similar to the kinetic temperature of the molecular gas, confirming that the dust and gas co-exist in high density clumps. Archived images are used to compare the location of the dust emission in the far infrared (Herschel) with the ionized (GALEX and H) and molecular (H2) component. The different emission components are consistent with the Helix consisting of a thick walled barrel-like structure inclined to the line of sight. The radiation field decreases rapidly through the barrel wall.
Key Words.:
planetary nebulae: individual: NGC 7293 – circumstellar matter – dust – Infrared: ISM1 Introduction
We present Herschel observations of the Planetary Nebula (PN) NGC 7293, also known as the Helix nebula, which is the nearest large PN at a distance of 216 pc (Benedict et al. 2009), allowing us to study its spatial structure in detail. The white dwarf central star WD 2226-210 with a surface temperature of 103 600 5500 K (Napiwotzki 1999) ionizes the AGB nebula. Su et al. (2007) also showed the presence of a 35-150 AU diameter debris disk around this central star.
The Helix has been extensively studied over a wide range of wavelengths with ground- and space-based telescopes. At optical wavelengths neutral and ionized atomic gas has been well-characterized by the Hubble Space Telescope (O’Dell et al. 2004; Meixner et al. 2005). Observations of H2 have identified the presence of numerous globules often observed with cometary-like tails in H2, CO, and at infrared wavelengths (Meaburn et al. 1998; Speck et al. 2002; Meixner et al. 2005; Hora et al. 2006; Matsuura et al. 2009). A map encompassing the region of the optical image in the CO J=21 transition has been made by Huggins & Healy (1986) and Young et al. (1999). More complex molecules, including HCN, CN, HCO+, CCH, C3H2, H2CO, and HCO+ have also been detected in dense gas in the Helix (Bachiller et al. 1997; Tenenbaum et al. 2009; Zack & Ziurys 2013). Most recently Etxaluze et al. (2014) studied the spatial distribution of the atomic and molecular gas along the western rim in the submillimeter range with the SPIRE instrument on board Herschel.
Understanding the complex morphology of the Helix nebula has been the subject of numerous studies (Young et al. 1999; O’Dell et al. 2004; Meaburn et al. 2005). One major obstacle has been a lack of high resolution velocity data, until Zeigler et al. (2013) observed the J = 10 transition of HCO+ at 89 GHz across the Helix nebula with a velocity resolution of 1.68 km/s and an angular resolution of 35″ half power beamwidth. The image constructed from the HCO+ emission closely resembles that observed in the optical, as well as in vibrationally excited H2, suggesting a common morphology. The high resolution spectra obtained in HCO+ indicate a barrel-like, bipolar outflow tilted about 10 east relative to the line of sight. Around this main nebula is a 40′ diameter halo which shows interaction with the ISM in the NE (Zhang et al. 2012; Meaburn et al. 2013).
The reason for studying NGC 7293 is its similarity to the other highly evolved PNe which are also part of the MESS program: the Ring Nebula (NGC 6720) (van Hoof et al. 2010) and the Little Dumbbell Nebula (NGC 650) (van Hoof et al. 2013). Both nebulae have a highly evolved central star and exhibit high density, cometary knots.
In this paper we discuss far-infrared images obtained with the PACS and SPIRE instruments on board the Herschel telescope in Sects. 2 and 3. We present the SED in Sect. 4, the temperature map in Sect. 5, and the mass column density map in Sect. 6. The properties of the central star disk are discussed in Sect. 7. In Sect. 8 we compare the dust component with images of the molecular and ionized component. The conclusions are presented in Sect. 9.
2 Observations and data reduction
As part of the Herschel guarantee time key project MESS (Mass loss of Evolved StarS) (P.I. Martin Groenewegen) we have imaged a sample of PNe with the PACS (Poglitsch et al. 2010) and SPIRE (Griffin et al. 2010) instruments on board the Herschel satellite (Pilbratt et al. 2010). A detailed description of the program can be found in Groenewegen et al. (2011). An overview of the Herschel observations of PNe in the MESS program was presented in van Hoof et al. (2012). Other PNe have been observed in the Herschel Planetary Nebulae Survey (Ueta et al. 2014). In this article we will present the Herschel PACS and SPIRE observations of the Helix nebula obtained in the framework of the MESS program and the deep SPIRE photometer maps obtained in the framework of the Must-Do 7 proposal led by J. Cernicharo.
PACS had three wavelength channels: 70 m (blue channel), 100 m (green), and 160 m (red), with two observed simultaneously, red and blue in our case. SPIRE operated at 250 m (PSW band), 350 m (PMW), and 500 m (PLW) simutaneously. We obtained both SPIRE and PACS data simultaneously in parallel mode at 60″/s scan speed. SPIRE observations were also redone as MustDo (MD) observations at a scan speed of 30″/s. The log of the observations is presented in Table 1.
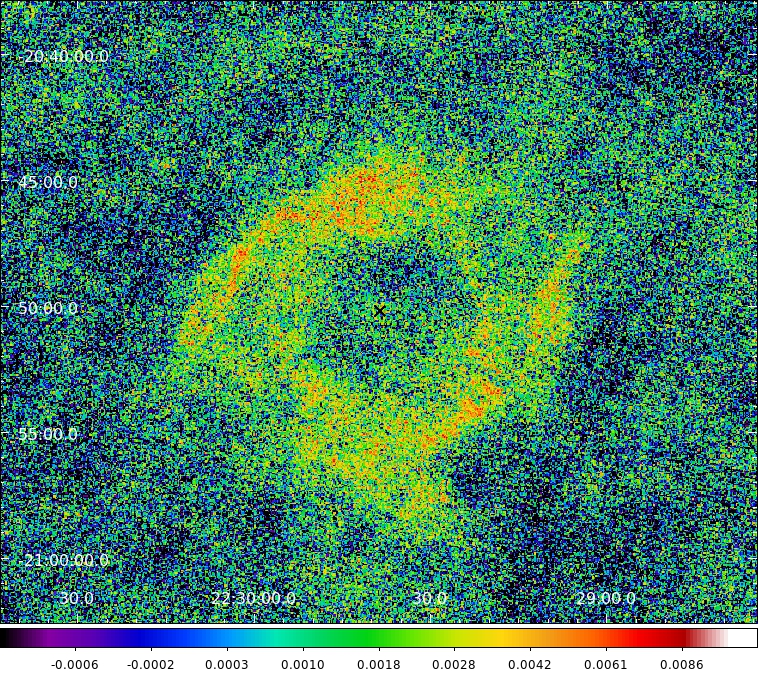
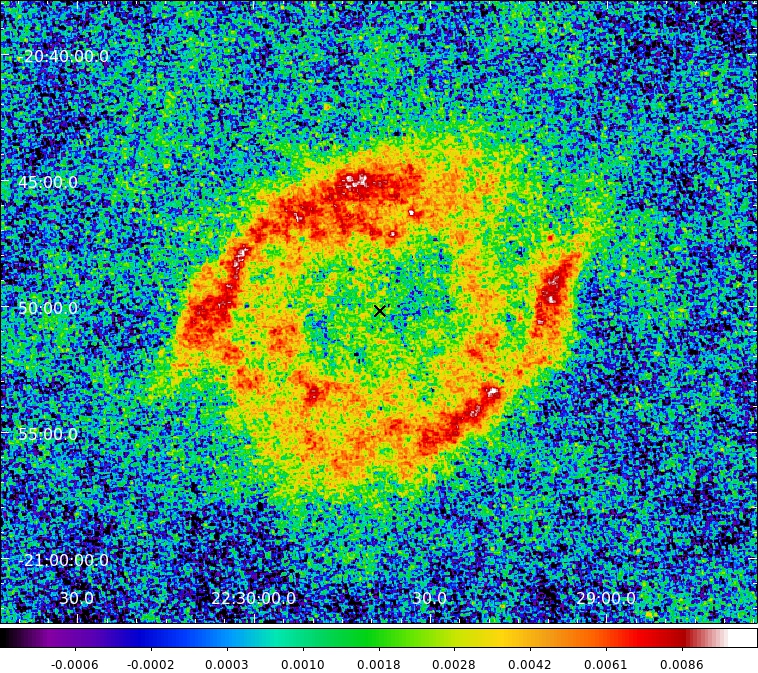
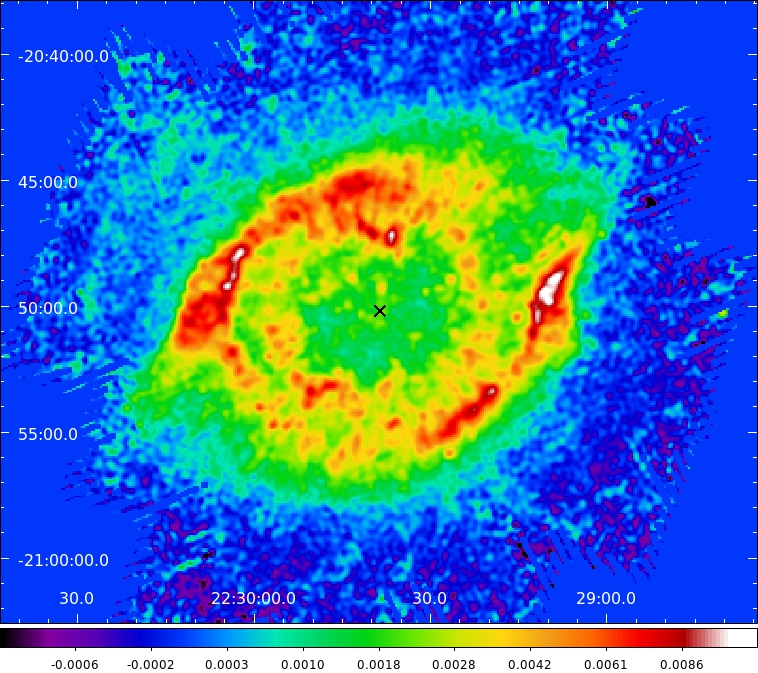
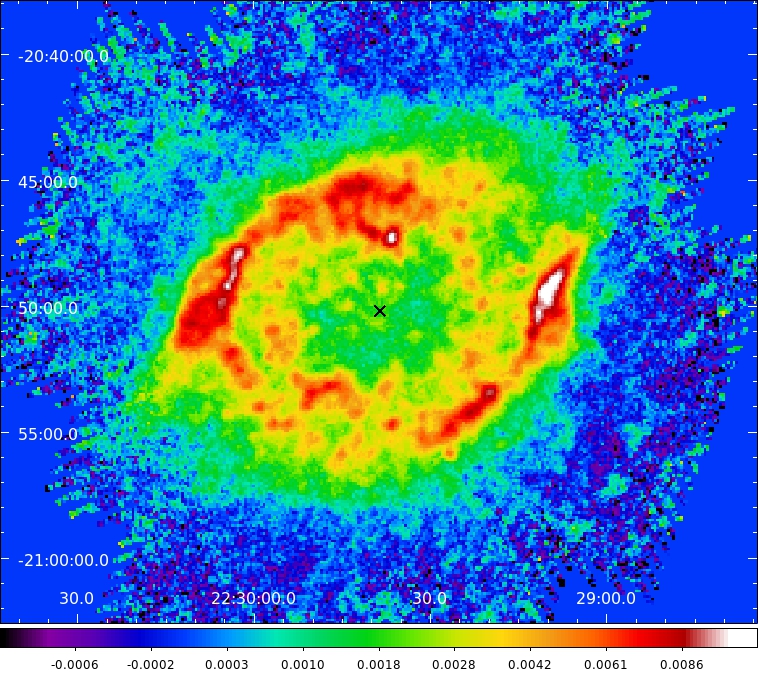
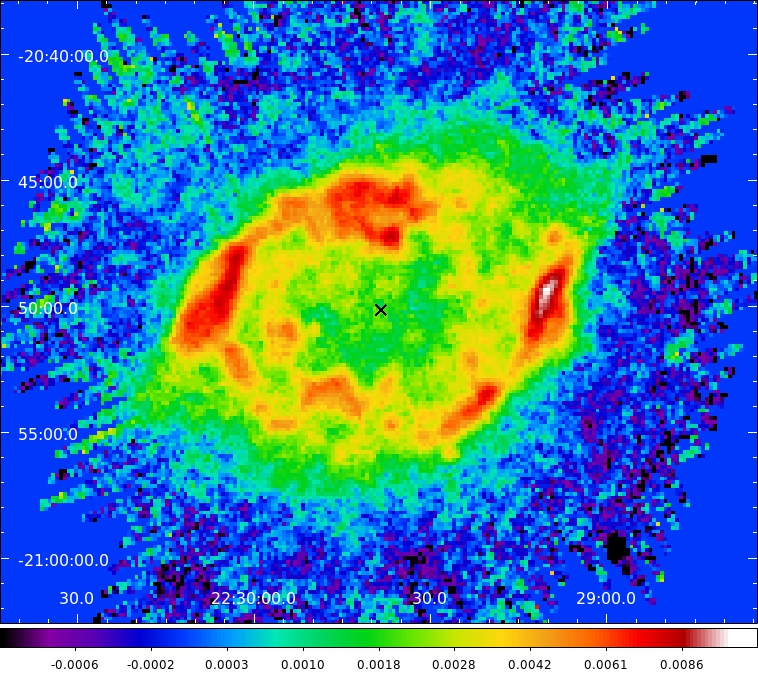
To generate broadband images, we used the Herschel Interactive Processing Environment (HIPE, version 10.0; Ott (2010)) and the Scanamorphos data reduction tool (Scanamorphos, version 20; Roussel (2013)). We used the same pixel size for the PACS 70 and 160 m images being 285, and the standard Scanamorphos pixel sizes of 45, 625, and 9″ for the SPIRE images. The FWHM of the PACS beam at 70 and 160 m is 57 and 114, respectively. The FWHM of the SPIRE beam sizes are 181, 252, and 366 at 250, 350, 500 m, respectively. The PACS images are in Jy/pixel, while SPIRE images are in Jy/sr and were converted to Jy/pixel using the above pixel and beam sizes within HIPE. The background sources outside the Helix and known sources across the Helix were subtracted using SExtractor and the images were sky subtracted within HIPE. It is possible that some contaminating hitherto unknown sources (mainly background galaxies) remain across the nebula. The resulting images are presented in Fig. 1.
| OD | RA (J2000.0) | DEC(J2000.0) | AOT | Duration | Start Date & Time | Obsid |
|---|---|---|---|---|---|---|
| 350 | 22h29m38.55s | -20d50m13.60s | SpirePacsParallel | 4326s | 2010-Apr-28T22:30:39 | 1342195681 |
| 350 | 22h29m38.55s | -20d50m13.60s | SpirePacsParallel | 4116s | 2010-Apr-28T23:43:58 | 1342195682 |
| 1304 | 22h29m35.24s | -20d50m40.51s | SpirePhotoLargeScan | 2047s | 2012-Dec-08T10:54:32 | 1342256744 |
3 Dust morphology
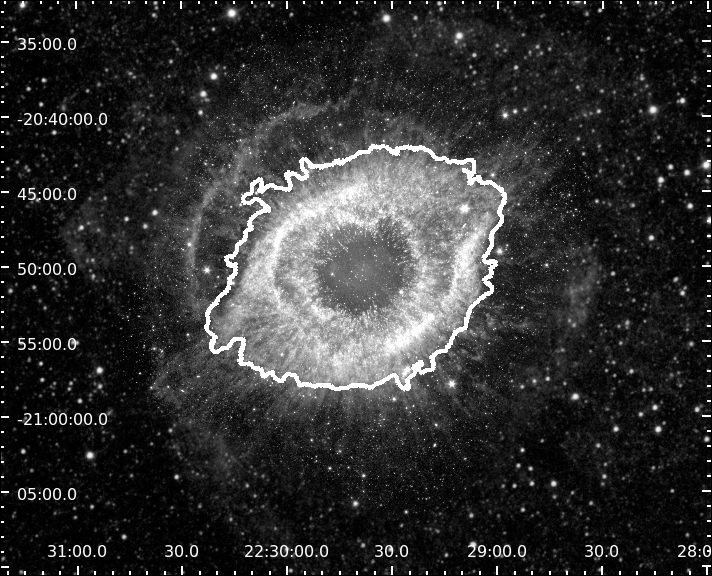
Only a bit of the outer halo and arc in the north is detected. Hence we will restrict the discussion in this paper to the main nebula. The region considered is indicated on the grayscale image in Fig. 1.
Zeigler et al. (2013) noted that the structure of the Helix projects as if it were a thick walled barrel composed of red- and blue-shifted halves in a bipolar geometry. The barrel axis of the Helix is tilted about 10 east and 6 south relative to the line of sight (Zeigler et al. 2013). The barrel rims are widely separated in space, but the projected barrel shape creates a false impression of the inner and outer circular structures. The apparent so-called “inner ring” is actually spatially distant velocity components projected together to create the illusion of a circle. Similarly, the apparent so-called outer ring is an artifact of the bulging central wall of the barrel, pushed outward to the east and west.
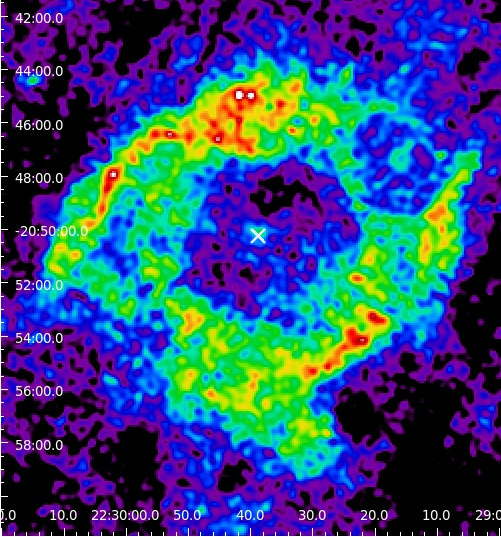
In the SPIRE maps we look at the cold dust without emission from atomic ions. The best compromise of resolution and signal is provided by the SPIRE 250 m MD map (Fig. 1). The barrel wall is very fragmented and consists of emission clumps on size scales down to the resolution of the map. In the N we look more at the outer edge of the barrel, while in the S we look more down the barrel towards the central star. The dust emission is fainter when we look inside the barrel, and brighter when we look at the outside of the barrel wall. There appears to be less dust in the NW, which is in the direction of the receding plume. These plumes in the NW and SE appear as a radial flow-like structure in the WISE and GALEX images (see grayscale image in Fig. 1). They may be caused by a bipolar outflow with somewhat higher velocity puncturing wholes in the barrel walls (Zeigler et al. 2013). The plume in the SE is broader but less obvious, because we are looking inside, down the barrel towards the central star. The inner and outer side of the barrel appear well separated except in the SSW and in the N. In these regions the dust emission is bright, as well as in two extensions in the NNW and SSE. The latter are the edges of the barrel lobes.
Adopting the thick walled barrel bipolar morphology, as proposed by Zeigler et al. (2013) and Meaburn et al. (2008), we notice that the dust emission comes mainly from the barrel wall. The dust emission is strongest where we look from the outside at the barrel, and is weaker when we look inside the barrel towards the central star.
4 Spectral energy distribution
| Instr | K4E/ | Kcolor | flux | error | fit | |
|---|---|---|---|---|---|---|
| m | K4P | Jy | Jy | Jy | ||
| IRAS | 60 | 1.0000 | 0.9457 | 162.3 | 52.9 | 92.6 |
| IRAS | 100 | 1.0000 | 0.9650 | 312.8 | 87.0 | 271.9 |
| PACS | 70 | 1.0000 | 0.9961 | 143.6 | 19.9 | 151.8 |
| PACS | 160 | 1.0000 | 0.9996 | 302.0 | 75.3 | 251.2 |
| SPIRE | 250 | 0.9828 | 0.9978 | 126.7 | 12.9 | 135.6 |
| SPIRE | 350 | 0.9843 | 0.9991 | 69.4 | 7.2 | 69.6 |
| SPIRE | 500 | 0.9710 | 0.9788 | 30.6 | 3.2 | 30.8 |
| Planck | 350 | 1.0000 | 1.0190 | 72.0 | 7.6 | 69.6 |
| Planck | 550 | 1.0000 | 1.0881 | 24.5 | 2.7 | 24.5 |
| Planck | 849 | 1.0000 | 1.0983 | 8.83 | 1.00 | 8.42 |
| Planck | 1382 | 1.0000 | 1.1016 | 3.27 | 0.46 | 2.81 |
| Planck | 2096 | 1.0000 | 1.0077 | 1.15 | 0.23 | 1.46 |
| Planck | 2998 | 1.0000 | 1.0695 | 0.93 | 0.17 | 1.10 |
| CBI | 9671 | 1.0000 | 1.0000 | 1.10 | 0.11 | 1.00 |
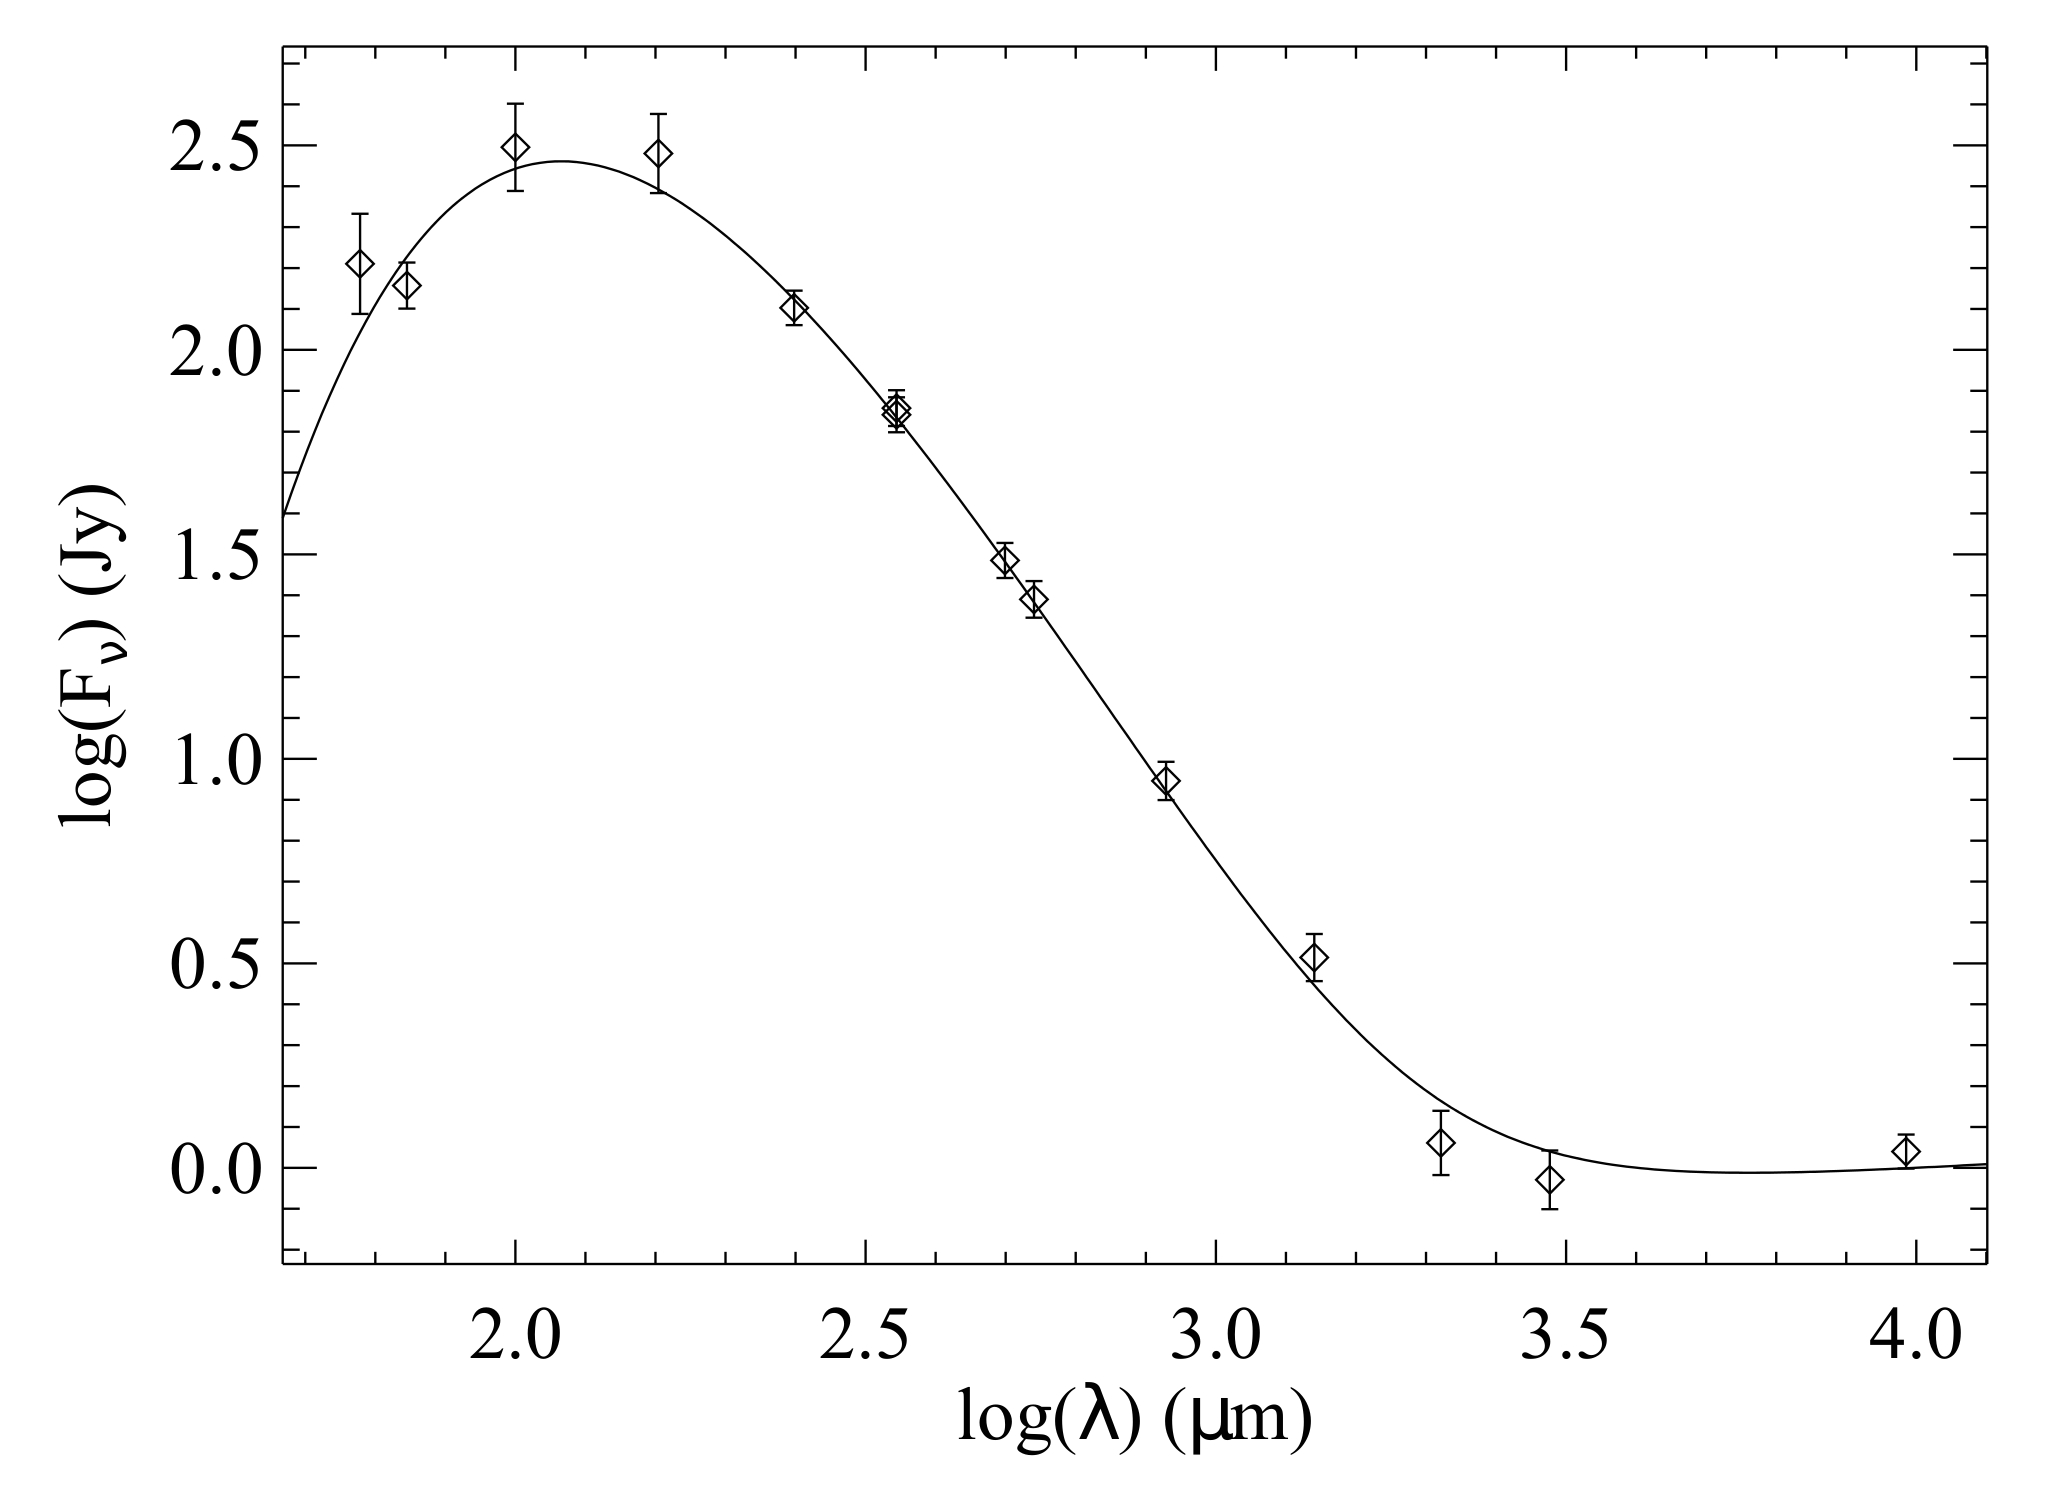
In Fig. 2 we present the spectral energy distribution (SED) of the Helix nebula. We retrieved the Planck images from the Planck database and converted the units to Jy/pixel (see also Planck Collaboration et al. (2014)). We determined the integrated flux down to 0.008 Jy/pixel in the Planck 350 m image, which corresponds to about 3 . We used this contour to measure the flux values at all other Planck wavelengths at 350, 550, 849, 1382, 2096, 2998 m, but also used the same region within this same contour to measure the flux values in the SPIRE 250, 350, 500 m parallel mode images, and the PACS 70 and 160 m parallel mode images convolved to the SPIRE 250 m beam and rebinned to its 45 pixel size with flux conservation. We also retrieved the IRAS 60 and 100 m images, but used a different contour as the IRAS beams were too large and too much flux would have been missed. We added a point at 31 GHz (9671 m) from Casassus et al. (2004) obtained with the Cosmic Background Imager (CBI) interferometer in Chile (Padin et al. 2002) to constrain the free-free emission. Photometric color corrections were applied to all flux densities. This correction is needed to convert monochromatic flux densities that refer to a constant energy spectrum to the true object SED flux densities at the photometric reference wavelengths of each instrument. The data are summarized in Table 2. Since the source is extended, the appropriate correction for extended source calibration were applied to the SPIRE fluxes
| (1) |
The correction factors are given in Table 2. We note that the definition of is the inverse of the definition used in the SPIRE Observer’s Manual, but agrees with the definition used by the other instrument teams.
The Planck fluxes are a bit lower, but up to 2096 m (143 GHz) within the error bars of the flux values mentioned in Planck Collaboration et al. (2014). This is because the contours have been optimized for the SPIRE images where the beam and pixel sizes are smaller and the region considered more adjusted to the nebula. The percentage differences in flux values at longer wavelengths are larger, because the flux values are low and the background more significant compared to the shorter wavelengths (higher frequencies).
The thermal radiation emitted from a population of dust particles depends on their temperature distribution and opacity. Assuming that the opacity index varies with frequency as a power law, , and that the dust grains dominating the flux in the IR and submm part of the SED all have the same temperature , and the dust emission is optically thin, then the flux density spectral distribution can be approximated with a modified blackbody function of that temperature, plus a contribution of free-free emission given by
| (2) |
where is the frequency and Bν the Planck function of the dust temperature Tdust, and S1GHz 1.4 0.4 Jy. The power law exponent of the opacity law, , basically depends on material properties and the size distribution of the dust grains. An exponent would point to grains radiating almost as blackbodies (Hildebrand 1983).
We made -minimization fits to the available photometry data weighted with the accuracy of the flux density measurements and a contribution for the free-free emission. We obtained a dust emissitivity index 0.99 0.09 and a dust temperature Tdust30.8 K 1.4 K. Both measured and fitted values are presented in Table 2 and the best fit model in Fig. 2. A dust emissivity of slightly less than 1.0 was also found in both C-rich and O-rich (post-)AGB stars. This indicates that the dust has a layered amorphous structure (Knapp et al. 1993). In laboratory measurements a value of 1 is more typical for amorphous carbon grains than for silicate grains (Mennella et al. 1995, 1998). The Planck collaboration found a temperature of 34 K (no error bar given) and an amorphous carbon grain composition based on modeling the SED with DUSTY (Planck Collaboration et al. 2014). DUSTY assumes spherical symmetry for the dusty envelope and the authors used a r-2 density distribution as first approximation to the nebular parameters.
The composition of the progenitor star in the Helix is still a subject of debate. Measurements by Henry et al. (1999) of atomic emission lines in the nebula at one position in the northeastern rim indicate that C/O is 0.87 0.12 suggesting that hot-bottom burning on the late AGB converted much of the 12C into 14N. However, the presence of CN, HCN, HNC, c-C3H2, and C2H measured at one position in the eastern part of the Helix indicates a C-rich environment (Tenenbaum et al. 2009). In view of the carbon richness of the Helix molecular envelope, the absence of the usual PAH emission features in the ISOCAM CVF (Cox et al. 1998) and IRS spectra (Hora et al. 2006) spectra is surprising. The absence of PAH emission bands in the mid-infrared spectra implies that no small dust particles are present in the envelope of this evolved PN (Cox et al. 1998) as they may have been destroyed during PN evolution, or it may be a sensitivity effect (Hora et al. 2006). The fact that dust grains are larger than typical grains in the ISM has been seen in other PNe such as NGC 650 (van Hoof et al. 2013) and NGC 6445 (van Hoof et al. 2000) for example. Several explanations were proposed in van Hoof et al. (2013), but the most plausible explanation could be that the large grains formed already during the AGB stage.
5 Temperature map
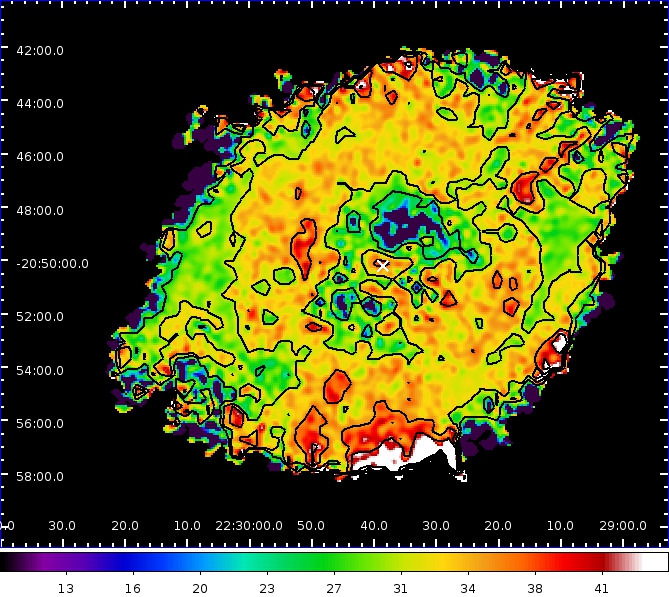
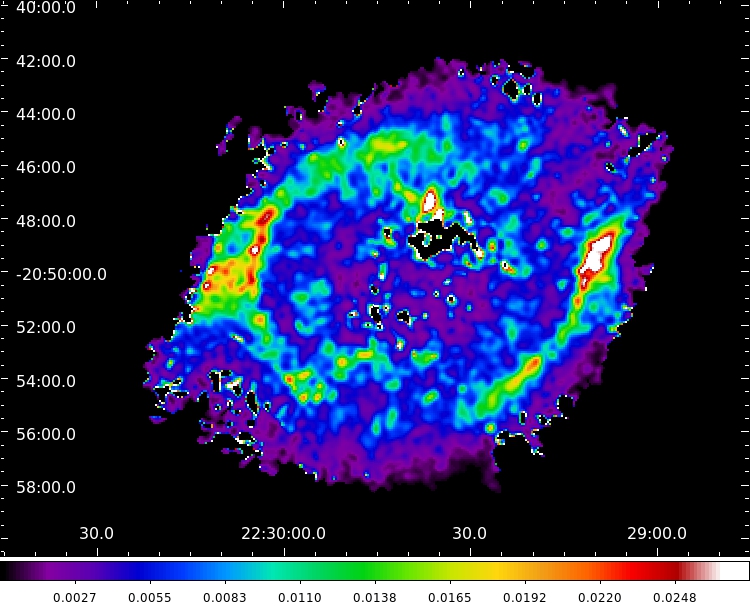
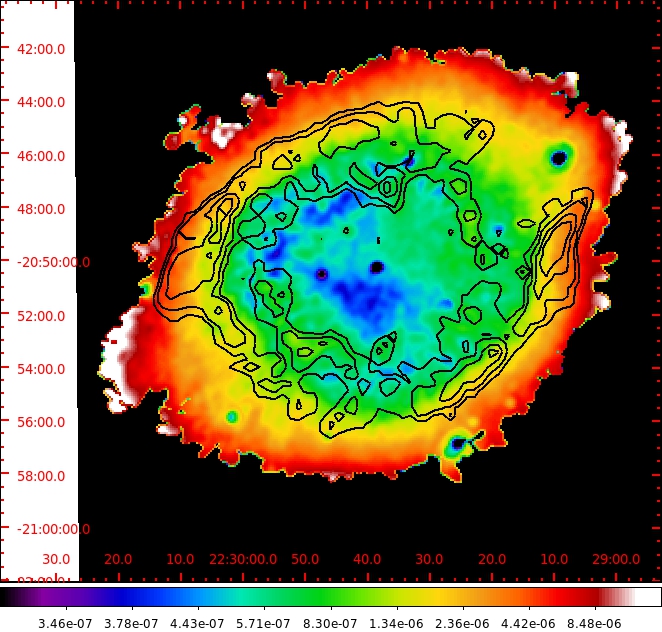
The PACS 70 m sky subtracted image was convolved to the SPIRE 250 m beam using the appropriate convolution kernels of Aniano et al. (2011) with flux conservation and rebinned to the pixel size of 45. We computed the ratio of this convolved PACS 70 m image to the SPIRE 250 m MD image. We computed a table of 70 m/250 m flux ratios of a modified black body at different temperatures with 1.0 folded with the PACS and SPIRE filter transmission curves available in HIPE (v.8.0.1387) using the procedure outlined in the SPIRE Observer’s Manual. Using this table we interpolated the flux ratios in the ratio image mentioned above as a function of temperature at each pixel to obtain the temperature map (Fig. 3). The central star position is marked with a white cross. We clipped the temperature image to the 1 contour of the sky subtracted SPIRE 250 m image.
The dust temperature is generally between about 22 K and 42 K. The dust is warmest in low density regions irradiated directly by the central star, and is cooler in dense regions and regions farther away from the central star and/or shielded from direct starlight. We notice a warmer ring-like structure. This ring-like structure encompasses the inner side of the barrel as defined by Zeigler et al. (2013). The temperature in the barrel wall is not at all uniform but reflects its clumpiness. The extensions in the SE and NW are cool, high opacity regions at the outside of the barrel farther away from the central star and shielded from direct starlight. Towards the plumes in the NW there are clumps of higher temperature. The higher temperatures in the S are mainly due to the excess emission in the PACS 70 m map. As we are looking down the inside of the barrel towards the central star, it may well be that the temperature is higher. At other wavelengths there are also indications of a higher temperature in this region. Because of the low signal-to-noise ratio in the 70 m map and the lower emission in the SPIRE 250 m map at the southern edge, we are not very sure of exactly how warm this region would be. It is reasonable to assume that it is not much warmer than other regions in the center of the nebula, where the temperature is about 40 K.
6 Dust mass column density
We calculated the dust mass column density for each pixel based on the temperature and the SPIRE 250 m MD image using the formula of Gledhill et al. (2002) and Hildebrand (1983) (Fig. 4). The dust mass density image is not uniform, but reflects the clumpiness of the Helix nebula. The densest regions are regions where we look at the edge of the barrel. Integrating values in the map and assuming a distance of 216 pc the total dust mass of the Helix is 3.5 10-3 M⊙.
As in Gledhill et al. (2002) we have assumed a bulk density of . According to the Planck Collaboration et al. (2014) paper this value would be more appropriate for silicate grains. Because it appears that amorphous carbon would be most appropriate for the dust composition, they used a value of . They also used a distance of 213 pc instead of 216 pc. When we use these values we find a total dust mass of 3.4 10-3 M⊙, which is in agreement with their value of 3.6 10-3 M⊙ from their DUSTY modeling.
7 Properties of the central star disk
Su et al. (2007) detected a pointlike source coincident with the central star, and a plateau of diffuse emission in the 24 m image, but only a pointlike source of flux 224 33 mJy at 70 m, and no point-like or extended emission at 160 m with Spitzer. We convolved the PACS images to the SPIRE 250 m beam using a pixel size of 45 (see Fig. 5) and also noticed the presence of the central source at 70 m, with a flux of 239 24 mJy (in good agreement with Su et al.), but not at longer wavelengths, and no diffuse emission at any wavelength. Combining the 24 and 70 m flux and our upper limits at other Herschel wavelengths would imply a temperature of at least 65 K for the debris disk, and a mass of around 2 10-7 M⊙, with a large degree of uncertainty due to the four upper limits used.
8 Comparison with images at other wavelengths
8.1 Comparison with GALEX images
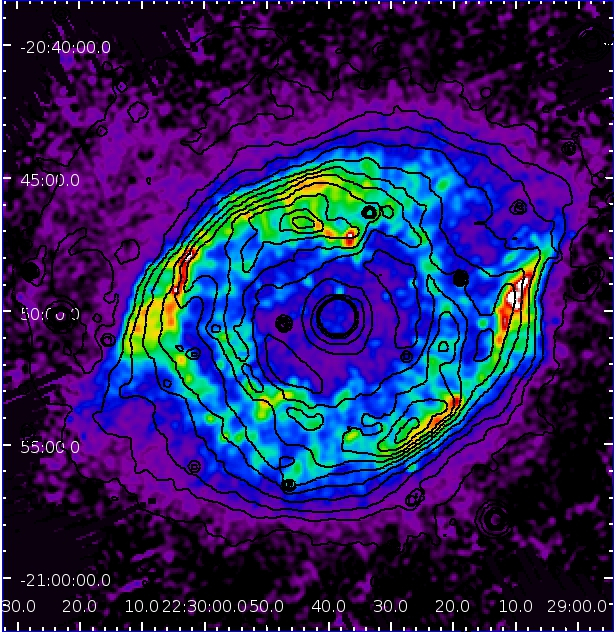
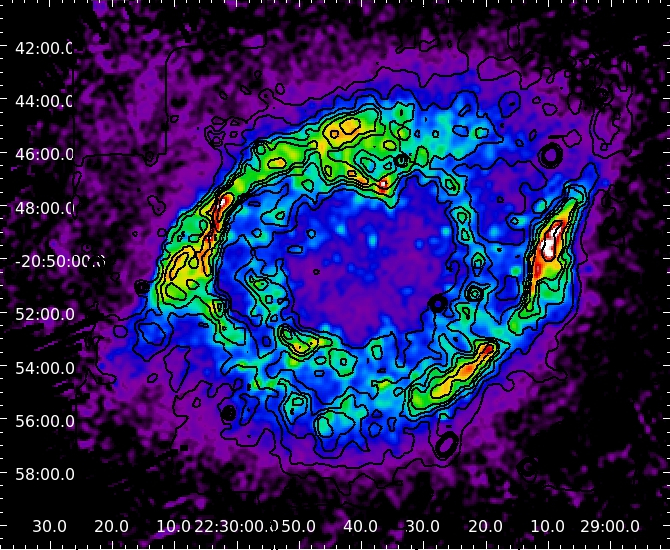
In Fig. 6 we overlay the contours of the NUV (175 280 nm) GALEX image, retrieved from the GALEX archive and convolved to the SPIRE 250 m beam, on the SPIRE 250 m MD image. There is UV emission to the same spatial extent as the dust emission, but we see that the brightest dust emission is located just outside the bright emission in the NUV image. The UV emission is strongest at the edge of the inner cavity while the far-infrared emission comes mainly from the outer edge of the barrel.
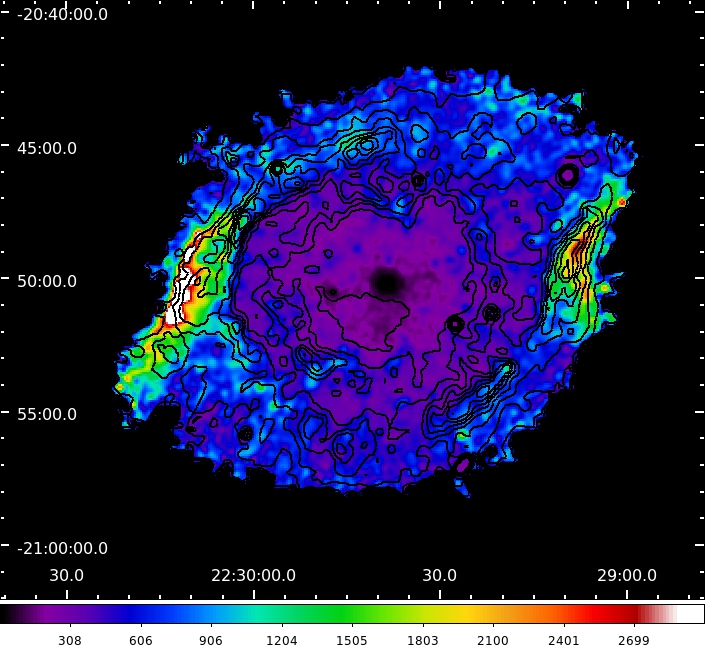
In Fig. 7 we show the ratio of this convolved NUV GALEX image to the SPIRE 250 m MD image. As mentioned before this image emphasizes that the dust emission is clumpy and the NUV emission is passing in between the clumps. The dust emission is strongest relative to the NUV emission in the extension in the SE. It is remarkable as the dust emission in the SPIRE 250 m map nor the dust density seems particularly strong in this region. Here the dust appears to be shielded most from the UV emission. We are looking face on at the outer part of the barrel wall. This extension is moving towards us in the HCO+ map of Zeigler et al. (2013). The extension in the NW has more complex kinematics and in part is moving away from us. It is the projection of the rim of the barrel lobe more towards the back of the Helix. It must be illuminated by the radiation passing through the holes. For the region in the south where there is relatively little dust emission compared to the NUV emission, we are looking down the barrel with blueshifted HCO+ velocities in front and redshifted velocities towards the back of the barrel. This is the region where there seems to be an excess in 70 m emission (Fig. 1), a somewhat higher temperature (Fig. 3) and on average lower dust column density (Fig. 4).
In summary, the dust emission is strongest compared to the NUV emission where we look at the outside of the barrel of the Helix and the dust emission is most shielded from the UV radiation. The dust is clumpy and UV radiation must leak through.
8.2 Comparison with the H2 image
We convolved the H2 image of Speck et al. (2002) with the SPIRE 250 m PSF (Aniano et al. 2011). The contours of this convolved H2 image are overlaid on the SPIRE 250 m image Fig. 8. We see that the H2 emission comes from the same region as the dust emission. The peaks of the H2 emission and the dust emission agree, except in the south. The H2 emission is relatively strong compared to the dust emission in the south and the peaks do not seem to coincide. This is the region where we look down the barrel towards the central star.
From high resolution H2 images it was found that in the Helix the H2 emission is always associated with dense clumps, knots, that are embedded in the ionized gas (Matsuura et al. 2009). The gas kinetic temperature Tk was determined to be about 20 to 40 K by Zack & Ziurys (2013) and Etxaluze et al. (2014), which is similar to our range in dust temperatures determined in Sect. 5. The gas density of the H2 cometary globules is on the order of n(H2) (1-5) 105 cm-3 (Zack & Ziurys 2013; Etxaluze et al. 2014). Goldsmith (2001) found that for gas densities higher than 104.5 cm-3 the dust and gas temperatures will be closely coupled, also for temperatures as found in the Helix. It is another indication that, as is the case in the Ring Nebula (van Hoof et al. 2010) and NGC 650 (van Hoof et al. 2013), also in NGC 7293 H2 and dust co-exist in these knots. This close correlation could be an indication of the formation of H2 on dust grains.
Exactly when the knots formed during the evolution is still debated. These knots may be density enhancements formed during the AGB phase in the shell and survived the ionization of the nebula (Matsuura et al. 2009; Aleman et al. 2011), or they may have formed because of instabilities and fragmentation at the ionization front when the nebula got ionized (García-Segura et al. 2006; Huggins & Frank 2006). As knots are observed in older PNe having central stars well evolved on the cooling track, it has been suggested that they formed because of hydrodynamical instabilities when the nebular gas is going through recombination (O’Dell et al. 2007; van Hoof et al. 2010). The formation of H2 most effectively takes place on the surface of dust grains, also at grain temperatures as found here for the Helix nebula (Cazaux & Tielens 2002, 2004). The high density in the knots makes it possible to shield the H2 from the stellar radiation field. The high densities and low dust temperatures observed allow H2 molecules to be reformed on dust grains on a reasonable timescale (van Hoof et al. 2010). Molecular hydrogen formation in the knots is expected to be substantial after the central star entered the cooling track and underwent a strong drop in luminosity, and may still be ongoing at this moment, depending on the density of the knots and the properties of the grains in the knots and assuming the knots formed quickly. Especially in the latter case we expect a tight correlation between the dust emission and the H2 emission (van Hoof et al. 2010) as is observed in the Helix nebula.
The possible effect of the UV emission on the H2 is investigated in Fig. 7. H2 contours are overlaid on the ratio of the SPIRE 250 m image to the NUV Galex image. We see that the strong dust and H2 emission originates just outside the peaks of NUV emission at the edges of the nebula and in the extensions. It is in these regions where the H2 and dust emission coincides best. When we overplot the H2 contours on the ratio image of the SPIRE 250 m MD to NUV images, we notice that the H2 emission is situated at the inner edge where this ratio is very high. This is in agreement with what was found by Aleman et al. (2011): if the cometary knot is beyond the Helix ionization front, then there is no ionized region, the knot is completely neutral and there would be not enough radiation or temperature to excite significantly the upper vibrational levels of the molecule. The 1–0 S(1) intensity would be very low. In the south where there is relatively more NUV flux to dust emission the H2 emission is relatively strong.
To compare the molecular with the ionized component we obtained an H image from Corradi et al. (2003) and O’Dell (1998). We convolved the image to the SPIRE 250 m beam (Aniano et al. 2011) with flux conservation and rebinned it to a pixel size of 45. We took the ratio of the convolved H2 image to this H image. The resulting image is shown in Fig. 9. The density structure has virtually disappeared and we see the rapid decrease of the ionizing radiation field outwards beyond the inner ring. We see that the ionized region is mainly contained within the molecular and dust region. The dust and molecular emission is not particularly strong inside the barrel, because the influence of the stellar radiation field is significant.
9 Conclusion
We presented Herschel PACS and SPIRE images of the Helix nebula. The dust emission is clumpy and predominantly present in the barrel wall. We presented consistent photometry of the Helix without its halo and determined its spectral energy distribution. The emissivity index of , in combination with the carbon rich molecular chemistry of the nebula, indicates that the dust consists mainly of amorphous carbon. We determined an average dust temperature of 30.8 K 1.4. We detected the central star disk at 70 m, confirming the result of Su et al. (2007). At other Herschel wavelengths we only have upper limits, hence the dust temperature of the disk of 65 K is only an estimate. The dust mass column density map reflects the clumpiness of the dust. The dust mass of the main nebula is 3.5 10-3 M⊙ at a distance of 216 pc. The temperature map shows a variation in dust temperature between 22 42 K. This is similar to the kinetic temperature of the molecular gas and indicates that the dust and molecular gas co-exist in the dense clumps. We compared the SPIRE 250 m image with images at other wavelengths to determine the extent and morphology of the dust, molecular, and ionized component in the nebula. The morphology of the different components can be understood adopting the thick walled barrel-like model tilted about 10° east relative to the line of sight from Zeigler et al. (2013). The radiation field decreases rapidly outwards in the barrel wall. The very good coincidence between the H2 and the dust emission in the barrel wall suggests the formation of H2 on dust grains.
Acknowledgements.
Herschel is an ESA space observatory with science instruments provided by European-led Principal Investigator consortia and with important participation from NASA. PACS has been developed by a consortium of institutes led by MPE (Germany) and including UVIE (Austria); KU Leuven, CSL, IMEC (Belgium); CEA, LAM (France); MPIA (Germany); INAF-IFSI/OAA/OAP/OAT, LENS, SISSA (Italy); IAC (Spain). This development has been supported by the funding agencies BMVIT (Austria), ESA-PRODEX (Belgium), CEA/CNES (France), DLR (Germany), ASI/INAF (Italy), and CICYT/MCYT (Spain).” SPIRE has been developed by a consortium of institutes led by Cardiff University (UK) and including Univ. Lethbridge (Canada); NAOC (China); CEA, LAM (France); IFSI, Univ. Padua (Italy); IAC (Spain); Stockholm Observatory (Sweden); Imperial College London, RAL, UCL-MSSL, UKATC, Univ. Sussex (UK); and Caltech, JPL, NHSC, Univ. Colorado (USA). This development has been supported by national funding agencies: CSA (Canada); NAOC (China); CEA, CNES, CNRS (France); ASI (Italy); MCINN (Spain); SNSB (Sweden); STFC (UK); and NASA (USA) HCSS / HSpot / HIPE is a joint development (are joint developments) by the Herschel Science Ground Segment Consortium, consisting of ESA, the NASA Herschel Science Center, and the HIFI, PACS and SPIRE consortia. This research made use of tools provided by Astrometry.net. Some of the data presented in this paper were obtained from the Multimission Archive at the Space Telescope Science Institute (MAST). STScI is operated by the Association of Universities for Research in Astronomy, Inc., under NASA contract NAS5-26555. Support for MAST for non-HST data is provided by the NASA Office of Space Science via grant NNX09AF08G and by other grants and contracts. P.v.H. and the PACS ICC in Leuven wish to acknowledge support from the Belgian Science Policy office through the ESA PRODEX programme. ME, JRG and JC thank the Spanish MINECO for funding support from grants CSD2009-00038, AYA2009-07304 and AYA2012-32032.References
- Aleman et al. (2011) Aleman, I., Zijlstra, A. A., Matsuura, M., Gruenwald, R., & Kimura, R. K. 2011, MNRAS, 416, 790
- Aniano et al. (2011) Aniano, G., Draine, B. T., Gordon, K. D., & Sandstrom, K. 2011, PASP, 123, 1218
- Bachiller et al. (1997) Bachiller, R., Forveille, T., Huggins, P. J., & Cox, P. 1997, A&A, 324, 1123
- Benedict et al. (2009) Benedict, G. F., McArthur, B. E., Napiwotzki, R., et al. 2009, AJ, 138, 1969
- Casassus et al. (2004) Casassus, S., Readhead, A. C. S., Pearson, T. J., et al. 2004, ApJ, 603, 599
- Cazaux & Tielens (2002) Cazaux, S. & Tielens, A. G. G. M. 2002, ApJ, 575, L29
- Cazaux & Tielens (2004) Cazaux, S. & Tielens, A. G. G. M. 2004, ApJ, 604, 222
- Corradi et al. (2003) Corradi, R. L. M., Schönberner, D., Steffen, M., & Perinotto, M. 2003, MNRAS, 340, 417
- Cox et al. (1998) Cox, P., Boulanger, F., Huggins, P. J., et al. 1998, ApJ, 495, L23
- Etxaluze et al. (2014) Etxaluze, M., Cernicharo, J., Goicoechea, J. R., et al. 2014, A&A, 566, A78
- García-Segura et al. (2006) García-Segura, G., López, J. A., Steffen, W., Meaburn, J., & Manchado, A. 2006, ApJ, 646, L61
- Gledhill et al. (2002) Gledhill, T. M., Bains, I., & Yates, J. A. 2002, MNRAS, 332, L55
- Goldsmith (2001) Goldsmith, P. F. 2001, ApJ, 557, 736
- Griffin et al. (2010) Griffin, M. J., Abergel, A., Abreu, A., et al. 2010, A&A, 518, L3
- Groenewegen et al. (2011) Groenewegen, M. A. T., Waelkens, C., Barlow, M. J., et al. 2011, A&A, 526, A162
- Henry et al. (1999) Henry, R. B. C., Kwitter, K. B., & Dufour, R. J. 1999, ApJ, 517, 782
- Hildebrand (1983) Hildebrand, R. H. 1983, QJRAS, 24, 267
- Hora et al. (2006) Hora, J. L., Latter, W. B., Smith, H. A., & Marengo, M. 2006, ApJ, 652, 426
- Huggins & Frank (2006) Huggins, P. J. & Frank, A. 2006, in IAU Symposium, Vol. 234, Planetary Nebulae in our Galaxy and Beyond, ed. M. J. Barlow & R. H. Méndez, 271–276
- Huggins & Healy (1986) Huggins, P. J. & Healy, A. P. 1986, MNRAS, 220, 33P
- Knapp et al. (1993) Knapp, G. R., Sandell, G., & Robson, E. I. 1993, ApJS, 88, 173
- Matsuura et al. (2009) Matsuura, M., Speck, A. K., McHunu, B. M., et al. 2009, ApJ, 700, 1067
- Meaburn et al. (2013) Meaburn, J., Boumis, P., & Akras, S. 2013, MNRAS, 435, 3462
- Meaburn et al. (2005) Meaburn, J., Boumis, P., López, J. A., et al. 2005, MNRAS, 360, 963
- Meaburn et al. (1998) Meaburn, J., Clayton, C. A., Bryce, M., et al. 1998, MNRAS, 294, 201
- Meaburn et al. (2008) Meaburn, J., López, J. A., & Richer, M. G. 2008, MNRAS, 384, 497
- Meixner et al. (2005) Meixner, M., McCullough, P., Hartman, J., Son, M., & Speck, A. 2005, AJ, 130, 1784
- Mennella et al. (1998) Mennella, V., Brucato, J. R., Colangeli, L., et al. 1998, ApJ, 496, 1058
- Mennella et al. (1995) Mennella, V., Colangeli, L., & Bussoletti, E. 1995, A&A, 295, 165
- Napiwotzki (1999) Napiwotzki, R. 1999, A&A, 350, 101
- O’Dell (1998) O’Dell, C. R. 1998, AJ, 116, 1346
- O’Dell et al. (2004) O’Dell, C. R., McCullough, P. R., & Meixner, M. 2004, AJ, 128, 2339
- O’Dell et al. (2007) O’Dell, C. R., Sabbadin, F., & Henney, W. J. 2007, AJ, 134, 1679
- Ott (2010) Ott, S. 2010, in Astronomical Society of the Pacific Conference Series, Vol. 434, Astronomical Data Analysis Software and Systems XIX, ed. Y. Mizumoto, K.-I. Morita, & M. Ohishi, 139
- Padin et al. (2002) Padin, S., Shepherd, M. C., Cartwright, J. K., et al. 2002, PASP, 114, 83
- Pilbratt et al. (2010) Pilbratt, G. L., Riedinger, J. R., Passvogel, T., et al. 2010, A&A, 518, L1
- Planck Collaboration et al. (2014) Planck Collaboration, Arnaud, M., Atrio-Barandela, F., et al. 2014, ArXiv:1403.4723
- Poglitsch et al. (2010) Poglitsch, A., Waelkens, C., Geis, N., et al. 2010, A&A, 518, L2
- Roussel (2013) Roussel, H. 2013, PASP, 125, 1126
- Speck et al. (2002) Speck, A. K., Meixner, M., Fong, D., et al. 2002, AJ, 123, 346
- Su et al. (2007) Su, K. Y. L., Chu, Y.-H., Rieke, G. H., et al. 2007, ApJ, 657, L41
- Tenenbaum et al. (2009) Tenenbaum, E. D., Milam, S. N., Woolf, N. J., & Ziurys, L. M. 2009, ApJ, 704, L108
- Ueta et al. (2014) Ueta, T., Ladjal, D., Exter, K. M., et al. 2014, A&A, 565, A36
- van Hoof et al. (2012) van Hoof, P. A. M., Barlow, M. J., Van de Steene, G. C., et al. 2012, in IAU Symposium, Vol. 283, IAU Symposium, 41–44
- van Hoof et al. (2010) van Hoof, P. A. M., Van de Steene, G. C., Barlow, M. J., et al. 2010, A&A, 518, L137
- van Hoof et al. (2000) van Hoof, P. A. M., Van de Steene, G. C., Beintema, D. A., et al. 2000, ApJ, 532, 384
- van Hoof et al. (2013) van Hoof, P. A. M., Van de Steene, G. C., Exter, K. M., et al. 2013, A&A, 560, A7
- Young et al. (1999) Young, K., Cox, P., Huggins, P. J., Forveille, T., & Bachiller, R. 1999, ApJ, 522, 387
- Zack & Ziurys (2013) Zack, L. N. & Ziurys, L. M. 2013, ApJ, 765, 112
- Zeigler et al. (2013) Zeigler, N. R., Zack, L. N., Woolf, N. J., & Ziurys, L. M. 2013, ApJ, 778, 16
- Zhang et al. (2012) Zhang, Y., Hsia, C.-H., & Kwok, S. 2012, ApJ, 755, 53