A Chandra Observation of the Eclipsing Wolf-Rayet
Binary CQ Cep
Abstract
The short-period (1.64 d) near-contact eclipsing WN6O9 binary system CQ Cep provides an ideal laboratory for testing the predictions of X-ray colliding wind shock theory at close separation where the winds may not have reached terminal speeds before colliding. We present results of a Chandra X-ray observation of CQ Cep spanning 1 day during which a simultaneous Chandra optical light curve was acquired. Our primary objective was to compare the observed X-ray properties with colliding wind shock theory, which predicts that the hottest shock plasma (T 20 MK) will form on or near the line-of-centers between the stars. The X-ray spectrum is strikingly similar to apparently single WN6 stars such as WR 134 and spectral lines reveal plasma over a broad range of temperatures T 4 - 40 MK. A deep optical eclipse was seen as the O star passed in front of the Wolf-Rayet star and we determine an orbital period Porb = 1.6412400 d. Somewhat surprisingly, no significant X-ray variability was detected. This implies that the hottest X-ray plasma is not confined to the region between the stars, at odds with the colliding wind picture and suggesting that other X-ray production mechanisms may be at work. Hydrodynamic simulations that account for such effects as radiative cooling and orbital motion will be needed to determine if the new Chandra results can be reconciled with the colliding wind picture.
1 Introduction
Massive WRO binary systems are luminous X-ray sources with typical luminosities Lx 1032.5 - 1034 ergs s-1. The origin of their X-ray emission is complex and multiple processes may contribute. X-rays can arise in the powerful winds of either star and an additional component can originate in a colliding wind shock that forms between the stars.
X-ray emission from the O-star in WRO binaries is expected since single O stars are X-ray sources and their X-ray luminosity is correlated with bolometric luminosity Lx 10-7Lbol (Pallavicini et al. 1981; Berghöfer et al. 1996; 1997). Soft X-ray emission (kT 1 keV) in O stars is usually attributed to radiative shocks that form in their winds as a result of line-driven instabilities (Lucy & White 1980; Owocki et al. 1988; Feldmeier et al. 1997). Some observational support for this process has been found in objects like the O4 star Puppis (Cassinelli et al. 2001; Kahn et al. 2001). But if the star has a strong magnetic field then harder X-rays (kT 2 keV) may be produced in shocks near the magnetic equator via magnetic wind confinement (Babel & Montmerle 1997; ud-Doula & Owocki 2002).
In the case of WNO binaries, the nitrogen-type WN star may also be an X-ray source since several apparently single WN stars have been detected in X-rays with typical luminosities Lx 1031.5 - 1033 ergs s-1 (Skinner et al. 2010; 2012). Their X-ray spectra usually show both a soft and hard X-ray component. The soft emission could arise in radiative wind shocks, similar to that theorized for single O stars (Gayley & Owocki 1995). However, the origin of the hard X-ray component in putatively single WN stars is so far unexplained. Single carbon-type (WC) Wolf-Rayet stars have not yet been detected in X-rays with upper limits as stringent as Lx 1029.8 ergs s-1 (Skinner et al. 2006).
Even though single WC stars have so far eluded X-ray detection, WCO binaries have been detected as strong X-ray sources as well as WNO binaries. The most extensively studied WRO binaries are the brightest in X-rays and are believed to produce a substantial fraction of their X-ray emission from colliding wind shocks, namely Vel (WC8 O7.5; Porb = 78.5 d; Willis, Schild, & Stevens 1995; Skinner et al. 2001; Schild et al. 2004), WR 140 (WC7 O4-5V; Porb = 2900 d; Zhekov & Skinner 2000; Pollock et al. 2005), and WR 147 (WN8 OB; Skinner et al. 2007; Zhekov & Park 2010). An X-ray study of short-period WR O binaries (Porb 23 d) based on archival data was presented by Zhekov (2012) who argued for the presence of a colliding wind shock component.
The X-ray emission of WRO binaries is almost always unresolved with existing telescopes and typically includes both a soft and hard component. At least some of the hard emission (kT 2 keV) is thought to originate in colliding wind shocks (Cherepaschuk 1976; Prilutski & Usov 1976; Usov 1992). But for WNO systems this may not be the whole story since apparently single WN stars without known companions always show a hard component in their spectra. Thus, the WN star itself may contribute to the X-ray emission of WNO binaries.
Disentangling the stellar and colliding wind X-ray contributions from WRO binaries based on the spectrum of a spatially unresolved source is challenging because the various contributions are superimposed in the composite spectrum. High-resolution X-ray grating spectra can provide constraints on where individual emission lines are formed in the system but such spectra are only available for a few of the brightest WRO binaries.
Another approach to identifying separate X-ray contributions in WR O binaries is to observe eclipsing systems. When the orbit is highly inclined (i.e. viewed nearly edge-on), orbital modulation of the X-ray emission can occur. For example, the hottest colliding wind shock plasma is expected to have temperatures of several keV for typical terminal wind speeds of O-type and WR stars ( 1000 - 2000 km s-1) and is predicted by numerical hydrodynamic models to lie on the line-of-centers between the stars (Luo et al. 1990; Stevens et al. 1992). In that case, the hottest colliding wind plasma will be visible near quadrature but will be partially occulted in high-inclination systems during primary and secondary eclipse. Thus, the observed emission measure of the hot plasma component should vary with orbital phase. Additionally, large variations in X-ray absorption are anticipated with higher absorption occurring at orbital phases when the WR star is in front of the O star and the system is viewed through the dense metal-rich WR wind. Such orbital variations in absorption have indeed been observed in well-studied binaries such as Vel and WR 140.
We present here the results of a Chandra observation of the short-period eclipsing Wolf-Rayet binary CQ Cep covering more than half an orbit. Our primary objectives were to search for X-ray modulation that should occur during eclipses if hot localized colliding wind shock plasma is located on the line-of-centers and make comparisons between the observed X-ray properties and analytic predictions from colliding wind theory. Somewhat surprisingly, no significant X-ray modulation was detected.
2 CQ Cep
The properties of our target CQ Cep ( = WR 155 = HD 214419) are summarized in Table 1. It is a close binary system consisting of a WN6 nitrogen-type WR star and a O9 companion. The luminosity class of the O9 companion remains rather uncertain because spectral features clearly associated with the O star have been difficult to identify in optical spectra. The O star was classified as O9 II-Ib by Marchenko et al. (1995) but a O9 III-V classification was suggested by Demircan et al. (1997; hereafter De97). Harries & Hilditch (1997) concluded that the inferred O star radius is consistent with a main sequence object. The orbital period determined by De97 is Porb = 1.6412299 d (= 141.8 ks) but slightly different values have been obtained in other studies (Sec. 5.5). The orbit is nearly circular (Marchenko et al. 1995) and is viewed almost edge on with high inclination 70∘ (De97; Harries & Hilditch 1997; Villar-Sbaffi et al. 2005). The masses and radii of the two components are nearly equal and their separation is 20.4 R⊙, placing the two stars nearly in contact (De97). Because of the close separation, CQ Cep presents an opportunity to search for colliding wind shock emission in an eclipsing system where the winds may not have reached terminal speeds before colliding.
CQ Cep was detected in X-rays by the Einstein Observatory (Pollock 1987) and in a 1998 ASCA observation (sequence numbers 26024000, 26025000, 26026000; 45 ks total duration). Our fits of the archived ASCA spectra show that both a cool (kTcool 1 keV) and hot (kThot 2 keV) plasma component are present. Although the ASCA data provide a useful first-look spectrum and X-ray flux estimates, the signal-to-noise ratio is low and the X-ray properties are not tightly constrained. In order to more accurately characterize the X-ray spectrum and search for orbital variability we obtained a more sensitive Chandra X-ray observation along with a simultaneous Chandra optical light curve.
3 Chandra Observation
The Chandra observation (ObsId 14538) began on 19 March 2013 at 12:56:12 TT (= 12:55:05 UTC) and ended on 20 March at 12:43:09 TT (= 12:42:02 UTC) with an exposure live time of 79,391 s. The start time corresponds to MJD = 56370.538252 (UTC) or HJD = 2456371.0353215 (UTC). Based on the time of primary optical minimum given by Demircan et al. (1997), the start time corresponds to orbital phase = 0.92 and the stop time to phase = 0.52, where = 0.0 corresponds to O star in front. However, the predicted orbital phases corresponding to the Chandra start and stop times depend on the historical reference data used for optical minimum light, as discussed further in Section 5.5. Exposures were obtained using the ACIS-S (Advanced CCD Imaging Spectrometer) array in FAINT timed-event mode. CQ Cep was placed at the nominal aimpoint on the ACIS-S3 CCD which was configured in 1/4 subarray mode. The use of subarray mode restricts the field-of-view to a rectangular region of 256 1024 native pixels, or 126′′ 504′′ at the native pixel size of 0.′′492. Subarray mode was selected in order to use a short 0.84 s frame time that would mitigate any photon pileup (none occurred). For an on-axis point source, the ACIS-S 90% encircled energy radius at 1.4 keV is R90 0.′′9. Optical monitoring of CQ Cep was carried out during the observation using the Aspect Camera Assembly (ACA) and a photometric light curve was generated using the script. Further information on Chandra and its instrumentation can be found in the Chandra Proposer’s Observatory Guide (POG)555See http://asc.harvard.edu/proposer/POG.
The pipeline-processed data files provided by the Chandra X-ray Center (CXC) were analyzed using standard science threads with CIAO version 4.6.1666Further information on Chandra Interactive Analysis of Observations (CIAO) software can be found at http://asc.harvard.edu/ciao.. The CIAO processing used recent calibration data from CALDB 4.6.1.1. Source events, spectra, and light curves were extracted from a circular region of radius 1.′′8 centered on the X-ray peak. Background was extracted from nearby source-free regions. Background is negligible, amounting to less than 1 count (0.2 - 8 keV) within the extraction circle during the full exposure. CIAO specextract was used to extract spectra along with source-specific response matrix files (RMFs) and auxiliary response files (ARFs). Spectral fitting, timing analysis, and image analysis were undertaken with the HEASOFT v. 6.1.6777http://heasarc.gsfc.nasa.gov/docs/xanadu/xanadu.html. software package including XSPEC vers. 12.8.2. Additional tests for source variabilility were carried out on energy-filtered source event lists using the Bayesian-method CIAO tool glvary (Gregory & Loredo 1992, 1996).
4 Results
CQ Cep was clearly detected. Its X-ray properties are summarized in Table 2.
4.1 Image Analysis
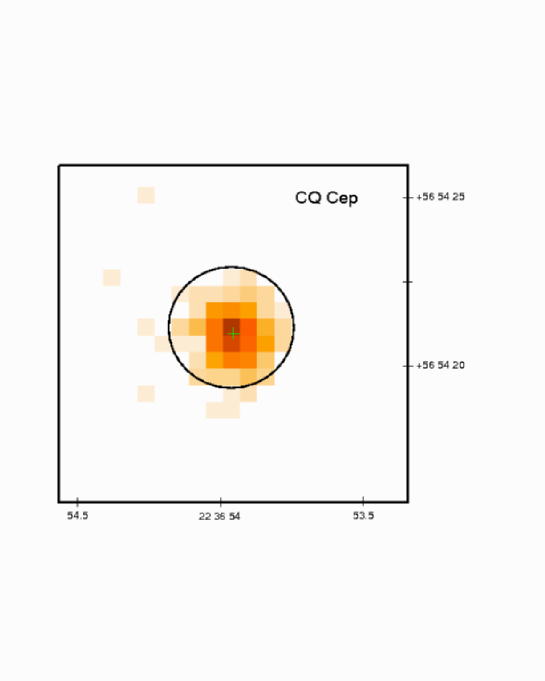
The broad-band X-ray image is shown in Figure 1. The X-ray centroid is in excellent agreement with the Hubble Space Telescope Guide Star Catalog (GSC vers. 2.3.2) position of CQ Cep. In order to check for possible extended source structure, we generated a simulated Chandra point-spread-function (PSF) image using the Chart and MARX888http://space.mit.edu/ASC/MARX/ software tools, following recommended CIAO science thread procedures. The simulated PSF takes into account the position of the source on the ACIS-S detector and the source spectrum. Using this PSF, the CIAO tool determines that the X-ray source is not extended at 90% confidence. Thus, CQ Cep is detected as a point source at Chandra’s spatial resolution.
4.2 Timing Analysis
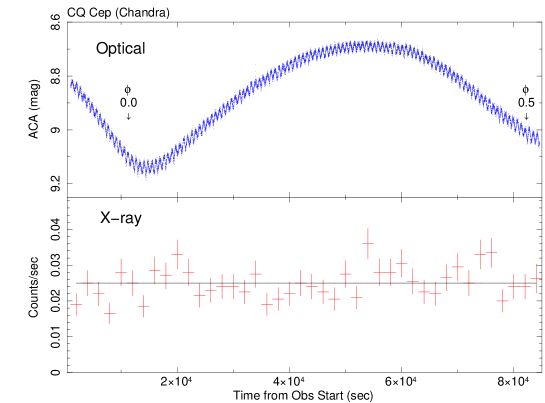
Figure 2 shows the broad-band (0.2 - 8 keV) and hard-band (2 - 8 keV) X-ray light curves of CQ Cep along with the ACA optical light curve. No large-amplitude X-ray variability is seen but fluctuations at the 2 level are present in the broad-band light curve. The CIAO tool gives a probablility of constant count rate Pconst = 0.77 (0.2 - 8 keV) and analysis of the light curve binned at 2000 s intervals gives Pconst = 0.43 (0.2 - 8 keV). In the soft band gives Pconst = 0.87 (0.2 - 2 keV) and in the hard band Pconst = 0.89 (2 - 8 keV). Based on the above tests, variability is unlikely but not strictly ruled out.
As a further check for variability, we computed the median photon energies (E50) and hardness ratios (H.R.) for the first and second halves of the observation. We define the hardness ratio as H.R. = (H S)/(H S) where H and S are the counts measured in the hard (2 - 8 keV) and soft (0.2 - 2 keV) bands. For the first half we obtained E50 = 1.76 keV and H.R. = 0.280. For the second half, E50 = 1.77 keV and H.R. = 0.276. The values for both halves are nearly identical.
The X-ray count rates based on light curves binned at 2000 s intervals are given in Table 3 for three different energy bands. A slight increase in count rate in the second half of the observation is seen in all three bands. The increase amounts to 10% in the broad (0.2 - 8 keV) and soft (0.2 - 2 keV) bands and 7% in the hard (2 - 8 keV) band. Since the small increase is present in all bands it could well be real but the significance of the increase is low, amounting to at most 0.5 - 0.6.
In contrast, the optical light curve is clearly variable. A large drop in brightness of 0.5 ACA mag999The zero instrument magnitude is defined as the ACA response to a zero magnitude G0V star. For the conversion from V and B magnitude to the ACA system see: http://cxc.harvard.edu/proposer/POG/html/chap5.html. occurs during the first 15 ks with minimum brightness at t = 14.46 0.02 ks after the start of the observation. This minimum corresponds to orbital phase = 0.023 using the time-of-minimum light equation of De97: HJD = 2450267.43158 0.00077 (1.6412299 0.0000002 d)E, where the O star is in front of the WR star at = 0.0. Thus, the minimum in the Chandra optical light curve occurred 3.26 ks after the time predicted by the De97 elements (Fig. 2-top). This difference cannot be explained by the small formal uncertainties in the elements of De97. The uncertainty in their HJD reference date could account for 66 s of the difference and their orbital period uncertainty could account for an additional 64 s when propagated forward to the epoch of the Chandra observation (3718.92 orbits). This raises the question of whether the true uncertainties in the orbital period of De97 may actually be larger than their quoted values or whether the period might be variable. Both possibilities are discussed further in Section 5.5.
4.3 Spectral Analysis
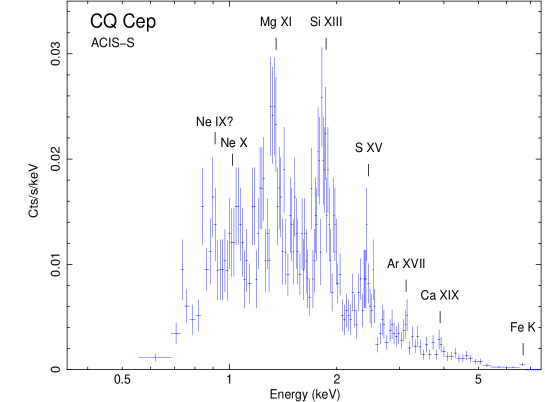
The Chandra ACIS-S spectrum of CQ Cep is shown in Figure 3. Several emission lines and line blends are present including high-temperature lines such as S XV at 2.46 keV (maximum line power temperature log Tmax = 7.2 K), Ar XVII at 3.13 keV (log Tmax = 7.3 K), Ca XIX at 3.90 keV (log Tmax = 7.5 K), and a faint feature at 6.67 keV that is likely weak Fe K dominated by Fe XXV (log Tmax = 7.6 K). Emission features at lower energies that trace cooler plasma include possible detections of the Ne IX He-like triplet at 0.91 keV (log Tmax = 6.6 K) and Ne X at 1.02 keV (log Tmax = 6.7 K). Thus, the X-ray plasma spans a broad range of temperatures from 4 MK up to 40 MK. Since the spectrum becomes heavily absorbed at E 0.7 keV, any cooler plasma at T 4 MK that may be present would have escaped detection.
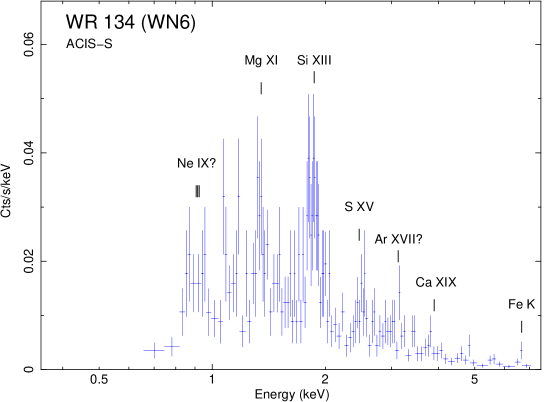
The bottom panel of Figure 3 shows a comparison spectrum of the WN6 star WR 134 based on a previous Chandra ACIS-S observation (Skinner et al. 2010). It is noteworthy that its spectrum is quite similar to that of CQ Cep despite the fact that WR 134 is not known to be a binary. This suggests that the WN star in CQ Cep dominates the observed X-ray emission.
We have attempted to fit the CQ Cep spectrum with a variety of different XSPEC models. We have focused on optically-thin plasma models ( and its variable abundance version ) since the X-ray spectra of WN stars and close WRO binaries are generally well-fitted by such models (Skinner et al. 2010, 2012; Zhekov 2012). But we have also considered a constant-temperature plane-parallel shock model ( and its variable abundance version )101010Further information on XSPEC models can be found at: http://heasarc.gsfc.nasa.gov/xanadu/xspec/manual/Models.html.. All models included a solar-abundance absorption component to account for interstellar medium (ISM) absorption and its value was held fixed at NH,ISM = 2.2 1021AV (Gorenstein 1975) = 4.4 1021 cm-2 corresponding to AV = 2 mag. We also allowed for additional absorption that is usually present in WR star X-ray spectra as a result of their winds. Wind abundances for the O star are expected to be near-solar in composition whereas WN wind abundances are H-depleted and N-enriched (van der Hucht, Cassinelli, & Williams 1986). Our fits confirmed that excess absorption is present in CQ Cep and models with two plasma temperature components (2T) generally provided better fits as determined by the statistic than models with only one temperature component (1T).
Table 4 summarizes three representative spectral fits using a 2T optically thin plasma model and one fit using a 2T plane-parallel shock model. Each model includes a fixed ISM absorption component as well as separate independent wind absorption components for the cool and hot plasma. In model A all abundances were assumed to be solar while in model B the source and wind-absorption abundances were held fixed at the generic values for WN stars given by van der Hucht et al. (1986). In model C the source and wind-absorption abundances of the cool component were fixed at solar values (as expected for the O star) and those for the hot component were fixed at generic WN values. Model D uses the same abundance assumptions as model C but the 2T optically thin plasma model is replaced by a 2T plane-parallel shock model.
Even though the abundance assumptions for the models in Table 4 are different, the best-fit plasma temperatures (kT), absorbed fluxes, and unabsorbed X-ray luminosities (Lx) are all quite similar. Thus, the model results are not very sensitive to abundance assumptions. All models require a cool plasma component at kT1 0.6 keV and a hotter component at kT2 2 - 3 keV. These temperatures are comparable to those found for other close WNO binaries (Zhekov (2012) as well as single WN stars (Skinner et al. 2010; 2012). The models in Table 4 give log Lx = 33.25 - 33.48 ergs s-1 (0.3 - 8 keV) at d = 3.5 kpc. These values place CQ Cep at the high end of the X-ray luminosity range observed for WR stars (Pollock 1987). The above Lx range overlaps that of other close WNO binaries (Fig. 2 of Zhekov 2012) but is also similar to that of a few of the brightest putatively single WN6 stars such as WR 20b and WR 24 (Skinner et al. 2010).
Of the models in Table 4, the 2T model (model D) provides a slightly better fit than the other models as gauged by statistics. It also yields a somewhat higher value of kT2 and Lx than the 2T models. The slightly better fit obtained with the model is due to its ability to fully reproduce the fluxes of the stronger emission line complexes, which are generally underestimated by the models. This may be a clue that non-equilibrium ionization (NEI) effects taken into account by the model (Borkowski, Sarazin, & Blondin 1994) are important but higher resolution grating spectra capable of resolving individual line complexes (e.g. He-like triplets) would be needed to confirm this.
Finally, we note that the absorbed flux measured from the best-fit model applied to data from the first half of the exposure is 4% less than that obtained by fitting data from the second half. Specifically, the absorbed fluxes measured from the first and second halves in the 0.3 - 8 keV range and their 90% confidence ranges are (in units of 10-13 ergs cm-2 s-1): Fx,first = 2.03 [0.80 - 2.25] and Fx,second = 2.11 [0.93 - 2.32]. The small increase in measured flux provides additional support for the conclusion based on count rates (Table 3) that the source was slightly brighter during the second half of the observation, but the 90% confidence ranges of the measured fluxes are large enough to be consistent with no flux variability at all.
5 Discussion
5.1 Colliding Wind Predictions
5.1.1 Wind Ram Balance and Stagnation Point
In order to compare the observational results with predictions of colliding wind theory we must first determine the location of the stagnation point where the shock contact discontinuity surface intersects the line-of-centers between the stars. As a first approximation we assume radial outflow, neglect orbital motion (Sec. 5.2), and consider one-dimensional wind momentum balance. If the distance from the center of the O star to the stagnation point is and the distance from the center of the WR star to stagnation point is = - , where is the binary separation, then the necessary condition for wind ram balance is (eq. [1] of Stevens et al. 1992)
| (1) |
If the winds were accelerated near-instantaneously to their terminal speeds V∞ then the wind parameters in Table 1 would give = 2.35 R⊙ so ram balance could not be achieved and the higher momentum WR wind would shock onto the surface of the O star. But because of the close binary separation of CQ Cep the winds are not expected to reach terminal speed along the line of centers. Thus it is appropriate to use standard wind velocity profiles in equation (1) of the form = where 0.8 - 1.0 is typical for hot stars (Lamers & Cassinelli 1999). Defining the dimensionless ratios PWR/O /, , and for (De97) the above becomes
| (2) |
The above equation is analogous to equation (4) of Gayley, Owocki, & Cranmer (1997; hereafter GOC97) except that we have not assumed the WR wind to have reached terminal speed at the stagnation point. The last term on the right accounts for radiative braking of the WR wind by the O star radiation field where is the reflection fraction of the O-star radiative momentum deposited into the WR wind near the interaction region. The ratio of wind to radiative momentum of the O star is = ( = 0.46, where is the speed of light and = 1.16 105 L⊙ (De97) is the luminosity of the O star. The case = 0 corresponds to no braking and reasonable limits on for the present case are 0.5 2, where the upper limit 2 corresponds to complete back reflection (GOC97).
Adopting = 20.4 R⊙ and RWR RO9 = 8.2 R⊙ yields 0.4 and the above equation must be satisfied for 0.4 0.6 to achieve ram balance between the stars. If braking is ignored ( = 0) and the right side of the above expression is considered as a function versus then it is easily seen that = 0, = 1, and as 0.6. Thus, if the two stars had identical winds then ram balance would be achieved at the midpoint = 0.5. But for CQ Cep we have = 58.5 (Table 1) and ram balance can only be achieved at or near the WR star surface ( 0.599) where the WR wind is at effectively zero speed. This extreme condition tells us that the O star wind lacks sufficient momentum to achieve balance between the stars and again we conclude that the WR wind overpowers the O star wind and the shock forms at or very near the O star surface ( 0.4). If radiative braking is included then the above conclusion does not change even for complete back reflection ( 2).
In the above ram balance calculation, we have assumed a wind velocity law of the form = and for we have used the photospheric radius. That is, we have implicitly assumed that the winds of both stars are accelerated from zero speed starting at the photosphere. This may be an oversimplification for WR stars for which there is some observational evidence that the wind has already reached appreciable speed at the photosphere (e.g. Schmutz 1997). The precise form of the wind acceleration law in the optically thick part of the wind below the photosphere is not well-known but the acceleration is thought to be slow ( 5; Nugis & Lamers 2002). It is obvious that if the WR wind is already at non-zero speed at the photosphere, then the WR wind momentum between the stars is greater than we have assumed above, strengthening the conclusion that the WR wind dominates the O star wind.
5.1.2 Maximum Shock Temperature
In its basic formulation, colliding wind shock theory predicts that the hottest plasma occurs along the line-of-centers between the stars near the stagnation point. For an adiabatic shock the maximum plasma temperature is predicted to be
| (3) |
where is the mean mass (amu) per particle in the wind and is the wind velocity component perpendicular to the shock front (Fig. 4; Luo et al. 1990; Stevens et al. 1992). The shocked plasma will span a range of temperatures with cooler plasma present on the wings of the shock so the average temperature as determined from X-ray observations will be less than the maximum shock temperature given above. If the winds have reached terminal speeds ( 2000 km s-1) then maximum plasma temperatures of several keV are expected, But if the winds have not reached terminal speeds before colliding, as is likely the case for near-contact systems such as CQ Cep, the maximum shock temperature will be lower and the intrinsic X-ray spectrum will thus peak at lower energies.
To be more specific, we use the same wind velocity law as above = where is the distance from the center of the WR star and = 0.8. For a binary separation = 20.4 R⊙ and stellar radii = 8.2 R⊙ and = 8.23 R⊙ (De97), the velocity of the WR wind at the O-star surface ( 12.2 R⊙) is = 0.41 836 km s-1 for = 2040 km s-1. The above sub-terminal speed gives kTcw,max 1.8 keV for a He-dominated WN star wind ( = 4/3). Because of its close binary separation, CQ Cep is expected on theoretical grounds to be in the non-adiabatic regime ( 1 in eq. [8] of St92), and in that case radiative cooling will further soften the spectrum and any radiative braking of the WN wind by the O star’s radiation field would also reduce VWR. Taking these factors qualitatively into account and recalling that the observed temperature is an average and not a maximum value, we expect kTcw,obs kTcw,max 1.8 keV.
This above upper limit kTcw,max 1.8 keV should only be considered a rough estimate since it is sensitive to the assumed wind velocity profile, WN abundances, and stellar radii (Table 4 of De97), all of which are uncertain. Comparing the above upper limit with the hot plasma temperatures in Table 4, one can see that it is consistent with the lower temperatures of models A and B but not with the higher temperatures of models C and D. This discrepancy may not be significant in light of the uncertainties in the stellar parameters and wind velocity profile. As we have noted above (Sec. 5.1.1) the WR wind may be slowly accelerated below the photosphere and speeds at the photosphere of several hundred km s-1 are possible (Nugis & Lamers 2002). In that case the WR wind speed as it impacts the O star surface would be greater than assumed above, leading to higher maximum shock temperatures.
5.1.3 Colliding Wind X-ray Luminosity
The predicted X-ray luminosity of a colliding wind shock impacting the O star surface in the radiative case is /4) (eq. [80] of Usov 1992), where is the wind mass density, is the terminal speed of the WR wind, and is the O star radius. This can be rewritten as
| (4) |
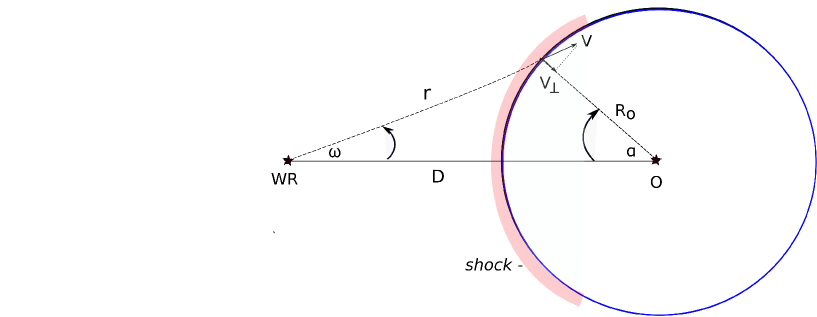
where the terminal WR wind luminosity is = (1/2) and we have used the expression for the wind mass density = /(4). Equation (4) is valid for WRO binaries where the WR wind has reached terminal speed at the shock interface and the separation between the centers of the stars is much greater than the stellar radii. But in close binaries like CQ Cep these conditions are not satisfied and equation (4) must be modified. The relevant geometry for a close binary with the WR wind shocking onto the O star surface is shown in Figure 4. The distance from the center of the WR star to the shock interface varies across the O star surface, as does the magnitude and direction of the WR wind velocity vector V(r). Also, at close separation the WR wind will in general not be at terminal speed upon impacting the O star. Taking these factors into account, the maximum colliding wind shock X-ray luminosity is given by (Appendix A)
| (5) |
where for CQ Cep we use = 20.4 R⊙, / 0.4 (De97), and the WR star terminal wind luminosity is = 4.2 1037 ergs s-1 (Table 1). The factor is a correction term that takes into account the changes in the distance and the WR wind velocity vector across the shock interface (Fig. 4; Appendix A). Evaluating numerically we obtain = 0.224 and log = 35.27 (ergs s-1) for = +0.8. Alternatively, we compute = 0.152 and log = 35.11 (ergs s-1) for = +1.0. The above predicted values are about two orders of magnitude greater than observed (Table 4).
It has been known for some time that the X-ray luminosities predicted by colliding wind theory for short-period WR binaries are about an order-of-magnitude larger than observed. Cherepashchuk (1990) suggested that the discrepancy could be accounted for if the wind is clumped. If most of the mass is lost in the form of clumps then the effective mass-loss rate of the unclumped (smooth) gas between the clumps that interacts to form the colliding wind shock is lower than the total mass-loss rate. In the Cherepashchuk (1990) picture, only 20% of the total mass-loss rate is attributed to the smooth wind, in which case the value in Table 1 would give a smooth (unclumped) mass-loss rate for CQ Cep of log 5.2 which is still too large to bring the predicted Lx into agreement with the observation. Furthermore, a large downward correction of 1.0 dex in the adopted WN star mass-loss rate (Table 1) seems very unlikely given the results of the study of Nugis, Crowther, & Willis (1998). They obtained log log = 0.19 (1 = 0.28) for WN stars. Nugis et al. applied some revisions to the clumping-independent mass-loss estimates for CQ Cep based on polarization techniques (St.-Louis et al. 1988) and found log = 4.46 (M⊙ yr-1). It thus seems that for CQ Cep there is a significant discrepancy between the observed Lx and the larger values predicted by colliding wind theory that is not currently explained by clumping-corrected WR mass-loss rates.
Another possible way to reduce the discrepancy between the predicted and the observed is to assume a smaller radius for the companion star. But if the companion is indeed an O-type star, as currently believed, then a radius less than the value = 8.23 R⊙ assumed above is quite unlikely given that almost all previous studies determine the companion radius to be 9 R⊙ (Table 4 of De97). One exception is the study of Underhill et al. (1990) which concluded that the companion could be a B0 star with radius = 6.6 R⊙, but the validity of their model has been questioned by De97. Even if the companion radius were as small as 6.6 R⊙ it would only reduce the prediction (eq. [4]) by 0.2 dex. Thus, even a companion radius at the low end of the estimated range corresponding to a B0 star is not sufficient to resolve the X-ray luminosity discrepancy with colliding wind predictions.
5.2 Orbital Effects
In the framework of the colliding wind shock picture, the X-ray emission is expected to change as the O star passes in front of the WR star. As discussed above (Sec. 5.1.1), the stagnation point will lie at or near the surface of the O star and plasma at maximum shock temperatures kTcw,max 1.8 keV should be present along the line-of-centers. Since the CQ Cep orbit is viewed at high inclination (i.e. nearly edge-on), any hot plasma at the stagnation point along the line-of-centers will be partially occulted when the O star is in front because in that viewing geometry the stagnation point lies behind the O star and is obstructed from full view. Lower X-ray absorption is also anticipated when the O star is nearly in front if the X-rays originate between the stars because the emission is then viewed through the O star wind, which is less dense than the WR wind. Shortly after the O star passes in front and the system moves toward quadrature, any hot colliding wind shock plasma located near the line-of-centers should be revealed along with an increase in observed hard-band flux (or count rate).
But our comparison of the count rates and observed fluxes between the first half of the observation when the O-star was in front and the second half show that any effect on the X-ray emission by the eclipse at = 0 was quite small, with the observed (absorbed) flux in the second half being at most 4% greater than the first half. Also, as noted (Sec. 4.2) the median photon energy and hardness ratios in the first and second halves of the observation are nearly identical. Furthermore, our fits of separate spectra extracted for the first and second halves show no significant change in the column density associated with the cool X-ray component. Since wind absorption affects mainly lower energy photons, it is the cool component that would be most affected by any changes in column density toward the source.
Since the expected orbital variability was not detected we must conclude that any existing hot colliding wind plasma is not strongly localized along the line-of-centers. It is very likely that the geometry of the wind interaction region in CQ Cep is affected by the close binary spacing and orbital motion. On the basis of asymmetric optical eclipse light curves, De97 concluded that the system is in an overcontact configuration but Harries & Hilditch (1997) found that their light curve solutions required only marginal contact. In either case, the region between the stars will be tightly confined and this will affect wind launching and acceleration. If wind development between the stars is impeded then there may be no hot colliding wind shock plasma on or near the line-of-centers. However, a colliding wind shock may still be able to form away from the line-of-centers where the WR wind is able to accelerate as it flows around the O star (see Fig. 3 of Luo et al. 1990). In this oblique geometry the maximum predicted shock temperature will be less than for a head-on wind collision because the WR wind velocity vector is no longer perpendicular to the shock interface and the projected value in eq. (3) is reduced. Since the predicted value of kTcw,max 1.8 keV for a head-on collision is already at or below the observed hot plasma temperature (kT2), any further downward correction due to oblique geometry would only worsen the agreement.
Orbital motion will also modify the shape of the wind interaction region in CQ Cep and will affect wind energetics as a result of enhanced turbulence, as has been shown in hydrodynamic simulations of the similar close binary system V444 Cyg (WN5O6; Porb = 4.2 d). The simulations of Walder (1995) show that the wind interaction zone assumes a spiral shape and is shifted in the direction opposite to orbital motion. The orbital speed of the stars in CQ Cep is 320 km s-1 assuming that the stars have similar masses (De97). This is considerably less than the terminal wind speeds (2000 km s-1) but is similar to that adopted for the WR star in V444 Cyg by Walder (1995).
Detailed hydrodynamic simulations are needed to model the geometry of the wind interaction region in CQ Cep. The development of realistic simulations will be challenging because they will need to take into account wind development and acceleration in the confined region between the stars, radiative cooling, and orbital motion. A crucial question to be answered by future simulations is whether hot colliding wind plasma at the observed Chandra temperatures of 2 - 3 keV can form in this close system and, if so, is its spatial distribution consistent with the very low levels of X-ray variability (if any) seen in the Chandra data during optical eclipse.
5.3 Comparison With Other Close WN Binaries
The absence of significant X-ray variability in CQ Cep over half an orbit is unusual for a WRO binary but at least one other close WR binary shows similar behavior. The WN3 OB system WR 46 has a complex optical light curve which shows multiple photometric periodicities of 0.14 - 0.3 d as well as radial velocity variations of 0.329 d (7.9 hr). The variability may be related to binarity as discussed in detail by Gosset et al. (2011) but other possible causes such as non-radial pulsations have also been proposed (Hénault-Brunet et al. 2011).
A 70 ks XMM-Newton observation of WR 46 was analyzed by Gosset et al. (2011), covering two cycles of the 0.329 d period. They detected both cool and hot plasma in the X-ray spectrum at temperatures similar to those found here for CQ Cep, but an additional very soft component at kT 0.2 keV may also be present. Based on statistical timing analysis in several different energy bands, they concluded that X-ray variability was possibly present but only in the lowest energy band (0.2 - 0.5 keV) and of low significance. The XMM-Newton data were also analyzed by Hénault-Brunet et al. (2011). Their broad-band (0.3 - 10 keV) EPIC light curve shows low-amplitude fluctuations at the 20% level but no results of statistical variability tests that would substantiate real variability and quantify its significance were given. Their X-ray periodogram shows a peak at a period P = 9.0 2.5 hr and a similar period may be present in UV light curves. Hénault-Brunet et al. argued that non-radial pulsations may be responsible for the low-level variability. However, a further examination of the WR 46 XMM-Newton data was carried out by Zhekov (2012) who applied analysis and concluded that the X-ray light curves are consistent with a constant count-rate source. Based on the above studies, it is clear that any X-ray variability present in the WR 46 XMM-Newton data is of low significance and even if short-period (8 - 9 hr) modulations exist they may not be due to binarity. The presence of hot plasma with little or no significant X-ray variability is reminiscent of our findings for CQ Cep and suggests that the hot X-ray plasma may not arise solely in a colliding wind shock, at least if the assumption that the hot plasma originates entirely in the close WNOB binary itself is correct.
To explain the hot X-ray plasma in WR 46, Gosset et al. suggested that a third more distant companion may be present and is orbiting the central WN3 OB system with a period longer than a few weeks. If the third object were a massive star, then the interaction of its wind with the aggregate wind of the close binary could give rise to colliding wind shock emission for which orbital X-ray variability on timescales of less than a few weeks would not be expected. This scenario could account for the lack of significant X-ray variability of WR 46 on 1-day timescales as well as the presence of hotter plasma because the winds would be at or near terminal speeds when colliding. Similarly, a hypothetical third star in a wider orbit could be invoked to explain the hot plasma and lack of short-term (1 day) X-ray variability in CQ Cep. Gaposchkin (1944) speculated that a third body could be responsible for perceived small changes in the time between primary and secondary minima in the optical light curve of CQ Cep. However, an attempt by Borkovits & Hegedüs (1995) to find a good third-body orbit for CQ Cep based on historical optical data was not successful and no optical nebulosity was detected around CQ Cep in the study of Miller & Chu (1993).
Until compelling evidence for a third star orbiting CQ Cep is presented, the possibility of intrinsic hot X-ray plasma from one or both stars in the near-contact WNOB system originating by a process other than colliding winds should not be dismissed. A point not to be overlooked here is that X-ray luminosities of WN stars for which no evidence of binarity has yet been found lie in the range log Lx = 31.14 (WR 16) - 33.57 (WR 20b) ergs s-1 (Skinner et al. 2010; 2012). This range easily encompasses the luminosities of both WR 46 (log Lx = 32.77; Zhekov 2012) and CQ Cep (Table 4). It is of course possible that some of the putatively single WN stars detected previously in X-rays are close binaries with unseen companions, but until that is demonstrated it would be premature to discount intrinsic emission from the WN star or its wind as a non-negligible contributor to the X-ray emission detected from CQ Cep.
5.4 Magnetically-Confined Winds
The current state of knowledge provides very few theoretical alternatives to colliding winds for explaining the existence of hot plasma (kT 2 keV) in WRO binaries. One plausible alternative is based on the magnetically-confined wind shock (MCWS) model that has been used to explain hot plasma in some O stars such as the O7 V star Ori C (Babel & Montmerle 1997; hereafter BM97). In this picture, sufficiently strong stellar magnetic fields can confine the ionized wind and channel it toward the magnetic equator where the oppositely-directed streams collide to form a MCWS. This mechanism could be operating in the O9 component of CQ Cep but very strong B fields would be needed to confine the much stronger wind of the WN star.
The magnetic field strength needed to confine the O-star wind can be estimated using the confinement parameter = BR/v∞ where Beq is the field strength at the magnetic equator (ud-Doula & Owocki 2002). For 1 the wind is marginally-confined by the B-field. Adopting a radius R∗ = RO9 = 8.2 R⊙ for the O star in CQ Cep and using the wind parameters in Table 1, marginal wind confinement requires Beq 150 G and larger fields are needed for strong confinement. A 150 G field would be sufficient to account for the observed X-ray luminosity (eq. [10] of BM97) and the O9 terminal wind speed could produce MCWS plasma temperatures of several keV (eq. [4] of BM97).
Since the MCWS is predicted to form near the magnetic equator of the O star, the hot plasma should be at least partially occulted as the WN star passes in front ( = 0.5), with an accompanying drop in the hard-band count rate. There is some suggestion of a small decrease in the hard-band count rate near 0.5 in Fig. 2-bottom but the change is of low significance (1.5) and we lack phase coverage beyond = 0.52.
If the O9 star is producing hard X-rays in a MCWS then rotational X-ray modulation may be present, as is the case for Ori C which shows periodic modulations at its 15.4 d rotation period. Longer time monitoring of CQ Cep would be needed to determine if periodic X-ray variability is present, but none is obvious in our short 1-day X-ray light curve. One argument against the scenario in which most of the X-rays originate in the O9 star via a MCWS is the strong resemblance of the Chandra X-ray spectrum of CQ Cep to that of the presumably single WN6 star WR 134 (Fig. 3). Similarly, Stickland et al. (1984) have noted that the IUE spectrum of CQ Cep is “virtually indistinguishable from that of single WN7 stars and shows no clear evidence of any OB companion spectrum”. The above similarities suggest that it is the WN star and not the O-type companion that plays the dominant role in the X-ray (and UV) emission of CQ Cep.
5.5 Orbital Period of CQ Cep
The time of primary optical minimum ( = 0) predicted by the results of De97 is 3.26 ks earlier than the minimum observed by Chandra (Fig. 2-top). This difference is too large to explain on the basis of the formal uncertainties in the published De97 elements. If we instead use the time-of-minimum-light equation of Walker et al. (1983; hereafter Wa83) then the predicted primary minimum is at JD 2415000.410 (1.6412436 0.0000009 d)E, which occurs 2.84 ks later than the Chandra minimum. Again, the difference cannot be explained by the formal uncertainty in the Wa83 period which accumulates to 1.96 ks at the epoch of our Chandra observation. Interestingly, Harries & Hilditch (1997) found a similar difference of 1.56 ks and in the same sense (i.e. their observed time is earlier than predicted by Wa83).
One possible explanation for the above discrepancies is that the orbital period of CQ Cep is variable. The question of orbital period variability has been investigated in previous studies but the results are contradictory. Wa83 found that 68 years of optical data analyzed in their study were consistent with no period change greater than an annual fractional change of 5 10-7. In contrast, the study of Antokhina et al. (1982; hereafter A82) found that the period was becoming shorter at a rate of 0.019 (0.006) s yr-1 adding support to a previous claim for a period change by Gaposchkin (1944).
As the conflicting results summarized above show, the presence of any orbital period variability in CQ Cep remains an open question. Wa83 pointed out that other factors besides period variability such as eclipse asymmetries could be contributing to discrepancies in reported periods. The period change found by A82 is much too small to explain the difference between the time of Chandra optical minimum and that predicted by the De97 results, and in any case the period change is of opposite sign needed to resolve the discrepancy. But, a small error in the value of the adopted orbital period from De97 could easily explain the difference, as shown below.
Three of the most recent Porb determinations for CQ Cep are 1.64122299 2e-07 d (De97), 1.6412436 9e-07 d (Wa83), and 1.641249 d (A82; no error given). The average of these three values is = 1.6412408 (8.2e-06,1.1e-05) d where the uncertainties simply reflect the range in published values. It is clear that the range is much larger than the formal uncertainties given by De97 and Wa83. If the above value of is used in the time-of-minimum-light equation of De97 (Sec. 4.2), then the primary minimum is predicted to occur at t = 14.746 ks after the start of the Chandra observation, which is in much better agreement with the observed minimum at t = 14.46 0.02 ks. If instead we start with the observed time of Chandra minimum light (HJD = 2456371.20268 0.00023 [UTC]) and adopt the reference date for primary minimum of De97 (HJD = 2450267.43158 0.00077) then the time difference divided by 3719 full orbits gives Porb,CXO = 1.6412400 1.5e-7 d, where the error takes into account the uncertainty in the De97 epoch date and in the time of Chandra minimum light. This period differs by only 9e-07 d from the average value given above. Thus, the difference between the time of optical minimum observed by Chandra and that predicted by the results of De97 can be explained by adopting an orbital period Porb,CXO = 1.6412400 1.5e-7 d, which is slightly larger than the value determined by De97 but in quite good agreement with the average orbital period determined from three previous studies.
Further optical monitoring of CQ Cep would be worthwhile to confirm the result of A82 that the period is slowly decreasing and, if so, to determine if the rate-of-change is stable. A reliable determination of the rate-of-change in the period can be used to constrain the mass-loss rate and the rate at which mass is flowing from the WN star onto the O star, as shown by A82 for CQ Cep and by Khaliullin (1974) for the short-period WNO binary V444 Cyg.
6 Summary
The main results of this study are the following:
-
1.
Chandra has detected luminous X-ray emission from CQ Cep. A simultaneous Chandra optical light curve clearly shows a deep eclipse when the O star passed in front of the WN star. However, little or no X-ray variability was seen during the observation.
-
2.
The Chandra ACIS-S spectrum shows numerous blended emission lines and is quite similar to spectra of apparently single WN6 stars such as WR 134. The spectrum can be fitted with either 2T optically thin plasma models or 2T plane-parallel shock models. Such models give a cool component plasma temperature kT1 0.6 keV and a hot component temperature kT2 2 - 3 keV, similar to temperatures observed in single WN stars and other close WNO binaries.
-
3.
The unabsorbed X-ray luminosity of CQ Cep log Lx = 33.25 - 33.48 ergs s-1 is at the high end of the range observed for WR stars. This value is similar to that of other close WNO binaries but is also comparable to that of the most luminous single (non-binary) WN stars.
-
4.
The absence of significant X-ray variability during optical eclipse of this high-inclination system is contrary to expectations if the hottest plasma originates in a colliding wind shock and is localized along the line-of-centers between the stars. The predicted temperature of a colliding wind shock formed by the WR wind impacting the O star at sub-terminal speed is marginally consistent with the lower values determined from X-ray spectral fits but the predicted X-ray luminosity is at least an order of magnitude higher than observed. Thus, we find discrepancies with colliding wind model predictions that remain to be explained.
-
5.
The lack of significant X-ray variability in CQ Cep during optical eclipse at = 0 (O star in front) provides compelling evidence that the X-ray plasma is extended on scales comparable to or larger than the binary system (binary separation 20 R⊙). Radiative shocks distributed far out in the winds of one or both stars remain a plausible explanation for the cool plasma in CQ Cep. However detailed hydrodynamic simulations of the wind interaction region that take into account the wind velocity field between the stars, radiative cooling, high inclination viewing geometry, and orbital motion effects will be needed to determine whether the presence of hot plasma (kT 2 - 3 keV) with little or no X-ray variability over half an orbit is consistent with colliding wind theory.
-
6.
Using the time of primary optical minimum in the Chandra ACA light curve and the reference date of primary optical minimum determined by De97, we obtain an orbital period for CQ Cep of = 1.6412400 1.5e-7 d, in good agreement with the average period computed from three previous optical studies.
Appendix A Colliding Wind X-ray Luminosity for Close WR+O Binaries
We derive here an expression for the colliding wind X-ray luminosity in close WRO binaries such as CQ Cep where the stellar radii and RO are not much less than the distance between the centers of the two stars. In this case the magnitude and direction of the WR wind velocity vector change across the shock interface at the O star surface.
We assume a radial spherically-symmetric WR wind which overpowers the O star wind so that a colliding wind shock forms at the O star surface. As shown in Figure 4, the WR wind velocity vector impacts the O star surface at a distance from the center of the WR star. The velocity component perpendicular to the shock interface is . We assume a standard wind velocity profile where is the terminal speed of the WR wind. The wind mass density is . As Figure 4 shows, a point on the O star surface at distance corresponds to a specific value of , where is the angle formed at the O star’s center between the line-of-centers and the point on the O star surface. The dependence of on is given by the law of cosines as = . Adopting as the independent variable, the maximum X-ray luminosity is obtained by integrating the energy flux crossing the shock over the portion of the O star surface that is intercepted by the WR wind,
| (A1) |
The limits on the integral are from = 0 (the stagnation point) to at the tangent point, where cos = . The WR wind mass density can be written as
| (A2) |
We now define the dimensionless quantities /, / and the functions
| (A3) |
| (A4) |
From Figure 4 it can then be seen that
| (A5) |
| (A6) |
Inserting eq. (A2) into eq. (A1) and then using (A3) - (A6) gives
| (A7) |
where the WR terminal wind luminosity is = (1/2) and cos = . The quantity in square brackets in eq. (A7) can be computed numerically, noting that is uniquely determined by .
References
- (1) Anders, E., & Grevesse, N. 1989, Geochim. Cosmochim. Acta, 53, 197
- (2) Antokhina, E.A., Lipunova, N.A., & Cherepashchuk, A.M. 1982, Sov. Astron., 26, 429 (A82)
- (3) Babel, J. & Montmerle, T. 1997, ApJ, 485, L29 (BM97)
- (4) Berghöfer, T.W., Schmitt, J.H.M.M., & Cassinelli, J.P. 1996, A&AS, 118, 481
- (5) Berghöfer, T.W., Schmitt, J.H.M.M., Danner, R., & Cassinelli, J.P. 1997, A&A, 322, 167
- (6) Borkovits, T. & Hegedüs, T. 1995, Publ. Obs. Astron. Belgrade, 49, 97
- (7) Borkowski, K.J., Sarazin, C.J., & Blondin, J.M. 1994, ApJ, 429, 710
- (8) Cassinelli, J.P., Miller, N.A., Waldron, W.L., MacFarlane, J.J., & Cohen, D.H. 2001, ApJ, 554, L55
- (9) Cherepashchuk, A.M. 1976, Sov. Astron. Letters, 2, 138
- (10) Cherepashchuk, A.M. 1990, Sov. Astron., 34, 481
- (11) Demircan, O., Ak, H., Özdemir, S., Tanriver, M., & Albayrak, B. 1997, Astron. Nachr., 318, 267 (De97)
- (12) Feldmeier, A., Kudritzki. R.-P., Palsa, R. Pauldrach, A.W.A., & Puls, J., 1997, A&A, 320, 899
- (13) Gaposchkin, S. 1944, ApJ, 100, 242
- (14) Gayley, K.G. & Owocki, S.P. 1995, ApJ, 446, 801
- (15) Gayley, K.G., Owocki, S.P., & Cranmer, S.R. 1997, ApJ, 475, 786 (GOC97)
- (16) Gorenstein, P., 1975, ApJ, 198, 95
- (17) Gosset, E., de Becker, M., Nazé, Y., Carpano, S., Rauw, G., Antokhin, I.I., Vreux, J.-M., & Pollock, A.M.T. 2011, A&A, 527, A66
- (18) Gregory, P.C., & Loredo, T.J., 1992, ApJ, 398, 146
- (19) Gregory, P.C., & Loredo, T.J., 1996, ApJ, 473, 1059
- (20) Hamann, W.-R., Gräfener, G. & Liermann, A. 2006, A&A, 457, 1015
- (21) Harries, T.J. & Hilditch, R.W. 1997, MNRAS, 291, 544
- (22) Hénault-Brunet, V., St.-Louis, N., Marchenko, S.V., Pollock, A.M.T., Carpano, S., & Talavera, A. 2011, ApJ, 735 13
- (23) Howarth, I.D. & Prinja, R.K. 1989, ApJS, 69, 527
- (24) Kahn, S.M. et al. 2001, A&A, 365, L312
- (25) Khaliullin, Kh. F. 1974, Sov. Astron., 18, 229
- (26) Lamers, H.J.G.L.M. & Cassinelli, J.P. 1999, Introduction to Stellar Winds (Cambridge, UK: Cambridge Univ. Press)
- (27) Lucy, L.B. & White, R.L., 1980, ApJ, 241, 300
- (28) Luo, D., McCray, R., & MacLow, M-M., 1990, ApJ, 362, 267
- (29) Marchenko, S.V., Moffat, A.F.J., Eenens, P.R.J., Hill, G.M., & Grandchamps, A. 1995, ApJ, 450, 811
- (30) Miller, G.J. & Chu, Y.-H. 1993, ApJS, 85, 137
- (31) Nugis, T., Crowther, P.A., & Willis, A.J. 1998, A&A, 333, 956
- (32) Nugis, T. & Lamers, H.J.G.L.M. 2002, A&A, 389, 162
- (33) Owocki, S.P., Castor, J.I., & Rybicki, G.B., 1988, ApJ, 335, 914
- (34) Pallavicini, R., Golub, L., Rosner, R., Vaiana, G.S., Ayres, T., & Linsky, J.L. 1981, ApJ, 248, 279
- (35) Pollock, A.M.T. 1987, ApJ, 320, 283
- (36) Pollock, A.M.T., Corcoran, M.F., Stevens, I.R., & Williams, P.M. 2005, ApJ, 629, 482
- (37) Prilutskii, O.F. & Usov, V.V. 1976, Sov. Astron., 20, 2
- (38) Prinja, R.K., Barlow, M.J., & Howarth, I.D. 1990, ApJ, 361, 607
- (39) Schild, H. et al. 2004, A&A, 422, 177
- (40) Schmutz, W. 1997, A&A, 321, 268
- (41) Skinner, S., Güdel, M., Schmutz, W., & Stevens, I.R. 2001, ApJ, 558, L113
- (42) Skinner, S., Güdel, M., Schmutz, W., & Zhekov, S. 2006, Ap&SS, 304, 97
- (43) Skinner, S.L., Zhekov, S.A., Güdel, M., Schmutz, W. 2007, MNRAS, 378, 1491
- (44) Skinner, S.L., Zhekov, S.A., Güdel, M., Schmutz, W., & Sokal, K.R. 2010, AJ, 139, 825
- (45) Skinner, S.L., Zhekov, S.A., Güdel, M., Schmutz, W., & Sokal, K.R. 2012, AJ, 143, 116
- (46) Stevens, I.R., Blondin, J.M., & Pollock, A.M.T., 1992, ApJ, 386, 265
- (47) Stickland, D.J. et al. 1984, A&A, 134, 45
- (48) St.-Louis, N., Moffat, A.F.J., Drissen, L., Bastien, P., & Robert, C. 1988, ApJ, 330, 286
- (49) ud-Doula, A. & Owocki, S.P. 2002, ApJ, 576, 413
- (50) Underhill, A.B., Gilroy, K.K., & Hill, G.M. 1990, ApJ, 351, 651
- (51) Usov, V.V. 1992, ApJ, 389, 635
- (52) van der Hucht, K.A. 2001, New Ast. Rev., 45, 135 (vdH01)
- (53) van der Hucht, K.A., Cassinelli, J.P., & Williams, P.M. 1986, A&A, 168, 111
- (54) Villar-Sbaffi, A., St.-Louis, N., Moffat, A.F.J., & Piirola, V. 2005, ApJ, 623, 1092
- (55) Walker, E.N., Lloyd, C., Pike, C.D., Stickland, D.J., & Zuiderwijk, E.J. 1983, A&A, 128, 394 (Wa83)
- (56) Walder, R. 1995, in IAU Symp. 163, eds. K. van der Hucht & P.M. Williams (Dordrecht: Kluwer), 420
- (57) Willis, A.J., Schild, H., & Stevens, I.R. 1995, A&A, 298, 549
- (58) Zhekov, S.A. 2012, MNRAS, 422, 1332
- (59) Zhekov, S.A. & Park, S. 2010, ApJ, 721, 518
- (60) Zhekov, S. & Skinner, S.L. 2000, ApJ, 538, 808
| Type | dist. | AV | V∞,wr | log | V∞,o9 | log | Porb |
|---|---|---|---|---|---|---|---|
| (kpc) | (mag) | (km s-1) | (M⊙ yr-1) | (km s-1) | (M⊙ yr-1) | (d) | |
| WN6O9II-Ib | 2.75 - 3.5 | 2.0 - 2.2 | 2040 | 4.5 | 2200 | 6.3 | 1.6412 |
| (1,2) | (2,3,4) | (2,3,4) | (3,5) | (3,5) | (6,7) | (6,7) | (2) |
Note. — Spectral type is from Marchenko et al. (1995) but Demircan et al. (1997) have noted that the companion may be a O9 III or O9 V star. The O9 wind parameters are typical values for O9II-I. Published values of the orbital period show small but significant differences (Sec. 5.5).
References: (1) Marchenko et al. (1995) (2) Demircan et al. (1997) (3) Stickland et al. (1984) (4) van der Hucht (2001) (5) Hamann et al. (2006) (6) Howarth & Prinja (1989) (7) Prinja et al. (1990).
| R.A. | decl. | Net Counts | H.R. | E50 | Pconst | Fx | Optical Position |
|---|---|---|---|---|---|---|---|
| (J2000) | (J2000) | (cts) | (keV) | (ergs cm-2 s-1) | (arcsec) | ||
| 22 36 53.95 | 56 54 20.93 | 2086 46 | 0.278 | 1.77 | 0.77 | 2.03 10-13 | J223653.955565420.98 (0.06) |
Note. — The nominal pointing position for the observation was (J2000.0) RA = 22h 56m 54.11s, decl. = 56∘ 54′ 31′′.7. X-ray data are from CCD7 (ACIS chip S3) using events in the 0.2 - 8 keV range inside a circular source extraction region of radius 1′′.8 centered on the X-ray peak. Tabulated quantities are: J2000.0 X-ray centroid position (R.A., decl.), total source counts accumulated in a 79,391 s live time exposure, hardness ratio H.R. = (HS)/(HS) where H = counts(2-8 keV) and S = counts(0.2 - 2 keV), median photon energy (E50), probability of constant count-rate determined by the Gregory-Loredo algorithm (Pconst); absorbed X-ray flux in the 0.3 - 8 keV band (Fx; see Table 4 for model-dependent values), and HST Guide Star Catalog counterpart J2000 optical position. The offset in arcseconds between the X-ray and optical position is given in parentheses.
| Time Range | Energy | ||
|---|---|---|---|
| 0.2 - 8 keV | 0.2 - 2 keV | 2 - 8 keV | |
| all | 25.0 (4.3) | 16.0 (3.4) | 9.1 (2.1) |
| 1st half | 23.8 (3.9) | 15.1 (3.1) | 8.8 (2.1) |
| 2nd half | 26.2 (4.0) | 16.8 (3.1) | 9.4 (2.4) |
Note. — Rates were computed from light curves binned at 2000 s intervals and are in units of c/ks. The standard deviation is given in parentheses.
| Parameter | ||||
|---|---|---|---|---|
| Model | A | B | C | D |
| TypeaaModel is of form NH,ismNH,1kT1 NH,ismNH,2kT2 . In XSPEC, the absorption column density NH was modeled using the model (solar abundances) and the model (nonsolar abundances). The optically thin plasma components kT were modeled using the model. The plane-parallel shock components kT in model D were modeled using the model with version 2.0 non-equilibrium ionization data (). | 2T aaModel is of form NH,ismNH,1kT1 NH,ismNH,2kT2 . In XSPEC, the absorption column density NH was modeled using the model (solar abundances) and the model (nonsolar abundances). The optically thin plasma components kT were modeled using the model. The plane-parallel shock components kT in model D were modeled using the model with version 2.0 non-equilibrium ionization data (). | 2T aaModel is of form NH,ismNH,1kT1 NH,ismNH,2kT2 . In XSPEC, the absorption column density NH was modeled using the model (solar abundances) and the model (nonsolar abundances). The optically thin plasma components kT were modeled using the model. The plane-parallel shock components kT in model D were modeled using the model with version 2.0 non-equilibrium ionization data (). | 2T aaModel is of form NH,ismNH,1kT1 NH,ismNH,2kT2 . In XSPEC, the absorption column density NH was modeled using the model (solar abundances) and the model (nonsolar abundances). The optically thin plasma components kT were modeled using the model. The plane-parallel shock components kT in model D were modeled using the model with version 2.0 non-equilibrium ionization data (). | 2T aaModel is of form NH,ismNH,1kT1 NH,ismNH,2kT2 . In XSPEC, the absorption column density NH was modeled using the model (solar abundances) and the model (nonsolar abundances). The optically thin plasma components kT were modeled using the model. The plane-parallel shock components kT in model D were modeled using the model with version 2.0 non-equilibrium ionization data (). |
| Abundances | solar | nonsolarbbHeld fixed at the generic values for WN stars given in Table 1 of van der Hucht et al. (1986). The WN abundances reflect H depletion and N enrichment and are by number: He/H = 14.9, C/H = 1.90E-03, N/H = 9.36E-02, O/H = 4.35E-03, Ne/H = 9.78E-03, Mg/H = 3.26E-03, Si/H = 3.22E-03, P/H = 1.57E-05, S/H = 7.60E-04, Fe/H = 1.90E-03. All other elements were held fixed at solar abundances (Anders & Grevesse 1989). | solarnonsolarccCool plasma component fixed at solar abundances and hot component fixed at generic WN abundances. | solarnonsolarccCool plasma component fixed at solar abundances and hot component fixed at generic WN abundances. |
| NH,ISM (1021 cm-2) | {4.4}ddHeld fixed during fitting at the value inferred from AV = 2 mag and the conversion NH 2e21 AV (Gorenstein 1975). Solar abundances assumed for ISM absorption. | {4.4}ddHeld fixed during fitting at the value inferred from AV = 2 mag and the conversion NH 2e21 AV (Gorenstein 1975). Solar abundances assumed for ISM absorption. | {4.4}ddHeld fixed during fitting at the value inferred from AV = 2 mag and the conversion NH 2e21 AV (Gorenstein 1975). Solar abundances assumed for ISM absorption. | {4.4}ddHeld fixed during fitting at the value inferred from AV = 2 mag and the conversion NH 2e21 AV (Gorenstein 1975). Solar abundances assumed for ISM absorption. |
| NH,1 (1021 cm-2) | 7.59 [6.60 - 8.70] | 0.07 [0.06 - 0.08]eeAbsorption is He-dominated for WN abundances. | 6.92 [5.70 - 8.10] | 4.45 [3.06 - 6.60] |
| NH,2 (1021 cm-2) | 25.1 [19.4 - 35.6] | 0.37 [0.31 - 0.47]eeAbsorption is He-dominated for WN abundances. | 8.97 [6.10 - 13.0]eeAbsorption is He-dominated for WN abundances. | 0.25 [0.21 - 0.33]eeAbsorption is He-dominated for WN abundances. |
| kT1 (keV) | 0.57 [0.49 - 0.62] | 0.56 [0.47 - 0.61] | 0.58 [0.53 - 0.63] | 0.63 [0.49 - 0.72] |
| kT2 (keV) | 1.82 [1.48 - 2.08] | 1.96 [1.70 - 2.27] | 2.34 [1.90 - 2.87] | 3.30 [2.68 - 3.87] |
| norm1 (10-4 cm-5)ffFor thermal models, the norm is related to the volume emission measure (EM = nV) by EM = 41014dnorm, where dcm is the stellar distance in cm. At d = 3.5 kpc this becomes EM = 1.471059 norm (cm-3). | 3.76 [2.86 - 5.32] | 3.30 [2.46 - 4.15] | 3.12 [2.22 - 4.25] | 1.03 [0.60 - 2.22] |
| norm2 (10-4 cm-5)ffFor thermal models, the norm is related to the volume emission measure (EM = nV) by EM = 41014dnorm, where dcm is the stellar distance in cm. At d = 3.5 kpc this becomes EM = 1.471059 norm (cm-3). | 4.50 [3.64 - 6.63] | 2.86 [2.29 - 3.42] | 0.85 [0.65 - 1.18] | 2.27 [1.99 - 2.85] |
| (1011 cm-3 s) | … | … | … | 2.78 [0.24 - 14.0] |
| (1011 cm-3 s) | … | … | … | 2.14 [1.40 - 8.40] |
| /dof | 89.5/76 | 96.3/76 | 90.3/76 | 71.1/74 |
| 1.18 | 1.27 | 1.19 | 0.96 | |
| FX (10-13 ergs cm-2 s-1) | 2.04 (16.7) | 2.06 (13.0) | 2.00 (12.3) | 2.09 (20.6) |
| FX,2 (10-13 ergs cm-2 s-1) | 1.41 (6.80) | 1.45 (6.32) | 1.41 (4.14) | 1.74 (14.4) |
| log LX (ergs s-1) | 33.39 | 33.28 | 33.25 | 33.48 |
Note. — Based on XSPEC (vers. 12.8.2) fits of the background-subtracted ACIS-S spectra binned to a minimum of 20 counts per bin using 79,391 s of exposure time. The spectra were modeled using an absorbed two-temperature (2T) optically thin plasma model or plane-parallel shock model. The absorption of each plasma component was allowed to vary independently, but the source and absorber abundances for each component were forced to be the same. The tabulated parameters are ISM absorption column density (NH,ISM; solar abundances), wind absorption column density (NH,i), plasma energy (kT), XSPEC component normalization (norm), and upper limit on the ionization timescale () for the shock model. Solar abundances are referenced to the values of Anders & Grevesse (1989). WN abundances are referenced to the generic values given by van der Hucht et al. (1986). Square brackets enclose 90% confidence intervals. Quantities enclosed in curly braces were held fixed during fitting. The total X-ray flux (FX) and the flux associated with the high-temperature component (FX,2) are the absorbed values in the 0.3 - 8 keV range, followed in parentheses by unabsorbed values. The unabsorbed values were measured by setting all NH values in the model to zero. The total X-ray luminosity LX is the unabsorbed value in the 0.3 - 8 keV range and assumes a distance d = 3.5 kpc.