Electronic structure of Ce2RhIn8 2D heavy Fermion system studied by angle resolved photoemission spectroscopy
Abstract
We use angle-resolved photoemission spectroscopy (ARPES) to study the 2D heavy fermion superconductor, Ce2RhIn8. The Fermi surface is rather complicated and consists of several hole and electron pockets with one of the sheets displaying strong nesting properties with a q-vector of (0.32, 0.32) /a We do not observe kz dispersion of the Fermi sheets, which is consistent with the expected 2D character of the electronic structure. Comparison of the ARPES data to band structure calculations suggest that a localized picture of the f-electrons works best. While there is some agreement in the overall band dispersion and location of the Fermi sheets, the model does not reproduce all observed bands and is not completely accurate for those it does. Our data paves way for improving the band structure calculations and the general understanding of the transport and thermodynamical properties of this material.
I Introduction
Heavy fermions, first discovered in 1975Andres et al. (1975), are some of the most fascinating materials in condensed matter physicsStewart (1984). The name originates from the enhanced effective mass of the quasi-particles, which can be two or three orders of magnitude higher than in a normal metal, while the functional form of the resistivity remains the same as a Fermi liquid. The behavior of this system is dominated by the 4f and 5f electrons and arises from a competition between the Kondo effect and the Ruderman-Kittel-Kasuya-Yosida (RKKY) interaction. Due to the complexity of this interaction, many marvelous phenomena are seen in heavy fermion compounds, such as unconventional superconductivitySteglich et al. (1979), quantum criticalityColeman and Schofield (2005), a possible topological insulatorDzero et al. (2010) and many others. Since the electrons in heavy fermion materials are an important test-bed for understanding the interplay between magnetic and electronic quantum fluctuations, measurements of the electronic structure are a crucial step for further researchColeman (2006). Band structure calculations for heavy fermion materials are difficult because of the complex behavior of the f-electrons of the rare earth elements. An additional complication is the difficulty in obtaining experimental data from techniques such as Angle Resolved Photoemission Spectroscopy that directly measure the band structure and other electronic properties. The 3D character of the band structure found in the vast majority of heavy fermion materials makes investigation with ARPES difficult because of final state broadening effects Hansen et al. (1998), and projection effects of 3D bands due to limited kz selectivity, etc. One notable exception is Ce2RhIn8. This is a highly layered material thought to have a quasi two dimensional electronic structureUeda et al. (2004). This opens up the possibility for a detailed ARPES study of its band structure and other electronic properties and the application of this powerful technique to uncover spectroscopic features. Knowledge of the electronic properties such as the location and shape of the Fermi surface sheets, Fermi velocities, band renormalization, scattering rates and interactions with collective excitations can then be used to model the thermodynamic and transport properties.
Ce2RhIn8 with lattice parameters a=4.665Å, c=12.244Å and tetragonal crystal structureBao et al. (2001) is an antiferromagnetic member of the CenMIn3n+2 (M=Co, Rh or Ir, n=1, 2 or ) family of heavy-fermion materials with two other compounds being unconventional superconductors. Since the structure of Ce2RhIn8 can be viewed as inserting a CeIn3 into CeRhIn5, this material is expected to share some of the properties of both compounds. The enhanced value of the Sommerfeld coefficientCornelius et al. (2001) () determined by specific heat measurements is consistent with the heavy fermion nature of this material. The resistivity curveMalinowski et al. (2003) follows a behavior between 55K and 130K as a result of Kondo screening and a single impurity model estimate of the Kondo temperature yields a value of 10K. The slope of the resistivity changes at and indicating two magnetic transitions. Neutron scattering measurementsBao et al. (2001) performed at 1.6K show the presence of an anti-ferromagnetic state with ordering vector . At this temperature, the magnetic moment of Ce is well screened at 0.55, compared with 2.35 per Ce at high temperature (200K). The slope of the resistivity changes more dramatically at compared to , and is also more sensitive to pressure with GPa, suggesting that the magnetic structure changes from an incommensurate to a commensurate one at Malinowski et al. (2003). The nature of the AFM order seems to fit better with a scenario of local moment ordering rather than SDW orderingCornelius et al. (2001). This is because an additional term would be needed to fit the specific heat data in order to account for an anisotropic gap in the SDW state for CeRhIn5. Also, according to conventional models of antiferromagnetic quantum criticalityMillis (1993), a linear decrease of with pressure points to an effective 2D character of the spin-fluctuation spectrum. This favors a Kondo destruction scenario with local moment ordering Coleman (2012).
Due to the layered structure, the electronic properties of Ce2RhIn8 are believed to be quasi-2D, which is rarely seen in heavy-fermion superconductors. ARPES data have been previously reportedRaj et al. (2005); Souma et al. (2008) for this compound but only along high symmetry directions. To the best of our knowledge there have been no reported measurements of the Fermi surface. To better understand the superconductivity and heavy-fermion phenomenon in this material, we examine the Fermi Surface and detailed band dispersion of Ce2RhIn8 using various photon energies.
II Methods
Single crystals were grown using the In flux technique and characterized as described in Ref. 9. ARPES measurements were performed using the ARPES system at Ames Laboratory and beamline 7.0.1 at the Advanced Light Source (ALS). Samples were cleaved in situ yielding shiny, mirror-like surfaces. All ARPES data were taken at T=16K, above the AFM transition temperature (2.8K) but close to the Kondo temperature (10K). The laboratory-based ARPES system consists of a GammaData ultraviolet lamp (21.2eV He I), custom-designed refocusing optics and a Scienta SES2002 electron analyzer. The UV spot size is around 1mm and the energy resolution was set at 10meV. Beamline 7.0.1 is equipped with a Scienta R4000 electron analyzer with energy resolution around 40meV.
First-principles band structure calculations were performed using spin-polarized density functional theory (DFT)Kohn and Sham (1965) within a generalized-gradient approximation (GGA) with the projector-augmented wave (PAW) methodBlöchl (1994); Kresse and Joubert (1999) using VASP codeKresse and Furthmuller (1996). The GGA exchange correlation functional parameterized by Perdew, Burke and Ernzerhof (PBE)Perdew et al. (1996) was used. The semi core p-states of Rh, as well as the lower lying d-states of In, were treated as valence states, while the 4f electrons are treated in two ways for comparison; either placed in the core or as valence states. The kinetic energy cutoff was 400 eV and the Monkhorst-PackÕs schemeMonkhorst and Pack (1976) was used for Brillouin zone sampling with a k-mesh of 17 x 17 x 7 for the FM state and 12 x 12 x 7 for the AFM state in which case a 2 x 2 x 1 supercell was used.
| a(Å) | c(Å) | MCe (/Ce atom) | E (eV/atom) | |
|---|---|---|---|---|
| AFM | 6.651 | 12.283 | 0.69 | -4.029 |
| FM | 4.709 | 12.278 | 0.68 | -4.030 |
| Non-Mag | 4.705 | 12.280 | 0 | -4.027 |
| ExprimentBao et al. (2001) | 4.665 | 12.244 | 0.55 | - |
Calculated lattice parameters, energies and magnetic moment of the Ce atoms in different magnetic states are listed in table 1, together with the experimental resultsBao et al. (2001). The lattice parameters obtained from the GGA calculations are in good agreement with experiment, with an approximate 1% overestimation. The calculated magnetic moment of the Ce ions also agrees well with the experimental data. From table 1, we can say that the magnetically ordered states have slightly lower energy than the non-magnetic state, with the energy of the FM state being slightly lower by 1 meV per atom.
III Results and discussion
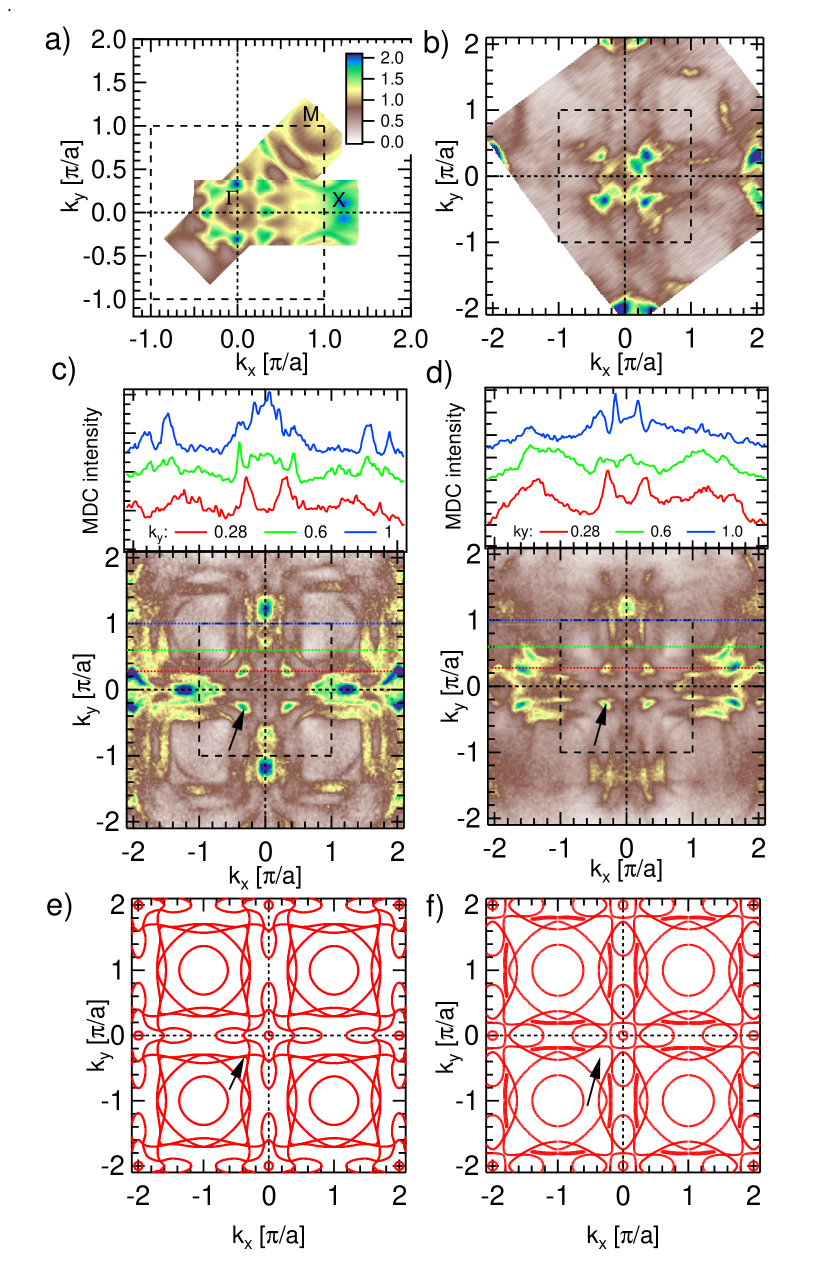
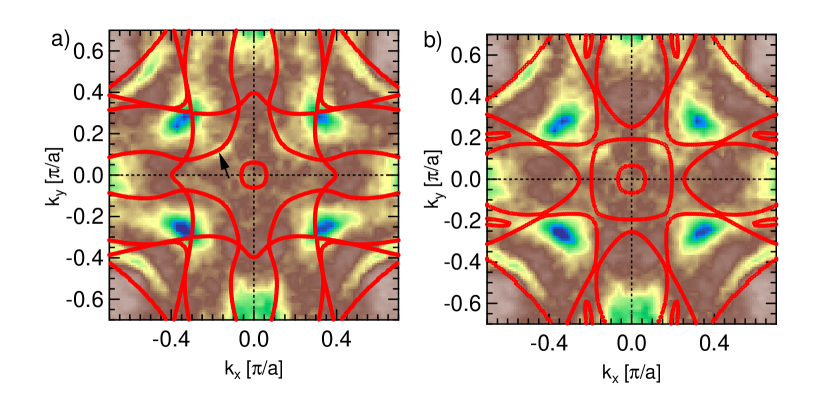
In Fig. 1 (a)-(d) we plot the Fermi surface of Ce2RhIn8 obtained at several photon energies by integrating the photoelectron intensity within meV of the EF. Dark brown, yellow, green and blue areas mark the locations of the Fermi surface sheets. Data in panel (a) was measured using a laboratory He source with a photon energy of 21.2eV, (b) was measured at SRC using 80eV photons. Data in panels (c) & (d) was measured at ALS using 94eV and 105eV photons, respectively. Since the cross section of the bands can be quite different for different photon energies and polarizations, performing the measurements with several photon energies can reveal a more complete picture of the Fermi surface. The topology of the Fermi surface of Ce2RhIn8 is rather complicated and consists of several large electron pockets ( to labeled in Fig. 3b) centered at the M-point, a large and small electron ( and labeled in Fig. 3b ) pocket and a hole ( labeled in Fig. 3b) pocket near the center of the zone. We compare this data to the calculated Fermi surface for a localized (panel e) and an itinerant (panel f) model of the f-electrons. The magnetic moment for the itinerant scenario was artificially set to zero, since the data was measured at a temperature above . The Fermi surface for those two scenarios are very similar around the M-point but quite different around the -point, where the localized approach fits the experimental data better. Close to , there is an area of high intensity for all measured photon energies due to one or more Fermi sheets marked by black arrows. In the localized model, this area coincides with the presence of two adjacent bands at EF (arrow in panel e). The itinerant model on the other hand does not predict any Fermi sheets in that area (arrow in panel f). This is not surprising since the data was measured at 16K. Although the temperature is comparable with and screening of the f electrons by conduction electrons should exist to some extent, it is still much higher than the coherence temperature of 5K and most f-electrons will remain localized. A more detailed comparison is presented in Fig. 2, where we overlay the calculated Fermi surface for both models onto the ARPES data measured at 94 eV. Again the localized model fits the data much better, while the itinerant approach fails to predict the observed location of the Fermi surface sheets.
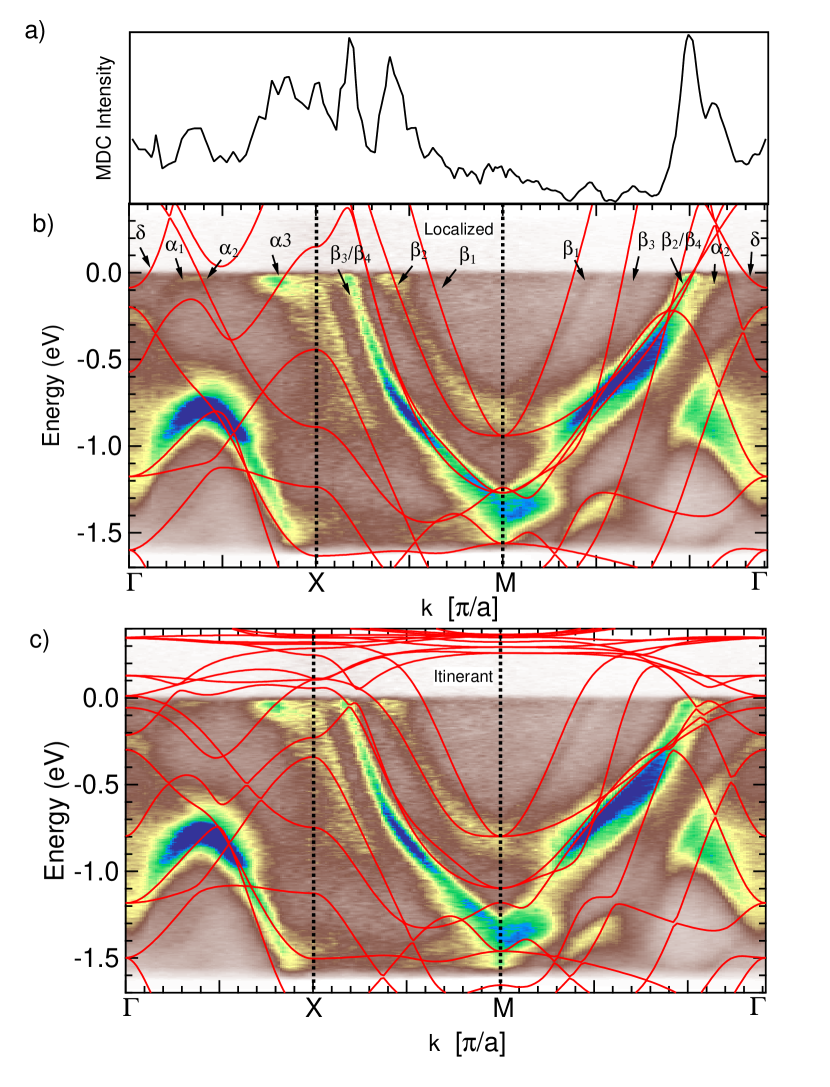
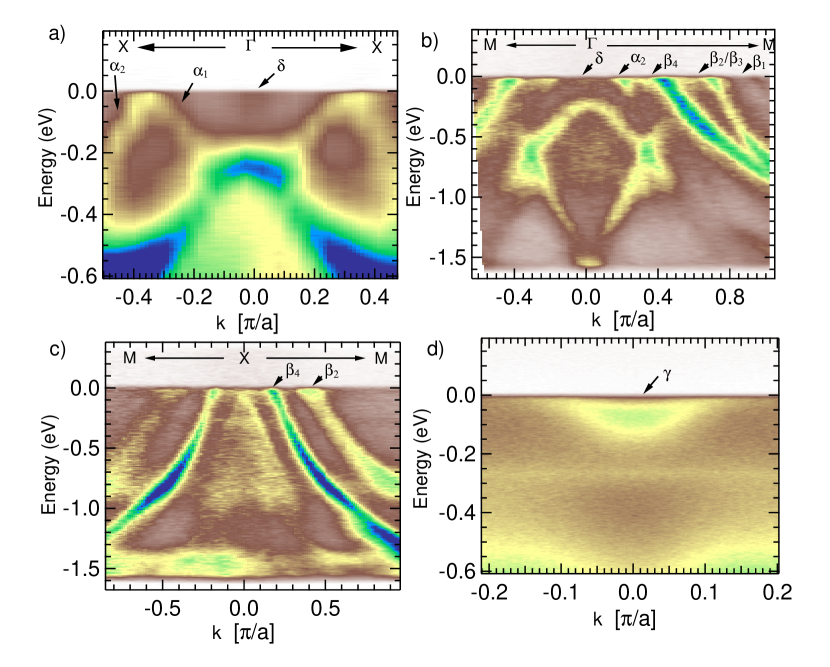
We now proceed to compare the calculated and measured band dispersions. In Fig. 3 we plot the ARPES intensities along the main symmetry directions measured at 94 eV photon energy. Overlaid on top is the calculated band structure using the itinerant and localized models. The dark brown, yellow, green and blue areas mark the locations of the bands. The localized approach fits the data better near the point and there are some overall similarities in the shape and location of some bands, however there are also some striking differences. For example the experimental data shows a dispersing band crossing EF between and , which neither calculation predicts. This underlines the need to improve our basic understanding of the electronic structure and hopefully the data presented here will guide that effort. To facilitate this we plot in Fig. 4 several more-detailed intensity plots near the center of the zone plus an off-symmetry set of data showing the shallow band along the cut at ky=0.7 .
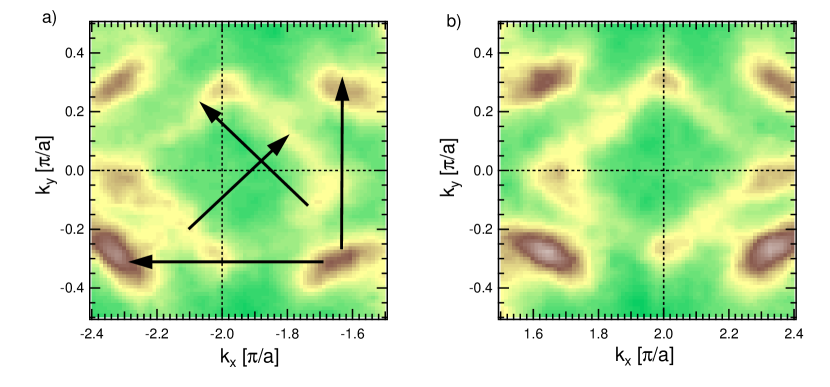
To reveal the nature of the AFM order, one needs to establish the presence of a nesting vector equal to the AFM ordering vector =(0.5,0.5,0). The high intensity spot at the corner of bands and (seen in Fig. 5) corresponds to a slightly larger nesting vector (0.6, 0.6, 0) than the ordering vector . This nesting vector may decrease below the coherence temperature with the injection of f-electrons. Since the Fermi surface of Ce2RhIn8 contains multiple pockets, when nesting occurs for one of the pockets, a large part of Fermi surface is unaffected. This is consistent with specific heat measurementsCornelius et al. (2001), where the change of the Sommerfeld coefficient above and below (from 400 to 370 ) is much smaller than in CeRhIn5 (400 to 56 ), indicating that only a small part () of the Fermi surface becomes gapped below TN. Therefore, the spin density wave scenario cannot be completely ruled out by our measurements. We also observe a well-nested diamond shape Fermi surface around with a nesting vector of (0.32, 0.32, 0) marked by the diagonal arrows. There are however no obvious consequences of this nesting in the neutron inelastic scattering data. It is imperative to study how this part of the Fermi surface evolves as the sample is cooled below the Neel temperature to find out the role these segments play in the low temperature properties. The nearly straight segments of this Fermi surface sheet deviate from the calculation results, which predict more rounded shape. This again underlines need to revise our understanding of band structure and improve the computational model.
The Ce2RhIn8 is deemed to be a very important heavy fermion material because indications are that its electronic structure has a 2D character. To date, this was not been directly demonstrated by ARPES measurements because the data in Refs. Raj et al. (2005); Souma et al. (2008) was acquired using a single photon energy, which probes only single surface in 3D momentum space. To verify the dimensionality of the electronic structure of this material we present extensive kz dispersion data measured using photon energies from 80 eV to 157 eV in Fig. 6. Assuming a reasonable value for the inner potential of 14 eV, this corresponds to kz values from 18.9 /c to 25.8 /c. The data in panel (a) was measured along -X and panel (b) shows data along the -M direction. Even though the intensity of the Fermi sheets changes with photon energy, all observed Fermi sheets present themselves as vertical lines with no observable dispersion. This demonstrates the quasi-2D character of the electronic structure of Ce2RhIn8, which is consistent with the 2D effective dimensionality of the spin-fluctuation spectrum from the phase diagramNicklas et al. (2003). This lack of dispersion in the data prevents the exact determination of the offset for the kz values on the vertical axes of Fig. 6a, c. The calculated dispersion is shown in Fig. 6 b, d. The localized model calculations predicts a nearly 2D electronic structure along the the -M direction. The model predicts some dispersion for the -X direction which is clearly not observed in the data.
IV Conclusions
We used angle-resolved photoemission spectroscopy to measure the electronic properties of Ce2RhIn8. The lack of a significant dispersion confirms the quasi two dimensional nature of the electronic structure. The measured Fermi surface is quite complicated and consists of several hole and electron pockets. By comparing our data with a DFT calculation, we find our results are consistent with a localized picture of the f-electrons. We also report some striking differences between the measured and calculated band dispersion, underlining some basic inadequacies of the calculated approach. The presented data will likely guide the development of new theoretical approaches that better address systems with f-electrons and are applicable to heavy fermion compounds.
V Acknowledgments
We would like to thank Bruce Harmon for useful discussions. This work was supported by the U.S. Department of Energy, Office of Science, Basic Energy Sciences, Materials Science and Engineering Division. Ames Laboratory is operated for the U.S. DOE by Iowa State University under contract # DE-AC02-07CH11358 (ARPES measurements and data analysis). The Advanced Light Source is supported by the Director, Office of Science, Office of Basic Energy Sciences, of the U.S. Department of Energy under Contract No. DE-AC02-05CH11231. Work at Brookhaven was supported by the U.S. DOE under Contract No. DE-AC02- 98CH10886 (sample growth and characterization).
References
- Andres et al. (1975) K. Andres, J. Graebner, and H. Ott, Phys. Rev. Lett. 35, 1779 (1975).
- Stewart (1984) G. R. Stewart, Rev. Mod. Phys. 56, 755 (1984).
- Steglich et al. (1979) F. Steglich, J. Aarts, C. D. Bredl, W. Lieke, D. Meschede, W. Franz, and H. Schäfer, Phys. Rev. Lett. 43, 1892 (1979).
- Coleman and Schofield (2005) P. Coleman and A. J. Schofield, Nature 433, 226 (2005).
- Dzero et al. (2010) M. Dzero, K. Sun, V. Galitski, and P. Coleman, Phys. Rev. Lett. 104, 106408 (2010).
- Coleman (2006) P. Coleman, arXiv (2006), cond-mat/0612006v3 .
- Hansen et al. (1998) E. D. Hansen, T. Miller, and T. C. Chiang, Physical Review Letters 80, 1766 (1998).
- Ueda et al. (2004) T. Ueda, H. Shishido, S. Hashimoto, T. Okubo, M. Yamada, Y. Inada, R. Settai, H. Harima, A. Galatanu, E. Yamamoto, N. Nakamura, K. Sugiyama, T. Takeuchi, K. Kindo, T. Namiki, Y. Aoki, H. Sato, and Y. Onuki, J. Phys. Soc. Jpn. 73, 649 (2004).
- Bao et al. (2001) W. Bao, P. Pagliuso, J. Sarrao, J. Thompson, Z. Fisk, and J. Lynn, Phys. Rev. B 64, 020401 (2001).
- Cornelius et al. (2001) A. L. Cornelius, P. G. Pagliuso, M. F. Hundley, and J. L. Sarrao, Phys. Rev. B 64, 144411 (2001).
- Malinowski et al. (2003) A. Malinowski, M. F. Hundley, N. O. Moreno, P. G. Pagliuso, J. L. Sarrao, and J. D. Thompson, Phys. Rev. B 68, 184419 (2003).
- Millis (1993) A. J. Millis, Phys. Rev. B 48, 7183 (1993).
- Coleman (2012) P. Coleman, Nature Materials 11, 185 (2012).
- Raj et al. (2005) S. Raj, Y. Iida, S. Souma, T. Sato, T. Takahashi, H. Ding, S. Ohara, T. Hayakawa, G. F. Chen, I. SAKAMOTO, and H. Harima, Phys. Rev. B 71, 224516 (2005).
- Souma et al. (2008) S. Souma, S. Raj, J. C. Campuzano, T. Sato, T. Takahashi, S. Ohara, and S. Sakamoto, in Physica B (2008) pp. 752–754.
- Kohn and Sham (1965) W. Kohn and L. J. Sham, Phys Rev 140, A1133 (1965).
- Blöchl (1994) P. E. Blöchl, Phys. Rev. B 50, 17953 (1994).
- Kresse and Joubert (1999) G. Kresse and D. Joubert, Phys. Rev. B 59, 1758 (1999).
- Kresse and Furthmuller (1996) G. Kresse and J. Furthmuller, Phys. Rev. B 54, 11169 (1996).
- Perdew et al. (1996) J. P. Perdew, K. Burke, and M. Ernzerhof, Phys. Rev. Lett. 77, 3865 (1996).
- Monkhorst and Pack (1976) H. J. Monkhorst and J. D. Pack, Phys. Rev. B 13, 5188 (1976).
- Nicklas et al. (2003) M. Nicklas, V. A. Sidorov, H. A. Borges, P. G. Pagliuso, C. Petrovic, Z. Fisk, J. L. Sarrao, and J. D. Thompson, Phys. Rev. B 67, 020506 (2003).