Calculating electron momentum densities and Compton profiles using the linear tetrahedron method
Abstract
A method for computing electron momentum densities and Compton profiles from ab initio calculations is presented. Reciprocal space is divided into optimally-shaped tetrahedra for interpolation, and the linear tetrahedron method is used to obtain the momentum density and its projections such as Compton profiles. Results are presented and evaluated against experimental data for Be, Cu, Ni, Fe3Pt, and YBa2Cu4O8, demonstrating the accuracy of our method in a wide variety of crystal structures.
I Introduction
Over the last few decades, studies of the electron momentum density (EMD) distribution have allowed insight into the electronic structure of a wide variety of metallic, magnetic, and insulating systems Dugdale (2014); Koizumi et al. (2011); Dixon et al. (1998); Taylor et al. (2002); Duffy et al. (2010); Shukla et al. (1999); Barbiellini et al. (2009); Sakurai et al. (2011); Koizumi et al. (2001); Isaacs et al. (1999). The EMD is directly related to the square modulus of the Fourier transform of the electronic wave function, and may be written as
| (1) |
where is the wave function of an electron with the wavevector in band , and is its occupation. As the EMD only contains contributions from occupied states, its measurement allows the Fermi surface (FS) topology of metals to be determined Dugdale (2014). Moreover, the close relationship of the EMD to the electronic wave function has been exploited to great effect in studying wave function coherence, bonding, and orbital character in a variety of complex materials Weyrich et al. (1979); Shukla et al. (1999); Isaacs et al. (1999); Koizumi et al. (2001); Barbiellini et al. (2009); Sakurai et al. (2011). Significantly, comparisons between measured and calculated momentum densities provide a rigorous means of testing, and refining theoretical models Lam and Platzman (1974); Cardwell and Cooper (1989); Kubo et al. (1999); Major et al. (2004).
Inelastic x-ray scattering in the regime of very high energy transfer (so-called Compton scattering) is a powerful experimental probe of the EMD Laverock et al. (2007); Koizumi et al. (2011); Sakurai et al. (2011); Dugdale et al. (2006). In a Compton scattering experiment, for a fixed momentum transfer, the projection of the bulk EMD along the scattering vector (taken as the z-direction of a Cartesian coordinate system) can be extracted. In spin-polarised systems, the total EMD is comprised of different contributions and , from spin-up and spin-down electrons. Magnetic Compton scattering Duffy (2013) measures the projection of the spin-resolved momentum density. Here components arising from spin-paired electrons cancel, allowing the spin magnetic moment Duffy et al. (2010), and spin polarisation to be determined Utfeld et al. (2009). Compton profiles (CPs), , and magnetic Compton profiles (MCPs), are defined as
| (2) |
and
| (3) |
respectively.
The momentum density (or spin density in momentum space) in two or three dimensions may be experimentally recovered by measuring a series of profiles along different crystallographic directions, and employing a suitable tomographic method Kontrym-Sznajd and Samsel-Czekała (2005).
It is worth noting that the once-projected momentum density may also be probed via the two-dimensional angular correlation of annihilation radiation (2D-ACAR) technique West (1995); Dugdale (2014), which measures the electron-positron momentum distribution (that is, the electron momentum density as seen by the positron). The inclusion of the positron wave function, which is beyond the scope of the present work, can have a significant influence on the shape of the momentum distribution Rusz and Biasini (2005); Laverock et al. (2010).
Great insight into electronic structure is available in comparing measured momentum distributions with the results of density functional theory (DFT) calculations. It should be emphasised that although the Kohn-Sham orbitals reproduce the ground-state electron density in real space (for a given exchange-correlation functional), this is not true in momentum space. However, as pointed out by Lam and Platzman Lam and Platzman (1974), a correction is possible. These so-called Lam-Platzman corrections (which here, as in many other works, are not calculated) are isotropic, whereas discrepancies between calculations and experiment tend to be anisotropic Shiotani et al. (1993); Sakurai et al. (1999); Huotari et al. (2000). We would also like to point out that the exact EMD (for a given exchange-correlation functional) can be calculated within reduced density matrix functional theory (RDMFT) Sharma et al. (2013) and the closely related natural orbital functional theory (NOFT) Goedecker and Umrigar (1998), but such calculations tend to be very computationally expensive compared to DFT. However, recent approximations to NOFT have been developed which make the estimation of the occupation numbers in Eq. 1 for the exact EMD much more computationally efficient Barbiellini (2014).
Several methods exist for calculating the EMD within DFT, with those based upon the Korringa-Kohn-Rostoker (KKR) Bansil et al. (2001); Ebert et al. (2011); SPR and linearised muffin-tin orbital (LMTO) Barbiellini et al. (2003) formalisms being two of the most common, whilst other groups maintain their own in-house codes for calculating the EMD within a full-potential DFT framework Wakoh and Tokii (2002); Matsumoto et al. (2004); Nagao et al. (2008); Bross (2012); Pylak et al. (2013). In these methods, projections of the EMD are generally obtained by either evaluating the EMD on a unique grid for each direction, or by calculating the EMD once on a certain grid, and interpolating the function on to a suitable set of points for the desired integration. The latter method is often preferred as, once the momentum density is evaluated on the initial grid the time taken to produce each profile is much less, with no appreciable loss in accuracy as long as a suitable method is chosen for interpolation.
Wakoh et al. utilise the linear tetrahedron method Jepson and Anderson (1971); Lehmann and Taut (1972); Rath and Freeman (1975); Kaprzyk and Mijnarends (1986); Blöchl et al. (1994); Kaprzyk (2012) to interpolate and project the EMD along arbitrary directions. Their approach involves evaluating the EMD on a fixed grid of points in reciprocal space, and then splitting these into a predetermined set of tetrahedra. Linear interpolation is used to find a series of planes within each tetrahedron perpendicular to the scattering vector, and Compton profiles are obtained as a sum over the approximate contributions from occupied planes Wakoh and Tokii (2002); Matsumoto et al. (2004). Whilst this method provides results in good agreement with experimental data Wakoh et al. (2002); Tokii and Matsumoto (2006), it is only formulated for systems with cubic symmetry, and only produces Compton profiles, rather than the once integrated (2D projection), or full 3D EMD. Also, as the authors note, the result will vary depending upon the choice of tetrahedra Matsumoto et al. (2004), meaning that in general a single predetermined set will not give the most accurate interpolation.
Here, we build upon the work of Wakoh et al. by presenting a method for obtaining the EMD (and its projections) by the linear tetrahedron method, for any crystal structure. The EMD is obtained from the band energies and the plane wave expansion of the valence electron wave functions of a converged DFT calculation at a set of points, where G is a reciprocal lattice vector. We employ an algorithm to divide reciprocal space into optimally-shaped tetrahedra (for interpolation) before interpolating the EMD, ensuring accurate interpolation irrespective of crystal structure. The code is written as a module for the popular, freely available, and open source, full-potential linearised augmented plane wave (FP-LAPW) DFT code, ELK ELK , and can produce the full three-dimensional momentum density, or its one or two-dimensional projections. A description of the technical implementation is provided in the next section.
II Numerical method
II.1 Calculation of the momentum density within the irreducible Brillouin zone
The plane wave expansion of the electron wave function in the irreducible Brillouin zone (IBZ) is calculated by Fourier transforming the real space wave functions on to an extended set of -points in reciprocal space, to describe the momentum density adequately (highly localised electrons may have momenta a.u.). The momentum density at each point is then calculated for every state and spin via Eq. 1 (excluding the occupation numbers from Eq. 1, which are applied at the time of interpolation). The calculation of the EMD in the irreducible wedge of momentum space only needs to be run once for a converged calculation.
II.2 Splitting of reciprocal space into tetrahedra
In ELK, the starting p-point grid consists of a series of identical parallelepiped submesh cells (SMCs) which tile to fill reciprocal space. The submesh cells are the same shape as the reciprocal unit cell of the crystal, but are constructed from fractions of the reciprocal lattice vectors. For a non-cubic system, the SMC may have relatively large distances between points on the original mesh. In order to interpolate the EMD as accurately as possible, we split the submesh into tetrahedra where the distance between vertices is minimal. This splitting is achieved using an algorithm based upon the Delaunay criterion Delaunay (1934), implemented in three dimensions. We provide a brief description of the method below (for a more thorough description, see Ref. de Berg et al. (2008)).
The splitting algorithm creates a tetrahedron which contains one SMC. The points of the cell are incrementally added, and the containing tetrahedron is split into new tetrahedra about each point. The Delaunay criterion stipulates that if the circumscribed sphere of each tetrahedron does not contain a vertex of any other, the minimum internal angle of the set of tetrahedra will be maximised (so that they will have small edge lengths, and be optimally shaped for interpolation). As each new tetrahedron is created, it is checked to see if it satisfies this rule and, if not, the rule is enforced through a transformation involving switching vertices with adjacent tetrahedra. This check is performed recursively upon all transformed tetrahedra until the criterion is satisfied. When all the points of the SMC have been added, the tetrahedron is removed, leaving the optimally-split SMC.
II.3 Interpolation of the momentum density
The occupation numbers for each k-point and state are calculated from the energy eigenvalues using the Fermi-Dirac distribution, in principle allowing for the calculation of a finite-temperature momentum distribution. This also allows shifts of the relative Fermi energy for individual states to be performed if required (sometimes small rigid energy shifts of the theoretical electronic band structure are necessary to bring a calculated Fermi surface into agreement with experiment Major et al. (2004); Utfeld et al. (2010)). The total EMD is obtained as the occupation-weighted sum over the contributions from all states (but can, if required, be resolved by state), and expanded from the irreducible part to the whole of momentum space for interpolation using the point-group symmetries of the lattice.
To allow projection along a specific direction in momentum space (for example, the scattering vector of a Compton scattering experiment), the EMD is interpolated onto a cubic mesh, which may be aligned along any arbitrary direction, using the linear tetrahedron method within the optimally-shaped tetrahedra.
The computational demands of the code depend sensitively upon the -point mesh of the original calculation and the number of -points, but remain within the capabilities of modern desktop computers. For a typical CP calculation of a single atom system such as Cu, over 511 -points, the code requires around 1 Gb of memory, whereas for a more demanding five atom cubic system with a similar number of -points, the requirement approaches 4 Gb.
III Results
In order to demonstrate the flexibility of our method, we have calculated the EMD of a broad variety of systems with different crystal structures. Systems were chosen which have been the focus of both Compton scattering experiments and theoretical studies, to allow comparison with both.
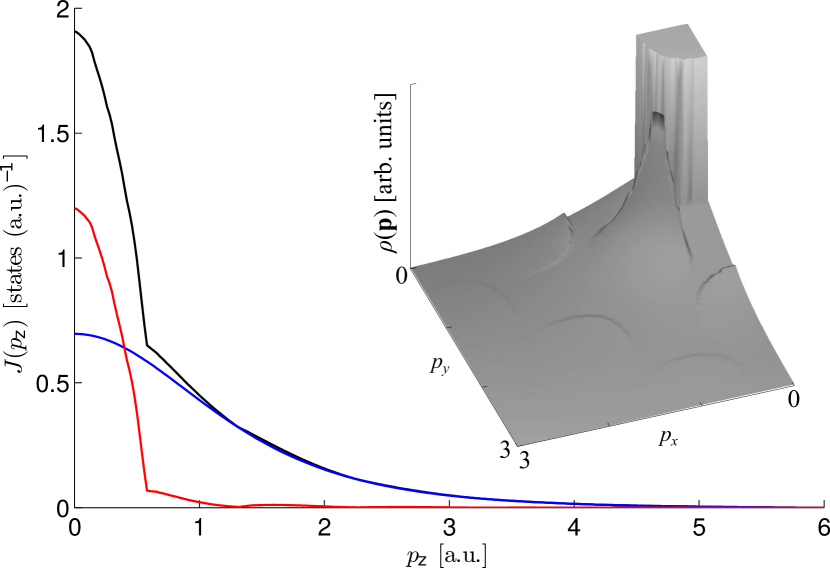
As an example, the Compton profile of Li along the [100] direction is shown in Fig. 1. The shape of the profile is a combination of a broad isotropic Gaussian-like contribution from the more localised electrons (in this case the semi-core 1 state), and a parabolic free-electron-like contribution from the valence electrons (the 2 state). Experimentally, the core contribution is often uninteresting (and unwanted), whilst the valence will be anisotropic, and contain information about bonding or the Fermi surface. Indeed, the presence of the Fermi surface is visible in the plane through the EMD of Li shown in the inset of Fig. 1.
To aid comparison with experimental and theoretical spectra from the literature, it is common to calculate the directional difference between Compton profiles. This has the advantage of removing the isotropic contribution to the momentum density from the core electrons (which tend not to be included in calculations of the momentum density), whilst highlighting the anisotropic contribution from the valence electrons. Another benefit of inspecting the anisotropic part of the EMD is that the isotropic Lam-Platzman correction will have no effect (and therefore does not need to be calculated).
All calculations were performed using the same exchange-correlation functional as the calculations from the literature (where applicable), and have been convoluted with a Gaussian with a full width at half maximum (FWHM) equal to the experimental resolution.
III.1 Compton profiles of Be and Cu
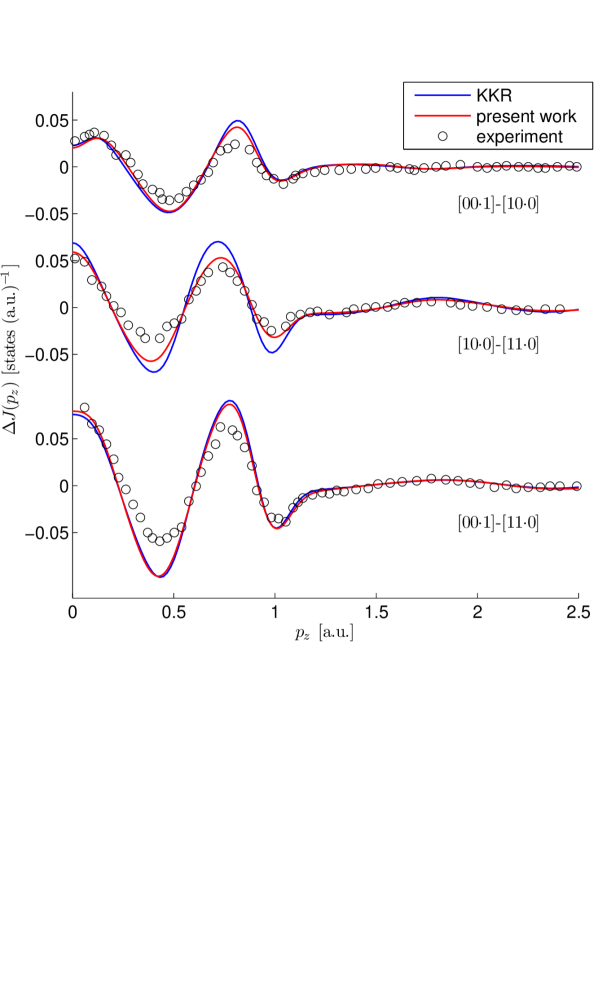
The electronic structure of hcp Be was calculated using the lattice constants a.u. and a.u., with 1197 k-points within the IBZ. The directional differences of Compton profiles calculated along the , and directions are shown in Fig. 2, compared with the experimental data of Huotari et al. obtained at a momentum resolution of 0.16 a.u. Huotari et al. (2000), and their KKR calculations utilising the von Barth-Hedin local density approximation (vBH-LDA) to the exchange-correlation functional von Barth and Hedin (1972). The profiles calculated by our method agree very well with the experimental data, and show slightly improved agreement compared to KKR calculations of Ref. Huotari et al. (2000).
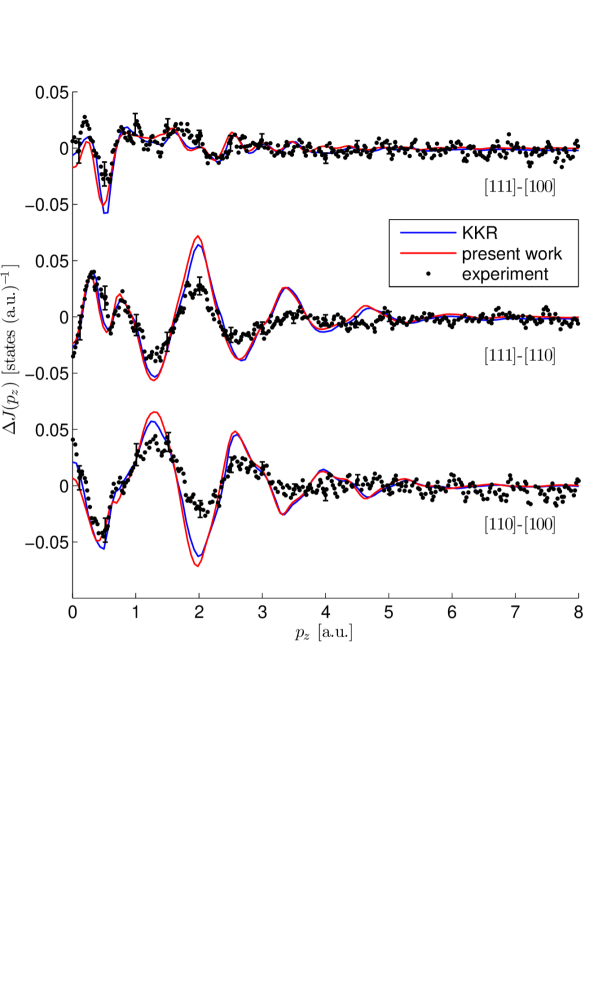
The EMD of fcc Cu was calculated using a lattice constant of 6.8242 a.u., on 511 k-points within the IBZ. Figure 3 shows calculated anisotropies between the [100], [110], and [111] directions, compared to the experimental data of Sakurai et al., which has an experimental resolution of 0.12 a.u., and their own vBH-LDA KKR calculations Sakurai et al. (1999). Whilst the calculated profiles are in close agreement with the KKR calculations of Sakurai et al., they do not agree quite as well with the experimental data, and both calculations overestimate the directional anisotropy. This is a well known artifact in DFT calculations, which has been attributed to the neglect of non-local electron correlation effects Shiotani et al. (1993). This disagreement has previously been reduced in Cu through the application of the so-called self-interaction correction Kubo et al. (1999).
III.2 Spin resolved momentum densities of Ni and Fe3Pt
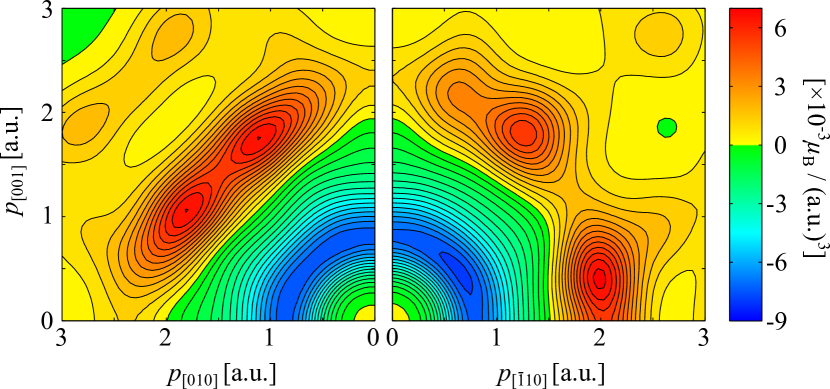
The electronic ground state of ferromagnetic fcc Ni was calculated with a lattice constant of 6.644 a.u., and using 511 k-points in the IBZ. In order to compare our calculation with a recent 3D reconstruction of the spin momentum density of Ni by Nagao et al. Nagao et al. (2008), the 3D spin momentum density was obtained on grids oriented along the cubic [100] and [110] directions, and convoluted with a 3D gaussian of FWHM equal to 0.52 a.u. before normalisation to the calculated moment of 0.586 . The (100) and (110) planes of the calculated distribution are shown in Fig. 4, and agree very well with the planes through the experimental data of Nagao et al., visible in parts (a) and (b) of Fig. 4 in Ref. Nagao et al. (2008), respectively. There is a slight discrepancy at a.u., where the calculation finds a higher spin density than is evident from experiment (also seen in the calculation in Ref. Nagao et al. (2008)). This discrepancy has previously been noted in MCPs calculated within both LMTO and full-potential formalisms Dixon et al. (1998), and can be rectified with small rigid shifts of the bands close to the Fermi level Major et al. (2004). It would be interesting to see if this is also corrected in dynamical mean-field theory calculations, which improve upon the agreement between experimental MCPs and those calculated within the LDA Benea et al. (2012); Chioncel et al. (2014).
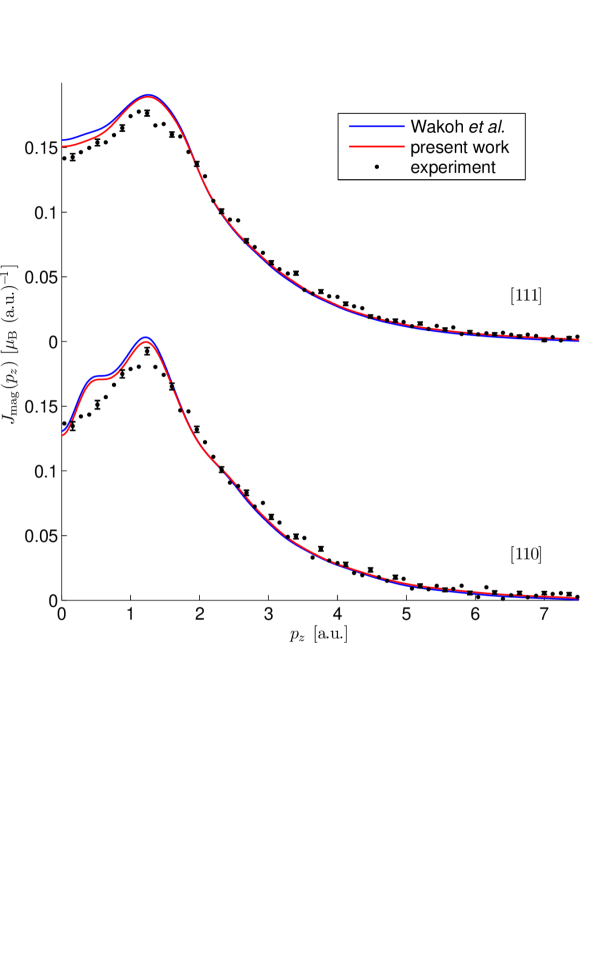
The electronic structure of ferromagnetic Fe3Pt, which has a simple cubic structure, was calculated using a lattice constant of 7.086 a.u., with 560 k-points in the IBZ, using the Perdew-Burke-Ernzerhof generalised gradient approximation (PBE-GGA), to the exchange-correlation functional Perdew et al. (1996). Calculated MCPs for the [110] and [111] directions are shown in Fig. 5, compared with the experimental MCPs of Taylor et al. measured at 300 K with a resolution of 0.40 a.u. Taylor et al. (2002), and the calculations of Wakoh et al., obtained from full-potential DFT calculations by the linear tetrahedron method Wakoh et al. (2002). Our calculations have been normalised to the calculated moment of 8.54 . Whilst both calculations reproduce the overall shape of the MCPs well, the result from our method is marginally closer to the experiment in the low momentum region ( 1.5 a.u.). As both calculations are produced by the linear tetrahedron method, the resulting MCPs should be effectively the same, and as such the slight improvement at low momentum is possibly due to the denser k-mesh used in the present electronic structure calculation.
III.3 YBa2Cu4O8
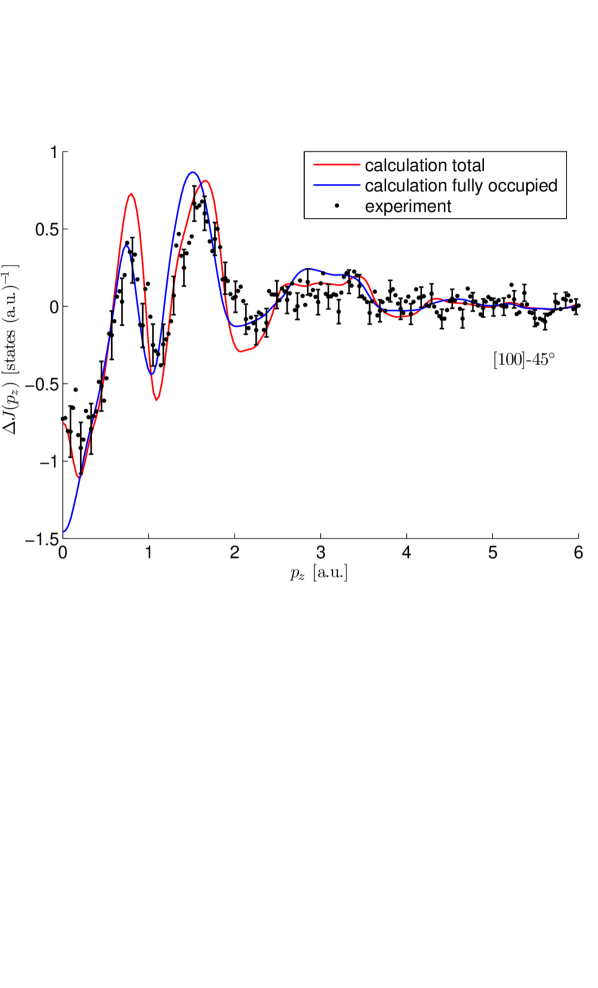
Having demonstrated the accuracy of our method in calculating the EMD of a variety of simple structures, we now apply it to the more electronically and structurally complex cuprate superconductor, YBa2Cu4O8. The electronic structure of YBa2Cu4O8 was calculated using the crystal structure of Ref. Lightfoot et al. (1991) with 891 k-points in the IBZ, using the PBE-GGA exchange-correlation functional. The resulting band structure and Fermi surface (not shown) are essentially the same as those calculated previously Yu et al. (1991); Ambrosch-Draxl et al. (1991). The calculated anisotropy between Compton profiles with scattering vectors along the [100] direction and a direction 45∘ from [100], rotated about the -axis is shown in Fig. 6 compared to our experimental data measured on beamline BL08W at the SPring-8 synchrotron, Japan, with a resolution of 0.11 a.u.. The calculation reproduces the experimental anisotropy well, showing that the overall description of the electronic structure is satisfactory. For comparison, we also show the anisotropy when only the fully occupied bands are included in the EMD calculation, such that the difference between the two anisotropies is entirely due to the FS. It is clear that the calculated anisotropy is dominated by the contribution from fully occupied bands, and the large oscillatory structure reflects the (projected) wavefunction anisotropy of these bands.
IV Conclusion
We have developed a new method for calculating electron momentum densities and Compton profiles from ab initio calculations. The use of the linear tetrahedron method in conjunction with optimally-shaped tetrahedra allows for accurate momentum density and Compton profile calculations, in any given crystal structure. This method produces results in excellent agreement with Compton scattering experiments and calculations produced by other techniques.
V Acknowledgements
The YBa2Cu4O8 experiment was performed with the approval of the Japan Synchrotron Radiation
Institute (JASRI, proposal no. 2011A1483) on single crystals grown by Z. Bukowski. We acknowledge financial
support from the UK EPSRC. This work was carried out using the computational facilities of the Advanced
Computing Research Centre, University of Bristol (http://www.bris.ac.uk/acrc/).
References
- Dugdale (2014) S. B. Dugdale, Low Temperature Physics 40, 328 (2014).
- Koizumi et al. (2011) A. Koizumi, G. Motoyama, Y. Kubo, T. Tanaka, M. Itou, and Y. Sakurai, Phys. Rev. Lett. 106, 136401 (2011).
- Dixon et al. (1998) M. A. G. Dixon, J. A. Duffy, S. Gardelis, J. E. McCarthy, M. J. Cooper, S. B. Dugdale, T. Jarlborg, and D. N. Timms, Journal of Physics: Condensed Matter 10, 2759 (1998).
- Taylor et al. (2002) J. W. Taylor, J. A. Duffy, A. M. Bebb, J. E. McCarthy, M. R. Lees, M. J. Cooper, and D. N. Timms, Phys. Rev. B 65, 224408 (2002).
- Duffy et al. (2010) J. A. Duffy, J. W. Taylor, S. B. Dugdale, C. Shenton-Taylor, M. W. Butchers, S. R. Giblin, M. J. Cooper, Y. Sakurai, and M. Itou, Phys. Rev. B 81, 134424 (2010).
- Shukla et al. (1999) A. Shukla, B. Barbiellini, A. Erb, A. Manuel, T. Buslaps, V. Honkimäki, and P. Suortti, Phys. Rev. B 59, 12127 (1999).
- Barbiellini et al. (2009) B. Barbiellini, A. Koizumi, P. E. Mijnarends, W. Al-Sawai, H. Lin, T. Nagao, K. Hirota, M. Itou, Y. Sakurai, and A. Bansil, Phys. Rev. Lett. 102, 206402 (2009).
- Sakurai et al. (2011) Y. Sakurai, M. Itou, B. Barbiellini, P. E. Mijnarends, R. S. Markiewicz, S. Kaprzyk, J.-M. Gillet, S. Wakimoto, M. Fujita, S. Basak, Y. J. Wang, W. Al-Sawai, H. Lin, A. Bansil, and K. Yamada, Science 332, 698 (2011).
- Koizumi et al. (2001) A. Koizumi, S. Miyaki, Y. Kakutani, H. Koizumi, N. Hiraoka, K. Makoshi, N. Sakai, K. Hirota, and Y. Murakami, Phys. Rev. Lett. 86, 5589 (2001).
- Isaacs et al. (1999) E. D. Isaacs, A. Shukla, P. M. Platzman, D. R. Hamann, B. Barbiellini, and C. A. Tulk, Phys. Rev. Lett. 82, 600 (1999).
- Weyrich et al. (1979) W. Weyrich, P. Pattison, and B. G. Williams, Chemical Physics 41, 271 (1979).
- Lam and Platzman (1974) L. Lam and P. M. Platzman, Phys. Rev. B 9, 5122 (1974).
- Cardwell and Cooper (1989) D. A. Cardwell and M. J. Cooper, Journal of Physics: Condensed Matter 1, 9357 (1989).
- Kubo et al. (1999) Y. Kubo, Y. Sakurai, and N. Shiotani, Journal of Physics: Condensed Matter 11, 1683 (1999).
- Major et al. (2004) Z. Major, S. B. Dugdale, R. J. Watts, J. Laverock, J. J. Kelly, D. C. R. Hedley, and M. A. Alam, Journal of Physics and Chemistry of Solids 65, 2011 (2004).
- Laverock et al. (2007) J. Laverock, S. B. Dugdale, J. A. Duffy, J. Wooldridge, G. Balakrishnan, M. R. Lees, G.-q. Zheng, D. Chen, C. T. Lin, A. Andrejczuk, M. Itou, and Y. Sakurai, Phys. Rev. B 76, 052509 (2007).
- Dugdale et al. (2006) S. B. Dugdale, R. J. Watts, J. Laverock, Z. Major, M. A. Alam, M. Samsel-Czekała, G. Kontrym-Sznajd, Y. Sakurai, M. Itou, and D. Fort, Phys. Rev. Lett. 96, 046406 (2006).
- Duffy (2013) J. A. Duffy, Journal of Physics: Conference Series 443, 012011 (2013).
- Utfeld et al. (2009) C. Utfeld, S. R. Giblin, J. W. Taylor, J. A. Duffy, C. Shenton-Taylor, J. Laverock, S. B. Dugdale, M. Manno, C. Leighton, M. Itou, and Y. Sakurai, Phys. Rev. Lett. 103, 226403 (2009).
- Kontrym-Sznajd and Samsel-Czekała (2005) G. Kontrym-Sznajd and M. Samsel-Czekała, Applied Physics A 80, 1693 (2005).
- West (1995) R. N. West, Proceedings of the International School of Physics Enrico Fermi - Positron Spectroscopy of Solids, edited by A. Dupasquier and A. M. Jr. (IOS Press, 1995).
- Rusz and Biasini (2005) J. Rusz and M. Biasini, Phys. Rev. B 71, 233103 (2005).
- Laverock et al. (2010) J. Laverock, T. D. Haynes, M. A. Alam, and S. B. Dugdale, Phys. Rev. B 82, 125127 (2010).
- Shiotani et al. (1993) N. Shiotani, Y. Tanaka, Y. Sakurai, N. Sakai, M. Ito, F. Itoh, T. Iwazumi, and H. Kawata, Journal of the Physical Society of Japan 62, 239 (1993).
- Sakurai et al. (1999) Y. Sakurai, S. Kaprzyk, A. Bansil, Y. Tanaka, G. Stutz, H. Kawata, and N. Shiotani, Journal of Physics and Chemistry of Solids 60, 905 (1999).
- Huotari et al. (2000) S. Huotari, K. Hämäläinen, S. Manninen, S. Kaprzyk, A. Bansil, W. Caliebe, T. Buslaps, V. Honkimäki, and P. Suortti, Phys. Rev. B 62, 7956 (2000).
- Sharma et al. (2013) S. Sharma, J. K. Dewhurst, S. Shallcross, and E. K. U. Gross, Phys. Rev. Lett. 110, 116403 (2013).
- Goedecker and Umrigar (1998) S. Goedecker and C. J. Umrigar, Phys. Rev. Lett. 81, 866 (1998).
- Barbiellini (2014) B. Barbiellini, Low Temperature Physics 40, 318 (2014).
- Bansil et al. (2001) A. Bansil, B. Barbiellini, S. Kaprzyk, and P. E. Mijnarends, Journal of Physics and Chemistry of Solids 62, 2191 (2001).
- Ebert et al. (2011) H. Ebert, D. Ködderitzsch, and J. Minár, Reports on Progress in Physics 74, 096501 (2011).
- (32) The Munich SPR-KKR package, H. Ebert et al., http://ebert.cup.uni-muenchen.de/SPRKKR.
- Barbiellini et al. (2003) B. Barbiellini, S. B. Dugdale, and T. Jarlborg, Computational Materials Science 28, 287 (2003), proceedings of the Symposium on Software Development for Process and Materials Design.
- Wakoh and Tokii (2002) S. Wakoh and M. Tokii, Journal of the Physical Society of Japan 71, 852 (2002).
- Matsumoto et al. (2004) M. Matsumoto, M. Tokii, and S. Wakoh, Journal of the Physical Society of Japan 73, 1870 (2004).
- Nagao et al. (2008) T. Nagao, Y. Kubo, A. Koizumi, H. Kobayashi, M. Itou, and N. Sakai, Journal of Physics: Condensed Matter 20, 055201 (2008).
- Bross (2012) H. Bross, ISRN Materials Science 2012, 975897 (2012).
- Pylak et al. (2013) M. Pylak, L. Dobrzyński, and H. Sormann, Physica Scripta 88, 035708 (2013).
- Jepson and Anderson (1971) O. Jepson and O. K. Anderson, Solid State Communications 9, 1763 (1971).
- Lehmann and Taut (1972) G. Lehmann and M. Taut, physica status solidi (b) 54, 469 (1972).
- Rath and Freeman (1975) J. Rath and A. J. Freeman, Phys. Rev. B 11, 2109 (1975).
- Kaprzyk and Mijnarends (1986) S. Kaprzyk and P. E. Mijnarends, Journal of Physics C: Solid State Physics 19, 1283 (1986).
- Blöchl et al. (1994) P. E. Blöchl, O. Jepsen, and O. K. Andersen, Phys. Rev. B 49, 16223 (1994).
- Kaprzyk (2012) S. Kaprzyk, Computer Physics Communications 183, 347 (2012).
- Wakoh et al. (2002) S. Wakoh, M. Tokii, M. Matsumoto, and I. Matsumoto, Journal of the Physical Society of Japan 71, 1393 (2002).
- Tokii and Matsumoto (2006) M. Tokii and M. Matsumoto, Journal of Physics: Condensed Matter 18, 3639 (2006).
- (47) http://elk.sourceforge.net/.
- Delaunay (1934) B. Delaunay, Bulletin de l’Académie des Sciences de l’URSS 6, 793 (1934).
- de Berg et al. (2008) M. de Berg, O. Cheong, M. van Kreveld, and M. Overmars, Computational Geometry: Algorithms and Applications, 3rd ed. (Springer, 2008).
- Utfeld et al. (2010) C. Utfeld, J. Laverock, T. D. Haynes, S. B. Dugdale, J. A. Duffy, M. W. Butchers, J. W. Taylor, S. R. Giblin, J. G. Analytis, J.-H. Chu, I. R. Fisher, M. Itou, and Y. Sakurai, Phys. Rev. B 81, 064509 (2010).
- von Barth and Hedin (1972) U. von Barth and L. Hedin, Journal of Physics C: Solid State Physics 5, 1629 (1972).
- Benea et al. (2012) D. Benea, J. Minár, L. Chioncel, S. Mankovsky, and H. Ebert, Phys. Rev. B 85, 085109 (2012).
- Chioncel et al. (2014) L. Chioncel, D. Benea, H. Ebert, I. Di Marco, and J. Minár, Phys. Rev. B 89, 094425 (2014).
- Perdew et al. (1996) J. P. Perdew, K. Burke, and M. Ernzerhof, Phys. Rev. Lett. 77, 3865 (1996).
- Lightfoot et al. (1991) P. Lightfoot, S. Pei, J. D. Jorgensen, Y. Yamada, T. Matsumoto, F. Izumi, and Y. Kodama, Acta Crystallographica Section C 47, 1143 (1991).
- Yu et al. (1991) J. Yu, K. T. Park, and A. J. Freeman, Physica C: Superconductivity 172, 467 (1991).
- Ambrosch-Draxl et al. (1991) C. Ambrosch-Draxl, P. Blaha, and K. Schwarz, Phys. Rev. B 44, 5141 (1991).