Measurements of the hadronic activity and the electroweak production in events with a Z boson and two jets in proton-proton collisions with the CMS experiment
Abstract
The observation of the electroweak production of a Z boson with two jets in pp collisions at TeV with the CMS experiment at the CERN LHC is presented, based on a data sample with an integrated luminosity of 19.7 fb-1. The cross section measurement, combining the muon and electron channels, is in agreement with the theoretical expectations. Radiation patterns of selected Z plus two jets events, and the hadronic activity in the rapidity interval between the jets are also measured. These results are of substantial importance in the more general study of vector boson fusion processes, of relevance for Higgs boson searches and for measurements of electroweak gauge couplings and vector boson scattering.
1 Introduction
In proton collisions at the LHC Vector Boson Fusion (VBF) happens when a valence quark of each one of the colliding protons radiates a or Z boson that subsequently interact or “fuse”. For both valence quark radiating the weak bosons a -channel four-momentum with is exchanged. In this way the two valence quarks are typically scattered away from the beam line and inside the detector acceptance, where they can be revealed as hadronic jets. The distinctive signature of VBF is therefore the presence of these two energetic hadronic jets (tagging jets), roughly in the forward and backward direction with respect to the proton beam line.
The VBF production has a great prominence at the LHC for its importance for the measurements of the Higgs sector couplings [1, 2]. The study of the VBF production of Z or W bosons is therefore an important benchmark to cross-check and validate Higgs VBF measurements [3], but serves further as a probe of triple-gauge-boson couplings [4], for searches for physics beyond the standard model [5, 6], and as a precursor to the measurement of elastic vector boson pair scattering.
On the other hand the VBF production of Z or W bosons has some intriguing differences with respect to the Higgs VBF productions. When focusing on VBF Z/W production, the observed final state is composed of a pair of fermions (ff), either quarks or leptons, from the Z/W decay, associated with a pair of quarks (qq) from the VBF production mechanism; but in this context there is a large number of non-VBF diagrams that lead to identical ffqq final states that can’t be neglected [7].


Considering only the classes of diagrams with purely electroweak (EW) interactions, (like the VBF one), shown in Figure 1, and no QCD interactions, the additional diagrams have strong negative interferences with the VBF productions. These large negative interference effects are in fact related to well-known non-abelian gauge cancellations that preserve the scattering unitarity and the electroweak model theory renormalizability [8]. This situation makes the VBF Z/W channel more complicated but also more interesting.
Another main scope of selecting “VBF-like” Z plus two jets events, is to study the event hadronization properties connected with the peculiar VBF production color structure. In VBF processes and more in general also for the contributing electroweak processes with identical final states, there is no -channel color exchange. This leads to the expectation of a “rapidity gap” of suppressed hadronic activity between the two tagging jets that is a very peculiar feature, in particular in the case of a large rapidity separation between the two tagging jets [9, 10, 11]. Measurements of the additional hadronic activity in the rapidity gap provides a precious validation of the Monte Carlo models simulations and benchmark results for the use of rapidity gap observables, like jet vetoes, in independent VBF event productions (e.g. for Higgs selections).
At the LHC, the EW Z plus two jets process was first measured by the CMS experiment using pp collisions at TeV [12], and more recently by both the ATLAS and CMS experiments with TeV data [13, 14]. The results presented here will focus on the most recent CMS results using pp collisions collected at TeV and corresponding to an integrated luminosity of 19.7 fb-1 [14]. Different methods have been used to confirm the presence of the signal: two multivariate analyses methods (A) and (B) as developed for the 7 TeV analysis [12], and new method (C) with a data-driven model of the main Drell-Yan (DY) background.
2 Event reconstruction and simulation
A detailed description of the CMS detector can be found in Ref. [15]. The central feature of the CMS apparatus is a superconducting solenoid of 6 m internal diameter providing a field of 3.8 T. Within the field volume are a silicon pixel and strip tracker, a crystal electromagnetic calorimeter (ECAL), and a brass/scintillator hadron calorimeter (HCAL) providing coverage for pseudorapidities . The forward calorimeter modules extend the coverage of hadronic jets up to .
Electrons are reconstructed from clusters of energy depositions in the ECAL that match tracks extrapolated from the silicon tracker [16]. Muons are reconstructed by fitting trajectories based on hits in the silicon tracker and in the outer muon system [17].
Jets are clustered using the anti- algorithm [18] with a distance parameter of 0.5. Two different types of jets are used in the analysis: jet-plus-track (JPT) and particle-flow (PF) jets. The JPT jets are reconstructed calorimeter jets whose energy response and resolution are improved by incorporating tracking information according to the JPT algorithm [19]. The CMS particle flow algorithm [20, 21] combines the information from all relevant CMS sub-detectors to identify and reconstruct particle candidates in the event, and PF jets are reconstructed clustering particles identified by the particle flow algorithm.
The signal is defined as the pure EW production of jj final states in the kinematic region defined by dilepton mass GeV, parton transverse momentum GeV, parton pseudorapidity , diparton mass GeV.
Signal events are simulated at leading order (LO) using the MADGRAPH Monte Carlo (MC) generator [22, 23], interfaced to PYTHIA (v6.4.26) [24] for parton showering (PS) and hadronisation. The underlying event is modeled with the so-called tune [25]. The predicted signal cross section is fb, for a single lepton flavor.
Background DY events are also generated with MADGRAPH using a LO matrix element (ME) calculation that includes up to four partons generated from quantum chromodynamics (QCD) interactions, and interfaced to PYTHIA for PS. The ME-PS matching is performed following the ktMLM prescription [26, 27].
Possible LO interference effects between the EW signal and DY processes have been evaluated making use of MADGRAPH, comparing the differential distributions of samples with (i) pure signal, (ii) pure DY plus two partons, and (iii) both signal and DY together.
Other residual backgrounds from ditop () and diboson (VV) productions are generated with MADGRAPH, while single top productions are generated with POWHEG [28].
The CMS detector simulation, based on GEANT4 [29, 30], is applied to all the generated signal and background samples. The presence of multiple pp interactions in the same beam crossing (pileup) is incorporated by simulating additional interactions (both in-time and out-of-time with the collision) with a multiplicity that matches the one observed in data. The average number of pileup events in the 8 TeV data is estimated as 21 interactions per bunch crossing.
3 Event selection and Drell-Yan background model
Opposite sign lepton pairs are selected with validated CMS algorithms for electrons [16] and muons [17]. A relative lepton isolation is defined as , where the sum includes all reconstructed PF objects inside a cone of around the lepton. Each lepton is required to have a transverse momentum in excess of 20 GeV, and a relative isolation smaller than 0.10 and 0.12 for electrons and muons respectively. The invariant mass of selected same flavor leptons is finally required to satisfy GeV, where is the nominal Z-boson mass.
Analyses (A) and (B) make respectively use of PF and JPT reconstructed jets in the selected events, and both rely on MC simulations to predict the main DY plus jets background. Analysis (C) makes use of PF jets, as analysis (A), but uses a model of DY plus jets derived from photon plus jets data events [14], where the requirement GeV is applied to ensure a good photon purity. It is further verified that the data-driven method works correctly with simulated events.
For the rapidity gap and signal measurements events are required to have two PF or JPT jets within , with GeV and with a dijet invariant mass GeV for the -leading and subleading jets.
4 Event jet radiation patterns
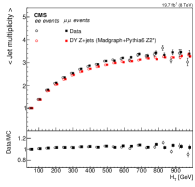
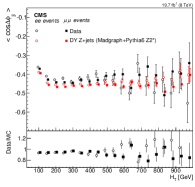
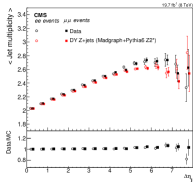
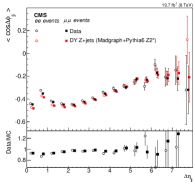
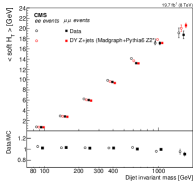
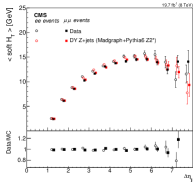
The selected Z plus jets event “radiation patterns” are studied, and for this, according to the prescriptions in Ref. [31], only PF jets with GeV are considered. The investigated observables are : (i) the number of jets, , (ii) the total scalar sum of the transverse momenta of jets reconstructed within , , (iii) between the two jets which span the largest pseudorapidity gap in the event, and (iv) the cosine of the azimuthal angle difference, , for the two jets with criterion (iii).
Figure 2 shows the average number of jets and the average as a function of the total and . The plots indicate that the MADGRAPH + PYTHIA (ME+PS) predictions are in good agreement with the data, even in the regions of largest and .
5 Hadronic activity in the dijet rapidity gap
The rapidity gap activity is studied in events with a Z and two VBF “tagging” PF jets with GeV, making use of charged tracks only, and with additional PF jets in a region of higher signal purity.
For the first study we use tracks associated with the main event primary vertex (PV), defined as the PV with the largest of the tracks used to fit the vertex, and exclude tracks associated with the two leptons or with the tagging jets. A collection of “soft track-jets” is defined by clustering the selected tracks using the anti- algorithm with . The use of track jets represents a validated method [32] to reconstruct jets with energy as low as a few GeV, that is not affected by pileup, thanks to the PV association [33]. The soft variable is defined as the scalar sum of the of up to three leading- soft-track jets in the interval between the tagging jets. The dependence of the average soft for selected Z plus two jet events as a function of and is shown in Fig. 3, and good agreement is observed between data and the simulation in all ranges.
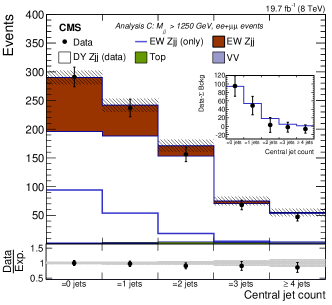
The rapidity gap interval has also been studied using PF jets with GeV, in the GeV region with higher signal purity, to examine possible evidence of the color exchange suppression for the EW signal component. Results are shown in Fig. 4 for the additional jet multiplicity in the dijet rapidity gap, where the data, in agreement with the MC expectations, indicates the presence of the EW signal with a suppressed third jet emission compared to the background-only prediction.
6 Signal measurements
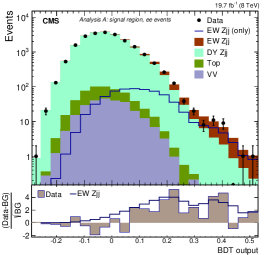
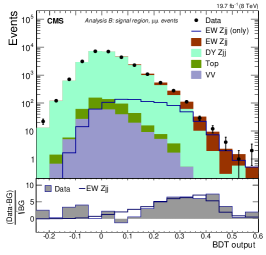
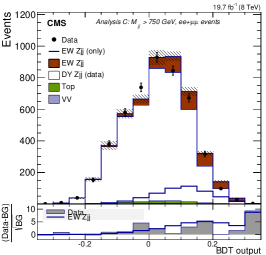
The three analyses make use of multivariate boosted decision tree (BDT) discriminators to acquire the best expected separation of signal and background sources. The BDTs make mostly use of the dijet and Z boson kinematics, with the addition of a quark/gluon (q/g) jet discriminator [12] as both signal jets are originated from quarks while the jets in background events are more probably initiated by gluons emitted from QCD processes.
BDT output distributions for the different analyses are shown in Fig. 5, where a good overall agreement is observed between the data and the MC predictions.
To measure the signal cross-section, each analysis builds a binned likelihood based on the BDT output distributions that is used to fit strength modifiers for both the signal and the main DY background. Nuisance parameters are added to modify the expected rates and shapes according to the estimate of the systematic uncertainties affecting each analysis. Possible interference effects between the signal and the DY background processes is taken into account in the fit, with a parameterisation derived from MADGRAPH, as a function of the variable. The statistical methodology used follows what used in CMS Higgs analysis [34] using asymptotic formulas [35].
A summary of fitted signal strengths is reported in Table 1, together with the breakdown of all relevant uncertainties. The signal strength obtained from the combined fit of two channels in analysis A is corresponding to a measured signal cross section
with the background-only hypothesis excluded with a significance greater than 5.
| Analysis A | Analysis B | Analysis C | |||||
|---|---|---|---|---|---|---|---|
| Luminosity | 0.03 | 0.03 | 0.03 | 0.03 | 0.03 | 0.03 | 0.03 |
| Lepton trigger/ selection | 0.04 | 0.04 | 0.04 | 0.04 | 0.04 | 0.04 | 0.04 |
| Jet Energy Scale | 0.06 | 0.05 | 0.05 | 0.04 | 0.06 | 0.05 | 0.05 |
| Jet Energy Resolution | 0.02 | 0.02 | 0.02 | 0.02 | 0.04 | 0.04 | 0.03 |
| DY background | 0.07 | 0.05 | 0.07 | 0.08 | 0.14 | 0.12 | 0.13 |
| Signal acceptance | 0.03 | 0.04 | 0.04 | 0.04 | 0.06 | 0.06 | 0.06 |
| DY/EW interference | 0.14 | 0.14 | 0.14 | 0.13 | 0.06 | 0.08 | 0.08 |
| Systematic uncertainty | 0.19 | 0.18 | 0.19 | 0.17 | 0.17 | 0.17 | 0.18 |
| Statistical uncertainty | 0.11 | 0.10 | 0.07 | 0.09 | 0.24 | 0.21 | 0.16 |
| 0.82 | 0.86 | 0.84 | 0.89 | 0.91 | 0.85 | 0.88 | |
References
- [1] D. Zeppenfeld, R. Kinnunen, A. Nikitenko, E. Richter-Was, Measuring Higgs boson couplings at the CERN LHC, Phys. Rev. D 62 (2000) 013009. arXiv:hep-ph/0002036, doi:10.1103/PhysRevD.62.013009.
- [2] M. Duhrssen, S. Heinemeyer, H. Logan, D. Rainwater, G. Weiglein, D. Zeppenfeld, Extracting Higgs boson couplings from CERN LHC data, Phys. Rev. D 70 (2004) 113009. arXiv:hep-ph/0406323, doi:10.1103/PhysRevD.70.113009.
- [3] V. A. Khoze, M. G. Ryskin, W. J. Stirling, P. H. Williams, A Z-monitor to calibrate Higgs production via vector boson fusion with rapidity gaps at the LHC, Eur. Phys. J. C 26 (2003) 429. arXiv:hep-ph/0207365, doi:10.1140/epjc/s2002-01069-2.
- [4] U. Baur, D. Zeppenfeld, Measuring three vector boson couplings in qq qq W at the SSC, procs. of Workshop on Physics at Current Accelerators and the SupercolliderarXiv:hep-ph/9309227.
- [5] G.-C. Cho, K. Hagiwara, J. Kanzaki, T. Plehn, D. Rainwater, T. Stelzer, Weak boson fusion production of supersymmetric particles at the CERN LHC, Phys. Rev. D 73 (2006) 054002. arXiv:hep-ph/0601063, doi:10.1103/PhysRevD.73.054002.
- [6] B. Dutta, A. Gurrola, W. Johns, T. Kamon, P. Sheldon, S. Kuver, Vector boson fusion processes as a probe of supersymmetric electroweak sectors at the LHC, Phys. Rev. D 87 (2013) 035029. arXiv:1210.0964, doi:10.1103/PhysRevD.87.035029.
- [7] C. Oleari, D. Zeppenfeld, QCD corrections to electroweak jj and jj production, Phys. Rev. D 69 (2004) 093004. arXiv:hep-ph/0310156, doi:10.1103/PhysRevD.69.093004.
- [8] G. ’t Hooft, M. Veltman, Regularization and Renormalization of Gauge Fields, Nucl.Phys. B44 (1972) 189–213. doi:10.1016/0550-3213(72)90279-9.
- [9] H. Chehime, D. Zeppenfeld, Single W and Z boson production as a probe for rapidity gaps at the SSC, Phys.Rev. D47 (1993) 3898–3905. doi:10.1103/PhysRevD.47.3898.
- [10] J. Bjorken, Rapidity gaps and jets as a new physics signature in very high-energy hadron hadron collisions, Phys. Rev. D 47 (1993) 101. doi:10.1103/PhysRevD.47.101.
- [11] D. L. Rainwater, R. Szalapski, D. Zeppenfeld, Probing color singlet exchange in + two jet events at the CERN LHC, Phys.Rev. D54 (1996) 6680–6689. arXiv:hep-ph/9605444, doi:10.1103/PhysRevD.54.6680.
- [12] S. Chatrchyan, et al., Measurement of the hadronic activity in events with a Z and two jets and extraction of the cross section for the electroweak production of a Z with two jets in pp collisions at = 7 TeV, JHEP 10 (2013) 062. arXiv:1305.7389, doi:10.1007/JHEP10(2013)062.
- [13] G. Aad, et al., Measurement of the electroweak production of dijets in association with a Z-boson and distributions sensitive to vector boson fusion in proton-proton collisions at = 8 TeV using the ATLAS detector, JHEP 04 (2014) 031. arXiv:1401.7610, doi:10.1007/JHEP04(2014)031.
- [14] V. Khachatryan, et al., Measurement of electroweak production of two jets in association with a Z boson in proton-proton collisions at TeV, arXiv:1410.3153.
- [15] S. Chatrchyan, et al., The CMS experiment at the CERN LHC, JINST 3 (2008) S08004. doi:10.1088/1748-0221/3/08/S08004.
-
[16]
CMS Collaboration, Electron
reconstruction and identification at = 7 tev, CMS Physics
Analysis Summary CMS-PAS-EGM-10-004 (2010).
URL http://cdsweb.cern.ch/record/1299116 - [17] S. Chatrchyan, et al., Performance of CMS muon reconstruction in pp collision events at = 7 TeV, JINST 7 (2012) P10002. arXiv:1206.4071, doi:10.1088/1748-0221/7/10/P10002.
- [18] M. Cacciari, G. P. Salam, G. Soyez, The anti-k(t) jet clustering algorithm, JHEP 04 (2008) 063. arXiv:0802.1189, doi:10.1088/1126-6708/2008/04/063.
-
[19]
CMS Collaboration, Jet plus
tracks algorithm for calorimeter jet energy corrections in CMS, CMS
Physics Analysis Summary CMS-PAS-JME-09-002 (2009).
URL http://cdsweb.cern.ch/record/1190234 -
[20]
CMS Collaboration, Particle–flow
event reconstruction in CMS and performance for jets, taus, and met, CMS
Physics Analysis Summary CMS-PAS-PFT-09-001 (2009).
URL http://cdsweb.cern.ch/record/1194487 -
[21]
CMS Collaboration, Commissioning
of the particle flow reconstruction in minimum-bias and jet events from pp
collisions at 7 TeV, CMS Physics Analysis Summary CMS-PAS-PFT-10-002
(2010).
URL http://cdsweb.cern.ch/record/1279341 - [22] J. Alwall, M. Herquet, F. Maltoni, O. Mattelaer, T. Stelzer, MadGraph 5: Going Beyond, JHEP 06 (2011) 128. arXiv:1106.0522, doi:10.1007/JHEP06(2011)128.
- [23] J. Alwall, R. Frederix, S. Frixione, V. Hirschi, F. Maltoni, O. Mattelaer, H.-S. Shao, T. Stelzer, P. Torrielli, M. Zaro, The automated computation of tree-level and next-to-leading order differential cross sections, and their matching to parton shower simulations, JHEP 07 (2014) 079. arXiv:1405.0301, doi:10.1007/JHEP07(2014)079.
- [24] T. Sjöstrand, S. Mrenna, P. Skands, PYTHIA 6.4 Physics and Manual, JHEP 05 (2006) 026. arXiv:hep-ph/0603175, doi:10.1088/1126-6708/2006/05/026.
- [25] S. Chatrchyan, et al., Measurement of the Underlying Event Activity at the LHC with = 7 TeV and Comparison with = 0.9 TeV, JHEP 09 (2011) 109. arXiv:1107.0330, doi:10.1007/JHEP09(2011)109.
- [26] M. L. Mangano, M. Moretti, F. Piccinini, M. Treccani, Matching matrix elements and shower evolution for top-quark production in hadronic collisions, JHEP 01 (2007) 013. arXiv:hep-ph/0611129, doi:10.1088/1126-6708/2007/01/013.
- [27] J. Alwall, S. Höche, F. Krauss, N. Lavesson, L. Lönnblad, F. Maltoni, M. L. Mangano, M. Moretti, C. G. Papadopoulos, F. Piccinini, S. Schumman, M. Treccani, J. Winter, M. Worek, Comparative study of various algorithms for the merging of parton showers and matrix elements in hadronic collisions, Eur. Phys. J. C 53 (2008) 473. arXiv:0706.2569, doi:10.1140/epjc/s10052-007-0490-5.
- [28] S. Alioli, P. Nason, C. Oleari, E. Re, A general framework for implementing NLO calculations in shower Monte Carlo programs: the POWHEG BOX, JHEP 06 (2010) 043. arXiv:1002.2581, doi:10.1007/JHEP06(2010)043.
- [29] J. Allison, et al., Geant4 developments and applications, IEEE Trans. Nucl. Sci. 53 (2006) 270. doi:10.1109/TNS.2006.869826.
- [30] S. Agostinelli, et al., GEANT4 – a simulation toolkit, Nucl. Instrum. Meth. A 506 (2003) 250. doi:10.1016/S0168-9002(03)01368-8.
- [31] SM and NLO Multileg Working Group, The SM and NLO Multileg Working Group: Summary report (2010). arXiv:1003.1241.
-
[32]
CMS Collaboration, Commissioning
of trackjets in pp collisions at = 7 tev, CMS Physics Analysis
Summary CMS-PAS-JME-10-006 (2010).
URL http://cdsweb.cern.ch/record/1275133 -
[33]
CMS Collaboration, Performance of
jet reconstruction with charged tracks only, CMS Physics Analysis Summary
CMS-PAS-JME-08-001 (2009).
URL http://cdsweb.cern.ch/record/1198681 - [34] S. Chatrchyan, et al., Observation of a new boson at a mass of 125 GeV with the CMS experiment at the LHC, Phys. Lett. B 716 (2012) 30. arXiv:1207.7235, doi:10.1016/j.physletb.2012.08.021.
- [35] G. Cowan, K. Cranmer, E. Gross, O. Vitells, Asymptotic formulae for likelihood-based tests of new physics, Eur. Phys. J. C 71 (2011) 1554. arXiv:1007.1727, doi:10.1140/epjc/s10052-011-1554-0.