On the Black Hole Masses In Ultra-luminous X-ray Sources
Abstract
Ultra-luminous X-ray sources (ULXs) are off-nuclear X-ray sources in nearby galaxies with X-ray luminosities 10 erg s. The measurement of the black hole (BH) masses of ULXs is a long-standing problem. Here we estimate BH masses in a sample of ULXs with XMM-Newton observations using two different mass indicators, the X-ray photon index and X-ray variability amplitude based on the correlations established for active galactic nuclei (AGNs). The BH masses estimated from the two methods are compared and discussed. We find that some extreme high-luminosity ( erg s) ULXs contain the BH of 10-10 . The results from X-ray variability amplitude are in conflict with those from X-ray photon indices for ULXs with lower luminosities. This suggests that these ULXs generally accrete at rates different from those of X-ray luminous AGNs, or they have different power spectral densities of X-ray variability. We conclude that most of ULXs accrete at super-Eddington rate, thus harbor stellar-mass BH.
1 Introduction
A population of compact X-ray sources in nearby galaxies with observed isotropic X-ray luminosities 10 erg s are called Ultra-luminous X-ray sources (ULXs; Makishima et al. 2000). It is widely accepted that ULXs are accreting black holes (BHs; Fabbiano 2006; Roberts 2007). ULXs may contain 3 classes of BHs: normal stellar mass BHs (10 ), massive stellar BHs ( 100 ), and intermediate mass BHs (IMBH; ; Feng & Soria 2011).
There is a lack of reliable method to measure the BH masses for ULXs. Long-term observations of optical counterparts of ULXs might provide a dynamical BH mass measurement. The broad He ii 4686 line may change its velocity between two observations (Pakull et al. 2006). There is only one dynamical measurement for the BH mass for M 101 ULX-1 (Liu et al. 2013). Generally, the optical lines were found to vary randomly (Roberts et al. 2011). The accretion disk temperature derived from X-ray spectral fitting will place constraints on BH masses for ULXs (Miller et al. 2003). However, the real disk temperature is controversial because the disk blackbody fitting may be unphysical (Stobbart et al. 2006). Radio observations could constrain BH mass via the fundamental plane (Merloni et al. 2003; Falcke et al. 2004). However, radio observations are generally difficult in resolving the point source of a ULX and the error of mass estimates is large (Webb et al. 2012; Cseh et al. 2012).
There are well-established correlations between X-ray photon index and Eddington ratio, X-ray Variability Amplitude (XVA; also known as “excess variance”; Nandra et al. 1997) and BH mass, in X-ray luminous active galactic nuclei (AGNs). We apply these correlations to estimate BH masses for ULXs and check consistency of the results. We find that ULXs generally accrete at different rates from X-ray luminous AGNs except some extreme high-luminosity ULXs ( erg s). Throughout this work, we assume the concordance cosmology of =71 km s Mpc, , and .
2 estimated from and
X-ray spectral studies of accreting BHs including Galactic X-ray binaries (XRBs) and AGNs show complex correlations between the photon index, of the power-law component (generally measured over the keV range, ) and the accretion rate in unit of the Eddington ratio, , where is the bolometric luminosity and is the Eddington luminosity, over a large range (Lu & Yu 1999; Wu & Gu 2008; see Figure 1). At the very low , flattens as increases (Corbel et al. 2008; Gu & Cao 2009). Above a transition point in the range of (Younes et al. 2011; Qiao & Liu 2013), increases as increases (Wang et al. 2004; Shemmer et al. 2006; Zhou & Zhao 2010; Jin et al. 2012). At the super Eddington region (), we do not know how the behaves but it might turn systematically flatter than the correlations predict (Ai et al. 2011; Kamizasa et al. 2012).
Zhou & Zhao (2010) present a correlation between and both Eddington ratio and bolometric correction, based on simultaneous X-ray, UV, and optical observations of reverberation-mapped AGNs as follows,
| (1) |
| (2) |
We assume that ULXs follow the same correlations. If ULXs accrete at the rate of (Part II in Figure 1), we can estimate () from and using Equations (1) and (2).
Sutton et al. (2012) presented a sample of eight extreme luminosity ULXs (with erg s) selected from the cross-correlation of the 2XMM-DR1 and RC3 catalogues. These objects represent the high-luminosity end of ULX populations. We estimate for the ULX sample with extreme luminosities (Table 1). The results show that log() is in the range of for these objects.
González-Martín et al. (2011) collected all bright ULXs from the literatures (Heil et al. 2009; Galdstone et al. 2009). This sample consists of 15 ULXs with currently available best-quality XMM-Newton data. We also estimate for these objects. We find that log() is in the range of (Table 2).
3 estimated from XVA
The X-ray Variability Amplitude (XVA), , is the variance of a light curve normalized by its mean squared after correcting for experimental noise (Nandra et al. 1997),
| (3) |
Zhou et al. (2010) present the anti-correlation between and XVA in the 2-10 keV band derived from a sample of reverberation mapping AGNs,
| (4) |
It was found that this anti-correlation shows a small intrinsic dispersion, no larger than the uncertainties in (Zhou et al. 2010; Ponti et al. 2012; Kelly et al. 2013). This correlation can be explained by a universal broken power-law shape of the power spectral density (PSD) function from XRBs to AGNs (Markowitz et al. 2003; McHardy et al. 2004; Zhou et al. 2010).
González-Martín et al. (2011) calculated the XVA in 2-10 keV band for the sample with best X-ray data quality (listed in Table 2). It was found that the XVAs for this sample are generally quite small. Assuming these objects have a universal shape of the PSD (and thus Equation (4) is applicable), can be estimated from the XVA. The resulting value of are quite large, comparable to those of AGNs. If this is true, some ULXs might accrete at a very low rate. But this result is in conflict with that from X-ray photon indices, which predict a log() for these objects in the range of (See Table 2).
4 Discussion
The BH masses estimated from the X-ray photon indices for extreme-luminosity ULXs (Table 1) are in range of . This is in agreement with the results from their radio observations (Mezcua et al. 2013). Thus these objects are very likely to harbor massive BH, with the same accretion rate as luminous AGNs.
The XVA are small for objects with the best X-ray data quality (Table 2), this leads to very large estimates using XVA. It was found that extreme-luminosity ULXs (objects in Table 1) show larger fractional X-ray variability (square root of XVA) than low-luminosity ULXs in the keV band (Sutton et al. 2012). It is very unlikely that the extreme-luminosity ULXs generally have smaller than low-luminosity ULXs. It is very likely from these data that there are different populations among ULXs (and thus different PSD shape). However, the PSD shape of ULXs could not be constraint well with the current data (Heil et al. 2009). It was suggested that some ULXs in Table 2 may have a PSD with a doubly power-law shape (González-Martín et al. 2011).
It has been suggested that the observed characteristics of the source depend on both accretion rate and the inclination of the ULX system (Sutton et al. 2013). The accretion rate of a source should be the key factor. The simplest conclusion we can draw from those spectral and timing results is that it is not in the regime where both correlations apply for objects in Table 2. There is an additional reason why the data suggest we are not in the regime: very few or none of those ULXs is in the high-soft state, as we would expect at those values of .
The and XVA depend on the ratio between power in the Compton cloud and power in the accretion disk. For below the transit point, the hot inner flow or the jet becomes slightly more dominant as increases (Gardner & Done 2013), so goes down up to 0.004. Then a cold disk becomes more important, so increases for (Qiao & Liu 2013; Cao & Wang 2014). Then the scattering region (e.g. outflows in slim disk models) becomes more dominant again, so it is expected to decrease again for (See Figure 1).
in some ULXs decreases as the X-ray flux increases, for an instance, NGC 1313 X-2 (Feng & Kaaret 2006; Wu & Gu 2008). This suggests that ULXs are either at , or (see Figure 1). A low XVA is also associated with a dominant scattering region/outflows, so ULXs with low XVA are probably consistent with either , or . It is hard to distinguish the spectral and timing properties from the hard state , or the super-Eddington state . They are both dominated by inverse-Compton scattering over thermal disk emission. They both have outflows and low variability.
A few objects may favor the interpretation that ULXs are at . We are in favor of the other scenario, , for most of objects in Table 2. we exclude the regime for most of objects. so we generally cannot directly apply those correlations to estimate BH mass. There are 6 reasons why we think most of ULXs are more likely to be at (that is, ) rather than (that is, ) as follows:
a) these ULXs in star-forming galaxies follow the same luminosity function as (stellar) high-mass X-ray binaries (Swartz et al. 2011) . ULXs in old galaxies follow the same luminosity distribution as low-mass X-ray binaries (Kim & Fabbiano 2004; Swartz et al. 2011). Their number and luminosity matched exactly (see the review by Feng & Soria 2011). It would therefore be an incredible coincidence if X-ray binaries and ULXs were completely different objects.
b) ULXs have the same spatial distribution (number of sources at a given distance from the centre of a galaxy) as X-ray binaries (Swartz et al. 2011). Again, it would be an amazing coincidence if X-ray binaries (formed in situ) and BHs accreted from outside had the same radial distribution.
c) ULXs are more frequently found in starburst galaxies, associated with a high star formation rate (Fabbiano 2006). This suggests that they are formed via massive star formation. There is no reason why accretion of satellite dwarf galaxies should favor starburst systems.
d) In terms of specific frequency (number per unit galaxy mass), ULXs are more frequent in small disk galaxies ( , spectral type Sc) rather than larger spirals or ellipticals (Swartz et al. 2011) . However, if ULXs came from dwarf accretion, they should be more abundant in those types. Scd galaxies do not have much satellite accretion.
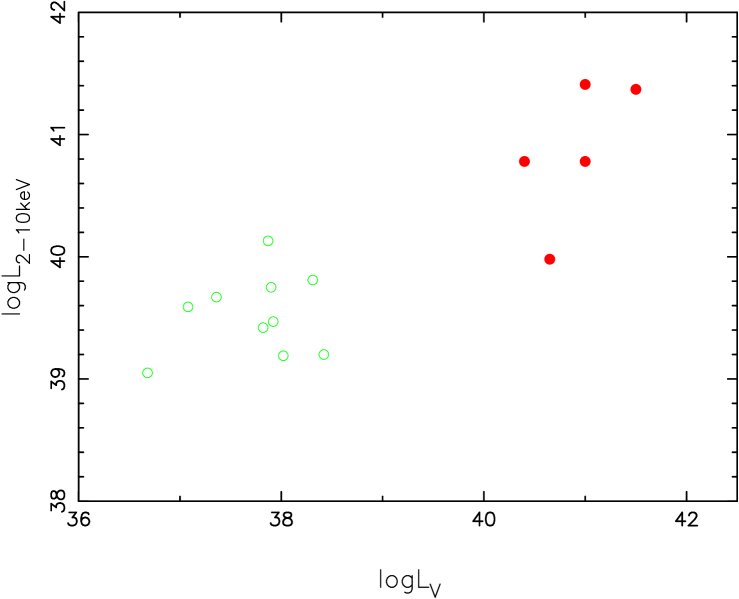
e) Figure 2 shows the X-ray luminosities against the optical V-band luminosities for some ULXs and LINERs. ULXs (open circle) generally have a large ratio of of about 100, like in stellar BHs with a donor star (Tao et al. 2011). Low-luminosity AGNs (filled circle) may have the same X-ray luminosity ( a few erg s) but they tend to have more luminous optical nuclei, (Younes et al. 2012).
f) If many ULXs had , and came from accreted dwarfs, we would expect a sign of a galaxy merger or disruption around them. A BH with lives in a massive globular cluster, or perhaps in an Scd galaxy with a nuclear star cluster (Mapelli et al. 2012). But most ULXs do not show any evidence of a disrupted galaxy around them, and they are generally not located in massive star clusters. This does not rule out the merger scenario but does not give any evidence in favor of it.
It is possible that some ULXs might be off-nuclei analogs of low-luminosity AGNs. Most likely, some ULXs behave like LINER sometimes, when they have the same luminosity and ionize the surrounding medium. Some ULXs are found to be associated with weak H line (Wiersema et al. 2010; Cseh et al. 2012). Pakull et al. (2010) reported an off-nucleus super radio bubble in the galaxy NGC 7793. Generally, most of ULXs lack such observations. If future large optical and radio telescopes, such as TMT, ALMA, SKA could reveal low-ionization emission lines associated with some ULXs, we call such objects Low Ionization Off-Nuclear Emission line Region (LIONER).
5 Conclusions
Under the assumption that ULXs are accreting at the same rates as X-ray luminous AGNs, we estimate black hole masses for ULXs using the X-ray photon index and X-ray variability amplitude and check consistence of the results. We find the results from X-ray variability amplitude are in conflict with these from X-ray photon indices, except for the objects with extreme luminosities. This suggests that ULXs generally accrete at rates different from those of X-ray luminous AGNs, or they have different power spectral densities of X-ray variability. We conclude that most of ULXs accrete at super-Eddington rate, thus harbor steller-mass black holes. The objects with extreme luminosities may be massive black holes ( ), with the same range of accretion rates as luminous AGNs.
References
- (1) Ai, Y. L., Yuan, W., Zhou, H. Y., Wang, T. G., & Zhang, S. H. 2011, ApJ, 727, 31
- (2) Cseh, D. et al. 2012, ApJ, 749, 17
- (3) Corbel, S., Körding, E., & Kaaret, P. 2008, MNRAS, 389, 1697
- (4) Cao, X. W. & Wang, J. X. 2014, MNRAS, in press, preprint(arXiv: 1406.6442)
- (5) Fabbiano, G. 2006, ARA&A, 44, 323
- (6) Falcke, H., Körding, E., & Markoff, S. 2004, A&A, 414, 895
- (7) Feng, H. & Soria, R. 2011, NewAR, 55, 166
- (8) Feng, H. & Kaaret, P. 2006, ApJ, 650, 75
- (9) Gardner, E., & Done, C. 2013, MNRAS, 434, 3454
- (10) Gladstone, J. C., Roberts, T. P., & Done, C. 2009, MNRAS, 397, 1836
- (11) González-Martín, O., Papadakis, I., Reig, P., & Zezas, A. 2011, A&A, 526, 132
- (12) Gu, M. F., & Cao, X. W. 2009, MNRAS, 399, 349
- (13) Heil, L. M., Vaughan, S., & Roberts, T. P. 2009, MNRAS, 397, 1061
- (14) Jin, C., Ward, M., & Done, C. 2012, MNRAS, 425, 907
- (15) Kamizasa, N., Terashima, Y., & Awaki, H. 2012, ApJ, 751, 39
- (16) Kelly, B. C., Treu, T., Malkan, M., Pancoast, A., & Woo, J. H. 2013, ApJ, 779, 187
- (17) Kim, D. W., & Fabbiano, G. 2004, ApJ, 611, 846
- (18) Liu, J. F., Bregman, J. N., Bai, Y., Justham, S., & Crowther, P. 2013, Nature, 503, 500
- (19) Lu, Y., & Yu, Q. 1999, ApJ, 526, 5
- (20) Makishima, K. et al. 2000, ApJ, 535, 632
- (21) Markowitz, A., et al. 2003, ApJ, 593, 96
- (22) Mapelli, M., Zampieri, L., & Mayer, L. 2012, MNRAS, 423, 1309
- (23) McHardy, I. M., Papadakis, I. E., Uttley, P., Page, M. J., & Mason, K. O. 2004, MNRAS, 348, 783
- (24) Merloni, A., Heinz, S., & di Matteo, T. 2003, MNRAS, 345, 1057
- (25) Mezcua, M., Roberts, T. P., Sutton, A. D., & Lobanov, A. P. 2013, MNRAS, 436, 3128
- (26) Miller, J. M., Fabbiano, G., Miller, M. C., & Fabian, A. C. 2003, ApJ, 585, L37
- (27) Nandra, K., George, I. M., Mushotzky, R. F., Turner, T. J., & Yaqoob, T. 1997, ApJ, 476, 70
- (28) Pakull, M. W., Grisé, F., & Motch, C. 2006, IAUS, 230, 293
- (29) Pakull, M. W., Soria, R., & Motch, C. 2010, Nature, 466, 209
- (30) Ponti, G., et al. 2012, A&A, 542, 83
- (31) Qiao, E. L., & Liu, B. F. 2013, ApJ, 764, 2
- (32) Roberts, T. P. 2007, Ap&SS, 311, 203
- (33) Roberts, T. P., Gladstone, J. C., Goulding, A. D., Swinbank, A. M., Ward, M. J., Goad, M. R., & Levan, A. J. 2011, AN, 332, 398
- (34) Shemmer, O, Brandt, W. N., Netzer, H., Maiolino, R., & Kaspi, S. 2006, ApJ, 646, L29
- (35) Stobbart, A. M., Roberts, T. P., & Wilms, J. 2006, MNRAS, 368, 397
- (36) Sutton, A. D., Roberts, T. P., Walton, D. J., Gladstone, J. C., & Scott, A. E. 2012, MNRAS, 423, 1154
- (37) Sutton, A. D., Roberts, T. P., & Middleton, M. J. 2013, MNRAS, 435, 1758
- (38) Swartz, D. A., Soria, R., Tennant, A. F., & Yukita, M. 2011, ApJ, 741, 49
- (39) Tao, L., Feng, H., Grisé, F., & Kaaret, P. 2011, ApJ, 737, 81
- (40) Wang, J. M., Watarai, K. Y., & Mineshige, S. 2004, ApJ, 607, L107
- (41) Webb, N. et al. 2012, Sci, 337, 554
- (42) Wiersema, K., Farrell, S. A., Webb, N. A., Servillat, M., Maccarone, T. J., Barret, D., & Godet, O. 2010, ApJ, 721, 102
- (43) Wu, Q. W., & Gu, M. F. 2008, ApJ, 682, 212
- (44) Younes, G., Porquet, D., Sabra, B., & Reeves, J. N. 2011, A&A, 530, 149
- (45) Younes, G., Porquet, D., Sabra, B., Reeves, J. N., & Grosso, N. 2012, A&A, 539, 104
- (46) Zhou, X. L., Zhang, S. N., Wang, D. X., & Zhu, L. 2010, ApJ, 710, 16
- (47) Zhou, X. L., & Zhao, Y. H. 2010, ApJ, 720, L206

| 2XMM source | D(Mpc) | log | |||
|---|---|---|---|---|---|
| 2XMM J011942.7+032421 | 32.7 | ||||
| 2XMM J024025.6−082428 | 18.9 | ||||
| 2XMM J072647.9+854550 | 33.3 | ||||
| 2XMM J121856.1+142419 | 33.2 | ||||
| 2XMM J134404.1−271410 | 95.1 | ||||
| 2XMM J151558.6+561810 | 14.9 | ||||
| 2XMM J163614.0+661410 | 96.2 | ||||
| 2XMM J230457.6+122028 | 32.8 |
Notes: Maximum detected 0.2-12 keV luminosity of the ULX candidate, based on the 2XMM broad band fluxes and the quoted distance, in units of erg s. 2-10 keV luminosity of the ULX candidate, in units of erg s. is estimated from and based on the correlations derived from radio-quiet reverberation mapping AGNs (Zhou & Zhao 2010).