Dust continuum emission as a tracer of gas mass in galaxies
Abstract
We use a sample of 36 galaxies from the KINGFISH (Herschel IR), HERACLES (IRAM CO), and THINGS (VLA HI) surveys to study empirical relations between Herschel infrared (IR) luminosities and the total mass of the interstellar gas (H2 + HI). Such a comparison provides a simple empirical relationship without introducing the uncertainty of dust model fitting. We find tight correlations, and provide fits to these relations, between Herschel luminosities and the total gas mass integrated over entire galaxies, with the tightest, almost linear, correlation found for the longest wavelength data (SPIRE500). However, we find that accounting for the gas-phase metallicity (affecting the dust-to-gas ratio) is crucial when applying these relations to low-mass, and presumably high-redshift, galaxies. The molecular (H2) gas mass is found to be better correlated with the peak of the IR emission (e.g. PACS160), driven mostly by the correlation of stellar mass and mean dust temperature. When examining these relations as a function of galactocentric radius, we find the same correlations, albeit with a larger scatter, up to radius of (containing most of a galaxy’s baryonic mass). However, beyond that radius, the same correlations no longer hold, with increasing gas (predominantly HI) mass relative to the infrared emission. The tight relations found for the bulk of the galaxy’s baryonic content suggest that total gas masses of disk-like (non-merging/ULIRG) galaxies can be inferred from far-infrared continuum measurements in situations where only the latter are available, e.g. in ALMA continuum observations of high-redshift galaxies.
Subject headings:
galaxies:ISM–infrared:galaxies1. Introduction
Two of the fundamental parameters driving the evolution of galaxies across cosmic time is their total gas mass, and gas mass surface density. The total gas mass of galaxies limits the total amount of stars that can form in a galaxy at any time, while its surface density is directly linked with the rate of star formation via the observed Kennicutt-Schmidt relation (e.g. Kennicutt, 1998; Leroy et al., 2013). The increase of the cosmic star formation rate (SFR) density up to redshifts 3-4 (e.g. Karim et al., 2011) is theorized to be caused by the increase in the cosmic gas mass density (and therefore the average total gas mass of galaxies) with increasing redshift (as suggested by e.g. Obreschkow & Rawlings, 2009). However, directly measuring the gas mass density out to these redshifts is a difficult task.
Existing large area surveys of the 21 cm H i fine-structure line that trace the atomic gas have only measured the local Universe (, e.g. HIPASS, Barnes et al. (2001), and ALFALFA, Haynes et al. (2011)). In the near future, deeper surveys with the precursors for the Square Kilometer Array (SKA) such as DINGO (Meyer, 2009) on the Australian SKA Pathfinder (ASKAP) will reach at most (Duffy et al., 2012). However, it will not be until SKA is available that H i will be observed in emission at , and even then it is expected to reach at most (Abdalla & Rawlings, 2005). This leaves only H i absorption line studies, such as damped Ly systems (e.g. Prochaska et al., 2005), as the only determination of the evolution of the HI mass function over cosmic time.
For molecular gas, surveys of large numbers of galaxies have been limited due to the difficulty of observing the transitions from the CO molecule in the (sub–)mm. The two largest efforts have been the FCRAO Extragalactic CO Survey (Young et al., 1995), which measured the CO line in 300 nearby galaxies, and the COLD GASS survey (Saintonge et al., 2011a, b) which measured fluxes in the CO line for a purely mass-selected sample of galaxies at , matched in GALEX, Arecibo, and SDSS imaging. The FCRAO sample has recently been extended with CO observations of a further 59 nearby galaxies as part of the Herschel Reference Survey (Boselli et al., 2014a, b). At higher redshift the CO lines are still observable, but samples are smaller in number. While molecular gas measures were originally limited to very luminous, rare objects (e.g. Solomon & Vanden Bout, 2005), more typical galaxies are now being observed out to (e.g., EGNoG; Bauermeister et al., 2013), and farther out to (e.g., PHIBSS; Tacconi et al., 2013), with a full review of these surveys available in Carilli & Walter (2013). With ALMA now operating, the samples of high-redshift galaxy molecular gas masses will only increase. However, given its small instantaneous field-of-view, ALMA is a relatively slow survey instrument, and, while already providing impressive targeted observations, will not be suitable for very wide area blind CO surveys at (Obreschkow & Rawlings, 2009), though smaller blind searches have already been carried out in smaller regions (e.g., Decarli et al., 2014; Walter et al., 2014).
Another potential tracer of the total gas mass is the infrared emission arising from dust. The amount of dust has long been known to be associated with gas column within the Milky Way (e.g. Jenkins & Savage, 1974), and dust extinction has been used to map gas columns at higher dynamic ranges and spatial resolution than available from gas emission lines (e.g. Lada et al., 1994; Kainulainen et al., 2011). However, in extragalactic studies the lower physical resolution mixes lines of sight, making internal extinction a poor tracer of the gas column (e.g. Kreckel et al. (2013), and see also Boquien et al. (2013)), and relying on the rare occultation of relatively bright background sources is not feasible for large extragalactic studies. However, the dust continuum emission in the infrared – submillimeter range is a direct tracer of the total dust opacity and, if a mean grain emissivity is assumed, the dust column.
The idea of using the sub-mm continuum emission to measure the mass of the ISM has existed for a while, having been suggested by Hildebrand (1983), and used by Guelin et al. (1993, 1995) in nearby galaxies. As an independent tracer of the gas mass, the dust continuum has also been directly compared with CO observations in nearby galaxies to constrain the conversion factor between CO and gas mass (i.e. the “X” factor, Israel (1997), Boselli et al. (2002), Magrini et al. (2011), Sandstrom et al. (2013), and the review by Bolatto et al. (2013)). Direct comparisons of the sub-mm continuum and gas content in galaxies have also been explored in Corbelli et al. (2012), Eales et al. (2012), and Scoville et al. (2014), and this correlation has already been used to estimate the total gas masses in higher redshift galaxies by Magdis et al. (2012) and Scoville et al. (2014).
Yet the dust continuum emission is not a simple direct tracer of the gas mass. The dust emission is dependent upon the temperature of the dust grains, the conversion to dust column depends upon knowledge of the grain emissivity, and finally, the conversion of dust column to gas mass depends upon the dust to gas ratio. Modelling the IR spectral energy distribution typically involves the use of both physically-based models for the dust grains and reasonable assumptions for the heating of the grains to determine the total dust column directly from the IR emission (see e.g. Draine & Li, 2007). This approach has obtained reasonable results in many nearby galaxies (e.g. Draine et al., 2007; Aniano et al., 2012; Compiègne et al., 2011). However, systematic uncertainties lie in both the dust models and the assumptions on the heating radiation field (and the parameters in each), as well as the fitting procedure itself, introducing another level of complexity in determining the interstellar gas mass. The recent work of Eales et al. (2012) demonstrated that using a simple modified-blackbody model for the dust emission and a constant conversion factor from dust to gas are not unreasonable assumptions for the determination of total gas mass. They found a good correlation of the Herschel-based dust masses with total gas masses determined from HI and CO data in ten nearby galaxies, with an estimated 25% error on the dust method. However, systematic uncertainties were found to dominate this method as well, with Eales et al. (2012) demonstrating the sensitivity of the determined dust mass to the fitted dust temperature, and the sensitivity of this dust temperature to both the assumed emissivity (as demonstrated in detail in Shetty et al., 2009) and the observed wavelengths fitted.
We can bypass these systematic issues by comparing directly the far-IR to submm continuum emission to the various tracers of the gas phases directly. We can then determine calibrations linking the monochromatic IR emission and gas tracers by exploring a wide range of objects, which also enable the exploration of dependencies on other physical parameters like gas-phase metallicity. A direct comparison of the sub-mm emission with gas tracers has already been explored somewhat by Bourne et al. (2013), who used a sample of 20 galaxies within the Herschel-ATLAS survey with existing H i and new CO data. They found that the sub-millimeter fluxes appear to be strongly associated with the diffuse atomic and molecular gas phases, and that the FIR/CO luminosity ratio decreases with increasing luminosity. However, even though several IR fluxes were explored, the range in the sub-mm luminosities of the galaxies was small. The most detailed examination to date has been by Scoville et al. (2014), who used both local luminous IR galaxies and higher redshift submillimeter galaxies with 850 fluxes to calibrate the ratio of sub-millimeter luminosity to the ISM mass assuming a constant emissivity to mass ratio. They found that the ISM mass and 850 luminosity correlated within a factor of two for their galaxy sample, and then used this correlation to determine the ISM masses in stacked submillimeter ALMA observations of high redshift galaxies. However their analysis was focussed on more luminous sources and may not hold for all galaxies.
To improve upon these surveys we use the most comprehensive nearby galaxy surveys available: the KINGFISH (Kennicutt et al., 2011), THINGS (Walter et al., 2008), and HERACLES (Leroy et al., 2009) surveys for the IR, HI, and CO data, respectively. The galaxies in these surveys cover a wide range in metallicity, stellar mass, and star formation rates, and with all these parameters measured in a consistent manner from the associated ancillary datasets. It thus represents one of the largest homogenous datasets for CO and H i in nearby galaxies, and covers the full IR spectral energy distribution (SED) from 70 to 500. In addition, the galaxies in the sample are near enough that they can be resolved and radial trends can be examined as well. This enables us to determine the correlation of sub-mm emission with gas mass over a wide range of galaxy parameters, and explore the limiting conditions where the sub-mm emission can be used. In the following section we introduce the surveys and the galaxy sample, followed by a description of the theory in section 3.1, and explore a direct comparison of the integrated IR emission to the total gas masses of galaxies in section 3. We explore the issues of internal variations and radial trends in section 4, and summarize our findings in section 5.
2. Datasets
2.1. Galaxy Sample
Our galaxy sample arises from the intersection of three complementary large programs surveying nearby galaxies; KINGFISH(Kennicutt et al., 2011), THINGS (Walter et al., 2008), and HERACLES (Leroy et al., 2009). These programs provide us with tracers of both the integrated gas and dust masses of galaxies, and resolved maps down to kpc scales extending well beyond the optical radii for the HI and IR data. The matched datasets result in 36 galaxies, ranging from dwarf galaxies to massive spirals, with the names and galaxy properties listed in Table 1. All values were taken from Kennicutt et al. (2011) and references therein except for the metallicity which is from Moustakas et al. (2010) when available. The sample is dominated by spiral galaxies and irregulars. The stellar masses and star formation rates both cover approximately 4 orders of magnitude, and approximately 2 orders of magnitude in specific star formation rates (sSFR).
| Galaxy | R.A. | Dec | Distance | P.A. | Major bb is equal to half the major axis. | Minor | MetallicityccMetallicity shown here is the average galaxy value from Moustakas et al. (2010) or Kennicutt et al. (2011) when unavailable, using the Kobulnicky & Kewley (2004) calibration. | log M⋆ | SFR |
|---|---|---|---|---|---|---|---|---|---|
| (J2000) | (J2000) | (Mpc) | (deg) | (arcmin) | (arcmin) | log(O/H) | M⊙ | M⊙ yr-1 | |
| DDO053 | 08:34:07 | 66:10:54 | 3.61 | 132 | 1.5 | 1.3 | 7.98 | 6.35 | 0.0060 |
| DDO154 | 12:54:05 | 27:08:59 | 4.3 | 50 | 3.0 | 2.2 | 8.02 | 6.63 | 0.0020 |
| HoI | 09:40:32 | 71:10:56 | 3.9 | 0 | 3.6 | 3.0 | 8.04 | 6.87 | 0.0040 |
| HoII | 08:19:05 | 70:43:12 | 3.05 | 15 | 7.9 | 6.3 | 8.13 | 7.59 | 0.036 |
| IC2574 | 10:28:23 | 68:24:44 | 3.79 | 56 | 13.2 | 5.4 | 8.23 | 8.2 | 0.057 |
| M81dwB | 10:05:31 | 70:21:52 | 3.6 | 140 | 0.9 | 0.6 | 8.2 | 6.36 | 0.0010 |
| NGC337 | 00:59:50 | 07:34:41 | 19.3 | 130 | 2.9 | 1.8 | 8.84 | 9.32 | 1.3 |
| NGC628 | 01:36:42 | 15:47:00 | 7.2 | 25 | 10.5 | 9.5 | 8.88 | 9.56 | 0.68 |
| NGC925 | 02:27:17 | 33:34:45 | 9.12 | 107 | 10.5 | 5.9 | 8.73 | 9.49 | 0.54 |
| NGC2146 | 06:18:38 | 78:21:25 | 17.2 | 123 | 6.0 | 3.4 | 10.3 | 7.94 | |
| NGC2798 | 09:17:23 | 41:59:59 | 25.8 | 160 | 2.6 | 1.0 | 9.04 | 10.04 | 3.38 |
| NGC2841 | 09:22:03 | 50:58:35 | 14.1 | 153 | 8.1 | 3.5 | 9.19 | 10.17 | 2.45 |
| NGC2976 | 09:47:15 | 67:54:59 | 3.55 | 155 | 5.9 | 2.7 | 8.98 | 8.96 | 0.082 |
| NGC3077 | 10:03:19 | 68:44:02 | 3.83 | 45 | 5.4 | 4.5 | 9.34 | 0.094 | |
| NGC3184 | 10:18:17 | 41:25:28 | 11.7 | 135 | 7.4 | 6.9 | 9.07 | 9.5 | 0.66 |
| NGC3198 | 10:19:55 | 45:32:59 | 14.1 | 35 | 8.5 | 3.3 | 8.78 | 9.83 | 1.01 |
| NGC3351 | 10:43:58 | 11:42:14 | 9.33 | 12 | 7.4 | 5.0 | 9.21 | 10.24 | 0.58 |
| NGC3521 | 11:05:49 | 00:02:09 | 11.2 | 160 | 11.0 | 5.1 | 9.06 | 10.69 | 1.95 |
| NGC3627 | 11:20:15 | 12:59:30 | 9.38 | 173 | 9.1 | 4.2 | 8.99 | 10.49 | 1.7 |
| NGC3938 | 11:52:49 | 44:07:15 | 17.9 | 28 | 5.4 | 4.9 | 9.06 | 9.46 | 1.77 |
| NGC4236 | 12:16:42 | 69:27:45 | 4.45 | 162 | 21.9 | 7.2 | 8.74 | 8.36 | 0.13 |
| NGC4254 | 12:18:50 | 14:24:59 | 14.4 | 23 | 5.4 | 4.7 | 9.08 | 9.56 | 3.92 |
| NGC4321 | 12:22:55 | 15:49:21 | 14.3 | 30 | 7.4 | 6.3 | 9.12 | 10.3 | 2.61 |
| NGC4536 | 12:34:27 | 02:11:17 | 14.5 | 130 | 7.6 | 3.2 | 9.0 | 9.44 | 2.17 |
| NGC4569 | 12:36:50 | 13:09:46 | 9.86 | 23 | 9.5 | 4.4 | 9.26 | 10.0 | 0.29 |
| NGC4579 | 12:37:44 | 11:49:05 | 16.4 | 95 | 5.9 | 4.7 | 9.22 | 10.02 | 1.1 |
| NGC4625 | 12:41:53 | 41:16:26 | 9.3 | 27 | 2.2 | 1.9 | 9.05 | 8.72 | 0.052 |
| NGC4631 | 12:42:08 | 32:32:29 | 7.62 | 86 | 15.5 | 2.7 | 8.75 | 9.76 | 1.7 |
| NGC4725 | 12:50:27 | 25:30:03 | 11.9 | 35 | 10.7 | 7.6 | 9.1 | 10.52 | 0.44 |
| NGC4736 | 12:50:53 | 41:07:14 | 4.66 | 116 | 11.2 | 9.1 | 9.04 | 10.34 | 0.38 |
| NGC5055 | 13:15:49 | 42:01:45 | 7.94 | 102 | 12.6 | 7.2 | 9.11 | 10.55 | 1.04 |
| NGC5457 | 14:03:13 | 54:20:57 | 6.7 | 39 | 28.8 | 26.0 | 9.98 | 2.33 | |
| NGC5474 | 14:05:02 | 53:39:44 | 6.8 | 97 | 4.8 | 4.3 | 8.83 | 8.7 | 0.091 |
| NGC5713 | 14:40:12 | 00:17:20 | 21.4 | 11 | 2.8 | 2.5 | 9.03 | 10.07 | 2.52 |
| NGC6946 | 20:34:52 | 60:09:14 | 6.8 | 63 | 11.5 | 9.8 | 8.99 | 9.96 | 7.12 |
| NGC7331 | 22:37:04 | 34:24:56 | 14.5 | 168 | 10.5 | 3.7 | 9.05 | 10.56 | 2.74 |
2.2. Infrared luminosities
The infrared data we use in this work are all from the KINGFISH sample (Key Insights into Nearby Galaxies; a Far Infrared Survey with Herschel; Kennicutt et al., 2011), an imaging and spectroscopic survey of 61 nearby ( Mpc) galaxies with the Herschel Space Observatory (Pilbratt et al., 2010). This survey provides imaging in 6 IR bands; 70, 100, and 160 with PACS (Poglitsch et al., 2010), and 250, 350, and 500 with SPIRE (Griffin et al., 2010), with the observing strategy described in detail in Kennicutt et al. (2011). All bands (PACS and SPIRE) are processed from level 1 using scanamorphos v17.0 (Roussel, 2012). The PACS data are calibrated using Flight Model 6, however the 160 band has a uniform correction factor of 0.925 applied to it to correct for the PACS distortion flatfield not included in the original scanamorphos reduction111see http://www2.iap.fr/users/roussel/herschel/ for details.. As the effect is of the order of 1% for the other PACS bands, well below the photometric uncertainties, no correction is applied to these bands. The SPIRE bands assume factors of 97.7, 55.0, and 26.0 to convert from Jy beam-1 to MJy sr-1 for the SPIRE 250, 350, and 500 bands, respectively.
| Galaxy | PACS70 | PACS100 | PACS160 | SPIRE250 | SPIRE350 | SPIRE500 |
|---|---|---|---|---|---|---|
| (Jy) | (Jy) | (Jy) | (Jy) | (Jy) | (Jy) | |
| DDO053 | ||||||
| DDO154 | ||||||
| HoI | ||||||
| HoII | ||||||
| IC2574 | ||||||
| M81dwB | ||||||
| NGC337 | ||||||
| NGC628 | ||||||
| NGC925 | ||||||
| NGC2146 | ||||||
| NGC2798 | ||||||
| NGC2841 | ||||||
| NGC2976 | ||||||
| NGC3077 | ||||||
| NGC3184 | ||||||
| NGC3198 | ||||||
| NGC3351 | ||||||
| NGC3521 | ||||||
| NGC3627 | ||||||
| NGC3938 | ||||||
| NGC4236 | ||||||
| NGC4254 | ||||||
| NGC4321 | ||||||
| NGC4536 | ||||||
| NGC4569 | ||||||
| NGC4579 | ||||||
| NGC4625 | ||||||
| NGC4631 | ||||||
| NGC4725 | ||||||
| NGC4736 | ||||||
| NGC5055 | ||||||
| NGC5457 | ||||||
| NGC5474 | ||||||
| NGC5713 | ||||||
| NGC6946 | ||||||
| NGC7331 |
To measure the fluxes of each galaxy, we first convolve all bands to a beam size of , the resolution of the SPIRE 500 beam (the lowest resolution band), using the convolution kernels of Aniano et al. (2012). We then use the galaxy centres listed in Table 1 and elliptical apertures as used by Dale et al. (2012) to determine the total integrated galaxy flux. These elliptical apertures have the same position angles and axis ratios as listed in Table 1, and encompass the full optical and IR light, and typically extend to optical radii. The background for all images was assumed to be flat and was determined as in Dale et al. (2012), by sampling empty regions around our elliptical apertures and calculating the background mean and uncertainty, as well as the pixel noise. To determine the luminosities we assume the distances given in Table 1. The total fluxes and uncertainties for all Herschel bands for each galaxy are given in Table 2. These fluxes differ slightly from those in Dale et al. (2012) as updated beam sizes were assumed for all bands leading to different correction factors, and the convolution to the SPIRE 500 beam size also affected results (though predominantly with the resolved investigations in section 4).
In addition to the IR photometry, as the successor to the SINGS survey (Kennicutt et al., 2003), a large ancillary dataset exists for the KINGFISH galaxies, including determinations of their metallicity, stellar masses and star formation rates, as shown in Table 1. The metallicities of our sample are determined in Moustakas et al. (2010), using the calibration of Kobulnicky & Kewley (2004), and cover a range of 2 dex. Different metallicity calibrations, such as Pilyugin & Thuan (2005, PT05), will introduce systematic offsets from the calibration used here (as demonstrated for several calibrations by Kewley & Ellison (2008), and as can be seen for the KINGFISH galaxies, specifically in Table 1 in Kennicutt et al. (2011)).
2.3. Atomic gas masses
To determine the neutral gas mass of our galaxy sample we use the THINGS HI sample of nearby galaxies (Walter et al., 2008)222The THINGS data are available from http://www.mpia-hd.mpg.de/THINGS., with the addition of the Leroy et al. (in prep.) sample that extends the THINGS sample to a larger number of nearby galaxies.
| Galaxy | L500 | MHI | MH2 |
|---|---|---|---|
| L⊙ | M⊙ | M⊙ | |
| DDO053 | |||
| DDO154 | |||
| HoI | |||
| HoII | |||
| IC2574 | |||
| M81dwB | |||
| NGC337 | |||
| NGC628 | |||
| NGC925 | |||
| NGC2146 | |||
| NGC2798 | |||
| NGC2841 | |||
| NGC2976 | |||
| NGC3077 | |||
| NGC3184 | |||
| NGC3198 | |||
| NGC3351 | |||
| NGC3521 | |||
| NGC3627 | |||
| NGC3938 | |||
| NGC4236 | |||
| NGC4254 | |||
| NGC4321 | |||
| NGC4536 | |||
| NGC4569 | |||
| NGC4579 | |||
| NGC4625 | |||
| NGC4631 | |||
| NGC4725 | |||
| NGC4736 | |||
| NGC5055 | |||
| NGC5457 | |||
| NGC5474 | |||
| NGC5713 | |||
| NGC6946 | |||
| NGC7331 |
To determine the HI masses of the galaxies, we use the integrated HI moment 0 maps with robust weighting (see Walter et al., 2008, for details). To first convert the HI maps from their units of Jy beam to M, we multiply by (based on equations 1 and 5 from Walter et al., 2008),
| (1) |
where and are the beam major and minor axes in arcseconds, respectively. is the galaxy distance in Mpc (from Table 1). We then convolve the maps using first gaussians to circularize the beam shapes and from there to the SPIRE 500 resolution using the convolution kernels of Aniano et al. (2012). The integrated HI masses are then determined using the same apertures as for the infrared fluxes and are given in Table 3 with uncertainties and SPIRE 500 luminosities. Note that for some galaxies the HI emission extends beyond the chosen aperture that encompasses the optical and IR emission, which we discuss further on.
2.4. Molecular gas masses
For the molecular gas masses of our galaxy sample we use the HERACLES CO(2-1) survey of nearby galaxies (Leroy et al., 2009)333The HERACLES data are available from http://www.mpia-hd.mpg.de/HERACLES/Overview.html., using the integrated moment 0 maps. To determine the total CO luminosity we first convolve the moment 0 maps using the convolution kernels of Aniano et al. (2012), and then integrate using the same apertures as for the infrared and HI maps. If these apertures extended further than the available moment 0 maps, we assumed the flux in these regions was negligible and therefore 0. To convert the CO luminosity to molecular gas mass we used equation 3 from Leroy et al. (2009),
| (2) |
We assume a fixed conversion factor from the CO(2-1) luminosity to H2 mass for all galaxies, based on the Milky Way conversion factor, M (Solomon et al., 1987; Abdo et al., 2010; Bolatto et al., 2013), and a fixed line ratio of CO(2-1) to CO(1-0) of (the typical value found for the HERACLES galaxies in Leroy et al., 2009, though correctly this ratio is dependent upon the mean gas properties such as temperature). The final H2 mass for each galaxy is given in Table 3. The total gas mass for all galaxies is then taken simply as the sum of the HI and molecular gas mass within our chosen apertures.
Given that our galaxies cover over 2 orders of magnitude in stellar mass and gas-phase metallicity, an assumption of a constant CO luminosity to molecular gas mass conversion factor may lead to biases, especially as different conversion factors have already been determined for several of the galaxies in our sample (see e.g. Bolatto et al., 2013; Sandstrom et al., 2013). We discuss this point further in the text, but this assumption must be considered when using any of our determined relationships.
3. The monochromatic IR—Gas Correlation
3.1. Dust emission and gas mass
The use of the IR emission to trace the total amount of gas is premised on the simple assumption that gas and dust are always associated. Assuming that the dust has a single temperature, , the IR luminosity of a galaxy at a frequency, , is linked to the total gas mass of a galaxy Mgas via the equation,
| (3) |
where is the dust to gas mass ratio, is the Planck blackbody function, and is the dust emissivity at the frequency .
A broad range of IR colors is seen within and between galaxies indicating variation of the mean dust temperature (see, e.g. Dale et al., 2012), driven by the variation of radiation field strengths experienced by dust in galaxies. However, we can limit the impact of these temperature distributions on the above equation in two ways; firstly, for most of the KINGFISH galaxies, it is possible to reproduce their IR SED by having the bulk of the dust heated by a single diffuse radiation field, with only a small fraction being heated by radiation fields stronger than this (see, e.g. Draine et al., 2007; Aniano et al., 2012), thus assuming a single temperature within galaxies for the longer wavelengths is a reasonable assumption. Secondly, by concentrating on longer wavelengths that are well past the peak of the IR SED (at , see e.g. Dale et al., 2012), we move closer to the Rayleigh-Jeans tail of the black body radiation which is only linearly sensitive to temperature. Smith et al. (2012, particularly their Figure 7) and Auld et al. (2013, particularly their Figure 12) have both shown that the assumption of a single temperature is reasonable, finding the temperatures of single modified blackbody fits to the integrated 100-500 IR SEDs of galaxies in the Herschel Reference Survey and Herschel Virgo Cluster Survey, respectively, lying within a factor of 2 ( K and K, respectively, with Early type galaxies having higher temperatures). Such a small range of temperatures result in only a factor of 2 uncertainty in the dust mass estimates and hence a factor of 2 in the gas mass determined from the IR in the linear regime.
The dust-to-gas mass ratio and dust emissivity at a given wavelength are somewhat degenerate, with the determination of one relying on an estimate of the other. While estimates exist for these quantities in the local group, it is uncertain how they will vary across different galaxies. The emissivity is dependent on the composition of dust (Zubko et al., 2004), and there have been suggestions that the emissivity will vary in molecular environments. The emissivity has also been suggested to vary with metallicity, such as seen in the LMC by Galliano et al. (2011), however Rémy-Ruyer et al. (2013) found no strong trends when comparing more massive galaxies with dwarf galaxies. However, if it is assumed that emissivity at longer wavelengths does not change between galaxies, a clear trend of a decreasing dust-to-gas ratio with the metallicity of the galaxy is seen across the local group (Leroy et al., 2011) and nearby galaxies (Sandstrom et al., 2013), and even if the emissivity is left free, a lower dust-to-gas ratio is seen in low metallicity dwarf galaxies (Rémy-Ruyer et al., 2014) . This suggests that the dust to gas ratio must be accounted for in any empirical calibration, as we discuss below.
Although Equation 3 indicates the direct link of gas mass and dust emission via the association of dust and gas, IR emission will also be indirectly associated with gas mass, or more precisely gas mass surface density via the Kennicutt-Schmidt relation (KS relation, see e.g. Kennicutt, 1998). An increase in the gas mass surface density has been empirically demonstrated to correlate on average with an increase in the star formation rate surface density on kpc scales (see e.g., Kennicutt, 1998; Bigiel et al., 2008; Leroy et al., 2013). Given this increase in the SFR surface density, the interstellar radiation field that heats the dust is also expected to be higher, leading in turn to higher average dust temperatures and correspondingly higher IR continuum emission. This secondary correlation may actually limit the dispersive effect that dust temperature has on the gas mass – IR emission connection, and may even lead to a tighter correlation where the IR luminosity is more responsive to gas mass (i.e. where an increase in gas mass leads to both an increase in dust mass and increase in dust temperature due to the increased SFR, and thus a greater increase in IR luminosity). However, unlike the correlation of dust mass and gas mass, the KS relation will act non-linearly on the IR emission. The shortest dust wavelengths that measure the hot dust and peak of the IR emission will see the greatest impact of the increase in dust temperature, and thus also be more sensitive to any variation in the KS relation.
3.2. IR emission versus total gas mass
As a first comparison, we determine the simple correlations between the IR luminosities and total gas mass in galaxies. In Table 4, we show the Pearson correlation coefficient (& Spearman rank coefficient) for all Herschel bands against the total gas mass. A strong correlation is observed with all bands, with the strongest correlation existing between the longest wavelength (i.e. SPIRE 500) and the total gas mass. This correlation is clearly seen in Figure 1, where we plot the SPIRE500 luminosity () against the total gas mass.
| Band (log | Pearson | Spearman |
|---|---|---|
| PACS70 | 0.926 | 0.821 |
| PACS100 | 0.938 | 0.893 |
| PACS160 | 0.943 | 0.918 |
| SPIRE250 | 0.949 | 0.941 |
| SPIRE350 | 0.957 | 0.950 |
| SPIRE500 | 0.962 | 0.964 |

The strong correlations seen with each band suggest that it is entirely reasonable to use broad-band IR photometry to estimate the total gas mass of galaxies from the IR emission. Based on the high Pearson correlation coefficients, we performed robust linear fits to each Herschel band luminosity versus the total gas mass, of the form, Band, where Band is the log of the luminosity in the given band (in log). The coefficients and are given in Table 5 for each band. The fit for the SPIRE500–Mgas relation is shown by the solid line on Figure 1. In Table 5, we also give the dispersion, , of the galaxies around each relation, which, as suggested by the correlation coefficients, decreases with increasing wavelength. To compare with previous comparisons of dust and gas correlations, we have also limited the sample to the more massive objects, with log(M. The fits to these galaxies show both a smaller dispersion and steeper slopes than the full sample. The SPIRE 500 fit is the tightest, with only a 30% dispersion, similar to that found by Eales et al. (2012) in their comparison of gas masses with dust masses determined from fits to the IR SED in 10 nearby galaxies.
Given that the full extent of a galaxy in the IR may not always be available, we have also repeated the fits using smaller apertures that are truncated at an optical radius, , using the values for the major and minor axes presented in Table 1. These apertures are typically 30% smaller than the IR-encompassing apertures from Dale et al. (2012) that we use. However, as the IR light is generally concentrated to the optical disk, these smaller apertures contain a significant fraction (%) of the IR light for most galaxies. Only a few galaxies with clearly extended IR emission, mostly the smaller galaxies such as NGC 3077, have significantly reduced IR fluxes due to the smaller aperture. Similarly, most of the molecular gas is totally contained within an optical radius for all galaxies. Yet the atomic gas can extend well beyond an optical radius, and is observed at greater than in some galaxies. Truncating at reduces the total gas mass because of this extended emission (this is discussed further in §4). We have performed these fits only for the three SPIRE bands, as these show the strongest correlations in Table 4, and are the most sensitive to extended emission (and thus show the greatest change with reduced apertures). All fits to the reduced apertures, both to the full and non-dwarf galaxy sub-sample, find slightly flatter slopes than the original apertures, leading also to a larger intercept. This trend is driven by the dwarf galaxies, which have relatively larger HI gas disks, such that the smaller aperture preferentially reduces the gas mass relative to the IR, flattening the overall slope. Thus biasing an aperture to measure the IR luminosity of galaxy will tend to underestimate the total gas mass, approximately by 15% based on our galaxy sample.
| All | log(M | |||||
|---|---|---|---|---|---|---|
| Band (log | ||||||
| PACS70 | 4.15 | 0.55 | 0.30 | 4.6 | 0.50 | 0.27 |
| PACS100 | 3.62 | 0.60 | 0.27 | 3.27 | 0.63 | 0.23 |
| PACS160 | 3.52 | 0.61 | 0.26 | 1.91 | 0.78 | 0.18 |
| SPIRE250 | 3.17 | 0.69 | 0.25 | 1.17 | 0.90 | 0.15 |
| SPIRE350 | 3.08 | 0.74 | 0.24 | 1.17 | 0.90 | 0.14 |
| SPIRE500 | 3.19 | 0.78 | 0.23 | 1.44 | 0.99 | 0.10 |
| All | log(M | |||||
|---|---|---|---|---|---|---|
| Band (log | ||||||
| SPIRE250 | 3.73 | 0.64 | 0.28 | 1.57 | 0.86 | 0.14 |
| SPIRE350 | 3.63 | 0.68 | 0.25 | 1.49 | 0.92 | 0.10 |
| SPIRE500 | 3.74 | 0.72 | 0.23 | 1.72 | 0.96 | 0.09 |
We find that none of the fits are linear, neither the total gas masses and the sample limited within , nor the massive galaxy sub-samples in both, with all slopes less than 1. As discussed in the previous section, three factors may be playing a role in the non-linear slopes: the systematic variation of the dust temperature, the dust-to-gas ratio, and the variation of the CO luminosity to molecular gas mass (). As the slope becomes flatter at shorter wavelengths, dust temperature must play at least some role. The sub-linear trend observed in the correlation at all wavelengths suggests that the Kennicutt-Schmidt relation may also be contributing to the correlation, that is higher gas masses lead to a higher SFRs, which in turn heats the dust to higher average temperatures.
The dependence upon the CO conversion factor is a major source of uncertainty in these fits, and remains a general uncertainty in determining the total gas masses in galaxies. Our assumed value of M is the suggested value of the Milky Way conversion factor given in the extensive review of Bolatto et al. (2013). However, the analysis of in some of the same galaxies as our sample by Sandstrom et al. (2013) found a slightly lower value (), and a large scatter between, and within, the galaxies. Changing the value of we assume significantly affects only the more massive spirals (M), as the dwarf galaxies are all HI dominated, as can be seen from Table 3. Increasing/decreasing by 0.7 dex (larger than the dispersion between galaxies found by Sandstrom et al., 2013) leads to a steepening/flattening of the determined linear fits. However, when only the galaxies with M are examined, the slope remains approximately constant, with a systematic shift up and down in the relation, scaling with our scaling of . However, given the work of Sandstrom et al. (2013) and review by Bolatto et al. (2013), there is no a priori reason why our normal spiral galaxy sample should have a different to that assumed in our work.
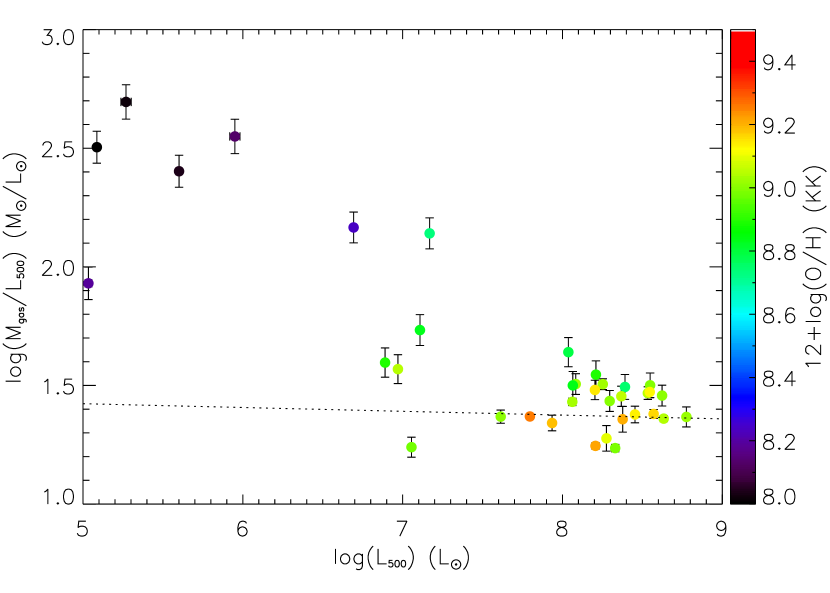
However, there are two further issues with the simple linear fits revealed by Figure 1; a large part of the correlation of gas mass with IR luminosity is simply galaxy mass scaling, with galaxies with the highest stellar masses lying towards the top right, as indicated by the color of the points. Secondly, the lower mass galaxies tend to lie above the relation, leading to a much greater scatter, and limit the determination of the gas mass. In Figure 2, we remove the mass weighting intrinsic to a luminosity-luminosity plot by plotting the ratio M against , which also emphasizes the scatter of the low-mass galaxies. The color scale in this figure reveals the average metallicity of the galaxy, as measured by Moustakas et al. (2010) (using the Kobulnicky & Kewley (2004) conversion). The similarity in colors between the two plots demonstrates the mass-metallicity relation. In this figure, it is clear that the more massive normal galaxies show a much more linear relation, with the offset caused by the low-mass, low-metallicity galaxies in the sample. In Table 5 we also include a fit to only the galaxies with log(M (non-dwarf galaxies, hereafter “normal” galaxies), meaning a using the Kewley & Ellison (2008) mass-metallicity relation). This is shown as the dashed line in Figures 1 and 2 which emphasizes the difference to the full-sample fit. As clear from these figures and Table 5, the dispersion of the normal galaxies around the normal galaxy-only fit is reduced relative to that of that seen around the full-galaxy relation. The largest decrease in dispersion appears to be for the longest wavelengths, with the SPIRE500 relation decreasing by a factor of 2, while the dispersion at the shortest wavelengths only decreases slightly.
As the relation for the SPIRE500 and Mgas is almost linear for normal galaxies, we can naively assume a 1:1 relation. In this case, we find for the normal KINGFISH galaxies (M M⊙);
| (4) |
where is the SPIRE 500 luminosity (i.e. ). Assuming a linear correlation at 500 only increases the dispersion slightly to 0.118 dex (i.e. most gas masses within 30%).
One issue with the linear relations we present is that they are only monochromatic, and that these rest-frame wavelengths may not be available at higher redshifts when observed using for example Herschel or ALMA. In these cases we suggest a simple linear interpolation of the slope, , and constant, in Table 5. The slope is monotonic, at least within the range of wavelengths explored here, and so a simple linear interpolation should suffice. For the constant, there appears to be a minimum at 350, however, again a linear interpolation between the bounding wavelengths should be sufficient and lead to only a small uncertainty (as seen by the range of ), except at the shortest wavelengths. For continuum measurements outside the range explored by Herschel, an extrapolation based upon a simple modified blackbody can be applied (as done for equation 10 in Scoville et al., 2014).
3.2.1 The effects of metallicity
The offset observed at low stellar masses in Figure 2 is clearly associated with a decline in the gas phase metallicity. Given this, the most likely cause for this offset is the variation of the dust-to-gas ratio with metallicity. Naively, we would expect the dust-to-gas ratio (DGR) to at least linearly decrease with metallicity due to the lack of metals from which to form, with recent works suggesting that a linear DGR to metallicity relation is a reasonable assumption (Leroy et al., 2011; Sandstrom et al., 2013; Rémy-Ruyer et al., 2014, though the latter work suggests this is true only for log(O/H)). In Figure 3, we have used the measured metallicity of our galaxies from Moustakas et al. (2010) to “correct” for a linear variation of the DGR by scaling the M ratio by O/H. With this correction included, the relationship between M and is basically flat (a fitted slope of ), and a dispersion of only , much less than the original fits to all galaxies. Thus, over 4 orders of magnitude in IR luminosity, the total gas mass can be determined from the 500 luminosity within 40%, as long as the effects of metallicity on the DGR can be corrected for.
One issue in correcting for the variable DGR is the difficulty in obtaining the gas-phase metallicity of a galaxy at higher redshift. When such information is not available, using the mass-metallicity relation, presuming a stellar mass for the galaxy has been determined, provides one possible solution (see e.g., Tremonti et al., 2004; Kewley & Ellison, 2008).
The metallicity of the ISM also affects the relation of dust and gas through the CO luminosity to molecular gas mass conversion factor . For the lowest metallicity galaxies, may increase by an order of magnitude or more from the MW value assumed here because of the presence of “CO–dark” molecular gas (see, e.g. Wolfire, Hollenbach, & McKee, 2010; Leroy et al., 2011, for the theory and for examples and discussion in the local universe). However, as mentioned in the previous section, the ‘low-mass galaxies’ in our sample all have molecular gas fractions less than 0.01 (given our assumed MW conversion factor, as seen in Figure 5 in the following section), meaning that the contribution of molecular to the total gas mass in these objects will always be relatively small. This effect will act to increase the offset we observe in Figure 2, but will contribute less than a factor of two (0.3 dex) to any relation.

While the correction for metallicity clearly works for the M relation at long wavelengths, at shorter wavelengths the effect of dust temperature is still an issue, as suggested by the flattening of the slopes in Table 5. Figure 4 shows the relation of the SPIRE250 luminosity with Mgas corrected for the variable dust-to-gas ratio, as in Figure 3, with both the negative slope and increased scatter compared to the L500 relation are noticeable. The color of the points indicates the PACS160/SPIRE500 color, which we use as a proxy for the dust temperature, where a lower value indicates warmer average dust temperatures as the peak of the IR shifts to wavelengths shorter than 160. Note how at high masses (high L250), a higher M is seen with decreasing 160/250 ratio, indicative of warmer temperatures. However, with the M plot (Figure 3) no such gradient is seen with the PACS160/SPIRE500 ratio, demonstrating the lack of sensitivity of the longer wavelength emission to dust temperature. This suggests, not unexpectedly, that to obtain a more accurate gas mass at shorter wavelengths, at least two bands must be observed to correct for dust temperature. However, given that the IR continuum at or around 500 (600 Ghz) is observable at essentially all redshifts up to using existing ALMA bands (and longer using bands 1 & 2), and no sensitivity to the IR colors is seen in the scatter at these wavelengths, we suggest using longer rest-frame wavelengths when possible to determine the total gas mass.

3.3. IR emission versus molecular gas mass
Given that the star formation rate surface density in nearby galaxies appears to correlate better with the molecular gas surface density than the total gas density (e.g. Schruba et al., 2011), determining the molecular gas mass at higher redshift without the necessity of measuring a possibly weak line would be useful. When we compare the molecular gas mass (or, more precisely, CO(2-1) luminosity) to the infrared luminosities for our full sample of galaxies we find the wavelengths at the peak of the IR SED (100 and 160) show the tightest correlation, with Table 5 listing the Pearson correlation coefficient and Spearman rank coefficient for each Herschel band for the correlation. We find this is true even when we limit the sample to the normal galaxies. This is somewhat contrary to Bourne et al. (2013), who found the highest correlation of the molecular gas mass with the longest wavelengths.
| All | Mass selected | |||
|---|---|---|---|---|
| Band (log | Pearson | Spearman | Pearson | Spearman |
| PACS70 | 0.957 | 0.929 | 0.905 | 0.890 |
| PACS100 | 0.979 | 0.955 | 0.946 | 0.925 |
| PACS160 | 0.977 | 0.969 | 0.959 | 0.949 |
| SPIRE250 | 0.980 | 0.958 | 0.951 | 0.932 |
| SPIRE350 | 0.974 | 0.936 | 0.933 | 0.895 |
| SPIRE500 | 0.964 | 0.901 | 0.908 | 0.836 |
This is surprising given that molecular gas would be expected to be cold, and therefore mostly associated with cold dust. However a closer examination reveals that this is exactly the case, as demonstrated in Figure 5. In this figure we plot the molecular gas mass fraction, M, as a function of the dust temperature as represented by the PACS160/SPIRE500 flux ratio (a higher ratio indicates colder dust as the IR peak shifts to 160). Given that the denominators correlate, as shown in Figure 1, this removes any mass scaling, and acts to highlight the correlation between the 160 luminosity and molecular gas mass indicated in Table 5. This figure reveals that as the dust gets colder (higher 160/500) the molecular gas fraction increases, with both these quantities correlated with the galaxy stellar mass (as shown by the color scale in Figure 5), or similarly the average gas metallicity.

The evolving shape of the IR SED with the metallicity of the galaxy can be seen clearly in Figure 8 in Rémy-Ruyer et al. (2013), demonstrating the warmer average dust temperatures in the lower metallicity objects. The warmer temperatures in these galaxies are likely caused by the harder and stronger interstellar radiation fields (ISRF). The ISRF is harder due to the lower stellar metallicity in these galaxies, while the ISRF tends to be stronger due to the lower dust density (given the lower dust to gas ratio) leading to decreased dust shielding and a longer mean free path of UV photons (Madden et al., 2006).
This lower dust shielding will lead to a lower molecular gas fraction due to increased H2 dissociation, and a relatively higher dissociation of the CO molecule, and thus an increased factor. As we assume a constant factor, an increasing with metallicity (due to the presence of “CO–dark” molecular gas, Wolfire, Hollenbach, & McKee, 2010), will also cause the decrease in the molecular gas fraction that we observe (if a variable is assumed, it is uncertain how much the molecular gas fraction will change with metallicity, see e.g. Rémy-Ruyer et al., 2014, specifically their Figure 3).
Once the correlation of these ratios with stellar mass is accounted for, no association with other galaxy parameters such as SFR or sSFR is seen (note however that these parameters correlate with stellar mass in our galaxy sample, as seen in SDSS galaxies, e.g. Brinchmann et al., 2004). This is surprising, given that the 160/500 ratio traces dust temperature, and that molecular gas is associated with star formation. However, it may be that smaller scale effects not seen in the integrated quantities, such as the spatial distribution of gas, dust and stars, is affecting the correlation to an extent that 2nd order effects are not seen.
In general, we find the best power-law fit to be:
| (5) |
with a dispersion of around this relation. However once a galaxy is molecular rich, it is uncertain how well the 160 luminosity will trace MH2. As can be seen in Figure 5, at high molecular fractions a broad range of 160/500 colors are possible. Thus for the most massive objects, the 500 luminosity is a better tracer of the molecular gas simply because M. Similarly, given the uncertain effects of dust heating on this relation, extrapolating this to higher redshifts may be problematic.
3.4. Extension to higher luminosities and redshifts
The sample of galaxies we explore here are typical local galaxies, and cover a range of luminosities and stellar masses (as seen in Table 1), however these galaxies may not be representative of more luminous IR galaxies typically seen in sub-mm surveys. Bourne et al. (2013) explore a slightly higher mass range than our sample, though with a significant overlap. For our full sample we find much flatter slopes than Bourne et al. (2013) found for the IR versus HI, CO(2-1) and CO(3-2) luminosities. However for our more massive “normal” galaxy sample that overlaps the range observed in Bourne et al. (2013), our slopes appear very similar to those determined by Bourne et al. (2013, specifically their Figure 4), at least for HI and CO(2-1), the lines we use for our total gas mass. However, while they do see trends with stellar mass and metallicity (such as the decrease in LCO/MHI with mass and metallicity), their dynamic range is not large enough to determine the relations we see here.
Scoville et al. (2014) explored the correlation of sub-mm luminosity with ISM mass in a sample of sub-mm galaxies at , in addition to a local sample that overlaps our sample with 850 detections, and a Planck observation of our Galaxy. Assuming that all the gas was molecular and a similar conversion factor (), Scoville et al. (2014) find a ratio of L850/M erg s-1 Hz-1 M for the sub-mm galaxies, and similar values for the local galaxies (for which the HI mass was also included). Rearranging Equation 4, we find a ratio at 500 of erg s-1 Hz-1 M for our normal galaxy sample, which, assuming a dust emissivity with a power-law of 1.8, corresponds to erg s-1 Hz-1 M, in good agreement with the sub-mm galaxy sample of Scoville et al. (2014).
However, applying a single sub-mm emission to gas mass conversion factor, , to all galaxies removes any dependence on other galaxy properties. We find that for normal galaxies in the local Universe, an assumption of a linear relation between sub-mm luminosity and gas mass is reasonable. Given the range of IR luminosities explored in our work and in Scoville et al. (2014), it suggests that, while dust temperatures will affect the sub-mm luminosity to gas mass relationship, the variation in temperature is small enough that it has only a small impact in the Rayleigh-Jeans regime and thus the relationship. Conversely, there appears to be a significant metallicity evolution over cosmic time (see e.g. Yabe et al., 2014). Therefore to apply the observed Lsub-mm–Mgas relation to all galaxies at higher redshifts, it is crucial that this evolution of the metallicity be accounted for. This can be done through a direct correction for an inferred metallicity, either directly measured or determined from a mass-metallicity relation, or through allowing the relation (or ) to evolve with redshift using the metallicity evolution as a basis for the evolving DGR.
An evolving DGR was allowed for in the work of Magdis et al. (2011, 2012), who calculated the total gas mass from IR observations in a sample of “normal” high-redshift galaxies (). Instead of using a direct correlation of sub-mm luminosity and gas mass, they first calculated the dust mass using model fits to their observed IR SEDs (such as the Draine & Li, 2007, model), and then converted to the total gas content using an empirical relationship between the DGR and metallicity determined locally (Leroy et al., 2011). While this two-step approach may introduce systematic errors, Magdis et al. (2012) find their determined gas masses consistent with the CO luminosities (assuming Milky Way conversion factors that also vary with metallicity, and assuming the gas is mostly molecular).
An example of the application of using IR fluxes to determine the evolution of gas mass is the work of Santini et al. (2014), who stacked the IR fluxes of galaxies with similar stellar masses, star formation rates and redshifts, to create representative IR SEDs. They then fit these SEDs using dust models, including simple modified blackbodies, to determine the dust masses of these objects, which they converted to a gas mass allowing for a variable dust-to-gas ratio dependent upon stellar mass and SFR. Using these they find a strong correlation in the gas fractions of galaxies with their stellar mass and SFRs, and find strong evolution in both the gas fraction and star formation efficiency (SFR/Mgas) with redshift.
4. Radial trends and galaxy sizes
In the previous section, we only considered the galaxies as integrated objects, with a single gas mass and luminosity. However, the KINGFISH sample provides much more detail than this, and the sub-arcsecond capabilities of ALMA will mean, even at high-redshift, the continuum emission from galaxies can potentially be resolved (see, e.g. Hodge et al., 2013). Thus to explore the gas – L500 relation further, we break the galaxies into elliptical annuli using the position angles and axis ratios of the galaxies given in Table 1. The annuli are chosen to be in steps of 2 kpc along the major axis

In Figure 6 we plot the ratio of the gas mass surface density and SPIRE500 surface brightness for all annuli in our galaxy sample that satisfy the criteria that the annuli was larger than the resolution of the SPIRE500 beam (36″). The colors of the data indicate the position of the annuli in terms of the optical radius of each galaxy, as given in Table 1. This figure demonstrates that within galaxies the radial profiles follow the same pattern as seen for the integrated luminosities (i.e. as in Figure 2), albeit with a larger scatter. Some of this scatter arises from faint background sources at large radii which have not been masked. As with the luminous galaxies, we see that for high surface brightness regions /I500 is linear, but when we move to lower I500 we find an increasing trend of /I500. This trend is affected by both the intrinsic metallicities of the galaxies as well as the radial trends within galaxies, with a higher /I500 ratio observed at larger radii. This is emphasized by the horizontal lines which indicate the median /I500 ratio for annuli between (blue), (purple), and (red). This radial /I500 gradient is likely associated with the radial metallicity gradient within each galaxy, and when the observations are corrected for the metallicity gradient determined by Moustakas et al. (2010) for some of our sample, this gradient is reduced. However the gradient is not totally removed, and has a large scatter introduced by the uncertainties in the metallicity gradient (see Moustakas et al., 2010, for a discussion on these uncertainties).
Yet using the longer wavelength continuum emission is still a robust tracer of the total gas mass of galaxies, and the gas surface density for most of a galaxy. The robustness of the sub-mm continuum can be seen in Figure 7, where we compare the radial variation of the SPIRE500 mean surface brightness, , against the mean gas mass surface density, , in NGC 628. Using the radial determinations of the HI and H2 gas mass surface densities from Schruba et al. (2011), who stacked the HERACLES CO observations to detect the low column density molecular gas at large radii, we can determine both the radial variation of the total gas mass and the molecular gas fraction in our sample. Using the same 15″ elliptical annuli as Schruba et al. (2011), we have determined the radial variation of the SPIRE500 surface brightness (note that 15″ under samples the 36″ SPIRE 500 beam by a factor of 3). For illustration purposes, we have scaled by a factor of 25 to be on the same scale as the total gas mass surface density. It is clear that the IR traces better the total gas mass surface density instead of either the H2 or HI gas alone in the inner radii. However, at radii beyond 0.7 there is an increasing deviation of the IR brightness relative to the gas mass density. A similar trend is seen for some of the other galaxies in our matched sample, such as NGC 925. However the trend is not seen in all galaxies, with resolution and inclination affecting the observed trends in some objects (see the attached figures in the appendix).
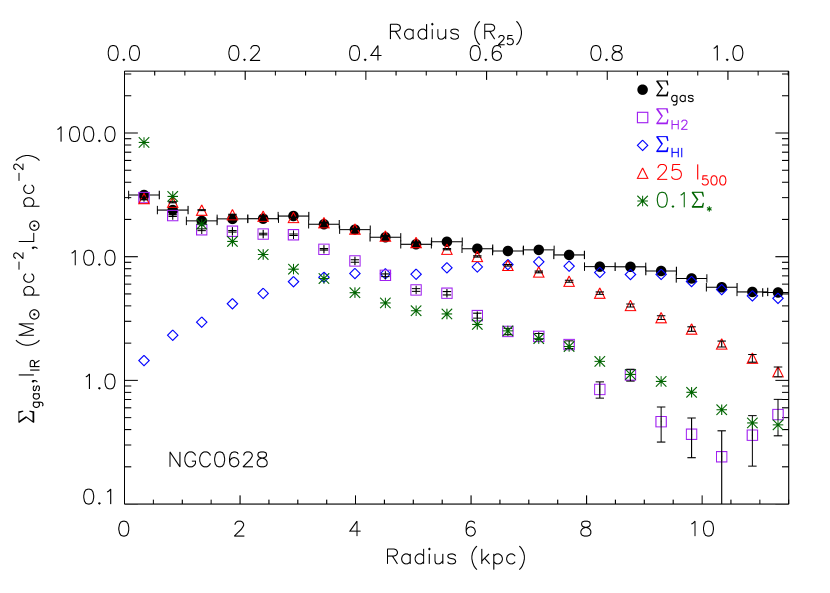
The point where the sub-mm surface brightness and gas mass density separate does not appear to directly correlate with the radius at which the gas becomes mostly atomic, emphasizing that the dust is not just tracing the molecular gas. This conclusion is further supported by galaxies which are predominantly atomic at all radii. Neither does this separation appear to be related to the surface mass density of NGC 628 becoming gas dominated. In Figure 7 we also indicate the stellar surface density determined from Spitzer 3.6 data by Querejeta et al. (in prep.) using the data from the S4G survey (Sheth et al., 2010), arbitrarily scaled by 0.1 to be on the same scale as the gas mass density. The disk of NGC 628 becomes gas dominated beyond the radius at which the IR deviates from (at ).
The deviation of the sub-mm emission from the gas is more clearly seen in Figure 8, where we plot the ratio of mean gas mass surface density to 500 surface brightness as a function of radius for NGC 628. At the inner radii of the galaxy, the ratio is flat and then increases in slope beyond . To demonstrate that this change is significant, we have shaded the data to indicate the fraction of pixels that are significant (), with darker points indicating a larger fraction. This shading is conservative as we are integrating in annuli, meaning that we are more sensitive to diffuse emission at larger radii. Even given this conservative estimate, it is clear that the measured values of ratio are significant out to .
One possibility for this deviation is that we are seeing a change in the dust to gas ratio at these radii, possibly related to a variation in the radial metallicity gradient at the larger radii. However, Moustakas et al. (2010) measure gas-phase abundances out to for several of our galaxies, including NGC 628 (see their Figure 7), and no such changes in the abundance gradients are seen. The expected variation of the gas to dust ratio is indicated by the inverse of the metallicity gradient determined by Moustakas et al. (2010), using both the Kobulnicky & Kewley (2004) or Pilyugin & Thuan (2005) calibrations, as shown by the dashed and solid lines, respectively, on Figure 8. These lines are both normalized to the value of at to emphasize the similarity (or difference) of the determined metallicity slopes compared to the observed variation of the ratio. However, the lines also demonstrate the issues in interpreting the metallicity gradient. The Pilyugin & Thuan (2005) calibration follows reasonably well the observed ratio up to , beyond which a deviation from this slope is clearly visible. Yet the Kobulnicky & Kewley (2004) calibration shows a much steeper slope, and, while reasonable below , over-estimates the observed ratio between 0.4 and 0.8 , and no deviation of the ratio relative to this gradient is seen at larger radii. Which gradient is more representative of the true gas-phase abundance gradient is uncertain, though Croxall et al. (2013) find a metallicity in between the two calibrations shown here at using temperature insensitive metallicity calibration based on FIR fine structure lines, suggesting that the gradient may lay between these lines.
The radial variations for the other galaxies in our sample are included in the online-only appendix. For all galaxies this ratio lies between , with the ratio becoming larger at larger radii. Several galaxies also show a turn up in within , such as NGC 6946. The increase in the in these galaxy centres is likely associated with the decreased central values observed by Sandstrom et al. (2013) in several of our galaxies, including NGC 6946. A central decrease in would mean that we overestimate at the center of our galaxies due to our assumption of a constant Milky-Way value, and hence over-estimate the ratio. For galaxies for which it is available, we have also plotted the inverse of the determined metallicity gradients as in Figure 8. For several galaxies (e.g. NGC 3198) the metallicity gradient is sufficient to explain the observed radial trend in , with no significant deviations seen. For some galaxies, i.e. NGC 4254 and NGC 4321, the metallicity gradients are much steeper than the observed ratio. Given the observed gradients in gas and stellar surface mass densities, it is possible that the metallicity gradients are much flatter than have been determined for these objects. Finally for several galaxies the same excess at large radii relative to the metallicity gradient as in NGC 628 is seen (e.g. NGC 925 and NGC 6946).

For these galaxies which show a radial deviation in the ratio, like NGC 628 and NGC 925, another possibile explanation is that the different conditions in the outskirts of the galaxies lead to different dust properties which result in different emissivities. Such a variation in the emissivity with radius for some of the KINGFISH galaxies has already been suggested by Galametz et al. (2014) using sub-mm data and in M33 by Tabatabaei et al. (2014).
However, at least some part of this deviation at large radii must arise from the decrease in the mean interstellar radiation field available to heat the dust at these radii, as demonstrated by the radial decrease in stellar density relative to gas density in Figure 7. A weaker interstellar radiation field will lead to lower average dust temperatures and thus correspondingly weaker IR emission. This can be seen in Figure 9, where we plot the same quantities as in Figure 7 for NGC 628, but now with the shorter wavelength SPIRE250 band (note the different scaling factor). While it is clear in this figure that a change in the ratio of gas mass to IR luminosity occurs at a similar radius, the ratio decreases much more rapidly. This implies a change in the IR slope, and thus either a decrease in dust temperature or a flattening of the dust power-law emissivity. A decreasing dust temperature would lead to a lower IR luminosity even without a variation of the dust to gas ratio.

In any case, it is clear from Figure 7 and the other galaxies in the Appendix that for the outskirts of many galaxies (beyond ), the IR emission no longer traces the total gas mass in the same manner. For the galaxies in our sample, the total gas mass is dominated by the atomic gas at these radii. For many of our galaxies a significant fraction of HI is found outside the optical radius (a median of 40% for our sample), and for several objects emission can be found even outside 2, with an obvious (and unrepresentative) example being NGC3077 with its extended tidal streams (Walter et al., 2011). By defining our apertures purely on the extent of the optical and IR emission, it is obvious that such extended gas disks will not be accounted for in the above relations, with the relations missing a large fraction of the total gas mass in some galaxies, like the HI rich dwarfs like DDO154. However it is still an open question how much relevance this extended HI gas has on the galaxy as a whole, with all of the molecular gas and most of the star formation inside our chosen “total” galaxy apertures and it being uncertain whether this gas external to the galaxy will participate at all in future star formation events within the galaxy.
5. Summary
The evolution of the gas mass density over cosmic time plays a direct role in the evolution of galaxies through its link to the star formation rate. Yet measuring the gas mass directly of a large number of galaxies at high redshifts through line observations is technically difficult, and time consuming. As dust and gas are intimately associated, the dust infrared continuum may provide a more feasible way to determine the total gas mass of galaxies at high redshift. To demonstrate the use of the IR continuum as a gas tracer we have compared the total gas mass and IR luminosity of a well-studied sample of 36 nearby galaxies (average distance 10 Mpc) observed with the KINGFISH, THINGS, and HERACLES surveys. These galaxies sample the peak of the mass function, with stellar masses from to , and, unlike the local merger-induced ULIRGs, these galaxies have disk-like morphologies that are likely more representative of the main-sequence galaxies at high redshift observed in current and future deep sub-mm surveys.
We find a strong correlation between the total gas mass and IR luminosity in all Herschel bands, with the strongest and tightest correlation found for the longest wavelength (SPIRE 500). The gas to luminosity ratio, , is found to increase with decreasing sub-mm luminosity, which can be ascribed to the declining metallicity associated with the lower galaxy masses of the low luminosity galaxies. This declining metallicity will lead to a lower dust to gas ratio, and therefore higher gas to dust luminosity ratio. We provide fits to the total gas mass versus IR luminosity relations for all Herschel bands, which can be interpolated between to obtain an empirical relation to be used at any IR wavelength for determining the total gas mass (whose coefficients are given in Table 5). To minimize the effects of metallicity, we also fit only galaxies with stellar masses greater than in our sample, which also results in a significantly reduced dispersion. For the SPIRE 500 band we find that a linear relation is a reasonable approximation, and find that log, with a dispersion of only 0.118 dex.
The molecular gas mass surface density has been demonstrated to be more tightly associated with the SFR than the atomic gas, thus we also provide calibrations for the molecular gas. We find similarly strong correlations, with the strongest correlation found for the PACS100 and PACS160 bands that lie at the peak of the IR emission, and are strongly correlated with the total IR luminosity. This correlation between L160 and MH2 appears to be driven mostly by the correlation of both the average dust temperature (as measured by PACS160/SPIRE500) and molecular gas fraction (LCO/Mgas) with galaxy mass and metallicity, with dwarf galaxies showing both warmer dust and lower molecular gas fractions. Given this correlation, we suggest that the L160–MH2 relation not be applied to higher redshifts.
Using the resolved nature of the IR and gas surveys we employed in this survey, we also explored the correlations using elliptical annuli, and find the same correlations as the integrated comparisons, albeit with larger scatter. For most galaxies we find that the ratio increases with radius, as expected from the determined radial metallicity gradients. However, for some galaxies the relation is observed to deviate from the metallicity gradient at larger radii, becoming much larger. A drop in the mean dust temperature plays at least some role in this observed excess, given the decrease in stellar mass surface densities relative to gas surface densities, and supported by the observed steeper to relation relative to the radial relation. This deviation in the ratio in the outskirts in galaxies, and the extended HI disks not visible in the IR observed in a fraction of our galaxies, suggest that the mass of extended gas in galaxies cannot be straightforwardly determined from the IR emission.
However, even with these radial trends, the total gas mass of galaxies within their optical radius can be well determined within a factor of 2 by observations of the sub-mm dust emission, and typically to within 30% for typical (log(M) galaxies observed in high redshift samples.
References
- Abdalla & Rawlings (2005) Abdalla, F. B., & Rawlings, S. 2005, MNRAS, 360, 27
- Abdo et al. (2010) Abdo, A. A., Ackermann, M., Ajello, M., et al. 2010, ApJ, 710, 133
- Aniano et al. (2011) Aniano, G., Draine, B. T., Gordon, K. D., & Sandstrom, K. 2011, PASP, 123, 1218
- Aniano et al. (2012) Aniano, G., Draine, B. T., Calzetti, D., et al. 2012, ApJ, 756, 138
- Auld et al. (2013) Auld, R., Bianchi, S., Smith, M. W. L., et al. 2013, MNRAS, 428, 1880
- Barnes et al. (2001) Barnes, D. G., Staveley-Smith, L., de Blok, W. J. G., et al. 2001, MNRAS, 322, 486
- Bauermeister et al. (2013) Bauermeister, A., Blitz, L., Bolatto, A., et al. 2013, ApJ, 768, 132
- Bigiel et al. (2008) Bigiel, F., Leroy, A., Walter, F., et al. 2008, AJ, 136, 2846
- Bolatto et al. (2013) Bolatto, A. D., Wolfire, M., & Leroy, A. K. 2013, ARA&A, 51, 207
- Boquien et al. (2013) Boquien, M., Boselli, A., Buat, V., et al. 2013, A&A, 554, A14
- Boselli et al. (2002) Boselli, A., Lequeux, J., & Gavazzi, G. 2002, A&A, 384, 33
- Boselli et al. (2014a) Boselli, A., Cortese, L., & Boquien, M. 2014a, A&A, 564, A65
- Boselli et al. (2014b) Boselli, A., Cortese, L., Boquien, M., et al. 2014b, A&A, 564, A66
- Bourne et al. (2013) Bourne, N., Dunne, L., Bendo, G. J., et al. 2013, MNRAS, 436, 479
- Brinchmann et al. (2004) Brinchmann, J., Charlot, S., White, S. D. M., et al. 2004, MNRAS, 351, 1151
- Carilli & Walter (2013) Carilli, C. L., & Walter, F. 2013, ARA&A, 51, 105
- Compiègne et al. (2011) Compiègne, M., Verstraete, L., Jones, A., et al. 2011, A&A, 525, A103
- Corbelli et al. (2012) Corbelli, E., Bianchi, S., Cortese, L., et al. 2012, A&A, 542, A32
- Croxall et al. (2013) Croxall, K. V., Smith, J. D., Brandl, B. R., et al. 2013, ApJ, 777, 96
- Dale et al. (2012) Dale, D. A., Aniano, G., Engelbracht, C. W., et al. 2012, ApJ, 745,
- Decarli et al. (2014) Decarli, R., Walter, F., Carilli, C., et al. 2014, ApJ, 782, 78
- Draine & Li (2007) Draine, B. T., & Li, A. 2007, ApJ, 657, 810
- Draine et al. (2007) Draine, B. T., Dale, D. A., Bendo, G., et al. 2007, ApJ, 663, 866
- Duffy et al. (2012) Duffy, A. R., Meyer, M. J., Staveley-Smith, L., et al. 2012, MNRAS, 426, 3385
- Eales et al. (2012) Eales, S., Smith, M. W. L., Auld, R., et al. 2012, ApJ, 761, 168
- Galametz et al. (2013) Galametz, M., Kennicutt, R. C., Calzetti, D., et al. 2013, MNRAS, 431, 1956
- Galametz et al. (2014) Galametz, M., Albrecht, M., Kennicutt, R., et al. 2014, arXiv:1401.3693
- Galliano et al. (2011) Galliano, F., Hony, S., Bernard, J.-P., et al. 2011, A&A, 536, A88
- Gao & Solomon (2004) Gao, Y., & Solomon, P. M. 2004, ApJ, 606, 271
- Griffin et al. (2010) Griffin, M. J., Abergel, A., Abreu, A., et al. 2010, A&A, 518, L3
- Guelin et al. (1993) Guelin, M., Zylka, R., Mezger, P. G., et al. 1993, A&A, 279, L37
- Guelin et al. (1995) Guelin, M., Zylka, R., Mezger, P. G., Haslam, C. G. T., & Kreysa, E. 1995, A&A, 298, L29
- Haynes et al. (2011) Haynes, M. P., Giovanelli, R., Martin, A. M., et al. 2011, AJ, 142, 170
- Hildebrand (1983) Hildebrand, R. H. 1983, QJRAS, 24, 267
- Hodge et al. (2013) Hodge, J. A., Karim, A., Smail, I., et al. 2013, ApJ, 768, 91
- Israel (1997) Israel, F. P. 1997, A&A, 328, 471
- Jenkins & Savage (1974) Jenkins, E. B., & Savage, B. D. 1974, ApJ, 187, 243
- Kainulainen et al. (2011) Kainulainen, J., Alves, J., Beuther, H., Henning, T., & Schuller, F. 2011, A&A, 536, A48
- Karim et al. (2011) Karim, A., Schinnerer, E., Martínez-Sansigre, A., et al. 2011, ApJ, 730, 61
- Kennicutt (1998) Kennicutt, R. C., Jr. 1998, ApJ, 498, 541
- Kennicutt et al. (2003) Kennicutt, R. C., Jr., Armus, L., Bendo, G., et al. 2003, PASP, 115, 928
- Kennicutt et al. (2011) Kennicutt, R. C., Calzetti, D., Aniano, G., et al. 2011, PASP, 123, 1347
- Kewley & Ellison (2008) Kewley, L. J., & Ellison, S. L. 2008, ApJ, 681, 1183
- Kobulnicky & Kewley (2004) Kobulnicky, H. A., & Kewley, L. J. 2004, ApJ, 617, 240
- Kreckel et al. (2013) Kreckel, K., Groves, B., Schinnerer, E., et al. 2013, ApJ, 771, 62
- Lada et al. (1994) Lada, C. J., Lada, E. A., Clemens, D. P., & Bally, J. 1994, ApJ, 429, 694
- Leroy et al. (2009) Leroy, A. K., Walter, F., Bigiel, F., et al. 2009, AJ, 137, 4670
- Leroy et al. (2011) Leroy, A. K., Bolatto, A., Gordon, K., et al. 2011, ApJ, 737, 12
- Leroy et al. (2013) Leroy, A. K., Walter, F., Sandstrom, K., et al. 2013, AJ, 146, 19
- Mooney & Solomon (1988) Mooney, T. J., & Solomon, P. M. 1988, ApJ, 334, L51
- Madden et al. (2006) Madden, S. C., Galliano, F., Jones, A. P., & Sauvage, M. 2006, A&A, 446, 877
- Magdis et al. (2011) Magdis, G. E., Daddi, E., Elbaz, D., et al. 2011, ApJ, 740, L15
- Magdis et al. (2012) Magdis, G. E., Daddi, E., Béthermin, M., et al. 2012, ApJ, 760, 6
- Magrini et al. (2011) Magrini, L., Bianchi, S., Corbelli, E., et al. 2011, A&A, 535, A13
- Meyer (2009) Meyer, M. 2009, Panoramic Radio Astronomy: Wide-field 1-2 GHz Research on Galaxy Evolution,
- Moustakas et al. (2010) Moustakas, J., Kennicutt, R. C., Jr., Tremonti, C. A., et al. 2010, ApJS, 190, 233
- Muñoz-Mateos et al. (2013) Muñoz-Mateos, J. C., Sheth, K., Gil de Paz, A., et al. 2013, ApJ, 771, 59
- Obreschkow & Rawlings (2009) Obreschkow, D., & Rawlings, S. 2009, ApJ, 696, L129
- Obreschkow et al. (2011) Obreschkow, D., Heywood, I., & Rawlings, S. 2011, ApJ, 743, 84
- Pilbratt et al. (2010) Pilbratt, G. L., Riedinger, J. R., Passvogel, T., et al. 2010, A&A, 518, L1
- Pilyugin & Thuan (2005) Pilyugin, L. S., & Thuan, T. X. 2005, ApJ, 631, 231
- Poglitsch et al. (2010) Poglitsch, A., Waelkens, C., Geis, N., et al. 2010, A&A, 518, L2
- Prochaska et al. (2005) Prochaska, J. X., Herbert-Fort, S., & Wolfe, A. M. 2005, ApJ, 635, 123
- Rémy-Ruyer et al. (2013) Rémy-Ruyer, A., Madden, S. C., Galliano, F., et al. 2013, A&A, 557, A95
- Rémy-Ruyer et al. (2014) Rémy-Ruyer, A., Madden, S. C., Galliano, F., et al. 2014, A&A, 563, A31
- Roussel (2012) Roussel, H. 2012, arXiv:1205.2576
- Saintonge et al. (2011a) Saintonge, A., Kauffmann, G., Kramer, C., et al. 2011a, MNRAS, 415, 32
- Saintonge et al. (2011b) Saintonge, A., Kauffmann, G., Wang, J., et al. 2011b, MNRAS, 415, 61
- Sandstrom et al. (2013) Sandstrom, K. M., Leroy, A. K., Walter, F., et al. 2013, ApJ, 777, 5
- Santini et al. (2014) Santini, P., Maiolino, R., Magnelli, B., et al. 2014, A&A, 562, A30
- Schruba et al. (2011) Schruba, A., Leroy, A. K., Walter, F., et al. 2011, AJ, 142, 37
- Scoville et al. (2014) Scoville, N., Aussel, H., Sheth, K., et al. 2014, ApJ, 783, 84
- Sheth et al. (2010) Sheth, K., Regan, M., Hinz, J. L., et al. 2010, PASP, 122, 1397
- Shetty et al. (2009) Shetty, R., Kauffmann, J., Schnee, S., & Goodman, A. A. 2009, ApJ, 696, 676
- Solomon et al. (1987) Solomon, P. M., Rivolo, A. R., Barrett, J., & Yahil, A. 1987, ApJ, 319, 730
- Solomon & Vanden Bout (2005) Solomon, P. M., & Vanden Bout, P. A. 2005, ARA&A, 43, 677
- Smith et al. (2012) Smith, M. W. L., Gomez, H. L., Eales, S. A., et al. 2012, ApJ, 748, 123
- Tabatabaei et al. (2014) Tabatabaei, F. S., Braine, J., Xilouris, E. M., et al. 2014, A&A, 561, A95
- Tacconi et al. (2013) Tacconi, L. J., Neri, R., Genzel, R., et al. 2013, ApJ, 768, 74
- Tremonti et al. (2004) Tremonti, C. A., Heckman, T. M., Kauffmann, G., et al. 2004, ApJ, 613, 898
- Walter et al. (2008) Walter, F., Brinks, E., de Blok, W. J. G., et al. 2008, AJ, 136, 2563
- Walter et al. (2011) Walter, F., Sandstrom, K., Aniano, G., et al. 2011, ApJ, 726, L11
- Walter et al. (2014) Walter, F., Decarli, R., Sargent, M., et al. 2014, ApJ, 782, 79
- Wolfire, Hollenbach, & McKee (2010) Wolfire, M., Hollenbach, D., & McKee, C. 2010,ApJ, 716, 1191
- Yabe et al. (2014) Yabe, K., Ohta, K., Iwamuro, F., et al. 2014, MNRAS, 437, 3647
- Young et al. (1995) Young, J. S., Xie, S., Tacconi, L., et al. 1995, ApJS, 98, 219
- Zubko et al. (2004) Zubko, V., Dwek, E., & Arendt, R. G. 2004, ApJS, 152, 211