Probing the circumgalactic medium of active galactic nuclei with background quasars
Abstract
We performed a detailed study of the extended cool gas, traced by Mgii absorption [ Å], surrounding 14 narrow-line active galactic nuclei (AGNs) at using background quasar sight-lines. The background quasars probe the AGNs at projected distances of kpc. We find that, between kpc, AGNs appear to have lower Mgii gas covering fractions (0.09) than quasars (0.47) and possibly lower than in active field galaxies (0.25). We do not find a statistically significant azimuthal angle dependence for the Mgii covering fraction around AGNs, though the data hint at one. We also study the ‘down-the-barrel’ outflow properties of the AGNs themselves and detect intrinsic NaiD absorption in 8/8 systems and intrinsic Mgii absorption in 2/2 systems, demonstrating that the AGNs have significant reservoirs of cool gas. We find that 6/8 NaiD and 2/2 Mgii intrinsic systems contain blueshifted absorption with km s-1, indicating outflowing gas. The 2/2 intrinsic Mgii systems have outflow velocities a factor of higher than the NaiD outflow velocities. Our results are consistent with AGN-driven outflows destroying the cool gas within their halos, which dramatically decreases their cool gas covering fraction, while star-burst driven winds are expelling cool gas into their circumgalactic media (CGM). This picture appears contrary to quasar–quasar pair studies which show that the quasar CGM contains significant amounts of cool gas whereas intrinsic gas found ‘down-the-barrel’ of quasars reveals no cool gas. We discuss how these results are complementary and provide support for the AGN unified model.
keywords:
—galaxies: ISM, haloes —quasars: absorption lines.1 Introduction
Galactic outflows originating in regions of high star formation surface-density and in active galactic nuclei (AGNs) likely play a significant role in regulating the metal content of galaxies and are probably fully responsible for the chemical enrichment of the intergalactic medium (IGM) (e.g. Oppenheimer et al., 2010). Understanding the distribution and extent of the cool gas surrounding galaxies can aid in constraining the metal contribution via winds to the CGM and IGM. Though there are many studies of outflows originating from star-forming galaxies (Tremonti et al., 2007; Zibetti et al., 2007; Martin & Bouché, 2009; Weiner et al., 2009; Noterdaeme et al., 2010; Rubin et al., 2010; Steidel et al., 2010; Bordoloi et al., 2011; Coil et al., 2011; Kacprzak & Churchill, 2011; Nestor et al., 2011; Ménard & Fukugita, 2012; Martin et al., 2012; Rubin et al., 2013; Bordoloi et al., 2013), we are only beginning to understand the effect and distribution of gas surrounding AGNs (e.g. Heckman et al., 2000; Martin, 2005; Rupke et al., 2005a, b).
Recent work has shown that large gas reservoirs surround quasars with a covering fraction of 60–80% and a physical extent of 200 kpc (Hennawi et al., 2006; Bowen et al., 2006; Prochaska & Hennawi, 2009; Tytler et al., 2009; Farina et al., 2013; Prochaska et al., 2013; Farina et al., 2014), similar to what is observed for inactive field galaxies (Kacprzak et al., 2008; Chen et al., 2010; Nielsen et al., 2013; Churchill et al., 2013a, b). The cool gas surrounding field galaxies, as traced by Mgii absorption, exhibits an anisotropic distribution whereby most gas is located along their projected major and minor axes, which is interpreted to be due to accretion and outflows, respectively (Kacprzak et al., 2011b; Bordoloi et al., 2011; Bouché et al., 2012; Bordoloi et al., 2012; Kacprzak et al., 2012). Quasars also exhibit an anisotropic gas distribution possibly caused by the intense AGN-driven ionizing radiation that heats the gas to temperatures of K and destroys cool gas clouds out to a few hundred kiloparsecs (Chelouche et al., 2008). Prochaska et al. (2013) analyzed 74 quasar–quasar pairs with projected separations of kpc and showed that, although quasars exhibit a high covering fraction of cool gas as traced by Hi and Cii, cool gas is rarely detected along the jet (‘down-the-barrel’) of the quasar itself. They suggest that the background quasar sight-lines intercept gas that is shadowed from the ionizing radiation of the quasar jet. Similar anistropy has been observed in Hi (Hennawi & Prochaska, 2007; Prochaska & Hennawi, 2009) and Mgii (Bowen et al., 2006; Farina et al., 2013, 2014). The distribution of the CGM of AGNs, like Seyfert galaxies, has yet to be explored.
If the AGN radiation field is responsible for destroying cool gas, then the orientation of the AGN-driven outflows with respect to the background quasar sight-line may dictate the presence, strength and frequency of the absorption. The inclination of the AGN-driven outflows are primarily constrained by the unified AGN model (see Bianchi et al., 2012, and references therein). The type of AGN observed may be dependent on the observers’ vantage point, or essentially the AGN dust torus inclination. Quasars and blazers are typically viewed down-the-barrel of the AGN jet (face-on torus), while broad-line Seyfert I objects are viewed at a slightly higher inclination and narrow-line Seyfert IIs are viewed with an edge-on torus. If one were to probe quasars or blazars with background quasars, the dusty torus is in the plane of the sky (face-on and orthogonal to the jet) and provides the maximum cross-section of radiation-shielded extended halo gas, yielding the highest covering fraction of cool halo gas. Therefore, we would expect that the cool gas covering fraction surrounding AGNs should decrease as the inclination of the dusty torus decreases from face-on to edge-on for quasars, Seyfert Is and Seyfert IIs, respectively.
Motivated by the idea that the gas covering fraction of AGNs may change with viewing angle (according to the unified model), we target a sample of 14 narrow-line AGN (Seyfert IIs) to examine their cool CGM gas covering fractions. We target AGN so that we are able to detect the Mgii and NaiD absorption doublets from ground-based facilities and we are able to resolve the morphological properties of their host galaxies in ground-based images. We investigate the cool gas covering fractions and azimuthal angle dependencies. We show that AGN exhibit intrinsic absorption, unlike quasars, and we quantify their outflow properties. In Section 2 we present our sample and data reduction. In Section 3, we present the gas covering fractions and azimuthal dependencies. present clear signs of intrinsic (down-the-barrel) cool gas outflows originating from ongoing star-formation rather than the jets and quantify their outflow properties. In Section 4, we discuss what can be inferred from the results and how it arises naturally from the AGN unified model. Concluding remarks are offered in Section 5. Throughout we adopt an H km s-1Mpc-1, , cosmology.
| SDSS | RAQSO | DECQSO | Pair | Date (UT) | Exposure | ||
|---|---|---|---|---|---|---|---|
| Quasar Name | (J2000) | (J2000) | Name | (sec.) | |||
| SDSS J230632.06004611.7 | 23:06:32.06 | 00:46:11.78 | 9754 | 0.57072 | 19.8 | Sep. 18 2009 | 1880 |
| SDSS J133216.60020634.3 | 13:32:16.60 | 02:06:34.39 | 6856 | 0.52960 | 19.2 | Feb. 12 2010 | 3720 |
| SDSS J101133.17011451.1 | 10:11:33.17 | 01:14:51.17 | 4138 | 0.37035 | 19.9 | Feb. 13 2010 | 4960 |
| SDSS J144732.28610722.1 | 14:47:32.28 | 61:07:22.19 | 7966 | 0.36189 | 19.6 | Feb. 13 2010 | 4300 |
| SDSS J095105.22000049.2 | 09:51:05.22 | 00:00:49.29 | 3906 | 0.87571 | 19.3 | Feb. 13 2010 | 4960 |
| SDSS J123844.41001140.2 | 12:38:44.41 | 00:11:40.22 | 5901 | 0.87540 | 18.8 | Feb. 13 2010 | 3720 |
| SDSS J133248.52014250.3 | 13:32:48.52 | 01:42:50.35 | 6863 | 0.24717 | 19.3 | Feb. 12 2010 | 5120 |
| SDSS J080626.99465857.1 | 08:06:26.99 | 46:58:57.12 | 2713 | 1.35435 | 19.7 | Feb. 13 2010 | 4960 |
| SDSS J032605.40073242.2 | 03:26:05.40 | 07:32:42.23 | 2004 | 1.05407 | 19.6 | Feb. 12 2010 | 3720 |
| SDSS J095701.58023857.3 | 09:57:01.58 | 02:38:57.32 | 3991 | 1.07677 | 19.3 | Feb. 12 2010 | 3720 |
| SDSS J120210.73005520.4 | 12:02:10.73 | 00:55:20.44 | 5463 | 1.18228 | 19.4 | Feb. 12 2010 | 3720 |
| SDSS J143729.16024404.2 | 14:37:29.16 | 02:44:04.21 | 7839 | 1.30369 | 19.8 | Feb. 13 2010 | 3180 |
| SDSS J085755.38531145.3 | 08:57:55.38 | 53:11:45.32 | 3273 | 1.57320 | 19.6 | Feb. 12 2010 | 3720 |
| SDSS J031531.50074002.7 | 03:15:31.50 | 07:40:02.71 | 1909 | 1.05373 | 20.0 | Feb. 13 2010 | 2480 |
| Pair | RAAGN | DECAGN | NaID | ||||||||
|---|---|---|---|---|---|---|---|---|---|---|---|
| Name | (J2000) | (J2000) | (degrees) | (degrees) | (kpc) | (Å) | (Å) | (Å) | |||
| 9754 | 0.193216 | 23:06:31.674 | 00:45:53.0 | 18.7 | 62.6 | 1.050.10 | 0.860.10 | 0.193263 | |||
| 6856 | 0.129467 | 13:32:18.116 | 02:07:19.5 | 18.0 | 117.6 | 0.27 | 0.27 | 0.08 | |||
| 4138 | 0.121781 | 10:11:29.309 | 01:15:07.7 | 18.1 | 134.1 | 0.23 | 0.23 | 0.10 | |||
| 7966 | 0.136349 | 14:47:39.330 | 61:06:56.1 | 17.5 | 140.2 | 0.30 | 0.32 | ||||
| 3906 | 0.132690 | 09:51:09.084 | 00:00:35.4 | 18.0 | 141.8 | 0.11 | 0.11 | 0.09 | |||
| 5901 | 0.139482 | 12:38:45.634 | 00:10:36.4 | 18.3 | 164.8 | 0.13 | 0.13 | 0.13 | |||
| 6863 | 0.165819 | 13:32:51.879 | 01:42:21.2 | 17.9 | 164.8 | 0.20 | 0.20 | ||||
| 2713 | 0.124705 | 08:06:32.257 | 46:59:48.6 | 17.8 | 168.2 | 1.370.10 | 1.600.09 | 0.124438 | |||
| 2004 | 0.156050 | 03:26:06.049 | 07:33:46.7 | 18.6 | 176.4 | 0.19 | 0.19 | 0.08 | |||
| 3991 | 0.127130 | 09:57:06.861 | 02:39:04.0 | 17.9 | 182.2 | 0.17 | 0.17 | ||||
| 5463 | 0.163679 | 12:02:06.463 | 00:55:15.6 | 18.3 | 182.6 | 0.17 | 0.17 | 0.07 | |||
| 7839 | 0.179098 | 14:37:28.817 | 02:45:08.7 | 18.3 | 198.4 | 0.21 | 0.21 | 0.11 | |||
| 3273 | 0.163778 | 08:57:57.341 | 53:13:09.5 | 18.2 | 244.1 | 0.28 | 0.28 | ||||
| 1909 | 0.198855 | 03:15:28.231 | 07:41:06.2 | 18.8 | 265.2 | 0.18 | 0.18 | 0.11 |
2 GALAXY SAMPLE AND DATA ANALYSIS
2.1 Sample Selection
To probe the gas environment around AGN we have searched for AGN that lie in the foreground of background quasars. We cross-correlated a catalogue of 12,000 AGN that are spectroscopically classified using SDSS (DR2) spectra (Hao et al., 2005) with spectroscopically classified quasars in SDSS (DR7). Out of the 77 foreground AGN–background quasar pairs identified, we applied the following selection criteria: (1) The projected separations are less than 400 kpc; (2) A redshift separation of km s-1 to avoid confusion between the foreground AGN Mgii absorption and the intrinsic Mgii absorption from the quasar; (3) Both the foreground AGN and the background quasar have a SDSS -band apparent magnitude of ; (4) The Mgii absorption occurs redward of the quasar Ly emission in order to avoid the Ly forest. A total of 31 foreground AGN–background quasar pairs meet these selection criteria. We have observed 14 AGN–quasar pairs that were at optimal airmass during our observing runs. The 14 foreground AGN presented here have a redshift range determined by SDSS of . Typical redshift errors are ( km s-1). The background quasars probe the foreground AGNs over an impact parameter range of kpc. All 14 objects are narrow-line AGN (Seyfert II).
2.2 AGN & Background Quasar Spectroscopy
The combined wavelength coverage and ultra-blue sensitivity of Keck/LRIS (Oke et al., 1995; Steidel et al., 2004) is ideal for targeting Mgii absorption (Barton & Cooke, 2009; Kacprzak et al., 2011a) and NaiD absorption (Rupke et al., 2005) at . The Keck/LRIS foreground AGN and background quasar spectra were obtained over three nights; one was obtained in 2009 September and 13 were obtained in two nights in 2010 February. The LRIS slit was oriented such that the background quasar and AGN fell within the slit. Details of the observations are presented in Table 1. We used the LRIS-B/Keck 1200 lines/mm grism, blazed at 3400 Å, which covers a wavelength range of 29103890Å. We used a 1.0′′ slit that yields a dispersion of 0.24 Å per pixel and provides a resolution of FWHM1.6 Å (150 km s-1). Integration times of 1880–5120 seconds were used, depending on the magnitude of the quasar and the foreground AGN redshift, providing 3 detection limits of Å. We concurrently used the LRIS-R/Keck 1200 lines/mm grating blazed at 7500 Å, set to a central wavelength of 6314 Å, which covers a wavelength range of 54957133Å. The 1.0′′ slit used yields a dispersion of 0.40 Å per pixel and provides a resolution of FWHM1.9 Å (85 km s-1). The spectra were reduced using the standard IRAF packages111IRAF is written and supported by the IRAF programming group at the National Optical Astronomy Observatories (NOAO) in Tucson, Arizona. NOAO is operated by the Association of Universities for Research in Astronomy (AURA), Inc. under cooperative agreement with the National Science Foundation. and were corrected to the vacuum and heliocentric frame.
The quasar spectra were searched for Mgii and NaiD doublet candidates using a detection significance level of 3 for each doublet member. Detection and significance levels follow the formalism of Schneider et al. (1993) and Churchill et al. (2000a). In addition, intervening and intrinsic Mgii and Civ absorption systems serendipitously identified in the spectra that were not targeted in this survey are listed in Table 4.
Analysis of the absorption profiles was performed using our own graphics-based interactive software that uses the flux values in individual pixels to measure the equivalent widths and the redshift of the Mgii transition (Churchill & Vogt, 2001). Flux weighted absorption velocity widths were measured between the pixels where the equivalent width per resolution element recovers to the detection threshold (Churchill et al., 1999, 2000a). The redshift for each Mgii and/or NaiD system is computed from the optical depth weighted mean of the absorption profile. The statistical uncertainties in the redshifts range between 0.00001–0.00009 (– km s-1 co-moving).
2.3 AGN Images & Models
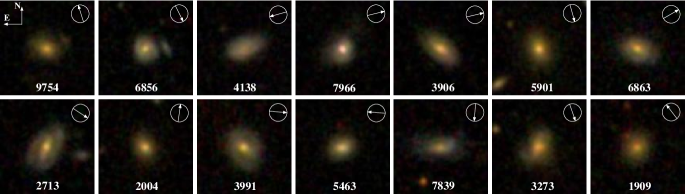
In Figure 1 we show -band SDSS color images of the 14 foreground AGN. The direction of the background quasar sight-line is indicated by the arrow in the upper-right corner of the images.
The AGN-host galaxy morphological parameters were determined by applying the two-dimensional decomposition fitting program GIM2D (Simard et al., 2002) to the -band images. The image point-spread-function required by GIM2D was derived from nearby stars in each image that were modeled using DAOPHOT (Stetson, 1987, 1999).
3 Results
3.1 Transverse Absorption – Covering Fraction
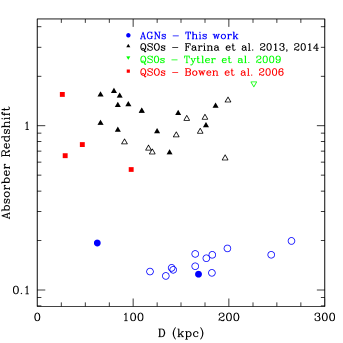
We present the first study of an AGN-selected sample shown in Figure 2 and in Table 2. Our sample of 14 background quasar and foreground AGN pairs probe an impact parameter range of kpc with a detection threshold is Å (3 ). For our sample, we find two AGN with absorption detected at kpc, with Å, and at kpc, with Å.
In Figure 2 we present “transverse” Mgii absorption doublet redshift versus impact parameter for our AGN-selected sample and compare it with quasar-selected samples from other published works. The data presented in Figure 2 have a detection limit of 0.3 Å at the 3 level. Tytler et al. (2009) studied 170 quasar–quasar pairs probing distances out to 2 Mpc. Although this sample is large, the majority of quasar–quasar pairs have velocity separations of 20,000 km s-1; it is therefore unclear if the absorption detected is produced by gas surrounding the foreground quasar or by out-flowing gas from the background quasar itself. Only one quasar pair resides within an impact parameter of 300 kpc and is separated by km s-1. Bowen et al. (2006) and Farina et al. (2013, 2014)222We have recomputed 3 detection limits for the quoted 2 limits of Farina et al. (2013, 2014) and removed systems where revised 3 limits exceed 0.3 Å. probe 4 and 22 foreground quasars, respectively, for which kpc and the velocity separation with respect to the background quasars is greater than km s-1.
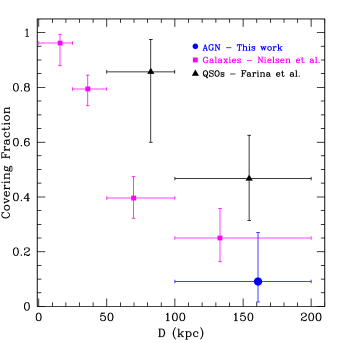
In Figure 3 we present the covering fraction profiles for AGNs (this work), galaxies (Nielsen et al., 2013) and quasars (Farina et al., 2013, 2014). The covering fractions for each sample are determined per impact parameter bin, matching the bins of Nielsen et al. (2013). The plotted value indicates the mean per bin. The covering fraction errors for each AGN, galaxy, quasar datasets are derived from binomial statistics (Gehrels, 1986).
As found by Farina et al. (2014), the covering fractions of quasars are higher than those of isolated galaxies, which is likely due to the richness and extent of the CGM around quasar-host galaxies. This higher Mgii covering fraction is consistent with the high Cii covering fraction (%) found for quasars (Prochaska et al., 2013). However, AGN may exhibit similar or possibly lower covering fractions as compared to field galaxies for kpc.
Notwithstanding the obviously poor statistics at kpc, with one data point (not included on the plot), the data are likely consistent with previous works that AGN-type objects and galaxies have a high covering fraction for kpc.
For 7 of the 14 quasar–AGN pairs, the spectra cover the NaiD absorption doublet. However, no NaiD was detected down to a equivalent width threshold of 0.13 Å, which provides further evidence for no cold gas surrounding the AGNs.
3.2 Transverse Absorption – AGN orientations
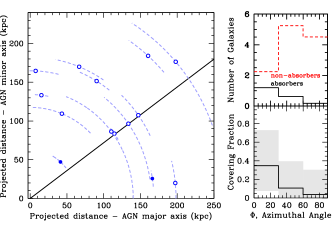
In Figure 4, we show the relative position of the quasar sight-lines with respect to the host AGN projected major ( degrees) and minor ( degrees) axes. The solid line represents a typical half opening-angle determined for galactic-scale winds and AGN outflows of 50 degrees (Hjelm & Lindblad, 1996; Veilleux et al., 2001; Walter et al., 2002; Müller-Sánchez et al., 2011; Bordoloi et al., 2012; Kacprzak et al., 2012; Martin et al., 2012). Note that most sight-lines probe within the expected region for outflowing gas.
We attempted to determine if there is an azimuthal dependence for the Mgii gas covering fraction shown in Figure 4. Since the azimuthal angle for each quasar varies in accuracy and can subtend into several azimuthal angle bins, we apply the method of Kacprzak et al. (2012) whereby we represent the measured azimuthal angles and their uncertainties as uni-variate asymmetric Gaussians, which creates an azimuthal angle probability distribution function (PDF) for each galaxy. Combining the PDFs for all absorbers and non-absorbers produces a mean PDF as a function of the azimuthal angle.
In Figure 4, we present the binned mean azimuthal angle () PDF for the 2 absorbing and 12 non-absorbing galaxies and their covering fractions as a function of the azimuthal angle. The combined PDFs have been area-normalized to the total number of galaxies in each sub-sample. The covering fraction is computed for each azimuthal bin. The errors in the covering fractions are computed using binomial statistics (Gehrels, 1986). The data are suggestive that there could be an excess of absorbers along the galaxy projected major axis ( degrees) compared to the minor axis ( degrees). However, the current sample size is insufficient to determine statistically if such a geometric dependence exists given the binomial error distributions.
3.3 Transverse Absorption – Gas Kinematics
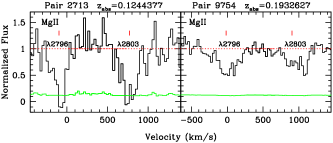
In Figure 5, we present the two detected absorption systems. The normalized flux of the Mgii doublet is plotted with respect to the AGN velocity zero-point. The strongest absorber (ID 2713) is the system at kpc and . This absorber has a Mgii rest-frame equivalent width of Å and a velocity offset of km s-1 blueward of the AGN redshift. The quasar sight-line probes the AGN along the projected major axis. The absorber has a full velocity width spanning km s-1.
The absorber at kpc and (ID 9754) has a 1.1 Å and a velocity offset of km s-1 redward of the AGN redshift with a full velocity width spanning km s-1. This absorber is located near the projected minor axis of the galaxy.
The transverse absorption velocity offsets for these two systems, relative to the AGN systemic velocities, are small and not suggestive of outflows (e.g., Kacprzak et al., 2010a).
3.4 Line-of-sight outflows
The ionization potential of NaiD (5.14 eV) results in a peak in absorption strength in the atmospheres of cool K–M stars (see Jacoby et al., 1984). In addition, it is further absorbed by cool gas within, and surrounding, galaxies. For example, NaiD has been detected as entrained gas within galactic-scale outflows with velocities ranging between 100–1000 km s-1 (e.g. Heckman et al., 2000; Martin, 2005; Rupke et al., 2005a, b). These outflows are measured by observing velocity offsets between galaxy nebular emission lines and ISM absorption lines.
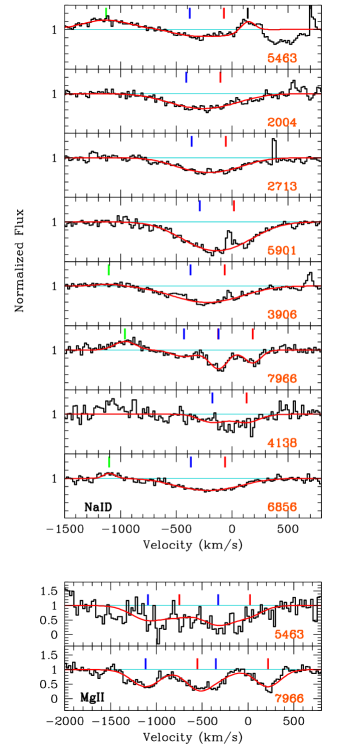
In Figure 6, we present the NaiD absorption doublet for 8 of the 14 AGNs. Not all 14 absorption profiles are presented since some are blended with strong sky features, such as the Å B-band, while others were not recorded because they reside outside the spectral and spatial range of the spectrograph. The flux normalized spectra are plotted at the systemic velocity of the AGN, determined from emission-lines, relative to the NaiD 5897 line. We further show two intrinsic Mgii absorption systems where the signal-to-noise ratio was sufficient to provide a detection. Note that there is no significant evidence for Mgii being detected in emission. Qualitatively, in most cases, there appears to be blueshifted outflows with maximum velocities of 500 km s-1.
To quantify the outflow velocities of the gas, we modeled our data with a procedure similar to that of Rupke et al. (2005a). Least-squares Gaussian deblending was performed (using the program FITTER; Churchill et al., 2000a) to estimate the equivalent widths, velocity widths, and velocity centroids of component structures in the absorption profiles. We fit the minimum number of Gaussian velocity components to the absorption profiles that was well-constrained/required by the data; typically one-to-two components was sufficient to model each absorption system. For four of the NaiD systems, we were required to simultaneously model the Hei 5876 emission-line using a single component set to the systemic velocity of the galaxy. In all cases we fixed the NaiD and Mgii doublet ratios to unity to avoid unphysical models.
Our fit results are presented in Table 3 and Figure 6. The red and blue tick-marks in the figure indicate the red and blue components of the doublet required in the fit. Only for three NaiD systems (and both Mgii systems) were two doublets required by the data.
Following Rupke et al. (2005b), we adopt the definition that km s-1 is outflowing wind material. From Table 3, we find that 6/8 NaiD systems contain blueshifted absorption with km s-1, indicating outflows with velocities ranging between 55 to 125 km s-1. In 2/8 systems, one has redshifted absorption and the other has absorption near the systemic velocity. For all 6 outflow objects, we find a mean Doppler parameter of km s-1, which is consistent with the range of values derived by Rupke et al. (2005) for 20 Seyfert II galaxies at having 232 km s-1.
Rupke et al. (2005) also define the maximum outflow velocity to be the central velocity of the most blueshifted component minus half its FWHM: FWHM. The for our sample is listed in Table 3 and we find a mean value for the 6 wind systems of km s-1, which is also consistent with, but smaller than, the values determined by Rupke et al. (2005) of km s-1.
We have applied generalized Kendall and Spearman rank correlation tests between the outflow properties with the galaxy inclination angle. We only find suggestive trends with inclination and the outflow equivalent width (2.1) and inclination and (1.7). Additional galaxies are required to test the significance of these correlations.
The two Mgii absorption systems also exhibit high velocity outflowing gas, higher than what is detected for NaiD in the same systems. The blueshifted velocity offset for the bluest Mgii components for both systems is km s-1 from the AGN systemic velocity, a factor of more than higher than the NaiD outflows. The Doppler parameters are consistent with those found for the NaiD. However, is a factor of two higher than those of the NaiD systems. This suggests that Mgii traces warmer gas and is more sensitive to outflowing material than the NaiD absorption.
| Pair | Ion | ||||
|---|---|---|---|---|---|
| (Å) | (km s-1) | (km s-1) | (km s-1) | ||
| 6856 | NaiD | 2.050.13 | 6216 | 31130 | 21822 |
| 4138 | NaiD | 1.480.13 | 13017 | 20928 | 2622 |
| 7966 | NaiD | 1.140.04 | 1853 | 1034 | |
| NaiD | 0.810.05 | 12510 | 15113 | 20112 | |
| Mgii | 3.730.10 | 16110 | 1948 | ||
| Mgii | 2.600.11 | 4068 | 22210 | 54762 | |
| 3906 | NaiD | 3.020.15 | 6816 | 35828 | 24721 |
| 5901 | NaiD | 5.220.17 | 169 | 34217 | 15512 |
| 2713 | NaiD | 2.430.09 | 5517 | 29433 | 20224 |
| 2004 | NaiD | 2.690.14 | 10415 | 33927 | 27420 |
| 5463 | NaiD | 1.020.17 | 7344 | 20962 | 17854 |
| Mgii | 2.110.30 | 377 | 21211 | ||
| Mgii | 6.311.01 | 38255 | 33058 | 5179 |
4 Discussion
It is clear that there are large Hi/metal reservoirs surrounding quasars because their gas covering fractions are 60–80% out to 200 kpc (Hennawi et al., 2006; Bowen et al., 2006; Prochaska & Hennawi, 2009; Tytler et al., 2009; Farina et al., 2013; Prochaska et al., 2013; Farina et al., 2014). Farina et al. (2014) show that the covering fraction of Mgii absorption around quasars is more elevated than that found for field galaxies. We find here that AGN have lower covering fractions, 0.09, than quasars, 0.47, and possibly lower than galaxies, 0.25 between kpc.
The main difference between galaxies, AGN, and quasars is the mass and energy output of their central massive black holes. Chelouche et al. (2008) modeled the distribution of cool gas around quasars and concluded that conical AGN-driven winds could heat the gas to temperatures of K and could photo-ionize and photo-evaporate cool Mgii gas clouds out to a few hundred kiloparsecs. This is consistent with the observed anisotropic distribution of gas around quasars (e.g, Farina et al., 2014). Quasar–quasar pairs exhibit high transverse covering fractions while intrinsic Mgii absorption in a quasar’s own spectrum is rarely seen (e.g. Hennawi & Prochaska, 2007; Prochaska & Hennawi, 2009; Farina et al., 2013; Prochaska et al., 2013; Farina et al., 2014). Farina et al. (2014) report zero intrinsic Mgii absorption detections in 26 quasar spectra. This is consistent with our observations of intrinsic Mgii absorption in the quasar, documented in Table A1, where we show that the background quasars only yield intrinsic Mgii absorption in 1/5 objects ( Å, 3). However, for our foreground AGN sample, we detect 2/2 objects with intrinsic absorption along with 8/8 systems containing intrinsic NaiD absorption (shown in Figure 6). This result indicates that cool gas clouds intrinsic to the AGN are not destroyed by the ionizing radiation originating central massive black holes and suggests that the observed anisotropic distribution of gas around quasars and AGN is consistent with the AGN unification scheme (e.g. Urry & Padovani, 1995) since gas within AGN-driven winds is heated to high temperatures, while the CGM remains unaffected outside of the wind region.
Given that AGN outflows are roughly conical, with half opening angles ranging between degrees (Hjelm & Lindblad, 1996; Veilleux et al., 2001; Müller-Sánchez et al., 2011), one might expect an anisotropic distribution of cool gas surrounding the AGN: absorption would be detected outside the jet region and there would be a lack of absorption inside the jet region. We do not find a statistically significant azimuthal angle dependence for the Mgii covering fraction around the AGN hosts, though a possible hint of one may exist. A caveat to our geometric assumption, contrary to starburst-driven winds, is that AGN outflow jets (Seyfert Is and IIs) measured at radio wavelengths are oriented almost randomly relative to the major axis of the host galaxy (e.g. Kinney et al., 2000; Gallimore et al., 2006). Simulations have shown that offsets between the jet orientation with respect to the angular momentum of the disk can be caused by galaxy mergers or by instabilities (gravitational or accretion) in isolated disks (Hopkins et al., 2012). This could be why we do not find a strong trend between the covering fraction and azimuthal angle. Thus, if there is a trend between covering fraction and orientation, it could be diluted by the jet/disk offsets and thus detecting a statistically significant trend (if it exists) would require a larger sample than the one we present here.
It is well known that most optically-selected AGN also host nuclear starbursts that produce starburst-driven winds (e.g. Veilleux et al., 2001; Rupke et al., 2005). Our host galaxies have a median inclination of degrees and thus, if there are star formation driven winds, we may observe them via blueshifted absorption-line outflows (see Fig 6). In 6/8 systems we find NaiD outflows with km s-1, the maximum blueshfited velocities reaching up to km s-1. These values are consistent with the measurements made using NaiD absorption for 20 AGN Seyfert IIs at a similar redshift by Rupke et al. (2005). It is likely that these outflows are primarily due to star-formation driven winds because the AGN winds are perpendicular to the line-of-sight, although there could be a combination of both (Veilleux et al., 2001). Rupke et al. (2005) find that the star formation rates of Seyfert IIs range between M⊙ yr-1, with outflow masses and outflow rates of log(/M⊙)=8.8 and M⊙ yr-1, respectively. Given the consistencies between the outflow properties of Rupke et al. (2005) and our sample, we expect that our AGNs could have similar outflow masses and rates produced in starburst-driven winds.
In two cases, shown in Figure 6, we also detect Mgii absorption outflowing from the AGN at speeds 4 times higher than found for NaiD. All of the detected NaiD and Mgii absorption indicates the presence of gas reservoirs with most of them outflowing from the host galaxy. However, even though we find that the AGN hosts contain significant amounts of cool gas, we do not observe it in their halos in Mgii absorption as probed by the background quasars.
Given the high covering fraction found for quasars and the lack of metal-line absorption within intrinsic down-the-barrel quasar spectra, which would be equivalent to looking down the jet of an AGN, is highly suggestive that the cool gas is ionized by the jets. Furthermore, we find evidence that cool gas is indeed being ejected at a few hundred km s-1 from the AGN. However we do not observe significant amounts of absorption around them. This adds credence to that idea that the AGN-driven winds may be destroying the Mgii, consistent with the AGN unified model (Urry & Padovani, 1995).
5 Conclusions
We have performed a detailed study of the cool gas covering fraction, traced by Mgii absorption, surrounding narrow-line AGN (Seyfert IIs) using background quasar sight-lines. We analyzed 14 AGN–quasar pairs with the foreground AGN having a redshift range of . The background quasars probe cool halo gas surrounding the foreground AGNs over an impact parameter range of kpc. We further study the ‘down-the-barrel’ outflow properties of the AGNs themselves.
Our mains results can be summarized as follows:
-
1.
We find that AGN appear to have lower covering fractions between kpc, 0.09, than quasars, 0.47, and possibly lower than galaxies, 0.25. We do not find a statistically significant azimuthal angle dependence for the Mgii absorption covering fraction around the AGNs, though there could be a possible hint of one. More AGN–quasar pairs are required to demonstrate the azimuthal angle dependence or lack thereof and to test rigorously test for differences in the covering fractions.
-
2.
AGN intrinsic NaiD absorption lines detected in 8/8 systems indicate that the AGN hosts have significant reservoirs of cool gas. This is validated by the 2/2 intrinsic Mgii absorption lines systems also detected.
-
3.
We find that 6/8 intrinsic NaiD systems contain blueshifted absorption with km s-1, indicating outflows. For all 6 outflow objects, we find a mean Doppler parameter of km s-1 and a maximum outflow velocity of km s-1, both consistent with the range of values computed by Rupke et al. (2005) for 20 Seyfert II galaxies at a similar redshift.
-
4.
The 2/2 intrinsic Mgii absorption systems also exhibit high velocity outflowing gas and are a factor of than higher than the NaiD outflows and the being a factor of two higher than those of the NaiD systems. This is suggestive that Mgii traces warmer gas that is more sensitive to outflowing material than the NaiD absorption.
Our results are consistent with AGN-driven winds ionizing the cool gas, which dramatically decreases the cool K gas covering fraction of AGN. Our observations also show that star-burst driven winds are expelling cool gas into the CGM. This picture is consistent with results from quasar–quasar pair studies. Previous quasar–quasar studies have found that intrinsic cool gas down-the-barrel is non-existent while their halos contain significant amounts of cool gas. Both these results are complementary and provide support for the AGN unified model.
Acknowledgments
We thank the anonymous referee for providing insightful comments and improving the paper. MTM and JC thank the Australian Research Council for Discovery Project grant DP130100568 and Future Fellowship grant FT130101219 which supported this work. We thank W.M. Keck Observatory, which is operated as a scientific partnership among the California Institute of Technology, the University of California and the National Aeronautics and Space Administration. Keck Observatory was made possible by the generous financial support of the W.M. Keck Foundation. Data was also obtained from the Sloan Digital Sky Survey (SDSS). Funding for the SDSS and SDSS-II has been provided by the Alfred P. Sloan Foundation, the Participating Institutions, the National Science Foundation, the U.S. Department of Energy, the National Aeronautics and Space Administration, the Japanese Monbukagakusho, the Max Planck Society, and the Higher Education Funding Council for England. The SDSS Web Site is http://www.sdss.org/. The SDSS is managed by the Astrophysical Research Consortium for the Participating Institutions. The Participating Institutions are the American Museum of Natural History, Astrophysical Institute Potsdam, University of Basel, University of Cambridge, Case Western Reserve University, University of Chicago, Drexel University, Fermilab, the Institute for Advanced Study, the Japan Participation Group, Johns Hopkins University, the Joint Institute for Nuclear Astrophysics, the Kavli Institute for Particle Astrophysics and Cosmology, the Korean Scientist Group, the Chinese Academy of Sciences (LAMOST), Los Alamos National Laboratory, the Max-Planck-Institute for Astronomy (MPIA), the Max-Planck-Institute for Astrophysics (MPA), New Mexico State University, Ohio State University, University of Pittsburgh, University of Portsmouth, Princeton University, the United States Naval Observatory, and the University of Washington.
References
- Barton & Cooke (2009) Barton, E. J., & Cooke, J. 2009, AJ, 138, 1817
- Bianchi et al. (2012) Bianchi, S., Maiolino, R., & Risaliti, G. 2012, Advances in Astronomy, 2012,
- Bordoloi et al. (2013) Bordoloi, R., Lilly, S. J., Hardmeier, E., et al. 2013, arXiv:1307.6553
- Bordoloi et al. (2012) Bordoloi, R., Lilly, S. J., Kacprzak, G. G., & Churchill, C. W. 2012, arXiv:1211.3774
- Bordoloi et al. (2011) Bordoloi, R., Lilly, S. J., Knobel, C., et al. 2011, ApJ, 743, 10
- Bowen et al. (2006) Bowen, D. V., Hennawi, J. F., Ménard, B., et al. 2006, ApJ, 645, L105
- Bouché et al. (2012) Bouché, N., Hohensee, W., Vargas, R., Kacprzak, G. G., et al. 2012, MNRAS, 426, 801
- Chelouche et al. (2008) Chelouche, D., Ménard, B., Bowen, D. V., & Gnat, O. 2008, ApJ, 683, 55
- Chen et al. (2010) Chen, H.-W., Helsby, J. E., Gauthier, J.-R., Shectman, S. A., Thompson, I. B., & Tinker, J. L. 2010, ApJ, 714, 1521
- Churchill et al. (2000a) Churchill, C. W., Mellon, R. R., Charlton, J. C., Jannuzi, B. T., Kirhakos, S., Steidel, C. C., & Schneider, D. P. 2000a, ApJS, 130, 91
- Churchill et al. (2013a) Churchill, C. W., Nielsen, N. M., Kacprzak, G. G., & Trujillo-Gomez, S. 2013, ApJ, 763, L42
- Churchill et al. (1999) Churchill, C. W., Rigby, J. R., Charlton, J. C., & Vogt, S. S. 1999, ApJS, 120, 51
- Churchill et al. (2013b) Churchill, C. W., Trujillo-Gomez, S., Nielsen, N. M., & Kacprzak, G. G. 2013, arXiv:1308.2618
- Churchill & Vogt (2001) Churchill, C. W., & Vogt, S. S. 2001, AJ, 122, 679
- Coil et al. (2011) Coil, A. L., Weiner, B. J., Holz, D. E., et al. 2011, ApJ, 743, 46
- Farina et al. (2013) Farina, E. P., Falomo, R., Decarli, R., Treves, A., & Kotilainen, J. K. 2013, MNRAS, 429, 1267
- Farina et al. (2014) Farina, E. P., Falomo, R., Scarpa, R., et al. 2014, arXiv:1403.5559
- Gallimore et al. (2006) Gallimore, J. F., Axon, D. J., O’Dea, C. P., Baum, S. A., & Pedlar, A. 2006, AJ, 132, 546
- Gehrels (1986) Gehrels, N. 1986, ApJ, 303, 336
- Hao et al. (2005) Hao, L., Strauss, M. A., Tremonti, C. A., et al. 2005, AJ, 129, 1783
- Hennawi & Prochaska (2007) Hennawi, J. F., & Prochaska, J. X. 2007, ApJ, 655, 735
- Hennawi et al. (2006) Hennawi, J. F., Prochaska, J. X., Burles, S., et al. 2006, ApJ, 651, 61
- Heckman et al. (2000) Heckman, T. M., Lehnert, M. D., Strickland, D. K., & Armus, L. 2000, ApJS, 129, 493
- Hjelm & Lindblad (1996) Hjelm, M., & Lindblad, P. O. 1996, A&A, 305, 727
- Hopkins et al. (2012) Hopkins, P. F., Hernquist, L., Hayward, C. C., & Narayanan, D. 2012, MNRAS, 425, 1121
- Jacoby et al. (1984) Jacoby, G. H., Hunter, D. A., & Christian, C. A. 1984, ApJS, 56, 257
- Kacprzak & Churchill (2011) Kacprzak, G. G., & Churchill, C. W. 2011a, ApJ, 743, L34
- Kacprzak et al. (2011a) Kacprzak, G. G., Churchill, C. W., Barton, E. J., & Cooke, J. 2011a, ApJ, 733, 105
- Kacprzak et al. (2010a) Kacprzak, G. G., Churchill, C. W., Ceverino, D., Steidel, C. C., Klypin, A., & Murphy, M. T. 2010, ApJ, 711, 533
- Kacprzak et al. (2011b) Kacprzak, G. G., Churchill, C. W., Evans, J. L., Murphy, M. T., & Steidel, C. C. 2011b, MNRAS, 416, 3118
- Kacprzak et al. (2008) Kacprzak, G. G., Churchill, C. W., Steidel, C. C., & Murphy, M. T. 2008, AJ, 135, 922
- Kacprzak et al. (2012) Kacprzak, G. G., Churchill, C. W., & Nielsen, N. M. 2012, ApJ, 760, L7
- Kinney et al. (2000) Kinney, A. L., Schmitt, H. R., Clarke, C. J., et al. 2000, ApJ, 537, 152
- Martin (2005) Martin, C. L. 2005, ApJ, 621, 227
- Martin & Bouché (2009) Martin, C. L., & Bouché, N. 2009, ApJ, 703, 1394
- Martin et al. (2012) Martin, C. L., Shapley, A. E., Coil, A. L., et al. 2012, ApJ, 760, 127
- Ménard & Fukugita (2012) Ménard, B., & Fukugita, M. 2012, ApJ, 754, 116
- Müller-Sánchez et al. (2011) Müller-Sánchez, F., Prieto, M. A., Hicks, E. K. S., et al. 2011, ApJ, 739, 69
- Nielsen et al. (2013) Nielsen, N. M., Churchill, C. W., & Kacprzak, G. G. 2013, ApJ, 776, 115
- Nestor et al. (2011) Nestor, D. B., Johnson, B. D., Wild, V., et al. 2011, MNRAS, 412, 1559
- Noterdaeme et al. (2010) Noterdaeme, P., Srianand, R., & Mohan, V. 2010, MNRAS, 403, 906
- Oke et al. (1995) Oke, J. B., et al. 1995, PASP, 107, 375
- Oppenheimer et al. (2010) Oppenheimer, B. D., Davé, R., Kereš, D., et al. 2010, MNRAS, 406, 2325
- Prochaska & Hennawi (2009) Prochaska, J. X., & Hennawi, J. F. 2009, ApJ, 690, 1558
- Prochaska et al. (2013) Prochaska, J. X., Hennawi, J. F., & Simcoe, R. A. 2013, ApJ, 762, L19
- Rubin et al. (2013) Rubin, K. H. R., Prochaska, J. X., Koo, D. C., et al. 2013, arXiv:1307.1476
- Rubin et al. (2010) Rubin, K. H. R., Prochaska, J. X., Koo, D. C., Phillips, A. C., & Weiner, B. J. 2010, ApJ, 712, 574
- Rupke et al. (2005a) Rupke, D. S., Veilleux, S., & Sanders, D. B. 2005a, ApJS, 160, 87
- Rupke et al. (2005b) Rupke, D. S., Veilleux, S., & Sanders, D. B. 2005b, ApJS, 160, 115
- Rupke et al. (2005) Rupke, D. S., Veilleux, S., & Sanders, D. B. 2005, ApJ, 632, 751
- Schneider et al. (1993) Schneider, D. P., et al. 1993, ApJS, 87, 45
- Simard et al. (2002) Simard, L., Willmer, C. N. A., Vogt, N. P., Sarajedini, V. L., Philips, A. C., Weiner, B. J., Koo, D. C., Im, M., Illingworth, G. D., & Faber, S. M. 2002, ApJS, 142, 1
- Steidel et al. (2010) Steidel, C. C., Erb, D. K., Shapley, A. E., Pettini, M., Reddy, N., Bogosavljević, M., Rudie, G. C., & Rakic, O. 2010, ApJ, 717, 289
- Steidel et al. (2004) Steidel, C. C., Shapley, A. E., Pettini, M., et al. 2004, ApJ, 604, 534
- Stetson (1987) Stetson, P. B. 1987, PASP, 99, 191
- Stetson (1999) Stetson, P. B. 1999, ”Users Manual for DAOPHOT II”
- Tremonti et al. (2007) Tremonti, C. A., Moustakas, J., & Diamond-Stanic, A. M. 2007, ApJl, 663, L77
- Tytler et al. (2009) Tytler, D., Gleed, M., Melis, C., et al. 2009, MNRAS, 392, 1539
- Urry & Padovani (1995) Urry, C. M., & Padovani, P. 1995, PASP, 107, 803
- Veilleux et al. (2001) Veilleux, S., Shopbell, P. L., & Miller, S. T. 2001, AJ, 121, 198
- Walter et al. (2002) Walter, F., Weiss, A., & Scoville, N. 2002, ApJ, 580, L21
- Weiner et al. (2009) Weiner, B. J., et al. 2009, ApJ, 692, 187
- Zibetti et al. (2007) Zibetti, S., Ménard, B., Nestor, D. B., Quider, A. M., Rao, S. M., & Turnshek, D. A. 2007, ApJ, 658, 161
Appendix A Additional Intrinsic and Foreground Absorbers
We document additional intrinsic and foreground Mgii doublet and Civ doublet absorption systems detected in our survey. For intrinsic quasar absorption line systems we list the detection limit for an unresolved line located at the redshift of the quasar.
| Name | [Å] | [Å] | [Å] | [Å] | |||
|---|---|---|---|---|---|---|---|
| 9754 | 0.57072 | ||||||
| 2004 | 1.05407 | 0.15 | 0.15 | 0.05 | 0.05 | ||
| 3273 | 1.57320 | ||||||
| 3991 | 1.07677 | 0.08 | 0.08 | ||||
| 5463 | 1.18228 | 0.260.02 | 0.190.02 | 1.1793724 | 0.240.01 | 0.130.01 | 1.1799584 |
| 6856 | 0.52960 | ||||||
| 0.580.04 | 0.560.04 | 0.2732928 | |||||
| 6863 | 0.24717 | 0.08 | 0.08 | ||||
| 1909 | 1.05373 | 0.14 | 0.14 | ||||
| 2713 | 1.35435 | 0.900.03 | 0.580.03 | 1.3550805 | |||
| 0.790.03 | 0.660.03 | 1.1954113 | |||||
| 3906 | 0.87571 | ||||||
| 4138 | 0.37035 | 0.08 | 0.08 | ||||
| 5901 | 0.87540 | ||||||
| 7839 | 1.30369 | 0.980.03 | 0.920.03 | 1.3140370 | |||
| 0.480.03 | 0.280.03 | 1.3035057 | |||||
| 7966 | 0.36189 |