Evolution of the central stars of young planetary nebulae
Abstract
Aims. The evolution of central stars of planetary nebulae was so far documented in just a few cases. However, spectra collected a few decades ago may provide a good reference for studying the evolution of central stars using the emission line fluxes of their nebulae. We investigated evolutionary changes of the [O iii] 5007 Å line flux in the spectra of planetary nebulae.
Methods. We compared nebular fluxes collected during a decade or longer. We used literature data and newly obtained spectra. A grid of Cloudy models was computed using existing evolutionary models, and the models were compared with the observations.
Results. An increase of the [O iii] 5007 Å line flux is frequently observed in young planetary nebulae hosting H-rich central stars. The increasing nebular excitation is the response to the increasing temperature and hardening radiation of the central stars. We did not observe any changes in the nebular fluxes in the planetary nebulae hosting late-type Wolf-Rayet (WR) central stars. This may indicate a slower temperature evolution (which may stem from a different evolutionary status) of late-[WR] stars.
Conclusions. In young planetary nebulae with H-rich central stars, the evolution can be followed using optical spectra collected during a decade or longer. The observed evolution of H-rich central stars is consistent with the predictions of the evolutionary models provided in the literature. Late-[WR] stars possibly follow a different evolutionary path.
Key Words.:
interstellar medium: planetary nebulae: general – stars: evolution – stars: AGB and post-AGB1 Introduction
Low- and intermediate-mass stars with initial masses of spend most of their life on the main sequence, steadily burning hydrogen in their centers. When hydrogen becomes exhausted in the center, the star leaves the main sequence and evolves to the red giant branch. Hydrogen is being burned in a shell around the helium core up to a moment when helium ignites in the core. After helium is exhausted in the center, the nuclear burning continues in the helium shell around the C/O degenerate core. The star ascends the asymptotic giant branch (AGB). In the last phase of the AGB evolution, helium flashes punctuate the periods of quiescent hydrogen shell burning. The stellar envelope is extended and loosely bound. The mass-loss rivals the rate of nuclear burning. As a result, the star ejects almost the entire envelope.
During the post-AGB phase, the star rapidly heats up and ionizes the lost mass, which forms a planetary nebula (PN). The stellar temperature increase from 10 kK to 100 kK within – yr. The pace of the evolution depends critically on the final mass of the star (Blöcker, 1995). As the star heats up, the ionization fronts of , , and penetrate the ejected envelope, and the excitation level of the PN increases. The star terminates its evolution as a white dwarf.
Observers rarely search for temporal variations in spectra of PNe. However, a change of the nebular fluxes was observed in the optical, radio, or ultraviolet in a few cases and was explained by the temperature evolution of their central stars.
Feibelman et al. (1992) summarized earlier works on the variability of the spectra of PNe IC 4997 and NGC 6572 and presented their the spectra taken with the International Ultraviolet Explorer (IUE) and in the optical. They interpreted their observations in terms of the increasing stellar temperatures.
Heap (1993) reported the decline of the central star of NGC 2392 in the IUE spectra. Heap & Altner (1993) reported evolutionary fading seen in the IUE observations of other O-type central stars.
Kondratyeva (2005) spectrally monitored of six PNe for a few decades. She reported significant changes in two low-excitation objects (M 1-11 and M 1-6).
Zijlstra et al. (2008) reported the radio flux evolution of the NGC 7027, a secondary flux calibrator. The flux evolution was modeled with the nebular expansion and decrease of the ionizing photons, consistent with the evolutionary models.
The flux evolution is clearly observed in the central stars of PNe that experience a very late thermal pulse: V4334 Sgr and V605 Aql (van Hoof et al., 2008).
Recently, Hajduk et al. (2014) observed a significant flux change in the spectra of the low-excitation PN Hen 2-260 that hosts an O-type central star. The comparison of the data obtained during 11 years indicated a 50% increase of the [O iii] 5007 Å line flux and an increase of other high-ionization lines. We interpreted our finding in terms of the expansion of the ionization front as a response to the evolution of the central star. The derived heating rate of the central star and the age of the nebula were consistent with the post-AGB evolutionary tracks by Blöcker (1995).
In this paper we compare the [O iii] 5007 Å line fluxes of PNe collected in different years and search for the evolutionary changes. We use the fluxes published in the literature (Table 1). We also observed a sample of PNe and added them to our analysis (Table 2). The observed evolution of the [O iii] 5007 Å line fluxes is compared with the evolution modeled using the evolutionary models and a photoionization code. We also split the sample into different groups whose central stars showed different surface abundances to constrain their evolutionary status.
2 Data
We used optical spectra available in the literature. The data set is not uniform. The spectra were obtained using various telescopes and spectrograph configurations. The year(s) of observations, apertures used, and the spectral resolution for different data sets are shown in Table 1.
Very many objects were observed in these surveys. We selected a sample of about 50 objects that were observed by at least two different groups. We excluded most of the objects observed by Kaler et al. (1996), because their observation dates were not precisely specified. We also excluded fluxes from Kingsburgh & Barlow (1994) from our analysis, because they were averaged from spectra taken in different years and using different slit widths.
Kaler et al. (1996) and Exter et al. (2004) used circular apertures. Most of spectra published by Kingsburgh & Barlow (1994), Kwitter et al. (2003), and Henry et al. (2010) were obtained at the position angle (PA) of 90 degree. Wesson et al. (2005) observed most of the objects at a PA of 0 degree.
| authors | period | aper. [”] | resol. [Å] | |
|---|---|---|---|---|
| Kingsburgh & Barlow (1994) | 1978-89 | 1.60 | ||
| Kaler et al. (1996) | 1981-1986 | 8 | 10 | |
| Acker et al. (1992) | 1983-89 | 4x4, 4x7 | 10 | |
| Exter et al. (2004) | 1992 | 6.4 | ||
| Cuisinier et al. (1996) | 1992-93 | 1.5x3.4 | 4 | 0.73 |
| Kwitter et al. (2003) | 1996-97,1999 | 5 | 8.6 | |
| Escudero et al. (2004) | 2001-02 | 2 | ||
| Górny et al. (2009) | 2001-02 | 4 | ||
| Wesson et al. (2005) | 2001 | 1 | 4 | |
| Henry et al. (2010) | 2007 | 2 | 7 | 0.95 |
| García-Rojas et al. (2012) | 2009-2010 | 1 | 0.14-0.17 | 1.12 |
We supplemented the literature data with our observations of 20 PNe (Table 2). Low-resolution spectroscopy was performed with the 1.9m Radcliffe and SALT telescope at the South African Astronomical Observatory (SAAO) and the 0.9m Schmidt-Cassegrain telescope at the Toruń observatory. The Radcliffe 1.9m telescope low-resolution spectra were obtained using the 300 l/mm grating. The SALT spectra were taken using the 900 l/mm grating. We used the 300 l/mm grating on the 0.9m Toruń telescope.
The SALT spectrum obtained on 2012 May 7, all the Toruń spectra, and the Radcliffe spectra taken on 2013 July 21 were obtained in photometric conditions. All the remaining data were taken in nonphotometric conditions.
The PA was set to 0 degree in all the instruments. All the spectra were flux calibrated using the observations of standard stars shown in Table 2. Standard stars were observed with the same slit width as the targets at airmassess that exceeded 1.25 only in one case.
3 Results, observational uncertainties, and biases


| name | date | wav. range [Å] | resolution [Å] | telescope | exp time [s] | slit [”] | airmass | standard stars |
|---|---|---|---|---|---|---|---|---|
| Sp 4-1 | 2009-05-13 | 3200-7300 | 10 | Toruń | 1800 | 4 | 1.16 | Vega, |
| M 1-73 | 2009-05-14 | 3200-7300 | 10 | Toruń | 1200 | 4 | 1.65 | |
| Cn 3-1 | 2009-05-17 | 3200-7300 | 10 | Toruń | 600 | 4 | 1.20 | HR 7040 |
| Hen 2-260 | 2012-05-07 | 4300-7400 | 4 | SALT | 900 | 1 | 1.24 | G 93-48 |
| H 2-25 | 2012-08-21 | 4300-7400 | 4 | SALT | 1200 | 1 | 1.28 | G 93-48 |
| H 2-25 | 2013-07-21 | 3500-7500 | 6 | Radcliffe | 2 | 1.07 | EG 21 | |
| Hen 2-140 | 2013-07-21 | 3500-7500 | 6 | Radcliffe | 2 | 1.22 | EG 21 | |
| Hen 2-142 | 2013-07-21 | 3500-7500 | 6 | Radcliffe | 2 | 1.35 | EG 21 | |
| SwSt 1 | 2013-07-21 | 3500-7500 | 6 | Radcliffe | 2 | 1.18 | EG 21 | |
| M 1-26 | 2013-07-21 | 3500-7500 | 6 | Radcliffe | 1200 | 2 | 1.53 | EG 21 |
| Hen 2-78 | 2013-07-22 | 3500-7500 | 6 | Radcliffe | 2 | 1.48 | EG 274 | |
| H 2-48 | 2013-07-22 | 3500-7500 | 6 | Radcliffe | 120 | 2 | 1.04 | EG 274 |
| Hu 2-1 | 2013-09-06 | 3400-7700 | 13 | Toruń | 4 | 1.25 | Vega | |
| BD | 2013-09-06 | 3400-7700 | 13 | Toruń | 4 | 1.24 | Vega | |
| NGC 6833 | 2013-09-06 | 3400-7700 | 13 | Toruń | 4 | 1.18 | Vega | |
| IC 5117 | 2013-09-06 | 3400-7700 | 13 | Toruń | 4 | 1.11 | Vega | |
| Hb 12 | 2013-09-06 | 3400-7700 | 13 | Toruń | 4 | 1.04 | Vega | |
| Cn 3-1 | 2013-09-07 | 3400-7700 | 13 | Toruń | 4 | 1.37 | Vega | |
| IC 4997 | 2013-09-07 | 3400-7700 | 13 | Toruń | 4 | 1.27 | Vega | |
| M 1-11 | 2013-11-09 | 4300-7400 | 7 | SALT | 2 | 1.22 | HILT 600 | |
| M 1-12 | 2013-12-26 | 4300-7400 | 7 | SALT | 2 | 1.20 | EG 21 |
| name | diam [arcsec] | flux | slit [”] | flux | slit [”] | flux | slit [”] | notes | |||
| H-rich central stars | |||||||||||
| H 2-25 | 4.4[1]3.55[3] | 2013-07-21 | 84.8 | 2 | 2012-08-21 | 95.3 | 1.5 | 2001-05-20 | 75.5 | 2 | sys? |
| 1984-04-30 | 58 | 4x4 | |||||||||
| H 2-48 | 2[1] | 2013-07-22 | 145 | 2 | 2002-06-10 | 113 | 2 | 1985-07-31 | 63 | 4x4 | |
| Hb 12 | 1[1]10.12[3] | 2013-09-06 | 512 | 4 | 1996/1999 | 515 | 5 | 1986-07-29 | 468.1 | 4x4 | B[e]? WN7? |
| Hen 2-140 | 2.6[1],4.1[2] | 2013-07-21 | 53 | 2 | 1984-04-27 | 44 | 4x4 | ||||
| Hen 2-78 | 3[1] | 2013-07-22 | 40 | 2 | 1984-04-29 | 36 | 4x4 | ||||
| Hen 2-260 | [1]1.93[3] | 2012-05-29 | 7.9 | 1 | 2012-05-07 | 7.8 | 1.5 | 2001-07-12 | 5.1 | 2 | O |
| Hu 2-1 | 2.6[1]10.34[3] | 2013-09-06 | 439 | 4 | 2001-08 | 428.8 | 1 | 1986-08-01 | 468 | 4x4 | |
| M 1-11 | 0[1]5.2x5.1[2]2.07[3] | 2013-11-09 | 20.6 | 2 | 2007-02 | 18 | 2 | 1992/1993 | 11.1 | 1.5x3.4 | emission line |
| 1986-01-18 | 10 | 4x4 | 1986-01-09 | 7.9 | 8 | ||||||
| M 1-12 | 0[1]4.35[3] | 2013-12-26 | 28.3 | 2 | 2007-02 | 25 | 2 | 1992/1993 | 20.6 | 1.5x3.4 | emission line |
| 1986-01-18 | 15 | 4x4 | 1978-10-10 | 13 | 1 | ||||||
| M 1-26 | 4.2[1],6.4x6[2]5.13[3] | 2013-07-21 | 111 | 2 | 1984-04-30 | 55 | 4x4 | B[e]? Of(H) | |||
| NGC 6833 | 2[1]0.82[3] | 2013-09-06 | 674 | 4 | 1986-07-29 | 730 | 4x4 | Of | |||
| Cn 3-1 | 4.5[1]5.7x4.6[2] | 2009-05-17 | 22.5 | 4 | 2001-08 | 21.41 | 1 | 1988-06-16 | 22 | 4x7.7 | wels |
| IC 4997 | 1.6[1]7.2[3] | 2013-09-07 | 703 | 4 | 1986-07-12 | 437.0 | 4x4 | wels | |||
| M 1-30 | [1] | 2010-06-06 | 183 | 1 | 1986-07-12 | 153 | 4x4 | wels | |||
| WR central stars | |||||||||||
| BD | 7.5[1] | 2013-09-06 | 7.61 | 4 | 1988-06-18 | 9 | 4x7.7 | [WC9] | |||
| Hen 2-142 | 3.6[1],4.2x3.1[2] | 2013-07-21 | 7.3 | 2 | 1983-05-03 | 7 | 4x4 | 1978-04-26 | 15 | 1.8 | [WC9] |
| M 1-32 | 7.6[1]9.1x8.0[2] | 2010-06-06 | 526 | 1 | 1986-07-29 | 398 | 4x4 | [WC4]pec | |||
| M 1-51 | 9.5[1] | 2004-08 | 840 | 5 | 1985-07-27 | 533 | 4x4 | [WO4]pec | |||
| M 1-6 | [1],5.76[3] | 2007-02 | 130 | 2 | 1986-01-18 | 122 | 4x4 | [WC10-11]? | |||
| SwSt 1 | [1],5.6x5.2[2] | 2013-07-21 | 24.3 | 2 | 1986-07-13 | 35 | 4x4 | [WC9]pec | |||
We analyzed the evolution of the [O iii] 5007 Å/ and [N ii] 6584 Å/ line flux ratios in PNe. The observed [O iii] 5007 Å/ line flux ratio is sensitive to the temperature of the central star and can be used to trace its evolution. As the stellar temperature increases, the excitation of the nebula and the [O iii] 5007 Å/ line flux ratio increase.
The [N ii] 6584 Å/ flux ratio is less sensitive to the central star temperature evolution than the [O iii] 5007 Å/ ratio since the ionization potentials of and H are nearly equal (13.6 eV and 14.5 eV, compared with 35.1 eV for ).
We determined the change of the [O iii] 5007 Å/ line flux ratio between observations taken at two different times in percent per year in Figure 1 and the change of the [N ii] 6584 Å/ flux ratio in Figure 2.
We did not correct the observed line fluxes for interstellar extinction. The extinction for the PNe listed in Table 2 range from for Sp 4-1 to 2 for H 2-25 and Hen 2-140, with an average value of about 1 for our sample. The extinction correction would not affect the flux increase and only slightly affects the flux ratios (e.g., by 20% for ) because the pairs of lines are close to each other in wavelengths.
We used flux uncertainties given by the authors. The error bars in Figure 1 and 2 correspond to the uncertainties. The flux uncertainties were estimated using different methods by different authors.
To verify the reliability of the error determinations, we inspected the mutual agreement of the flux uncertainties between Acker et al. (1992) and four other groups. For this purpose, we selected a sample of compact and high-excitation PNe in common for Acker et al. (1992) and other authors. This minimizes the chance of the systematic errors due to measuring different regions of a PN or the evolutionary change of the nebular fluxes.
We compared the line fluxes between Acker et al. (1992) and these authors. The median values are given in the Table 1. values close to 1 confirm the reliability of the error determinations. However, deviations stronger than expected occur for some PNe for lines at the blue and red end of the wavelength range.
We adopted a 5% uncertainty (or the last significant digit of the flux value, if larger) for the fluxes published without errors. This is a typical calibration uncertainty for spectroscopic observations and may be applied for strong lines (in particular [O iii] 5007 Å, [N ii] 6584 Å and hydrogen lines used by us), for which other sources of errors are less important.
We assumed an error of 5% for the fluxes of strong lines in the A quality spectra published by Cuisinier et al. (1996) instead of 1% adopted by the authors. The 1% uncertainty did not take the calibration uncertainties into account
A comparison of the line flux ratios obtained at different times requires caution. For spatially resolved PNe, the flux line ratios may depend on the diameter and the surface brightness distribution of a PN, slit width, seeing, pointing, and the details of the spectrum subtraction procedure.
The observed [N ii] 6584 Å/ flux ratio may depend on the projected aperture, because [N ii] 6584 Å emission might be suppressed in the dense regions and in the inner regions of PNe with hot central stars (because of the ionization of ). More narrow slits might result in a lower observed [N ii] 6584 Å/ flux ratio. However, this effect seems to be unimportant in our sample, because we do not observe a significant flux change in any of our PNe within the uncertainties (Figure 2).
The observed [O iii] 5007 Å/ line flux ratio can be higher when using more narrow slits. More narrow slits or apertures probe the inner (high-excitation) regions of spatially resolved PNe, which results in higher observed [O iii] 5007 Å/ flux ratios. This effect may be particularly important for young PNe that show strong ion stratification, for which the radii of the zones may be significantly smaller than the outer radii of the zones.
More recent surveys tend to use smaller slits or apertures than older surveys. Almost all of the observed PNe have less than 10 arcsec in diameter, but many of them were resolved by the ground-based telescopes. Narrower slits can result in deriving higher [O iii] 5007 Å/ line flux ratios and can mimic an excitation increase of a PN.
We studied the influence of a finite slit width in PNe that showed a change of the observed [O iii] 5007 Å/ flux ratio. We used available Hubble Space Telescope (HST) images (Sahai et al., 2011) for this purpose. Most of the HST observations used the filter. Since we do not know the [O iii] 5007 Å line surface brightness distribution for our PNe (either because HST observations in the [O iii] 5007Å line filter were not performed, or the S/N ratio was very poor), we assumed all the [O iii] 5007Å line emission to originate from an unresolved region in the center of a PN. In this case, the finite slit width would affect the [O iii] 5007 Å/ flux ratio most.
We convolved the HST images with a Gaussian with the full width at half maximum (FWHM) equal to 2 arcsec to account for the seeing. The [O iii] 5007Å line brightness distribution convolved with the seeing produced a 2D Gaussian with the FWHM of 2 arcsec. Then we integrated the [O iii] 5007 Å and line flux along a slit of different diameters passing the nebula in the N-S orientation. The fluxes were normalized to unity so that the [O iii] 5007 Å/ flux ratio would be equal to 1 for an infinite aperture. The observed [O iii] 5007 Å/ flux ratio as a function of the slit width is shown in Figure 3 for different PNe.
For M 1-11 and M 1-12 a narrow slit would increase the [O iii] 5007 Å/ flux ratio by 15-20% compared with an infinite aperture under 2 arcsec seeing. The same ratio would be increased by 40% in M 1-26 and by 60% in H 2-25. Depending on the time span of the observations made with different slits, using different slits could easily mimic a significant increase of the excitation of the PN.
The resolution of the spectra can also affect the derived line fluxes. The [O iii] 5007 Å line may be blended with the [Fe iii] 5011 Å and He i 5015 Å lines in observations with resolutions of about 10 Å or lower.
Finally, the observed flux ratios may be affected by the differential atmospheric refraction, as some of the observations were made with the slit oriented in the east-west direction. However, we find this influence negligible for the [O iii] 5007 Å to line ratio: at an airmass of 2, the relative displacement would only be 0.12 arcsec for the respective wavelengths.
3.1 PNe with H-rich central stars
Only a few PNe have , corresponding to a stellar temperature of up to 40 kK. However, the evolution of the nebular flux is evident for most of them. We determined whether this might be the result of the different slit widths or apertures used individually for each object as each object has different diameter, surface distribution, and was observed with a different set of apertures.
PNe H 2-48 and Hen 2-260 are unresolved in ground-based observations (Table 3). An increase of the [O iii] 5007 Å flux is clearly observed in both cases and most likely reflects an increase of the temperature of the central stars.
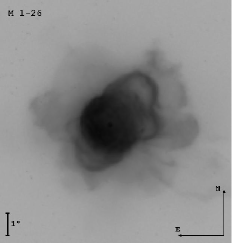
In M 1-26 the observed [O iii] 5007 Å to the line flux ratio has doubled between 1984 and 2013. The first observation used a 4 arcsec aperture, the second a 2 arcsec slit, while the PN has a diameter of about 10 arcsec in . However, the bright central region of a diameter of about 2.5 arcsec contributes most of the nebular flux to the line (Figure 4). A group of faint multipolar lobes and an extended halo have low surface brightness and contribute negligibly to both observations.
Using different slits might increase the observed [O iii] 5007 Å/ ratio by up to 18% between 1984 and 2013 (corresponding to the rate of ) under 2 arcsec seeing (Figure 3). The seeing during the 2013 observation was even worse than assumed (about 3 arcsec). Different slit widths cannot account for the the observed increase of the [O iii] 5007 Å/ ratio between 1984 and 2013.
We extracted our spectrum taken in 2013 using different apertures in the spatial axis. We obtained the [O iii] 5007Å/ ratio (normalized to ) of 111 using the 10 arcsec aperture and 130 using the aperture of 2 arcsec. This confirms that the [O iii] 5007Å emission originates from a smaller region than the emission.
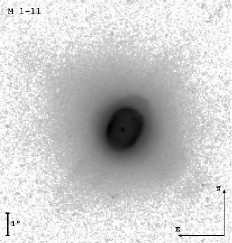
M 1-11 and M 1-12 were observed five times and show a gradually increasing [O iii] 5007 Å line flux in time (Figure 5).
The flux evolution in M 1-11 was previously reported by Kondratyeva (2005), although she did not report the flux evolution in M 1-12.
The compact PN M 1-11 emits most of the flux from the central 2 arcsec (Figure 4). For a 2 arcsec seeing, a 2 arcsec slit would increase the observed [O iii] 5007Å/ ratio by only up to 10% (Figure 3), corresponding to an increase rate of the flux ratio lower than . This cannot account for the observed flux increase between 1986 and 2013.
We compared the [O iii] 5007Å/ ratio obtained from the 2013 SALT spectrum extracted using different apertures in the spatial axis, but we obtained similar results. This indicates that the PN was not spatially resolved in our observation; alternatively, the [O iii] 5007Å and line brightness distributions are similar. The seeing was about 2.5 arcsec during the observation.
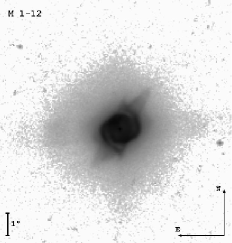
The HST image of M 1-12 shows a bright inner region of about 2 arcsec in diameter and a faint halo extending up to 4 arcsec in diameter, but contributing less than 10% of the total flux of the PN (Figure 4).
A 2 arcsec slit for 2 arcsec seeing would increase the observed [O iii] 5007 Å/ line flux ratio by only up to 10%, corresponding to an increase rate lower than . This cannot account for the changes observed between 1986 and 2013.
The oldest observation was made in 1978 by Kingsburgh & Barlow (1994). It used the most narrow slit of all the spectra obtained for M 1-12 and shows the lowest [O iii] 5007 Å/ ratio. This is opposite to what would be expected if there had been no change of the [O iii] 5007 Å/ ratio in the PN since 1978.
The [O iii] 5007Å/ line flux ratio was not sensitive to the width of the aperture used for the extraction of the SALT spectrum taken in 2013.

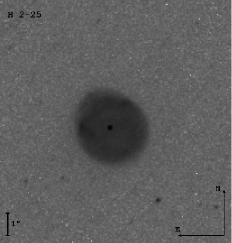

H 2-25 showed an increase of the [O iii] 5007 Å/ line flux ratio by almost 100% between 1984 and 2013. The nebula has almost spherical appearance with a uniform brightness distribution in the HST image (Figure 4). The [O iii] 5007 Å line image is also available, but the extended emission was too faint to be detected.
The analysis of the HST image implies that a 2 arcsec slit would increase the observed [O iii] 5007 Å/ flux ratio by up to 26% (corresponding to an increase rate of ) compared with the average flux for 2 arcsec seeing. This accounts for a quarter of the change observed between 1984 and 2013. Most of the [O iii] 5007 Å line flux increase appears to be physical.
The SALT spectrum confirms, that the [O iii] 5007 Å emission is more compact than the emission in H 2-25. We obtained a 105.0 [O iii] 5007 Å line flux integrated over 10 arcsec aperture compared with 84.8 using a narrower aperture of 0.5 arcsec in the spatial axis. The FWHM of the stellar profile was 1.7 arcsec, 2.9 arcsec for the hydrogen lines and 2.2 for the [O iii] and He i lines.
Hen 2-140 and Hen 2-78 are large enough to be spatially resolved by ground-based instruments. The weak observed [O iii] 5007 Å line flux increase can easily be explained by the different apertures used, since more recent observations used smaller slit widths which probed the inner regions of the PNe.
3.2 PNe with weak emission line central stars
IC 4997 shows a set of extended, low surface brightness multipolar lobes that surround a bright, compact center that is saturated in the HST image. The observed increase in the [O iii] 5007 Å/ line flux ratio is most likely physical although different slits or aperture sizes were used. The spectrum evolution was also confirmed by Kostyakova & Arkhipova (2009), who monitored the object for forty years. The heating rate appears to be relatively high in this star.
Cn 3-1 was observed using different slit widths and apertures and always showed a similar flux, thus there is no indication for a flux change in this object.
M 1-30 shows an increase of the [O iii] 5007 Å/ line flux ratio in time. However, it was observed with a 4x4 arcsec aperture and then using a 1 arcsec slit. The PN might be spatially resolved in the latter observation, thus the observed flux increase requires further confirmation.
3.3 WR-type central stars
None of the PNe containing late-type Wolf-Rayet (WR) stars showed an increase of the [O iii] 5007 Å/ line flux ratio. Instead, SwSt 1 showed a decreasing [O iii] 5007 Å flux between our observation and the spectrum taken in 1986 by Acker et al. (1992).
There are more spectra of this well-studied object published in the literature. The temporal evolution of the [O iii] 5007 Å line flux is shown in Figure 5. Flower et al. (1984) reported the reddened [O iii] 5007 Å line flux of for their observation in 1976, the highest flux ever measured for this line in SwSt 1. We obtained an [O iii] 5007 Å line flux of , which is the lowest value reported so far.
We marginally resolved the He i 5015 Å line. The [O iii] 5007 Å / 4959 Å line flux ratio of 3.11 close to the theoretical ratio of 2.98 confirms that the deblending of the [O iii] 5007 Å and He i 5015 Å lines is reliable. The He i 5015 Å line only contributes about 10% to the [O iii] 5007 Å line flux. The observed decrease of the [O iii] 5007 Å is real, although it may be slightly affected by blending with He i 5015 Å in some of the spectra (e.g., Acker et al. (1992)).
De Marco et al. (2001) studied historical spectroscopy of this object and did not report significant changes. However, their analysis was based on the qualitative analysis of the nebular iron and stellar emission lines.
We did not detect a significant decrease of the [O iii] 5007 Å line flux in .
Another PN containing a WR-type central star is M 1-32. It shows an increase of the [O iii] 5007 Å / line flux ratio in time. However, the aperture used in the latter observation was only 1 arcsec, and the PN might be spatially resolved, so this case requires confirmation.
M 1-51 is a PN containing an intermediate-type [WR] star. Both observations used similar apertures, so the observed flux increase is most likely physical. M 1-51 has a relatively strong [O iii] 5007 Å line, and the observations may suggest a relatively fast heating rate for this object.
3.4 Modeling
We modeled the evolution of the [O iii] 5007 Å/ line flux ratio in PNe with time using the post-AGB evolutionary tracks and exploratory Cloudy c10.01 models (Ferland et al., 1998). We chosen the evolutionary tracks for the final masses of 0.605, 0.625 and 0.696 computed by Blöcker (1995). We ran a set of photoionization models for each track. Luminosity and temperature changed with age according to the evolutionary models. The temperatures and luminosities of the central star were interpolated (in the log scale) to achieve better coverage in time.
The photoionization models assumed spherical symmetry. The inner radius was assumed to expand at a constant velocity of . The nebular density (constant across the nebular shell) decreased with the cube of time. Inner radius and nebular density were set to and in log for the of 30,000 K. We used an electron density of as a stopping criterion. The nebular abundances were taken from Aller & Czyzak (1983) and Khromov (1989).
We computed the increase of the [O iii] 5007 Å line flux per year for the model pairs. The observed evolution of the [O iii] 5007 Å line flux in PNe is plotted along with the model computed for different final masses in Figure 1. The stellar temperatures are marked along the tracks.
TLUSTY model atmospheres were used for the stellar radiation of the H-rich central stars (Hubeny & Lanz, 1995). The evolution of the He-burning models along the horizontal part of the Herzsprung-Russell diagram is approximately three times slower than the H-burning models computed by Blöcker (1995).
4 Summary
We studied the evolution of the central stars of PNe through the variability of nebular fluxes. All PNe hosting H-rich central stars with a flux ratio show an increase of the [O iii] 5007 Å / line flux ratio. Only in two cases (Hen 2-140 and Hen 2-76) this requires further verification. In the six remaining cases (Hen 2-260, M 1-11, M 1-12, M 1-26 H 2-48 and H 2-25) the flux increase is physical at least in part. The pace of the evolution is consistent with evolutionary models for the central star masses in the range of . Accurate mass determinations for central stars will require individual modeling.
None of the PNe hosting late-type [WR] stars shows an increase of the [O iii] 5007 Å line flux. H-deficient late-type [WR] stars may form a distinct evolutionary channel (De Marco, 2008) and their evolution may be much slower than the evolution of early-type [WR] stars. Perhaps late-type [WR] stars originate from central stars with lower masses than the earlier-type [WR] stars (Górny et al., 2009). An alternative scenario would be binary evolution. Slow evolution is in accordance with a relative high number of the late-type [WR] stars compared to intermediate and early-type [WR] stars (De Marco, 2008).
Quite unexpectedly, we detected the decrease of the [O iii] 5007 Å line flux in SwSt 1, which hosts a late-type [WR] star. A decrease in intensity of the C iv 5470Å line was reported by De Marco et al. (2001). This suggests an evolutionary change of the stellar wind properties (Schmutz et al., 1989).
The recombination time-scale of appears to be of about 35 years or shorter, if there is a constant contribution to the [O iii] 5007 Å line flux from other parts of the PN. This implies a lower limit of the electron density of (Lechner & Kimeswenger, 2004). The weakening stellar wind indicates an evolution of the star to higher temperatures. The [O iii] emission might originate from the regions ionized by the stellar wind, which now is weakening.
One of the intermediate-type [WR] stars shows a rapid evolution of the [O iii] 5007 Å line flux. The [O iii] 5007 Å flux increase observed in another [WR] star requires further verification.
Weak emission line central stars () form a distinct evolutionary path (Gesicki et al., 2006). This group of stars is not uniform and may contain both H- and He-burning central stars. The PN IC 4997, hosting a central star, rapidly evolves in time. Cn 3-1 does not show any significant changes although it contains a much cooler central star than IC 4997. The flux increase in M 1-30 requires confirmation.
Acknowledgements.
This work was financially supported by NCN of Poland through grants No. 2011/01/D/ST9/05966 and 719/N-SALT/2010/0. PvH acknowledges support from the Belgian Science Policy office through the ESA PRODEX program. This paper uses observations made at the South African Astronomical Observatory (SAAO). Some of the observations reported in this paper were obtained with the Southern African Large Telescope (SALT). We thank the referee for the comments on the paper.References
- Acker et al. (1992) Acker, A., Marcout, J., Ochsenbein, F., et al. 1992, The Strasbourg-ESO Catalogue of Galactic Planetary Nebulae. Parts I, II.
- Aller & Czyzak (1983) Aller, L. H. & Czyzak, S. J. 1983, ApJS, 51, 211
- Blöcker (1995) Blöcker, T. 1995, A&A, 299, 755
- Cuisinier et al. (1996) Cuisinier, F., Acker, A., & Koeppen, J. 1996, A&A, 307, 215
- De Marco (2008) De Marco, O. 2008, in Astronomical Society of the Pacific Conference Series, Vol. 391, Hydrogen-Deficient Stars, ed. A. Werner & T. Rauch, 209
- De Marco et al. (2001) De Marco, O., Crowther, P. A., Barlow, M. J., Clayton, G. C., & de Koter, A. 2001, MNRAS, 328, 527
- Escudero et al. (2004) Escudero, A. V., Costa, R. D. D., & Maciel, W. J. 2004, A&A, 414, 211
- Exter et al. (2004) Exter, K. M., Barlow, M. J., & Walton, N. A. 2004, MNRAS, 349, 1291
- Feibelman et al. (1992) Feibelman, W. A., Aller, L. H., & Hyung, S. 1992, PASP, 104, 339
- Ferland et al. (1998) Ferland, G. J., Korista, K. T., Verner, D. A., et al. 1998, PASP, 110, 761
- Flower et al. (1984) Flower, D. R., Goharji, A., & Cohen, M. 1984, MNRAS, 206, 293
- García-Rojas et al. (2012) García-Rojas, J., Peña, M., Morisset, C., Mesa-Delgado, A., & Ruiz, M. T. 2012, A&A, 538, A54
- Gesicki et al. (2006) Gesicki, K., Zijlstra, A. A., Acker, A., et al. 2006, A&A, 451, 925
- Górny et al. (2009) Górny, S. K., Chiappini, C., Stasińska, G., & Cuisinier, F. 2009, A&A, 500, 1089
- Hajduk et al. (2014) Hajduk, M., van Hoof, P. A. M., Gesicki, K., et al. 2014, ArXiv e-prints
- Heap (1993) Heap, S. R. 1993, in IAU Symposium, Vol. 155, Planetary Nebulae, ed. R. Weinberger & A. Acker, 484
- Heap & Altner (1993) Heap, S. R. & Altner, B. 1993, in Bulletin of the American Astronomical Society, Vol. 25, American Astronomical Society Meeting Abstracts, 1441
- Henry et al. (2010) Henry, R. B. C., Kwitter, K. B., Jaskot, A. E., et al. 2010, ApJ, 724, 748
- Hubeny & Lanz (1995) Hubeny, I. & Lanz, T. 1995, ApJ, 439, 875
- Kaler et al. (1996) Kaler, J. B., Kwitter, K. B., Shaw, R. A., & Browning, L. 1996, PASP, 108, 980
- Khromov (1989) Khromov, G. S. 1989, Space Sci. Rev., 51, 339
- Kingsburgh & Barlow (1994) Kingsburgh, R. L. & Barlow, M. J. 1994, MNRAS, 271, 257
- Kondratyeva (2005) Kondratyeva, L. N. 2005, Astronomical and Astrophysical Transactions, 24, 291
- Kostyakova & Arkhipova (2009) Kostyakova, E. B. & Arkhipova, V. P. 2009, Astronomy Reports, 53, 1155
- Kwitter et al. (2003) Kwitter, K. B., Henry, R. B. C., & Milingo, J. B. 2003, PASP, 115, 80
- Lechner & Kimeswenger (2004) Lechner, M. F. M. & Kimeswenger, S. 2004, A&A, 426, 145
- Sahai et al. (2011) Sahai, R., Morris, M. R., & Villar, G. G. 2011, AJ, 141, 134
- Schmutz et al. (1989) Schmutz, W., Hamann, W.-R., & Wessolowski, U. 1989, A&A, 210, 236
- Tylenda et al. (2003) Tylenda, R., Siódmiak, N., Górny, S. K., Corradi, R. L. M., & Schwarz, H. E. 2003, A&A, 405, 627
- van Hoof et al. (2008) van Hoof, P. A. M., Hajduk, M., Zijlstra, A. A., et al. 2008, in Astronomical Society of the Pacific Conference Series, Vol. 391, Hydrogen-Deficient Stars, ed. A. Werner & T. Rauch, 155
- Weidmann & Gamen (2011) Weidmann, W. A. & Gamen, R. 2011, A&A, 526, A6
- Wesson et al. (2005) Wesson, R., Liu, X.-W., & Barlow, M. J. 2005, MNRAS, 362, 424
- Zijlstra et al. (2008) Zijlstra, A. A., van Hoof, P. A. M., & Perley, R. A. 2008, ApJ, 681, 1296