Misclassified Type 1 AGNs in the Local Universe
1 Introduction
Large-area surveys performed in various wavelengths, i.e., X-ray, optical, near-infrared, and mid-infrared, provide a large sample of active galactic nuclei (AGNs), enabling various statistical studies of actively mass accreting supermassive black holes. In particular, by providing the rest-frame optical and UV spectroscopic properties of more than 100 000 AGNs over a large redshift range, the Sloan Digital Sky Survey (SDSS) has dramatically changed our understanding of AGN population (e.g., Abazajian et al., 2009), including the local black hole activity (see Heckman & Best, 2014), AGN luminosity and Eddington ratio functions from low- to high-redshift (e.g., Kelly & Shen, 2013), and the connection of black hole activity to star formation (e.g., Netzer, 2009).
However, all surveys have their selection functions, hence, it is challenging to avoid selection biases in providing a complete sample of AGNs. In the case of the SDSS, the color-color diagram based on the imaging survey has been used for selecting potential AGN candidates as spectroscopic follow-up targets. Thus, obscured AGNs, i.e., red AGNs (e.g., Glikman et al., 2007, 2013) and X-ray-bright-optically-normal AGNs (e.g., Hornschemeier et al., 2005), can be easily missed from the survey.
In the optical spectroscopic studies, type 1 and type 2 AGNs are often classified based on the presence or absence of broad-emission lines, which are usually defined having a FWHM larger than 1000 km s-1, as initially recognized among nearby Seyfert galaxies (e.g., Seyfert, 1943). However, if the broad component of the Balmer lines is relatively weak and/or the narrow component is dominant, then it is likely that type 1 AGNs can be misclassified as type 2 AGNs. In addition, if the AGN continuum is relatively weak compared to the stellar continuum, then these objects are likely to be classified as galaxies rather than AGNs in the color-color diagram.
A number of statistical studies have been performed using the SDSS galaxy catalogues, e.g., the MPA-JHU value-added catalog,111http://www.mpa-garching.mpg.de/SDSS/ and the KIAS value-added galaxy catalog (Choi et al., 2010), which contain the flux-limited local galaxy sample out to , to investigate the properties of type 2 AGN populations identified through the emission line flux ratios (Baldwin et al., 1981; Kewley et al., 2006). It has been noticed that some type 2 AGNs show a relatively broad component in the H line, while a broad component is often missing in the H line, presumably due to its weak flux compared to the stellar continuum, suggesting that at least some fraction of type 2 AGNs identified through their emission line ratios could be genuine type 1 AGNs. A systematic search for these misclassified type 1 AGNs is yet to be performed (see, e.g., Oh et al., 2011; Bae & Woo, 2014). These misclassified AGNs are interesting targets for further study since they are likely to be low luminosity AGNs since their AGN continuum is relatively weak. At the same time, their host galaxy properties can be easily studied while the mass of the central black hole can be estimated from the broad component of H using various single-epoch mass estimators (e.g., Woo & Urry, 2002; Park et al., 2012; Bentz et al., 2013).
In this paper, we search for misclassified type 1 AGNs using a large sample of local type 2 AGNs selected from SDSS DR7, by carefully examining the presence of the broad component of the H line. Based on the newly found type 1 AGNs, we investigate the properties of black hole activity and the kinematics of the ionized gas. Sample selection and the procedure for identifying type 1 AGNs are described in Sections 2 and 3, respectively. In Section 4, we present the properties of the newly found 142 type 1 AGNs and their gas properties. Discussion and conclusions are presented in Section 5. Throughout the paper, we used the cosmological constants of km s-1 Mpc-1, , and .
2 Sample Selection
To select type 2 AGNs in the local universe, we utilized the MPA-JHU catalog, which contains 927 552 galaxies from the SDSS DR 7 and their derived properties. We selected low-redshift galaxies (i.e., ) and excluded galaxies with low stellar velocity dispersion (i.e., below the SDSS instrumental resolution, 70 km s-1) in order to utilize the available stellar velocity dispersion measurements in comparing with the gas kinematics. Among these local galaxies, we selected emission-line objects with signal-to-noise ratio S/N 3 for H, H, O i, and O iii, which were used to classify AGNs in the emission line flux ratio diagram (Baldwin et al., 1981). By using the demarcation line for AGNs and star-forming galaxies, 0.73/[log O i/H +0.59 ] +1.33 log O iii/H or log O i/H (Kewley et al., 2006), we selected 4 113 objects as the type 2 AGN sample.
3 Analysis
3.1 Spectral Decomposition
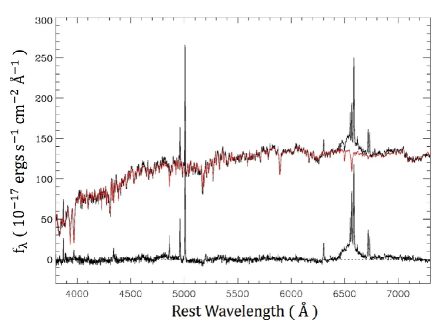
In studying type 2 AGNs, it is of importance to decompose AGN emission lines from the host galaxy stellar continuum in order to properly measure the flux and width of each AGN emission line. For relatively low luminosity AGNs, the line strength of stellar absorption lines is significantly large, hence the precise measurements of AGN emission line flux requires spectral decomposition of the stellar component, for example, using stellar population models or stellar spectral templates (e.g., Park et al., 2012). In addition, for measuring the kinematics of the ionized gas, it is necessary to measure the systemic velocity of the target galaxy based on the stellar absorption lines. In this study, we used the penalized pixel-fitting (pPXF) method (Cappellari & Emsellem, 2004) to obtain the best fit stellar continuum model, which is based on the 235 simple stellar population models (i.e., 5 different metallicities 47 different ages) from the MILES library. First, we de-redshifted all spectra using the redshift value from SDSS. After fitting with the stellar continuum model, we refined the redshift (hence, the systemic velocity) of each object before the emission line fitting procedure. Then, the best-fit continuum model was subtracted from the SDSS spectra, leaving the pure AGN emission-line spectra. This approach is similar to a number of previous studies on the AGN emission and stellar absorption lines (e.g., Woo et al., 2010; Park et al., 2012; Woo et al., 2013). We present an example of the spectral decomposition in Figure 1.
3.2 Emission Line Fitting
We examined the SDSS spectra and continuum-subtracted spectra of all 4,113 objects in the type 2 AGN sample, in order to determine whether a broad component is present in the H line. In this process, we identified a sample of potential type 1 AGN candidates showing the broad H component, based on the visual inspection. Then, we carefully examined the H region in the rest-frame 6300–6900Å, by decomposing the broad and narrow components of H, and N ii lines simultaneously. If the stellar continuum was poorly subtracted from the SDSS spectra due to the low S/N ratio, a straight line was adopted to represent the continuum.
Using the MPFIT routine (Markwardt, 2009), we modeled each narrow emission line in the H region, namely, H , N ii , doublet, and S ii , doublet with a single Gaussian component. In addition, we added a Gaussian component with a FWHM 1000 km s-1, to represent the broad component of H. The centers of each Gaussian components for narrow emission lines were fixed relative to each other at their laboratory separations, while the center of the broad H component was set to vary in the fitting process. In the case of the line width, we used the same line dispersion value for all narrow emission lines, but for the broad H component, we used a free parameter. The line flux ratio of [N ii] and [N ii] is fixed at the theoretical value of 2.96.
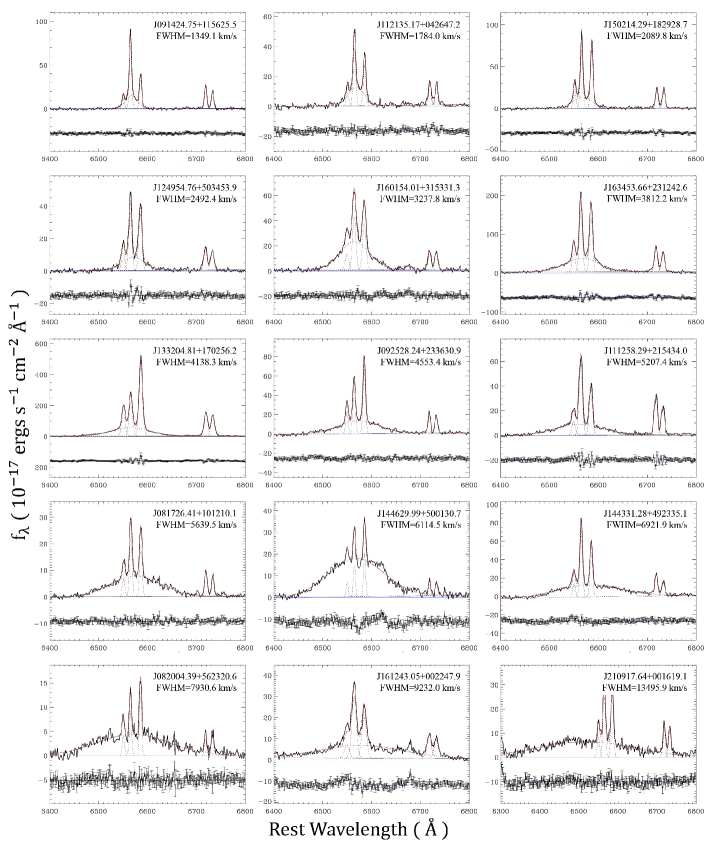
Note that a broad residual from the incorrect subtraction of stellar continuum or the combination of the narrow H and N ii line wings could be misinterpreted as a broad-line component. Thus, a careful examination is required to avoid false detection of a broad H component. For each object, we carefully examined and compared the raw spectrum and the best-fit model, and conservatively classified the target as type 1 AGNs only if the broad H component is clearly needed for the fit. In particular, when the broad H is relatively narrow (i.e., FWHM 2000 km s-1), hence we do not see the wing of the broad H blueward and redward of N ii in the continuum-subtracted spectra, we removed the target from the list of the type 1 AGN candidates although the best-fit model includes a broad H component. Thus, in our conservative classification it is possible that we may miss relatively narrow broad-line objects (e.g., narrow-line Seyfert 1 galaxies). In this process, we identified 142 AGNs, which clearly showed a broad H component. Figure 2 presents examples of the emission line fit in the H region for 15 AGNs in increasing magnitude of the FWHM of the broad H component.
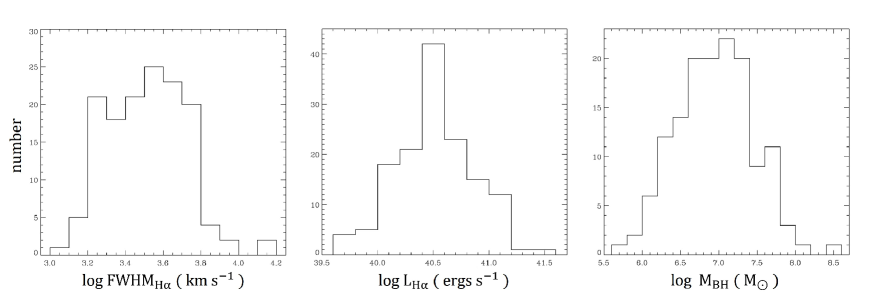
We measured the line flux and line dispersion of each narrow emission line and the broad H line from the best-fit model. We used the luminosity distance using the redshift information in the header of the fits file or the measured redshift from the stellar absorption lines. These two redshifts showed negligible difference in luminosity distance. Figure 3 presents the distributions of the widths and luminosities of the broad H component (see Section 4.1 for details).
We also fit the O iii line at 5007Å, to measure the velocity center and the velocity dispersion. Since the majority of the AGNs in the sample show a broad wing component in the O iii line profile, we used a double Gaussian model to fit the line profile. Then, we measured the flux centroid velocity and velocity dispersion of the best-fit double-Gaussian model.
3.3 Black Hole Mass and Eddington ratio
Dynamical black hole mass estimation based on the spatially resolved kinematics is limited to nearby galaxies due to the limited spatial resolution (Kormendy & Ho, 2013). For broad-line AGNs, black hole mass (MBH) can be measured with the reverberation mapping method based on the virial assumption of the gas in the broad-line region (BLR) (Blandford & McKee, 1982). Under the virial relation, black hole mass is expressed as M, where is the characteristic velocity scale of the broad-line gas, typically measured from the line dispersion of the Balmer lines, is the virial coefficient, which depends on the morphology, orientation, and the kinematics of the BLR, RBLR is the size of the BLR measured from the reverberation mapping campaign, and is the gravitational constant.
Adopting the BLR size – luminosity relation from the recent calibration by Bentz et al. (2013),
| (1) |
the virial relation can be written as follows:
| (2) | |||||
For the misclassified AGNs, we used the line width and luminosity of the broad H for estimating black hole masses. Adopting the calibration between the widths of H and H (i.e., FWHMHβ–FWHMHα relation), and the relation between the AGN continuum luminosity and the H line luminosity (i.e., relation) from Greene & Ho (2005),
| (3) |
we can derive MBH from our measurements based on the spectroscopic decomposition in the H region. With the line dispersion () and luminosity (LHα) of the broad component of H, the black hole mass can be estimated as follows:
| (4) | |||||
For the virial factor we adopted , which is based on the recent calibration using the combined sample of the quiescent galaxies and reverberation-mapped AGNs (Woo et al., 2013). Note that the systematic uncertainty of the virial factor is 0.31 dex (see Woo et al., 2010) and that black hole mass can easily vary by a factor of 2–3, depending on the virial factor calibration (see Park et al., 2012). Thus, the quoted black hole mass should be treated with caution. In Table 1, we provide the virial product, instead of the black hole mass, which can be determined by multiplying the virial product with the virial factor.
The Eddington luminosity of each object was calculated with the equation (erg s-1) (Wyithe & Loeb, 2002). We used the luminosity of the broad H line as a proxy for the AGN bolometric luminosity Utilizing the relation between the luminosity of broad H and the continuum luminosity at 5100Å (Greene & Ho, 2005), and the bolometric correction 9.26 for L5100 (Richards et al., 2006), we derived the bolometric luminosity as follows,
| (5) |
4 Results
4.1 Sample Properties
Out of the parent sample of 4 113 type 2 AGNs in the local universe (), we find a total of 142 misclassified type 1 AGNs based on the presence of the broad component of H (FWHM 1000 km s-1). The fraction of misclassified AGNs is 3.5% of the parent sample. 25 objects have been previously referenced in the literature (see Greene & Ho, 2004, 2007; Xiao et al., 2013; Reines et al., 2013), indicating a novel discovery of missing type 1 AGNs.
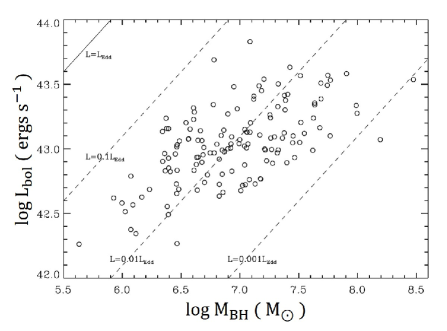
The distribution of the measured properties, i.e., the FWHM and luminosity of the broad H component, and black hole mass, are presented in Figure 3. The newly identified type 1 AGNs have a large range of the braod H FWHM velocities, ranging from 1700 to 19 090 km s-1. The mean line width of broad H is log FWHM. In the case of the luminosity, all candidates are relatively low-luminosity AGNs with H luminosity lower than 1042 erg s-1. The mean broad H luminosity is log L. The black hole mass of the sample ranges from 105.5 to 108.5 M⊙ with a mean log MBH/M⊙ = , while the mean Eddington ratio is log Lbol/LEdd) = . Compared to the local supermassive black hole population, the misclassified AGNs have a similar black hole mass range with a peak at 107 M⊙ (Heckman & Best, 2014), while the Eddington ratio of the sample is relatively lower than the one of high luminosity QSOs. Table 1 provides the list of 142 misclassified type 1 AGNs along with the measured physical parameters. Figure 4 presents the distribution of the misclassified type 1 AGNs in the plane. Overall, the distribution of the sample is similar to that of low luminosity type 1 AGNs (e.g., Woo & Urry, 2002).
4.2 Comparison with MPA-JHU
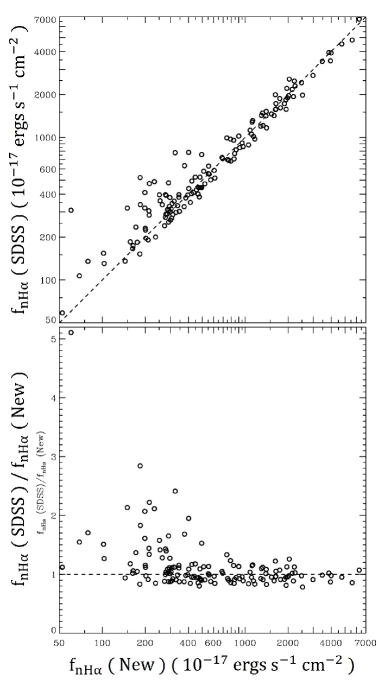
In this section, we compare our new measurements of the H line luminosity with that from the the MPA-JHU catalog as shown in Figure 5. Since the broad component of H was included in our analysis, we expect that our measurements of the narrow H line luminosity is reliable, while the MPA-JHU measurements are likely to be overestimated if the broad H is not considered in the fitting process.
We find a clear trend that the narrow H emission line flux measurements provided by the MPA-JHU catalog is larger than that of our measurement, particularly at the low luminosity regime. The overall overestimation of the narrow H line flux can be interpreted as the contribution of the broad H, since the narrow and broad components were not decomposed, although the line flux can vary depending on how the continuum around the H region was determined. The difference is less significant for AGNs with a strong narrow H line, presumably due to the weaker contribution of the broad H component. These results demonstrate that the line flux measurements of the narrow H can be significantly uncertain when a broad component is present and that decomposing and subtracting a broad H component from narrow lines (i.e., H and N ii) is necessary for misclassified type 1 AGNs.
4.3 Velocity offset of the emission lines
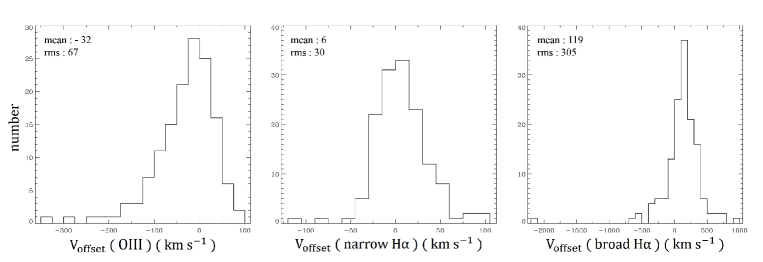
We investigate the kinematic properties of the ionized gas, by calculating the velocity offset of the [O iii] and the H lines with respect to the systematic velocity, which is measured from stellar absorption lines. In the case of H, we use the narrow and broad components separately, since the physical scale of these two components is clearly different. In Figure 6, we present the distribution of the velocity offset for each line. For the O iii line, we used the flux centroid of the line profile as the velocity of the line if a double Gaussian model was used for the fit. The O iii line shows large velocity offsets ranging from to 100 km s-1, with a mean km s-1 and rms 67 km s-1. In addition, the distribution of the [O iii] velocity offset is asymmetric, indicating that more than a half of the objects has blueshifted [O iii] with relatively large velocities. The detected velocity offset with respect to the systemic velocity can be interpreted as due to outflows in the narrow-line region, as various previous studies have used the O iii velocity offset as an outflow indicator (e.g., Boroson, 2005; Komossa et al., 2008; Crenshaw et al., 2010; Bae & Woo, 2014).
In the case of the narrow H component, most galaxies show relatively small velocity offsets with a mean 6 km s-1 and rms 30 km s-1. Given the uncertainty of the emission line velocity, which is close to 10–20 km s-1 as measured from simulated mock spectra based on the SDSS spectra by Bae & Woo (2014), only a small fraction of the sample seems to show a significant H velocity offset. These results of O iii and H velocity offsets are consistent with previous studies of type 2 AGNs (Komossa et al., 2008; Bae & Woo, 2014).
In contrast, we detected large velocity offsets in the broad component ofH, with a mean velocity 119 km s-1 and with a rms of 305 km s-1, which is much larger than that of narrow emission lines (H and O iii). The nature of the velocity offset of the broad line is not clear without spatially resolved measurements. We speculate that it may be due to the orbital motion of the black hole and accompanied BLR gas or the inflow/outflow motion of the gas in the BLR. More detailed studies are required to identify the nature of the velocity offset of broad emission lines.
4.4 Kinematics of the ionized gas
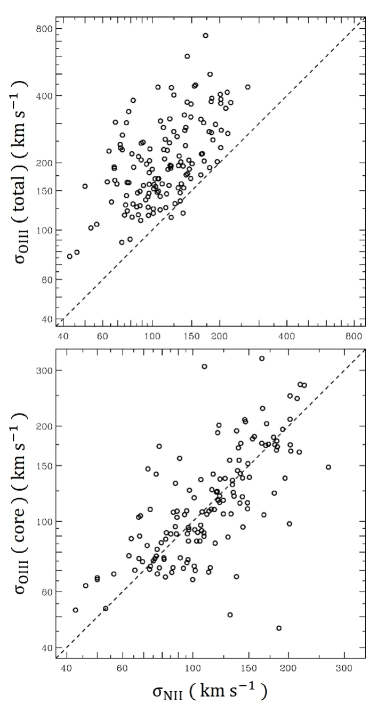
In Figure 7 we present the velocity dispersion of the ionized gas. For O iii we calculated the second moment of the total line profile as the velocity dispersion when we used a double Gaussian model for the fit. In the case of N ii and S ii, we used the line dispersion of the best-fit Gaussian model. Since we used the same Gaussian model for N ii and S ii, we only present the velocity dispersion of N ii.
Compared to the N ii lines, the velocity dispersion of O iii is much larger, by a factor 1.8 in average. The larger O iii velocity dispersion is expected from the presence of a wing component in the line profile. However, once we remove the wing component and measure the velocity dispersion from the narrower core component from the best-fit double Gaussian models (bottom panel in Figure 7), the velocity dispersions of N ii and O iii become consistent albeit with significant scatter (30%). The mean difference of the velocity dispersion between N ii and the O iii core component is only 1%, confirming that the core component of O iii and low-ionization lines (i.e., N ii and S ii) have similar kinematics, presumably governed by the gravitational potential of the galaxy bulge (see also Komossa et al., 2008).
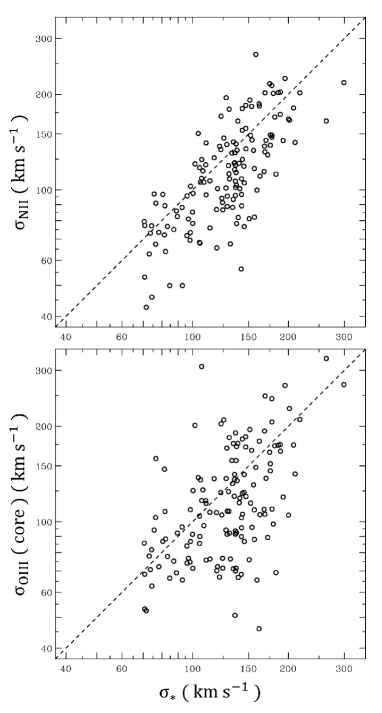
In Figure 8 we directly compare the velocity dispersion of N ii and the core component of O iii with stellar velocity dispersion. The velocity dispersion of N ii is on average smaller than the stellar velocity dispersion by 14%, while the scatter is 29%. In the case of the core component of O iii (bottom panel in Figure 8), the velocity dispersion is also smaller than the stellar velocity dispersion by 13%, however the scatter is considerably larger (43%). These results suggest that the velocity dispersions of narrow emission lines are on average consistent with stellar velocity dispersions, confirming the results of previous studies (e.g., Nelson & Whittle, 1995). Thus, the width of N ii (or O iii core component) may be used as a proxy for stellar velocity dispersion. However, if the velocity dispersions of the narrow-emission lines are used instead of the directly measured stellar velocity dispersions, significantly larger uncertainty would be introduced due to the large scatter shown in Figure 8.
The large scatter between emission and absorption lines can be attributed to the contribution from outflow or inflow motion of the gas in the NLR, which seems to preferentially affect the O iii-emitting gas. In addition, we note that the measured stellar velocity dispersion from the SDSS spectra, which were extracted with a aperture, can suffer from rotational broadening in the stellar absorption lines, depending on the orientation of the stellar disk and the relative strength of the rotation and random velocities as demonstrated by the spatially resolved measurements (Kang et al., 2013; Woo et al., 2013) and the simulated results with various line-of-sight measurement (Bellovary et al., 2014). The larger stellar velocity dispersion relative to the velocity dispersion of N ii, by 0.06 dex (14%), may indicate an overestimate of the stellar velocity dispersion due to the rotation/inclination effect.
| AGN | FWHMHα | LHα | Lbol | L | |||
|---|---|---|---|---|---|---|---|
| (1) | (2) | (3) | (4) | (5) | (6) | (7) | (8) |
| J004730.33+154149.4 | 0.0315 | 3460 | 40.1 | 42.7 | 6.05 | 2.20 | 134 |
| J005847.49010549.6 | 0.0465 | 5090 | 40.6 | 43.1 | 6.59 | 2.37 | 128 |
| J010606.92+002025.1 | 0.0436 | 2880 | 40.1 | 42.7 | 5.87 | 2.05 | 73 |
| J013402.54094626.9 | 0.0408 | 4530 | 41.1 | 43.6 | 6.74 | 2.04 | 143 |
| J015612.53+145423.9 | 0.0269 | 1930 | 40.5 | 43.0 | 5.70 | 1.53 | 98 |
| J030834.31+003303.3 | 0.0308 | 3120 | 40.4 | 43.0 | 6.10 | 1.99 | 168 |
| J031142.21+000853.3 | 0.0370 | 12990 | 40.5 | 43.1 | 7.42 | 3.22 | 128 |
| J032525.35060837.9 | 0.0345 | 2400 | 41.4 | 43.8 | 6.31 | 1.35 | 145 |
| J033957.86061215.1 | 0.0498 | 4520 | 40.5 | 43.0 | 6.44 | 2.31 | 136 |
| J074507.25+460420.6 | 0.0313 | 6120 | 40.5 | 43.0 | 6.74 | 2.56 | 158 |
| J075151.88+494851.5 | 0.0244 | 2740 | 40.4 | 43.0 | 5.98 | 1.87 | 113 |
| J075217.05+254008.7 | 0.0454 | 2960 | 40.2 | 42.8 | 5.95 | 2.02 | 145 |
| J075643.72+445124.1 | 0.0498 | 3540 | 40.6 | 43.1 | 6.29 | 2.03 | 108 |
| J075828.11+374711.8 | 0.0408 | 2710 | 40.8 | 43.3 | 6.13 | 1.72 | 263 |
| J080421.30+100610.9 | 0.0342 | 3530 | 40.6 | 43.1 | 6.29 | 2.02 | 134 |
| J081726.41+101210.1 | 0.0457 | 5640 | 40.7 | 43.2 | 6.75 | 2.41 | 143 |
| J082004.39+562320.6 | 0.0444 | 7930 | 40.6 | 43.1 | 7.00 | 2.76 | 113 |
| J082351.90+421319.4 | 0.0376 | 1980 | 40.3 | 42.9 | 5.62 | 1.64 | 96 |
| J082414.31+171955.0 | 0.0372 | 2010 | 40.7 | 43.2 | 5.84 | 1.48 | 110 |
| J082620.81+055727.8 | 0.0448 | 3420 | 40.5 | 43.1 | 6.23 | 2.02 | 124 |
| J084137.87+545506.5 | 0.0446 | 3200 | 41.0 | 43.5 | 6.39 | 1.77 | 162 |
| J084143.50+013149.8 | 0.0499 | 3640 | 40.6 | 43.1 | 6.31 | 2.05 | 155 |
| J090554.48+471045.5 | 0.0272 | 2550 | 40.3 | 42.8 | 5.84 | 1.87 | 183 |
| J091330.33+565128.4 | 0.0410 | 2050 | 40.3 | 42.8 | 5.64 | 1.68 | 107 |
| J091424.75+115625.5 | 0.0312 | 1350 | 40.0 | 42.6 | 5.16 | 1.40 | 74 |
| J091708.26+292215.6 | 0.0353 | 3390 | 40.2 | 42.8 | 6.08 | 2.14 | 145 |
| J092313.31+565622.2 | 0.0494 | 2810 | 40.5 | 43.0 | 6.03 | 1.86 | 172 |
| J092528.24+233630.9 | 0.0330 | 4550 | 40.6 | 43.1 | 6.49 | 2.27 | 136 |
| J093106.75+490447.1 | 0.0339 | 1980 | 40.4 | 43.0 | 5.68 | 1.59 | 147 |
| J093551.60+612111.3 | 0.0393 | 2260 | 40.9 | 43.3 | 6.00 | 1.53 | 189 |
| J093917.25+363343.8 | 0.0197 | 4020 | 40.3 | 42.9 | 6.27 | 2.26 | 151 |
| J094319.15+361452.1 | 0.0221 | 2650 | 40.3 | 42.9 | 5.91 | 1.88 | 175 |
| J094830.01+553822.6 | 0.0452 | 2100 | 40.5 | 43.1 | 5.79 | 1.58 | 100 |
| J094931.37+343819.5 | 0.0388 | 2260 | 40.6 | 43.1 | 5.89 | 1.62 | 76 |
| J095009.35+333409.5 | 0.0271 | 5000 | 40.2 | 42.8 | 6.41 | 2.51 | 137 |
| J095437.22+063719.5 | 0.0410 | 6960 | 41.1 | 43.6 | 7.14 | 2.42 | 181 |
| J095742.84+403315.9 | 0.0452 | 1820 | 40.3 | 42.9 | 5.57 | 1.54 | 105 |
| J095824.97+103402.4 | 0.0417 | 4850 | 40.1 | 42.7 | 6.36 | 2.50 | 108 |
| J100207.04+030327.6 | 0.0232 | 4580 | 40.8 | 43.3 | 6.61 | 2.18 | 119 |
| J101439.55004951.2 | 0.0491 | 3120 | 40.6 | 43.1 | 6.16 | 1.93 | 200 |
| J101640.57+025125.2 | 0.0483 | 4370 | 40.1 | 42.7 | 6.24 | 2.43 | 120 |
| J101833.47+141241.1 | 0.0323 | 3460 | 40.5 | 43.0 | 6.22 | 2.05 | 135 |
| J101846.09+345001.6 | 0.0349 | 1650 | 40.6 | 43.2 | 5.62 | 1.33 | 77 |
| J104243.85+314121.8 | 0.0345 | 3650 | 40.0 | 42.6 | 6.05 | 2.29 | 74 |
| J104250.27+254616.3 | 0.0299 | 3360 | 41.0 | 43.5 | 6.41 | 1.83 | 105 |
| J104546.94+371240.7 | 0.0241 | 3040 | 39.6 | 42.3 | 5.69 | 2.30 | 135 |
| J104809.69+565459.4 | 0.0463 | 3790 | 40.5 | 43.0 | 6.29 | 2.15 | 124 |
| J104930.92+225752.3 | 0.0327 | 2300 | 40.5 | 43.1 | 5.87 | 1.67 | 163 |
| J105214.95+300328.3 | 0.0345 | 1940 | 40.5 | 43.1 | 5.71 | 1.52 | 136 |
| J105427.88+330943.4 | 0.0433 | 1960 | 40.8 | 43.3 | 5.84 | 1.43 | 147 |
| J105756.81+165434.4 | 0.0301 | 6250 | 40.4 | 42.9 | 6.69 | 2.63 | 119 |
| J105833.33+461604.8 | 0.0399 | 3500 | 40.7 | 43.2 | 6.32 | 1.98 | 142 |
| J110501.98+594103.5 | 0.0338 | 2530 | 41.0 | 43.5 | 6.18 | 1.56 | 137 |
| J111106.73+073459.8 | 0.0479 | 4690 | 40.6 | 43.1 | 6.52 | 2.30 | 186 |
| J111117.95+113315.8 | 0.0381 | 5880 | 40.9 | 43.4 | 6.86 | 2.38 | 162 |
| J111258.29+215434.0 | 0.0296 | 5210 | 40.3 | 42.9 | 6.51 | 2.49 | 121 |
| J111349.74+093510.7 | 0.0292 | 3940 | 41.2 | 43.6 | 6.65 | 1.89 | 210 |
| J111653.41+275822.8 | 0.0347 | 3680 | 40.5 | 43.0 | 6.27 | 2.11 | 104 |
| J111926.22+031205.7 | 0.0236 | 1960 | 39.7 | 42.3 | 5.34 | 1.87 | 82 |
| J112008.68+341845.8 | 0.0368 | 2540 | 40.3 | 42.9 | 5.86 | 1.85 | 102 |
| AGN | FWHMHα | LHα | Lbol | L | |||
|---|---|---|---|---|---|---|---|
| (1) | (2) | (3) | (4) | (5) | (6) | (7) | (8) |
| J112011.14+340858.9 | 0.0352 | 2410 | 40.1 | 42.7 | 5.71 | 1.89 | 71 |
| J112135.17+042647.2 | 0.0470 | 1780 | 40.4 | 43.0 | 5.59 | 1.49 | 100 |
| J112637.73+513423.0 | 0.0265 | 1760 | 40.0 | 42.6 | 5.39 | 1.64 | 93 |
| J112726.64+264051.5 | 0.0329 | 4860 | 40.4 | 42.9 | 6.46 | 2.42 | 129 |
| J113355.93+670107.0 | 0.0397 | 6130 | 40.9 | 43.4 | 6.92 | 2.40 | 156 |
| J113409.01+491516.3 | 0.0373 | 2410 | 40.1 | 42.7 | 5.69 | 1.91 | 70 |
| J113543.71+490959.8 | 0.0353 | 2450 | 39.9 | 42.5 | 5.62 | 2.00 | 105 |
| J114223.58+153340.9 | 0.0444 | 1940 | 40.5 | 43.0 | 5.69 | 1.55 | 82 |
| J114530.25+094344.7 | 0.0214 | 3080 | 40.4 | 42.9 | 6.05 | 2.00 | 159 |
| J114612.17+202329.9 | 0.0233 | 5190 | 40.4 | 43.0 | 6.55 | 2.45 | 195 |
| J114840.42001710.3 | 0.0474 | 3210 | 40.5 | 43.0 | 6.15 | 1.98 | 208 |
| J115246.29+232833.6 | 0.0220 | 5580 | 40.6 | 43.1 | 6.68 | 2.45 | 169 |
| J115623.23+195932.1 | 0.0409 | 3040 | 40.4 | 43.0 | 6.08 | 1.96 | 136 |
| J120144.91+201941.9 | 0.0234 | 1940 | 40.3 | 42.8 | 5.59 | 1.63 | 123 |
| J120234.39+544500.7 | 0.0499 | 4050 | 40.6 | 43.1 | 6.40 | 2.16 | 93 |
| J120443.31+311038.2 | 0.0249 | 4270 | 40.9 | 43.4 | 6.61 | 2.06 | 127 |
| J120704.75+090647.9 | 0.0344 | 6150 | 41.1 | 43.5 | 7.00 | 2.33 | 168 |
| J120908.80+440011.4 | 0.0376 | 2030 | 40.6 | 43.2 | 5.81 | 1.52 | 143 |
| J124054.96+080323.1 | 0.0477 | 1620 | 40.6 | 43.2 | 5.61 | 1.32 | 97 |
| J124240.45+092851.8 | 0.0240 | 2330 | 39.9 | 42.6 | 5.61 | 1.92 | 76 |
| J124610.76+275615.9 | 0.0231 | 4840 | 40.5 | 43.0 | 6.50 | 2.37 | 123 |
| J124954.76+503453.9 | 0.0469 | 2490 | 40.4 | 42.9 | 5.87 | 1.80 | 133 |
| J125258.13+090157.2 | 0.0400 | 3770 | 40.5 | 43.0 | 6.30 | 2.13 | 175 |
| J125552.36+103055.2 | 0.0484 | 4400 | 40.9 | 43.4 | 6.62 | 2.11 | 130 |
| J130340.81+534323.6 | 0.0276 | 1670 | 40.0 | 42.6 | 5.32 | 1.62 | 136 |
| J130342.82+324824.5 | 0.0367 | 1820 | 40.1 | 42.7 | 5.46 | 1.64 | 74 |
| J130422.19+361543.1 | 0.0443 | 1850 | 41.3 | 43.7 | 6.01 | 1.19 | 137 |
| J130620.97+531823.1 | 0.0237 | 8830 | 40.8 | 43.3 | 7.22 | 2.75 | 141 |
| J130705.01+024337.1 | 0.0477 | 4570 | 40.4 | 43.0 | 6.44 | 2.32 | 147 |
| J130737.68+433117.7 | 0.0353 | 3420 | 40.6 | 43.1 | 6.27 | 1.99 | 83 |
| J132209.96+331005.6 | 0.0373 | 1490 | 40.0 | 42.6 | 5.23 | 1.51 | 78 |
| J132336.84+062424.3 | 0.0394 | 2590 | 40.4 | 43.0 | 5.92 | 1.83 | 85 |
| J133204.81+170256.2 | 0.0215 | 4140 | 40.7 | 43.2 | 6.49 | 2.12 | 152 |
| J134244.42+350346.4 | 0.0243 | 2300 | 40.1 | 42.7 | 5.69 | 1.83 | 87 |
| J134249.94+294546.4 | 0.0431 | 2900 | 40.8 | 43.3 | 6.21 | 1.76 | 170 |
| J135419.95+325547.7 | 0.0261 | 4220 | 40.8 | 43.3 | 6.55 | 2.09 | 177 |
| J135747.63+072346.5 | 0.0236 | 3720 | 40.1 | 42.7 | 6.09 | 2.29 | 100 |
| J140543.16+251352.9 | 0.0298 | 6230 | 40.7 | 43.2 | 6.85 | 2.48 | 139 |
| J140718.28+125313.9 | 0.0274 | 4980 | 40.2 | 42.8 | 6.40 | 2.50 | 139 |
| J140804.00+071939.4 | 0.0239 | 1890 | 40.4 | 42.9 | 5.62 | 1.56 | 82 |
| J141057.23+252950.0 | 0.0310 | 2400 | 40.5 | 43.1 | 5.91 | 1.71 | 175 |
| J141809.22+073352.3 | 0.0247 | 4500 | 40.2 | 42.8 | 6.31 | 2.42 | 299 |
| J142042.91+262503.2 | 0.0379 | 1900 | 40.8 | 43.3 | 5.83 | 1.38 | 130 |
| J142255.33+325102.3 | 0.0342 | 4060 | 40.8 | 43.3 | 6.48 | 2.09 | 140 |
| J142307.51+283542.3 | 0.0293 | 2810 | 40.6 | 43.1 | 6.07 | 1.83 | 130 |
| J142704.54+355409.5 | 0.0290 | 5930 | 40.9 | 43.3 | 6.86 | 2.39 | 179 |
| J143318.47+344404.4 | 0.0343 | 3180 | 40.5 | 43.0 | 6.13 | 1.99 | 202 |
| J143727.85+254556.0 | 0.0328 | 1200 | 39.6 | 42.3 | 4.86 | 1.47 | 136 |
| J144331.28+492335.1 | 0.0302 | 6920 | 40.6 | 43.2 | 6.91 | 2.61 | 137 |
| J144629.99+500130.7 | 0.0427 | 6110 | 41.0 | 43.5 | 6.97 | 2.35 | 132 |
| J144837.03+514331.0 | 0.0364 | 2170 | 40.3 | 42.8 | 5.69 | 1.73 | 71 |
| J145048.68+200301.4 | 0.0437 | 5170 | 40.4 | 43.0 | 6.56 | 2.43 | 154 |
| J150214.29+182928.7 | 0.0477 | 2090 | 40.5 | 43.1 | 5.79 | 1.58 | 81 |
| J150511.42020831.0 | 0.0372 | 5950 | 40.3 | 42.9 | 6.63 | 2.60 | 138 |
| J150653.38+125131.2 | 0.0216 | 1840 | 39.7 | 42.4 | 5.30 | 1.79 | 106 |
| J150656.41+125048.6 | 0.0224 | 2980 | 40.2 | 42.7 | 5.93 | 2.06 | 217 |
| J151512.25+152412.3 | 0.0457 | 1540 | 40.7 | 43.2 | 5.60 | 1.23 | 98 |
| J151907.55+260750.6 | 0.0447 | 2520 | 40.5 | 43.0 | 5.92 | 1.78 | 117 |
| J154357.33+283126.4 | 0.0323 | 1580 | 40.6 | 43.1 | 5.57 | 1.30 | 110 |
| J154744.14+412408.2 | 0.0326 | 1900 | 40.7 | 43.2 | 5.77 | 1.44 | 89 |
| AGN | FWHMHα | LHα | Lbol | L | |||
|---|---|---|---|---|---|---|---|
| (1) | (2) | (3) | (4) | (5) | (6) | (7) | (8) |
| J155926.11+521235.3 | 0.0423 | 4380 | 40.9 | 43.4 | 6.64 | 2.08 | 134 |
| J160154.01+315331.3 | 0.0450 | 3240 | 40.9 | 43.4 | 6.35 | 1.83 | 178 |
| J160417.30+042135.7 | 0.0465 | 3660 | 40.3 | 42.8 | 6.16 | 2.20 | 124 |
| J160445.00+444316.9 | 0.0433 | 2460 | 40.4 | 42.9 | 5.86 | 1.79 | 107 |
| J160505.15+452634.8 | 0.0434 | 5870 | 41.1 | 43.6 | 6.98 | 2.27 | 178 |
| J160652.16+275539.1 | 0.0463 | 3250 | 41.1 | 43.5 | 6.43 | 1.76 | 128 |
| J160746.71+253214.9 | 0.0406 | 1440 | 40.2 | 42.8 | 5.30 | 1.38 | 96 |
| J161243.05+002247.9 | 0.0445 | 9230 | 40.8 | 43.3 | 7.22 | 2.82 | 189 |
| J161630.67+354228.9 | 0.0278 | 5730 | 40.5 | 43.0 | 6.68 | 2.50 | 151 |
| J162131.63+245952.4 | 0.0378 | 3250 | 40.5 | 43.0 | 6.15 | 2.01 | 110 |
| J162938.37+384139.2 | 0.0356 | 1600 | 39.9 | 42.5 | 5.25 | 1.61 | 71 |
| J163453.66+231242.6 | 0.0387 | 3810 | 41.0 | 43.5 | 6.55 | 1.92 | 144 |
| J164107.63+224924.8 | 0.0339 | 2810 | 40.6 | 43.1 | 6.09 | 1.82 | 89 |
| J164520.61+424528.0 | 0.0494 | 5050 | 40.6 | 43.1 | 6.60 | 2.35 | 98 |
| J171518.57+573931.6 | 0.0281 | 4340 | 40.1 | 42.7 | 6.25 | 2.40 | 131 |
| J173159.21+595817.9 | 0.0292 | 4440 | 40.1 | 42.7 | 6.28 | 2.42 | 153 |
| J173809.30+584253.6 | 0.0288 | 6130 | 40.6 | 43.1 | 6.78 | 2.52 | 125 |
| J204745.25052515.6 | 0.0458 | 3200 | 40.9 | 43.4 | 6.35 | 1.81 | 156 |
| J210917.64+001619.1 | 0.0500 | 13500 | 41.1 | 43.5 | 7.70 | 3.04 | 169 |
| J230920.26+004523.3 | 0.0323 | 5690 | 41.0 | 43.5 | 6.92 | 2.28 | 142 |
| J232337.44+133908.1 | 0.0425 | 2850 | 40.4 | 43.0 | 6.01 | 1.91 | 193 |
| J232611.29+140148.1 | 0.0462 | 7190 | 40.4 | 43.0 | 6.85 | 2.73 | 143 |
Notes. Column 1: Object name. Column 2: Redshift. Column 3: FWHM velocity of the broad component of the H emission line in km s-1. Column 4: Luminosity of the broad component of the H emission line in log scale (erg s-1). Column 5: Bolometric luminosity in log scale (erg s-1). Column 6: Virial Product in log scale (M⊙). Column 7: Eddington ratio in log scale. Column 8: Stellar velocity dispersion in km s-1 adopted from the SDSS catalogue.
5 Discussion and Conclusions
We presented a sample of 142 misclassified type 1 AGNs identified out of a parent sample of 4 113 type 2 AGNs at , selected from the SDSS DR 7 based on the emission-line flux ratios. The fraction of the misclassified type 1 AGNs among type 2 AGNs is 3.5%; this should be considered as a lower limit because we conservatively identified the broad H component by excluding AGNs that require a broad component with relatively small width. If we extrapolate the fraction of the misclassified type 1 AGNs, 3.5%, to higher redshift, it is expected that a large number of AGNs could be misclassified as type 2 AGNs in the SDSS DR7 catalog. The discovery of the missing type 1 AGN population will shed light on understanding the low-mass, low-luminosity AGNs and studying AGN population and their properties.
The newly identified type 1 AGN sample has a mean black hole mass log (MBH/M⊙)= based on the most recent single-epoch black hole mass calibrator – although the precise black hole mass values depend on the virial factor. The mean broad H luminosity of the sample is log (LHα/(erg s-1) = , and the mean Eddington ratio is log L = . The low Eddington ratios of the sample imply that the AGN continuum is too weak to change the host galaxy color, which is consistent with the relatively red color of the targets shown in the SDSS images.
We investigated the velocity offset of each emission line with respect to the systemic velocity measured from stellar absorption lines. We find that the O iii lines show relatively large velocity offsets while the velocity offsets of the H lines are weaker than for O iii, indicating that the O iii-emitting gas is influenced by outflows more strongly. The velocity dispersions of the N ii lines and the O iii core components are consistent with each other and with stellar velocity dispersions, albeit with significant scatter, suggesting that the kinematics of the gas in the NLR is mainly governed by the large scale gravitational potential (i.e., the galaxy bulge), while outflow/inflow motions can vary the velocity dispersion of narrow emission lines. The kinematic properties of the ionized gas of the sample are similar to those of the general type 1 AGN population, supporting the idea that these objects are simply misclassified type 1 AGNs.
Acknowledgements.
This work was supported by the National Research Foundation of Korea (NRF) grant funded by the Korean government (MEST; No. 2012-R1A2A2A01006087). J.H.W. acknowledges the support by the Korea Astronomy and Space Science Institute (KASI) grant funded by the Korea government (MEST). by the Korea government (No. 2012-006087). J.G.K. acknowledges the support by the 2012 R&E Program of Gyeonggi Science High School for the Gifted (GSHS).References
- Abazajian et al. (2009) Abazajian, K. N., et al. 2009, The Seventh Data Release of the Sloan Digital Sky Survey, ApJS, 182, 543
- Bae & Woo (2014) Bae, H.-J. & Woo, J.-H. 2014, A Census of Gas Outflows in Type 2 Active Galactic Nuclei ApJ, 795, 30
- Baldwin et al. (1981) Baldwin, J. A., Phillips, M. M., & Terlevich, R. 1981, Classification Parameters for the Emission-Line Spectra of Extragalactic Objects, PASP, 93, 5
- Blandford & McKee (1982) Blandford, R. D., & McKee, C. F. 1982, Reverberation Mapping of the Emission Line Regions of Seyfert Galaxies and Quasars, ApJ, 255, 419
- Bellovary et al. (2014) Bellovary, J., Holley-Bockelmann, K., Gültekin, K., et al. 2014, Effects of Inclination on Measuring Velocity Dispersion and Implications for Black Holes, ApJ, in press (arXiv:1405.0286)
- Bentz et al. (2013) Bentz, M. C., Denney, K. D., Grier, C. J¿, Barth, A. J., Peterson, B. M., Vestergaard M., Bennert, V. N., Canalizo, G., De Rosa, G., Filippenko, A. V., Gates, E. L., Greene, J. E., Li, W., Malkan, M. A., Pogge, R. W., Stern, D., Treu, T., & Woo, J.-H. 2013, The Low-Luminosity End of the Radius-Luminosity Relationship for Active Galactic Nuclei, ApJ, 767, 149
- Boroson (2005) Boroson, T. 2005, Blueshifted [O III] Emission: Indications of a Dynamic Narrow-Line Region, AJ, 130, 381
- Cappellari & Emsellem (2004) Cappellari, M., & Emsellem, E. 2004, Parametric Recovery of Line-of-Sight Velocity Distributions from Absorption-Line Spectra of Galaxies via Penalized Likelihood, PASP, 116, 138
- Choi et al. (2010) Choi, Y.-Y., Han, D.-H., & Kim, S. S. 2010, Korea Institute for Advanced Study Value-Added Galaxy Catalog, JKAS, 43, 191
- Crenshaw et al. (2010) Crenshaw, D. M., Schmitt, H. R., Kraemer, S. B., Mushotzky, R. F., & Dunn, J. P. 2010, Radial Velocity Offsets Due to Mass Outflows and Extinction in Active Galactic Nuclei, ApJ, 708, 419
- Glikman et al. (2007) Glikman, E., Helfand, D. J., White, R. L., et al. 2007, The FIRST-2MASS Red Quasar Survey, ApJ, 667, 673
- Glikman et al. (2013) Glikman, E., Urrutia, T., Lacy, M., et al. 2013, Dust Reddened Quasars in FIRST and UKIDSS: Beyond the Tip of the Iceberg, ApJ, 778, 127
- Greene & Ho (2004) Greene, J. E., & Ho, L. C. 2004, Active Galactic Nuclei with Candidate Intermediate-Mass Black Holes, ApJ, 610, 722
- Greene & Ho (2005) Greene, J. E., & Ho, L. C. 2005, Estimating Black Hole Masses in Active Galaxies Using the Emission Line, ApJ, 630, 122
- Greene & Ho (2007) Greene, J. E., & Ho, L. C. 2007, A New Sample of Low-Mass Black Holes in Active Galaxies, ApJ, 670, 92
- Haring & Rix (2004) Haring, N., Rix, H. W. 2004, On the Black Hole Mass-Bulge Mass Relation, ApJ, 604, L89
- Heckman & Best (2014) Heckman, T., & Best, P. 2014, The Coevolution of Galaxies and Supermassive Black Holes: Insights from Surveys of the Contemporary Universe, ARAA, 52, 589
- Hornschemeier et al. (2005) Hornschemeier, A. E., Heckman, T. M., Ptak, A. F., Tremonti, C. A., & Colbert, E. J. M. 2005, Chandra-SDSS Normal and Star-Forming Galaxies. I. X-Ray Source Properties of Galaxies Detected by the Chandra X-Ray Observatory in SDSS DR2, AJ, 129, 86
- Kang et al. (2013) Kang, W.-R., Woo, J.-H., Schulze, A., et al. 2013, Calibrating Stellar Velocity Dispersions Based on Spatially Resolved H-band Spectra for Improving the Relation ApJ, 767, 26
- Kaspi et al. (2000) Kaspi, S., Smith, P. S., Netzer, H., Maoz, D., Jannuzi, B. T., & Giveon, U. 2000, Reverberation Measurements for 17 Quasars and the Size-Mass-Luminosity Relations in Active Galactic Nuclei, ApJ, 533, 631
- Kelly & Shen (2013) Kelly, B. C., & Shen, Y. 2013, The Demographics of Broad-line Quasars in the Mass-Luminosity Plane. II. Black Hole Mass and Eddington Ratio Functions, ApJ, 764, 45
- Kewley et al. (2006) Kewley, L. J., Groves, B., Kauffmann, G., & Heckman, T. 2006, The Host Galaxies and Classification of Active Galactic Nuclei, MNRAS, 372, 961
- Komossa et al. (2008) Komossa, S., Xu, D., Zhou, H., Storchi-Bergmann, T., & Binette, L. 2008, On the Nature of Seyfert Galaxies with High [O III] λ5007 Blueshifs, ApJ, 680, 926
- Koratkar & Gaskell (1991) Koratkar A. P., & Gaskell, C. M. 1991, Radius-Luminosity and Mass-Luminosity Relationship for Active Galatic Nuclei, ApJ, 370, L61
- Kormendy & Ho (2013) Kormendy, J., & Ho, L. C. 2013, Coevolution (Or Not) of Supermassive Black Holes and Host Galaxies, ARAA, 51, 511
- Land et al. (2008) Land, K., Slosar, A., Lintott, C., Andreescu, D., Bamford, S., Murray, P., Nichol, R., Raddick, M. J., Schawinski, K., Szalay, A., Thomas, D., & Vandenberg, J. 2008, Galaxy Zoo: the large-scale spin statistics of spiral galaxies in the Sloan Digital Sky Survey, MNRAS, 388, 1686
- Lintott et al. (2008) Lintott, C. J., Schawinski, K., Slosar, A., Land, K., Bamford, S., Thomas, D., Raddick, M. J., Nichol, R. C., Szalay, A., Andreescu, D., Murray, P., & Vandenberg, J. 2008, Galaxy Zoo: morphologies derived from visual inspection of galaxies from the Sloan Digital Sky Survey, MNRAS, 389, 1179
- Lintott et al. (2011) Lintott, C. J., Schawinski, K., Bamford, S., Slosar, A., Land, K., Thomas, D., Edmondson, E., Masters, K., Nichol, R. C., Raddick, M. J., Szalay, A., Andreescu, D., Murray, P., & Vandenberg, J. 2011, Galaxy Zoo 1: data release of morphological classifications for nearly 900 000 galaxies, MNRAS, 410, 166
- Markwardt (2009) Markwardt, C. B. 2009, Non-Linear Least-Squares Fitting in IDL with MPFIT, ASPC, 411, 251
- McConnell & Ma (2013) McConnell, N. J., & Ma, C.-P. 2013, Revisiting the Scaling Relations of Black Hole Masses and Host Galaxy Properties, ApJ, 764, 14
- Nelson & Whittle (1995) Nelson, C. H., & Whittle, M. 1995, Stellar and Gaseous Kinematics of Seyfert Galaxies. I. Spectroscopic Data, ApJS, 99, 67
- Netzer (2009) Netzer, H. 2009, Accretion and star formation rates in low-redshift type II active galactic nuclei, MNRAS, 399, 1907
- Oh et al. (2011) Oh, K., Sarzi, M., Schawinski, K., & Yi, S. K. 2011, Improved and Quality-assessed Emission and Absorption Line Measurements in Sloan Digital Sky Survey Galaxies, ApJS, 195, 13
- Onken et al. (2004) Onken, C. A., Ferrarese, L., Merritt, D., Peterson, B. M., Pogge, R. W., Vestergaard, M., & Wandel, A. 2004, Supermassive Black Holes in Active Galactic Nuclei. II. Calibration of the Black Hole Mass-Velocity Dispersion Relationship for Active Galactic Nuclei, ApJ, 615, 645
- Park et al. (2012) Park, D., Woo, J.-H., Treu, T., Barth, A. J., Bentz, M. C., Bennert, V. N., Canalizo, G., Filippenko, A. V., Gates, E., Greene, J. E., Malkan, M. A., & Walsh, J. 2012, The Lick AGN Monitoring Project: Recalibrating Single-epoch Virial Black Hole Mass Estimates, ApJ, 747, 30
- Reines et al. (2013) Reines, A. E., Greene, J. E., & Geha, M. 2013, Dwarf Galaxies with Optical Signatures of Active Massive Black Holes, ApJ, 775, 116
- Richards et al. (2006) Richards, G. T., Lacy, M., Storrie-Lombardi, L. J., Hall, P. B., Gallagher, S. C., Hines, D. C., Fan, X., Papovich, C., Vanden Berk, D. E., Trammell, G. B., Schneider, D. P., Vestergaard, M., York, D. G., Jester, S., Anderson, S. F., Budavári, T., & Szalay, A. S. 2006, Spectral Energy Distributions and Multiwavelength Selection of Type 1 QUASARs, ApJS, 166, 470
- Schawinski et al. (2010) Schawinski, K., Urry, C. M., Virani, S., Coppi, P., Bamford, S. P., Treister, E., Lintott, C. J., Sarzi, M., Keel, W. C., Kaviraj, S., Cardamone, C. N., Masters, K. L., Ross, N. P., Andreescu, D., Murray, P., Nichol, R. C., Raddick, M. J., Solsar, A., Szalay, A. S., Thomas, D., & Vandenberg, J. 2010, Galaxy Zoo: The Fundamentally Different Co-Evolution of Supermassive Black Holes and Their Early- and Late-Type Host Galaxies, ApJ, 711, 284
- Shen et al. (2008) Shen, J., Vanden Berk, D. E., Schneider, D. P., & Hall, P. B. 2008, The Black Hole-Bulge Relationship in Luminous Broad-Line Active Galactic Nuclei and Host Galaxies, ApJ, 135, 928
- Stern & Laor (2012) Stern, J., & Laor, A. 2012, Type I AGN at low z. I. Emission properties, MNRAS, 423, 600
- Seyfert (1943) Seyfert, C. K. 1943, Nuclear Emission in Spiral Nebulae, ApJ, 97, 28
- Verolme et al. (2002) Verolme, E. K., Cappellari M., Copin, Y., van der Marel, R. P., Bacon, R., Bureau, M., Davies, R. L., Miller, B. M., & de Zeeuw, P. T. 2002, A SAURON Study of M32: Measuring the Intrinsic Flattening and the Central Black Hole Mass, MNRAS, 355, 517
- Woo et al. (2006) Woo, J.-H., Treu, T., Malkan, M. A., & Blandford, R. D. 2006, Cosmic Evolution of Black Holes and Spheroids. I. The Relation at z = 0.36, ApJ, 645, 900
- Woo et al. (2010) Woo, J.-H., Treu, T., Barth, A. J., Wright, S. A., Walsh, J. L., Bentz, M. C., Martini, P., Bennert, V. N., Canalizo, G., Filippenko, A. V., Gates, E., Greene, J., Li, W., Malkan, M. A., Stern, D., & Minezaki, T. 2010, The LICK AGN Monitoring Project: The Relation for Reverberation-Mapped Active Galaxies, ApJ, 716, 269
- Woo & Urry (2002) Woo, J.-H., & Urry, C. M. 2002, Active Galactic Nucleus Black Hole Masses and Bolometric Luminosities, ApJ, 579, 530
- Woo et al. (2013) Woo, J.-H., Schulze, A., Park, D., Kang, W.-R., Kim, S. C., & Riechers, D. A. 2013, Do Quiescent and Active Galaxies Have Different Relations?, ApJ, 772, 49
- Wyithe & Loeb (2002) Wyithe, J. S. B., & Loeb, J. 2002, A Physical Model for the Luminosity Function of High-Redshift Quasars, ApJ, 581, 886
- Xiao et al. (2013) Xiao, T., Barth, A. J., Greene, J. E., Ho, L. C., Bentz, M. C., Ludwig, R. R., & Jiang, Y. 2011, Exploring the Low-Mass End of the Relation with Active Galaxies, ApJ, 739, 28