Imaging and spectroscopic observations of magnetic reconnection and chromospheric evaporation in a solar flare
Abstract
Magnetic reconnection is believed to be the dominant energy release mechanism in solar flares. The standard flare model predicts both downward and upward outflow plasmas with speeds close to the coronal Alfvén speed. Yet, spectroscopic observations of such outflows, especially the downflows, are extremely rare. With observations of the newly launched Interface Region Imaging Spectrograph (IRIS), we report the detection of greatly redshifted (125 km s-1 along line of sight) Fe xxi 1354.08Å emission line with a 100 km s-1 nonthermal width at the reconnection site of a flare. The redshifted Fe xxi feature coincides spatially with the loop-top X-Ray source observed by the Reuven Ramaty High Energy Solar Spectroscopic Imager (RHESSI). We interpret this large redshift as the signature of downward-moving reconnection outflow/hot retracting loops. Imaging observations from both IRIS and the Atmospheric Imaging Assembly (AIA) onboard the Solar Dynamics Observatory (SDO) also reveal the eruption and reconnection processes. Fast downward-propagating blobs along these loops are also found from cool emission lines (e.g., Si iv, O iv, C ii, Mg ii) and images of AIA and IRIS. Furthermore, the entire Fe xxi line is blueshifted by 260 km s-1 at the loop footpoints, where the cool lines mentioned above all exhibit obvious redshift, a result that is consistent with the scenario of chromospheric evaporation induced by downward-propagating nonthermal electrons from the reconnection site.
1 Introduction
Magnetic reconnection is believed to be the dominant energy release mechanism during solar flares. Early observations of flares have led to the development of the standard flare model, in which the frequently observed H ribbons, post-flare loops, hard X-ray sources at the loop footpoints and the loop top can be explained as consequences of magnetic reconnection (e.g., Magara et al., 1996). After the mid-1990s, high-resolution observations at multiple wavelengths have greatly enhanced our understanding of the reconnecting current sheets (e.g., Liu et al., 2010) and chromospheric evaporation (e.g., Milligan & Dennis, 2009), which are also part of the standard flare model. For recent reviews of theories and observations of magnetic reconnection in solar flares, we refer to Benz (2008) and Fletcher et al. (2011).
There have been observations of plasma inflows in flare reconnections (e.g., Yokoyama et al., 2001). Upward outflows are often identified as impulsive ejection of plasmoids. High-speed downflows immediately above the post-eruption flare arcades (supra arcade downflows) were first presented by McKenzie & Hudson (1999), but their nature is subject to debate (Savage et al., 2012a; Cassak et al., 2013; Liu, 2013; Guo et al., 2014). Shrinking loops have been seen in several imaging observations (Reeves et al., 2008; Savage et al., 2010; Liu et al., 2013). Spectroscopic observations of fast reconnection outflows (Wang et al., 2007; Hara et al., 2011), especially the downflows, are extremely rare.
We report the first detection of a large redshift in Fe xxi 1354.08Å (formation temperature 10 MK) with the Interface Region Imaging Spectrograph (IRIS, De Pontieu et al., 2014) in a C1.6 flare peaked at 17:19 UT on 2014 April 19. Based on observations of IRIS, the Atmospheric Imaging Assembly (AIA, Lemen et al., 2012) onboard the Solar Dynamics Observatory (SDO), and the Reuven Ramaty High Energy Solar Spectroscopic Imager (RHESSI, Lin et al., 2002), we interpret this large redshift as the reconnection downflow. Greatly blueshifted Fe xxi features have also been detected in the evaporation flow. Furthermore, inflows, upward-moving outflows, and fast downward-moving blobs have all been detected. Thus, rather than fragmented pieces of the evidences of reconnection identified in many previous flare observations, our observations provide a more complete picture of flare reconnection.
2 Observations
The IRIS observation was taken from 15:09 UT to 22:20 UT on 2014 April 19. There were several large coarse 64-step rasters in this observation and the flare of interest (SOL2014-04-19T17:19 UT) was observed in the fourth raster. The pointing coordinate was (695′′, -221′′). The data was summed by 2 onboard both spectrally and spatially, leading to a spatial pixel size of 0.33′′ and a spectral dispersion of 0.026 Å per pixel in the far ultraviolet wavelength bands. The cadence of the spectral observation was 31 seconds, with an exposure time of 30 seconds. Slit-jaw images (SJI) in the 1400Å filter were taken at a cadence of 31 seconds. Dark current subtraction, flat field and geometrical corrections have been applied in the level 2 data used here. The fiducial lines were used to achieve a coalignment between the SJI and different spectral windows.
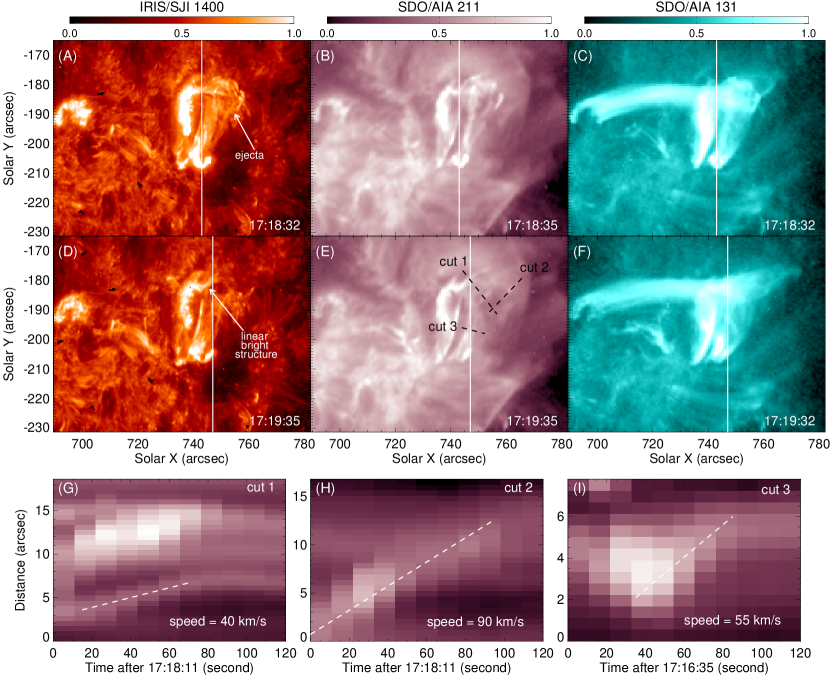
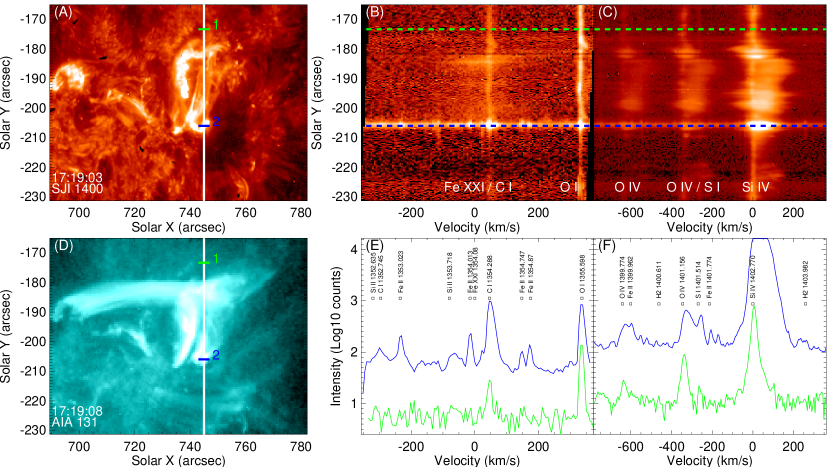
Figure 1 shows some context images taken by IRIS and AIA. Emission in the IRIS/SJI 1400Å filter is dominated by the strong Si iv 1393.76Å/1402.77Å lines (formed around 104.9K) and UV continuum (formed slightly above the temperature minimum, Vernazza et al., 1981). The AIA 1600Å images and SJI 1400Å images are used for the coalignment of the images taken by the two instruments. The emission pattern and plasma motions are similar in the AIA 171Å, 193Å, 211Å, 335Å, 304Å and 1600Å passbands. We thus only present the 211Å images here. This passband is dominated by emission from ions formed at both coronal (Fe xiv) and transition region (e.g., O iv, O v) temperatures (Del Zanna et al., 2011). The two hot AIA passbands, 131Å and 94Å, sample emission mainly from the 10 MK and 6 MK plasma respectively. Figures 2–4 present the IRIS/SJI 1400Å images, corresponding AIA 131Å images, and the IRIS spectra in the Fe xxi 1354.08Å and Si iv 1402.77Å windows at three different times. We present the time sequence of IRIS observation (including SJI 1400Å images and several spectral windows) and the corresponding AIA images in an online movie. The full-cadence (12 seconds) movie of AIA 211Å is also available online.
From the online movies we can see that the flare loops brightened at 17:13:20, 17:15:55 and 17:17:30 before the flare peak (17:19:00), suggesting a multiple-episode energy release behavior of this flare. In this paper we mainly focus on various types of flows observed in the third episode starting from 17:17:30, which were clearly observed from both imaging and spectroscopic observations.
3 Flows around the reconnection site
3.1 Imaging observations
Observations of IRIS/SJI 1400Å and AIA 211Å (Figure 1) reveal a process consistent with the flare reconnection scenario. Sides of loops moved towards each other from 17:18:11 to 17:19:35. A bright structure (the ejecta marked in Figure 1(A), presumably a flux rope or plasmoid) can be identified near the coordinates (755′′, -185′′) around 17:18:32. Its disappearance at 17:19:03 is likely related to magnetic reconnection, which permits the field reconfiguration that allows the structure to be expelled. At 17:19:35 a linear bright structure (Figure 1(D)) above the post-reconnection loops in the 1400Å and 211Å images can be seen. This resembles the tip of newly formed loops (cusp). It could also be the lower end of the current sheet.
By plotting the space-time map of AIA 211Å (Figure 1(G)) along cut 1 (Figure 1(E)) we have inferred the speed of reconnection inflow from the movement of the southern part of the reconnecting loops and found a value of 40 km s-1. Inflow at the northern part is not obvious, probably due to projection effect or asymmetric reconnection inflows. Propagation of the ejecta is barely visible after the eruption, but we do find a bright outward moving feature from AIA 211Å (Figure 1(E), cut 2). This feature seems to be located at the southern boundary of the ejected structure and its speed is estimated to be 90 km s-1 (Figure 1(H)), likely the lower end of the speed of the upward-moving reconnection outflow.
3.2 Red shift of Fe xxi 1354.08Å
There are several neutral and singly ionized lines in the spectral windows shown in Figures 2–4 (e.g., Mason et al., 1986). However, most of these lines are only visible at the loop footpoints (e.g., location 2 in Figure 2). The major blend of the Fe xxi 1354.08Å line is C i 1354.288Å, which is usually strong even outside the flare regions (e.g., location 1 in Figure 2).
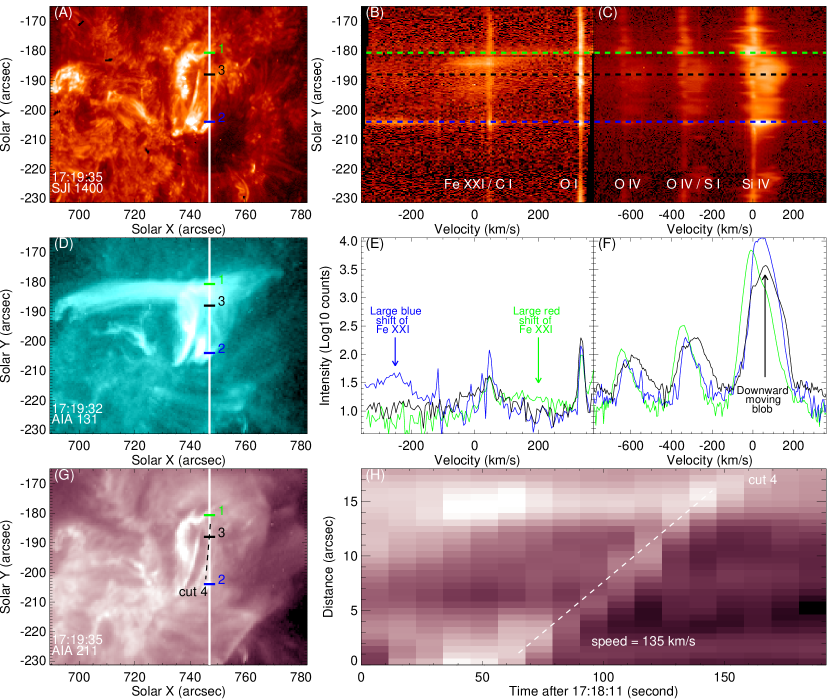
Significant enhancement at the red side of the Fe xxi 1354.08Å rest position can be identified at the bright linear structure around 17:19:35 (Figure 3, location 1). Clearly, this emission feature cannot be explained by the two narrow Fe ii lines marked in Figure 2(E). This enhancement is due to the greatly redshifted Fe xxi 1354.08Å emission. The AIA 131Å passband also mainly samples emission from the Fe xxi ion and we clearly see a very bright emission feature at location 1, supporting our argument that this enhancement is caused by the Fe xxi emission. The enhanced emission extends to the nearby O i line, suggesting redshift of Fe xxi by up to 300 km s-1. Images of SJI 1400Å and AIA 131Å suggest that location 1 is probably at the lower end of a current sheet or close to the cusp of the newly reconnected hot loops. So the large redshift of Fe xxi is most likely a signature of the downward-moving reconnection outflow or hot retracting loops. The main blend of the O iv 1399.774Å line is Fe ii 1399.962Å. The main blend of the O iv 1401.156Å line is S i 1401.514Å. We take the ratio of the intensities of the two O iv lines derived from multiple Gaussian fit and obtain a density around log (Ne/cm-3)=11.0 at location 1 based on CHIANTI v7.1 (Landi et al., 2013).
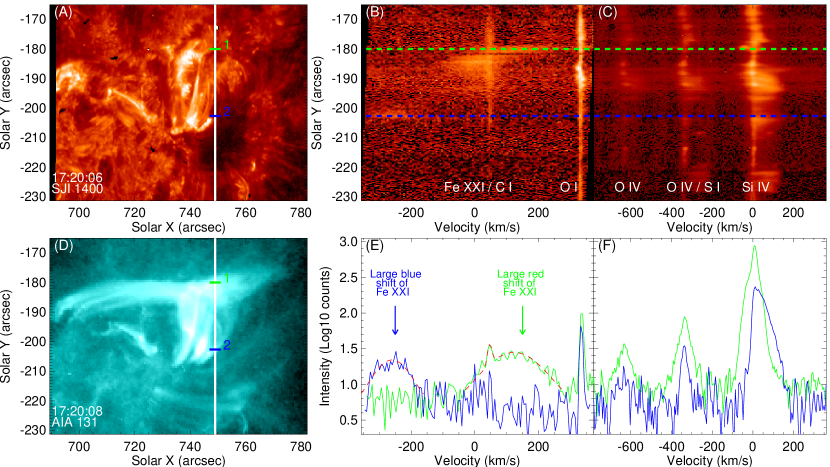
At 17:20:06 the slit moved to the west and similar spectral features persisted (Figure 4). The greatly redshifted Fe xxi emission at location 1 became much stronger at this time. Applying a double Gaussian fit to this broad Fe xxi feature and the embedded C i emission feature yields a centroid redshift of 125 km s-1 and a nonthermal width (1/e width) of 96 km s-1. The nonthermal width is calculated based on an assumed kinetic temperature of 10 MK (54 km s-1 thermal broadening).
After 17:20:06, the Fe xxi downflow became weaker and the velocity decreased. Presumably, the reconnection site moved to a higher height and the reconnection also weakened over time. At about 17:21:39 the centroid of the Fe xxi line profile still had a redshift of 50 km s-1 and the location of this hot downflow seems to coincide with the loop-top X-ray source observed with RHESSI (Figure 5(A)-(B)). Unfortunately RHESSI was in orbit night before 17:21:30.
The large redshift of Fe xxi is probably the first unambiguous detection of hotter-than-10 MK reconnection downflow/hot retracting loops in flares using combined imaging and spectroscopic observations. Wang et al. (2007) detected significant enhancement in both wings of an Fe xix line and interpreted them as reconnection outflows in a flare. The Fe xix line is mainly sensitive to 8 MK plasma. Hara et al. (2011) observed a loop-top hot source in the Fe xxiii and Fe xxiv lines formed at 12 MK. But these lines exhibited a redshift of only 30 km s-1, making it difficult to properly interpret. Innes (2003) detected enhanced blue wing emission of Fe xxi indicative of plasma flows up to 1000 km s-1 in a limb flare, and provided the sunward reconnection outflow as one of the three possible explanations.
The standard flare model also includes a termination shock (TS) resulting from the interaction between the reconnection downflow and the flare loops. The TS may play a crucial role in electron acceleration and the hardening of the flare spectra above 300 keV (Li et al., 2013; Kong et al., 2013). Warmuth et al. (2009) and Gao et al. (2014) interpreted type-II radio bursts without frequency drift as a signature of the TS. Direct evidences of the TS should include a velocity discontinuity, which could potentially be observed by IRIS. In our event, no clues about the TS can be obtained since we have only observed one redshift. Note that the Fe xxi spectral window used in our observation extends only to 360 km s-1 on the red side of Fe xxi, so downflows with speeds higher than 360 km s-1 could not be detected. Future IRIS observations with a more appropriate choice of the spectral window will be helpful to detect TS.
The co-spatial redshifted Fe xxi feature and the RHESSI soft X-ray source suggest electron heating in the reconnection outflow/hot retracting loops (e.g., Liu et al., 2013) or at the TS (Tsuneta & Naito, 1998; Guo & Giacalone, 2012; Li et al., 2013). The large nonthermal width of Fe xxi could be caused by the divergence of flows along the line of sight above the loop tops, or post-reconnection turbulence (e.g., Ciaravella & Raymond, 2008; Guo & Giacalone, 2012; Doschek et al., 2014). Observations by the Gamma-ray Burst Monitor (GBM) onboad the Fermi Gamma-ray Space Telescope reveal an enhancement of hard X-rays up to 30-50 keV around 17:17:45 (Figure 5(C)), indicating electron acceleration mostly at the beginning of the third episode of this complex flare and before the plasmoid ejection.
Some efforts have been made to search for simultaneous observations of reconnection inflows and outflows. Reconnection rates have been estimated based on imaging observations of several flares (Li & Zhang, 2009; Cheng et al., 2010; Takasao et al., 2012; Su et al., 2013) and they are mostly in the range of 0.05-0.5. A spectroscopic investigation by Hara et al. (2011) yielded a reconnection rate of 0.05-0.1 in a flare. Without knowing the three-dimensional geometry of the flare, it is difficult to estimate the impact of the projection effect on the measured flow velocities. As a rough estimate, using 20 km s-1 (40/2) as the inflow speed and 125 km s-1 as the outflow speed leads to a reconnection rate of 0.16.
4 Flows associated with the loop legs
4.1 Downward-propagating blobs
From the AIA 211Å movie we find fast downward-moving blobs along post-reconnection loops around 17:19:35. The plane of sky component of the velocity of one blob is estimated to be 135 km s-1 from the space-time map of AIA 211Å (Figure 3(H)). This moving blob was captured by the IRIS slit, and we find a greatly enhanced redshifted component of the Si iv line profile, indicating a velocity of 60 km s-1 in the line of sight (location 3 in Figures 3). The full speed can then be estimated as 150 km s-1, which is comparable to the observed reconnection outflow speed in the line of sight.
While outward-moving blobs have been frequently reported (Ko et al., 2003; Lin et al., 2005; Savage et al., 2010; Song et al., 2012), inward-moving blobs are rarely observed in flares. Savage et al. (2012b) found that similar density enhancements along loop legs move even faster than the loop shrinks. These moving blobs could be accelerated plasma from the reconnection site.
4.2 Downward-moving loops
Downward motion of loop legs was observed below the ejecta and the linear bright structure from 17:17:35 to 17:18:11 in the 1400Å and 211Å images. These relatively small loops (North-South orientation) may also be identified in AIA 131Å images, in which they seem to be partly obscured by longer loops (East-West orientation) which were only present in the hotter AIA 131Å and 94Å passbands. One likely scenario is: while one ribbon of the flare was concentrated around the coordinate of (740′′, -207′′), the other ribbon was well separated, at locations of (740′′, -185′′) and (695′′, -190′′) respectively.
The plane of sky component of the motion of these loops has been found to be 55 km s-1 from the AIA 211Å observation (Figure 1(I)). The downward motion of these loops may be related to the reconnection inflow, or shrinking loops resulting from a reconnection process in the early stage of this flare. Another possibility is magnetic implosion, and the contraction motion is caused by the reduction of the magnetic pressure due to energy release (Hudson, 2000) at the beginning of the flare.
The IRIS slit moved to the location of these loops at 17:19:03 and 17:19:35 (Figures 2 and 3). Interestingly, O iv, Si iv, C ii and Mg ii lines, formed well below 1 MK, all exhibited clear splitting at these locations. We clearly see a broad redshifted (by 55 km s-1) component besides a narrow background component. At first sight this redshifted component seems to be associated with the loop motion. However, from the high-cadence AIA 211Å movie there appeared to be no obvious loop contraction at these times. Instead, the redshifted component might be associated with falling plasma in these loops and the downward-propagating blobs are perhaps the denser part of the falling plasma.
5 Flows at the loop footpoints
Location 2 in Figure 3 corresponds to one footpoint of the flare loops. There we find significant enhancement at the blue side of the Fe xxi 1354.08Å rest position. Several neutral and singly ionized lines marked in Figure 2(E) contributed to this emission. These lines, however, are narrow and cannot explain the bulk enhancement. This emission feature is likely due to the highly blueshifted (order of 260 km s-1) Fe xxi line. At the same time, cool lines formed in the transition region and upper chromosphere (e.g., O iv, Si iv, C ii and Mg ii) all exhibited significant redshifts at the same location. For example, the Si iv line is redshifted by 50 km s-1. This is consistent with the scenario of explosive chromospheric evaporation (Fisher et al., 1985). Using the O iv line pair, the electron density is found to be on the order of log (Ne/cm-3)=11.0 at location 2. We notice that strong evaporation flows were also present at 17:18:32.
At 17:20:06 the large blueshift at location 2 can still be seen (Figure 4). A single Gaussian fit to this emission feature gives a blue shift of 260 km s-1 and a nonthermal width of 44 km s-1. All the neutral and singly ionized lines marked in Figure 2(E) now disappeared, perhaps because there was no chromospheric material in the higher part of the loop.
The Fe xxi line profile in the evaporation flow seems to be entirely blueshifted by 260 km s-1, in agreement with hydrodynamic simulations of Liu et al. (2009). Entirely shifted Fe xxi line profiles have also been found by Young et al. (2014) and Li et al. (2014). This contrasts with previous observations of emission lines with formation temperatures lager than 10 MK by the EUV Imaging Spectrometer (EIS, Culhane et al., 2007) onboard HINODE, where usually a stationary emission component and a blueshifted component (or blue wing enhancement) co-exist during chromospheric evaporation (e.g., Milligan & Dennis, 2009; Li & Ding, 2011; Young et al., 2013). This difference possibly suggests that the resolution of EIS is not high enough to separate the evaporation flow from the ambient stationary hot plasma.
6 Summary
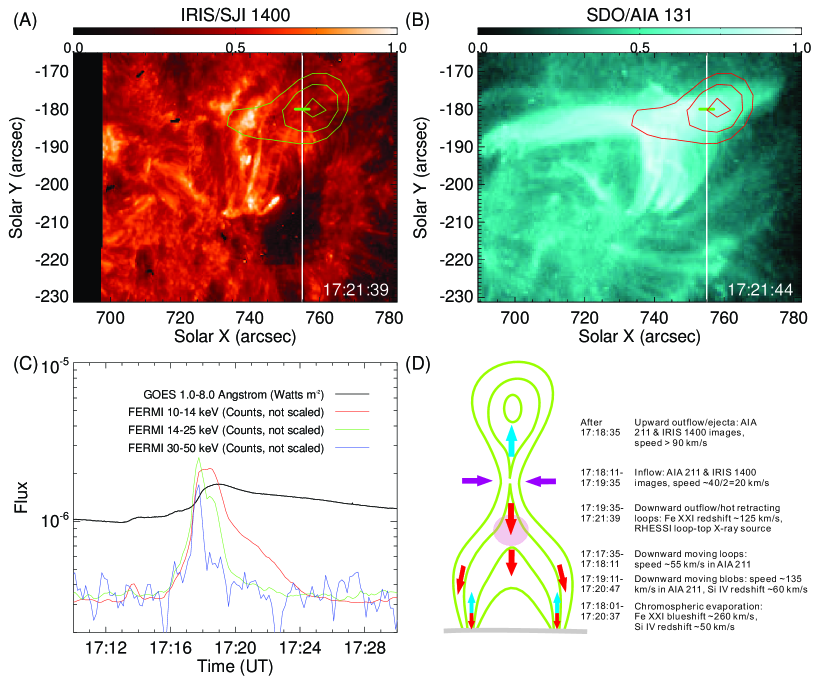
The different types of flows observed from combined imaging and spectroscopic observations are summarized in Figures 5(D). To our knowledge, this is one of the most complete observations of a variety of flows in one flare. The most interesting results are the following: (1) Large red shift of Fe xxi has been observed with IRIS for the first time and interpreted as a signature of reconnection downflows; (2) Fast blob-like structures have been observed to propagate from the reconnection site downward to the loop footpoints; (3) The Fe xxi line profile in the evaporation flow has been observed to be entirely blueshifted by 260 km s-1.
References
- Benz (2008) Benz, A. O. 2008, Living Reviews in Solar Physics, 5, 1
- Cassak et al. (2013) Cassak, P. A., Drake, J. F., Gosling, J. T., et al. 2013, ApJ, 775, L14
- Cheng et al. (2010) Cheng, X., Ding, M. D., Zhang, J. 2010, ApJ, 712, 1302
- Ciaravella & Raymond (2008) Ciaravella, A., Raymond, J. C. 2008, ApJ, 686, 1372
- Culhane et al. (2007) Culhane, J. L., et al. 2007, Sol. Phys., 243, 19
- Del Zanna et al. (2011) Del Zanna, G., O′Dwyer, B., Mason, H. E. 2011, A&A, 535, A46
- De Pontieu et al. (2014) De Pontieu, B., et al. 2014, Sol. Phys., 289, 2733
- Doschek et al. (2014) Doschek, G. A., McKenzie, D. E., Warren, H. P. 2014, ApJ, 788, 26
- Fisher et al. (1985) Fisher, G. H., Canfield, R. C., McClymont, A. N. 1985, ApJ, 289, 425
- Fletcher et al. (2011) Fletcher, L., et al. 2011, Space Sci. Rev., 159, 19
- Gao et al. (2014) Gao, G.-N., Wang, M., Lin, J., Wu, N., Tan, C.-M., Kliem, B., Su, Y. 2014, RAA, 14, 843
- Guo & Giacalone (2012) Guo, F., Giacalone, J. 2012, ApJ, 753, 28
- Guo et al. (2014) Guo, L.-J., Bhattacharjee, A., Huang, Y.-M., Innes, D. E. 2014, arXiv:1406.3305
- Hara et al. (2011) Hara, H., Watanabe, T., Harra, L. K. 2011, ApJ, 741, 107
- Hudson (2000) Hudson, H. S. 2000, ApJL, 531, L75
- Innes (2003) Innes, D. E., McKenzie, D. E., Wang, T.-J. 2003, Sol. Phys., 217, 267
- Landi et al. (2013) Landi, E., Young, P. R., Dere, K. P., Del Zanna, G., & Mason, H. E. 2013, ApJ, 763, 86
- Lemen et al. (2012) Lemen, J. R., et al. 2012, Solar Phys., 275, 17
- Ko et al. (2003) Ko, Y.-K., Raymond, J. C., Lin, J., et al. 2003, ApJ, 594, 1068
- Kong et al. (2013) Kong, X.-L., Li. G., Chen, Y. 2013, ApJ, 774, 140
- Li & Ding (2011) Li, Y., Ding, M. D. 2011, ApJ, 727, 98
- Li et al. (2014) Li, Y., Ding, M. D., Qiu, J., Cheng, J. X. 2014, submitted to ApJ
- Li et al. (2013) Li, G., Kong, X., Zank, G., & Chen, Y. 2013, ApJ, 769, 22
- Li & Zhang (2009) Li, L.-P., & Zhang, J. 2009, ApJ, 703, 877
- Lin et al. (2005) Lin, J., et al. 2005, ApJ, 622, 1251
- Lin et al. (2002) Lin, R. P., et al. 2002, Sol. Phys., 210, 3
- Liu et al. (2009) Liu, W., Petrosian, V., Mariska, J. T. 2009, ApJ, 702, 1553
- Liu et al. (2013) Liu, W., Chen, Q.-R., Petrosian, V. 2013, ApJ, 767, 168
- Liu (2013) Liu, R. 2013, MNRAS, 434, 1309
- Liu et al. (2010) Liu, R., et al. 2010, ApJ, 723, L28
- Magara et al. (1996) Magara, T., Mineshige, S., Yokoyama, T., & Shibata, K. 1996, ApJ, 466, 1054
- Mason et al. (1986) Mason, H. E., Shine, R. A., Gurman, J. B., Harrison, R. A. 1986, ApJ, 309, 435
- McKenzie & Hudson (1999) McKenzie, D. E., Hudson, H. S. 1999, ApJ, 519, L93
- Masuda et al. (1994) Masuda, S., Kosugi, T., Hara, H., et al. 1994, Nature, 371, 495
- Milligan & Dennis (2009) Milligan, R. O., Dennis, B. R. 2009, ApJ, 699, 968
- Reeves et al. (2008) Reeves, K. K., Seaton, D. B., Forbes, T. G. 2008, ApJ, 675, 868
- Savage et al. (2010) Savage, S. L., et al. 2010, ApJ, 722, 329
- Savage et al. (2012a) Savage, S. L., McKenzie, D. E., Reeves, K. K. 2012a, ApJ, 747, L40
- Savage et al. (2012b) Savage, S. L., et al. 2012b, ApJ, 754, 13
- Song et al. (2012) Song, H. Q., Kong, X. L., Chen, Y., et al. 2012, Sol. Phys., 276, 261
- Su et al. (2013) Su, Y., Veronig, A. M., Holman, G. D., et al. 2013, Nature Physics, 9, 489
- Takasao et al. (2012) Takasao, S., Asai, A., Isobe, H., & Shibata, K. S. 2012, ApJ, 745, L6
- Tsuneta & Naito (1998) Tsuneta, S.,, & Naito, T. 1998, ApJL, 495, L67
- Wang et al. (2007) Wang, T. J., Sui, L. H. & Qiu, J. 2007, ApJ, 661, L207
- Vernazza et al. (1981) Vernazza, J. E., Avrett, E. H., Loeser, R. 1981, ApJS, 45, 635
- Warmuth et al. (2009) Warmuth, A., Mann, G., & Aurass, H. 2009, A&A, 494, 677
- Yokoyama et al. (2001) Yokoyama, T., Akita, K., Morimoto, T., et al. 2001, ApJ, 546, L69
- Young et al. (2013) Young, P. R., Doschek, G. A., Warren, H. P., Hara, H. 2013, ApJ, 766, 127
- Young et al. (2014) Young, P., Tian, H., Jaeggli, S. 2014, submitted to ApJ