-titleProbing stellar structure and evolution with asteroseismology
Échelle diagrams and period spacings of g modes in Doradus stars from four years of Kepler observations
Abstract
We use photometry from the Kepler Mission to study oscillations in Doradus stars. Some stars show remarkably clear sequences of g modes and we use period échelle diagrams to measure period spacings and identify rotationally split multiplets with and . We find small deviations from regular period spacings that arise from the gradient in the chemical composition just outside the convective core. We also find stars for which the period spacing shows a strong linear trend as a function of period, consistent with relatively rapid rotation. Overall, the results indicate it will be possible to apply asteroseismology to a range of Dor stars.
Gravity modes are extremely valuable for probing stellar interiors. Asteroseismology using g modes has so far produced very good results on three classes of highly evolved stars, namely white dwarfs W+K2008 , sdB stars kepler-reed++2011-compact-VIII and red giants kepler-bedding++2011-rg-nature ; kepler-beck++2012-rg-rotation ; kepler-mosser++2012-rg-rotation . Excellent results have also been obtained for a few SPB stars (slowly pulsating B stars), which lie on the upper main sequence corot-degroote++2010-hd50230-nature ; papics++2012-hd43317 . However, the g modes lower on the main sequence, which occur in Doradus stars, have proved much more difficult to exploit. They typically have periods close to one day, which makes ground-based study exceedingly difficult. Furthermore, as we show here, they have very dense frequency spectra. Even the first month or so of Kepler data, which revealed many stars with g modes (and many hybrids having both g and p modes), was not enough to properly resolve their frequency spectra kepler-grigahcene++2010-hybrids . With four years of nearly-continuous photometry from Kepler, we are finally in a good position to apply asteroseismology to Dor stars.
Applying asteroseismology requires identifying which modes are excited. In Dor stars, we are guided by the expectation that g modes should be approximately equally spaced in period, at least for slow rotators. So far, only one Dor star has been reported with a clearly measured period spacing. This is KIC 11145123, which was found to have a series of rotationally split triplets with a regular period spacing of s kurtzetal2014 . Here, we look at this star and other Dor pulsators in the Kepler field and show that some of them have remarkably clear sequences of g modes.
Solar-like stars have p-mode oscillations that are approximately equally spaced in frequency. The so-called échelle diagram is made by dividing the frequency spectrum into equal segments and stacking them one above the other so that modes with a given degree align vertically in ridges GFP83 . Any departures from regularity are clearly visible as curvature in the échelle diagram. For g-modes, the regularity is in period rather than frequency, which suggests the use of a period échelle diagram kepler-bedding++2011-rg-nature . Note that the period spacing of g modes decreases with angular degree according to , which means a different échelle diagram is needed for each value of .
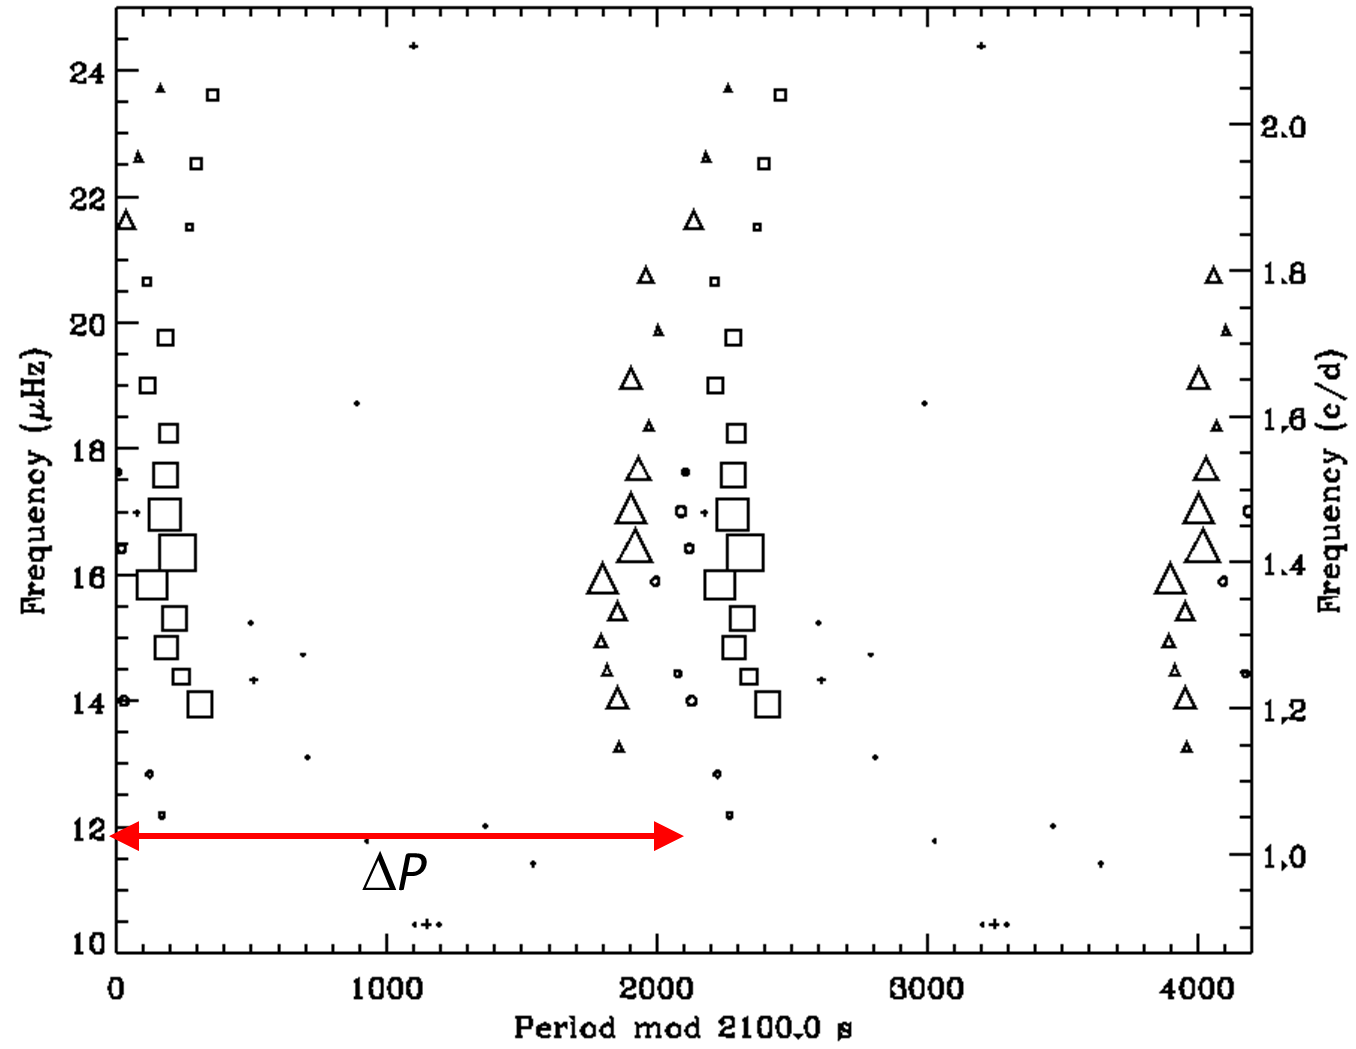
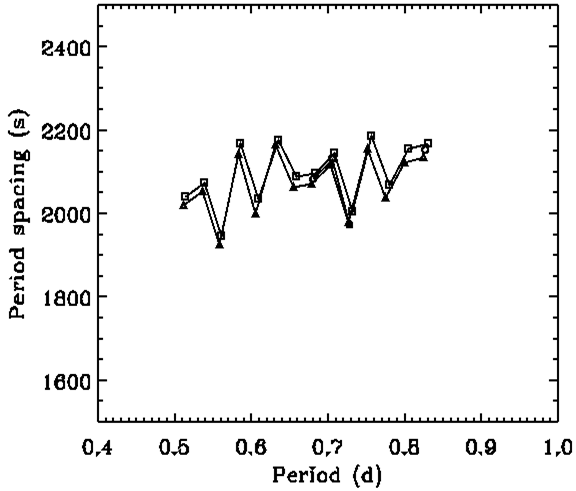
Figure 1 (left panel) shows the period échelle diagram for KIC 11145123 kurtzetal2014 , plotted twice for clarity. The peaks shown in this diagram were extracted by iterative sine-wave fitting, also known as “CLEAN” or “prewhitening”, and the symbol size indicates mode amplitude. The diagram clearly shows a series of triplets, although is weak and is only visible in some orders. We also see “wiggles”, which indicate small departures from regular spacing. This is further illustrated in the right panel of Fig. 1, which shows pairwise differences between consecutive modes for and . These irregularities were predicted theoretically miglioetal2008 and are caused by the gradient in the chemical composition just outside the convective core. This phenomenon is well studied in white dwarfs, sdBs and SPBs, and is sometimes referred to as mode trapping.
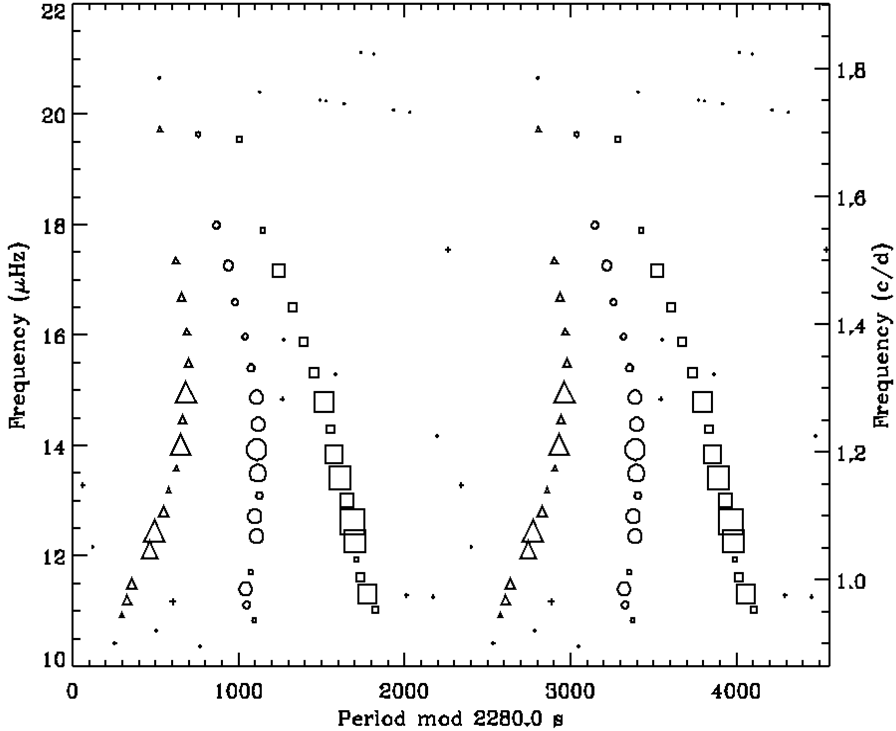
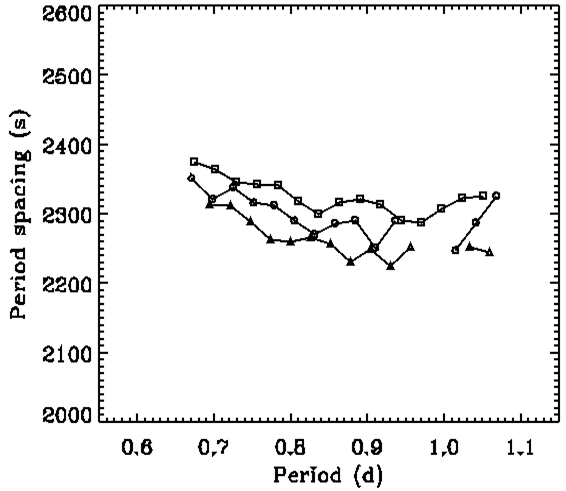
A second example (KIC 9244992) is shown in Fig. 2 and we see a clear sequence of triplets with small deviations in period spacing. As with many of the stars we have examined, almost all the extracted peaks are identified and there are almost no modes missing. This makes these stars very nice for asteroseismology.
Our third example (Fig. 3), is rotating more rapidly. This causes the triplets to overlap and the ridges in the échelle diagram are spread more widely (blue lines). Indeed, finding the correct period spacing requires looking at histogram of pairwise differences and some trial-and-error. Note that the amplitude spectrum (top panel) contains two humps of peaks. Our échelle diagrams indicate that the higher-frequency hump has a period spacing that is times smaller than the lower-frequency hump. This implies that the two humps correspond to modes with and .

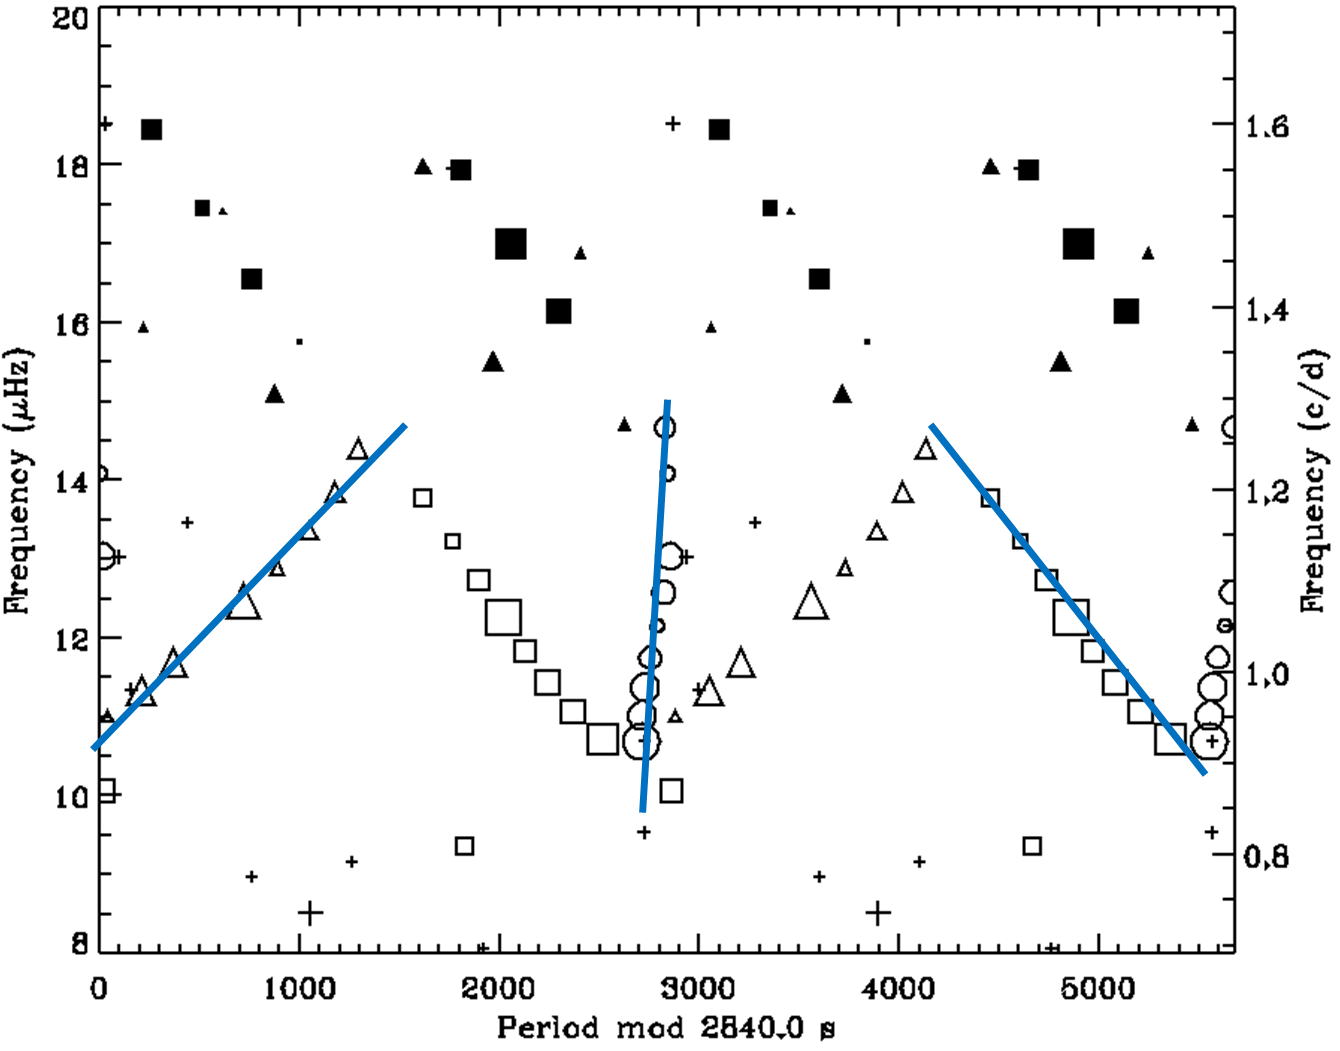
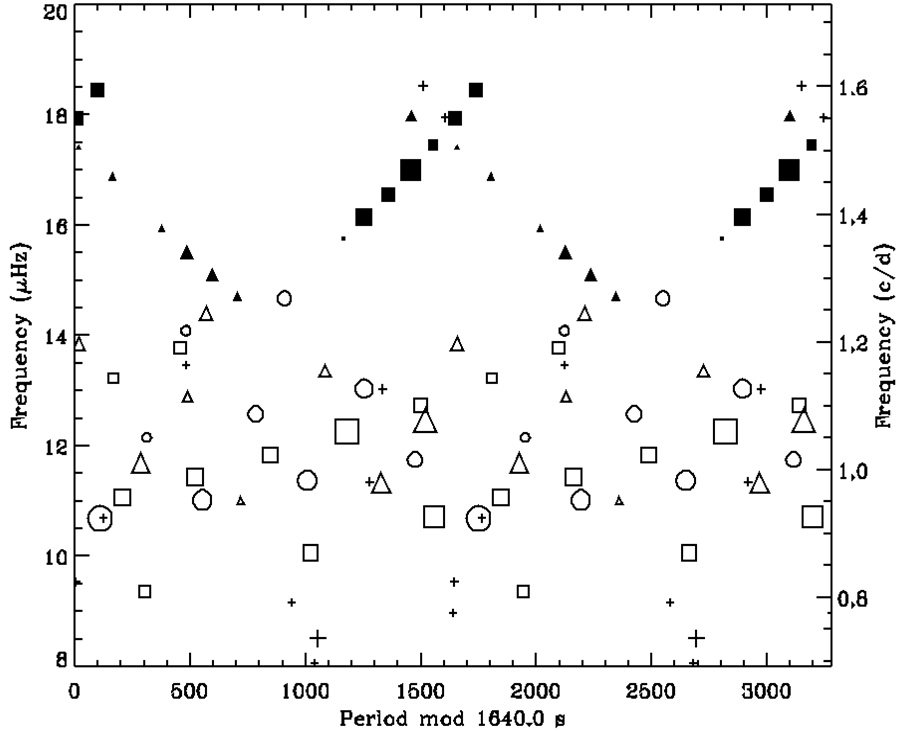
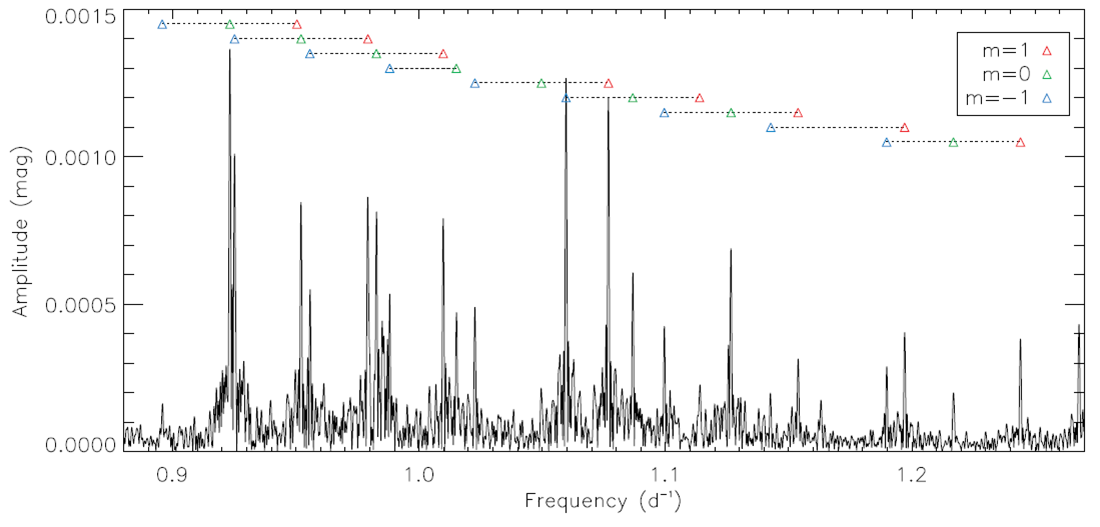
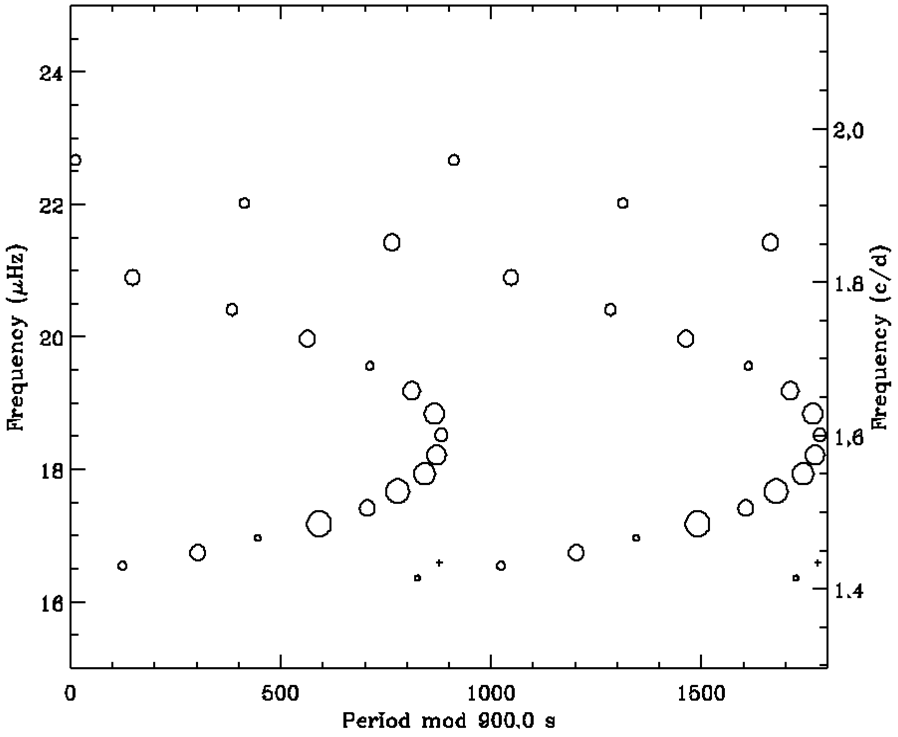
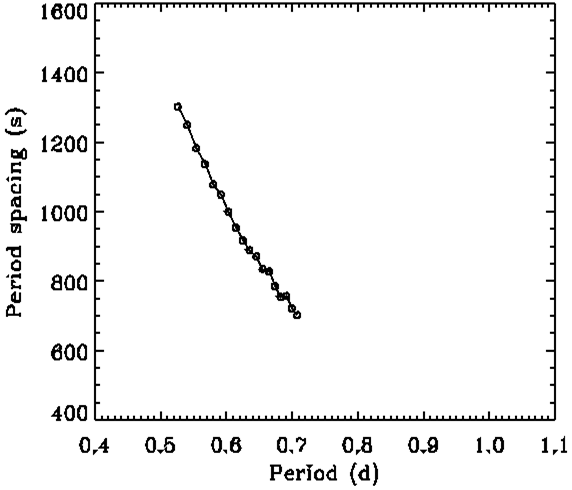
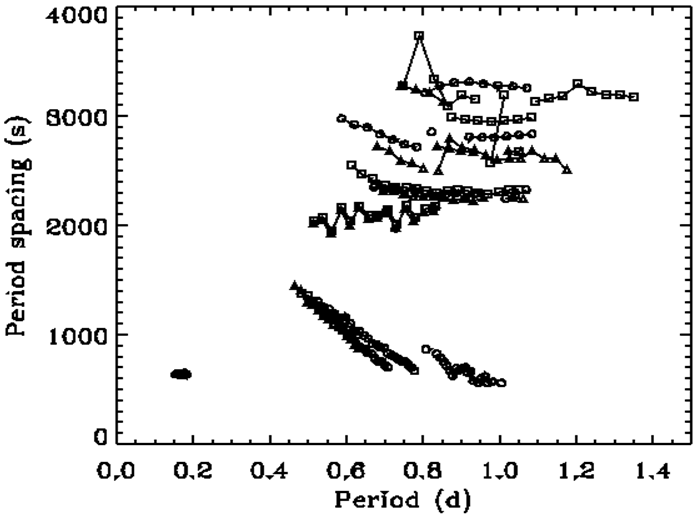
Figure 4 shows an échelle diagram with a single parabolic ridge (left panel), indicating a period spacing that varies linearly with period (right panel). This is consistent with calculations of a rotating star with mixing from diffusion (see Fig. 7 of bouabidetal2013 ). We have found quite a few more examples of this behaviour. Figure 5 combines the stars mentioned in this paper, as well as several others that were shown in the conference talk, including one evolved star having much faster pulsations (0.2 d). Overall, these results indicate the exciting possibility of applying asteroseismology to a range of Dor stars.
References
- (1) Winget, D. E. & Kepler, S. O. ARA&A 46, (2008) 157
- (2) Reed, M. D. et al. MNRAS 414, (2011) 2885
- (3) Bedding, T. R. et al. Nature 471, (2011) 608
- (4) Beck, P. G. et al. Nature 481, (2012) 55
- (5) Mosser, B. et al. A&A 548, (2012) A10
- (6) Degroote, P. et al. Nature 464 (2010) 259
- (7) Pápics, P. I. et al. A&A 542, (2012) A55
- (8) Grigahcène, A. et al. ApJ 713, (2010) L160
- (9) Kurtz D.W. et al. MNRAS 444, (2014) 102
- (10) Grec, G. et al. Sol. Phys. 82, (1983) 55
- (11) Miglio A. et al. MNRAS 386, (2008) 1487
- (12) Bouabid M. P. et al. MNRAS 429, (2013) 2500