Observations of Cepheids with the satellite: Contrast between Pulsation Modes
Abstract
The quantity and quality of satellite photometric data strings is revealing details in Cepheid variation at very low levels. Specifically, we observed a Cepheid pulsating in the fundamental mode and one pulsating in the first overtone with the Canadian MOST satellite. The 3.7-d period fundamental mode pulsator (RT Aur) has a light curve that repeats precisely, and can be modeled by a Fourier series very accurately. The overtone pulsator (SZ Tau, 3.1 d period) on the other hand shows light curve variation from cycle to cycle which we characterize by the variations in the Fourier parameters. We present arguments that we are seeing instability in the pulsation cycle of the overtone pulsator, and that this is also a characteristic of the curves of overtone pulsators. On the other hand, deviations from cycle to cycle as a function of pulsation phase follow a similar pattern in both stars, increasing after minimum radius. In summary, pulsation in the overtone pulsator is less stable than that of the fundamental mode pulsator at both long and short timescales.
keywords:
stars: variables: Cepheids – stars: individual: SZ Tau – stars: individual: RT Aur – techniques: photometric1 Introduction
Classical Cepheid variable stars have light and velocity variations which repeat very precisely. This is in contrast to variations from cycle to cycle sometimes seen in RR Lyrae stars (Szabó et al. 2010). and Type II Cepheids (Sterken & Jaschek 1996). In fact it is the close repeatability in classical Cepheids which allows us to watch them evolve, that is to change their periods as they move through the instability strip in the HR diagram.
We have a few examples of changes in the light curves of Cepheids, partly due to new precision and long duration of observations. V473 Lyr (Burki et al. 1986) has a large change in amplitude over a period of about 4 years, resembling the Blazhko effect (Molnár and Szabados 2014). Polaris itself has a variable amplitude which now begins to look cyclic, i.e. pulsation not evolution related (Arellano Ferro 1983; Bruntt et al. 2008). Extensive observations from the WIRE satellite have helped to establish this behavior in Polaris.
The field of view of the Kepler satellite contains numerous RR Lyr stars but only one classical Cepheid, V1154 Cyg. However the extensive photometry of this star has produced an intriguing result (Derekas et al. 2012). Typical behavior of the period variations is a change in the period of approximately 20 minutes which lasts for approximately 15 cycles, but then a return to the mean period. Results for classical Cepheids from the CoRoT satellite by Poretti are expected shortly.
Szabados (1983) has discussed period changes in Cepheids, both fundamental mode pulsators and overtone pulsators (low amplitude ‘s’ Cepheids). Based on his data, Evans, Sasselov & Short (2002) have suggested that the rapid period change in Polaris (an overtone pulsator) is a characteristic of this group, a larger period instability than found in fundamental mode stars.
In order to follow up the discovery of a low level of period instability in the extensive Kepler data in V1154 Cyg and to further investigate differences in period instability between fundamental and overtone mode pulsators, we have obtained sequences of photometry with the MOST (Microvariability and Oscillations of Stars) satellite. The target stars were RT Aur (fundamental mode, d, mag , amplitude of 0.80 mag 111http://www.astro.utoronto.ca/DDO/research/cepheids/, F8 Ib 222http://simbad.u-strasbg.fr/simbad/) and SZ Tau (overtone mode, d, mag, amplitude of 0.33 mag F7 Ib). For comparison, V1154 Cyg is a fundamental mode pulsator with d and amplitude in of 0.40 mag.
2 observations
The MOST satellite is a photometric satellite fully described in Walker et al. (2003), with the first science presented in Matthews et al. (2004).
For SZ Tau, observations were obtained in November 2012 (JD 2 456 238-JD 2 456 257) resulting in a continuous data set covering 19 days with a cadence of 1 minute. For RT Aur, the observations were carried out in December 2012 (JD 2 456 278-JD 2 456 300). For this target, the 22 day-long observations were interleaved with another target, resulting in gaps in the light curve.
Data reduction was done following the standard steps outlined in Rowe et al. (2006a, 2006b). Data can contain an artifact due to scattered earthshine in the MOST 101 minute orbit, resulting in a signal with multiple peaks near 14 c/d. The SZ Tau data were reprocessed beyond the standard processing to greatly reduce this signal. In RT Aur, the effect was not as prominent, but ultimately they were reprocessed also. Along with RT Aur a ‘comparison star’, HD 45237 was observed. This in principle would allow us to assess the quality of MOST photometry by comparing a relatively quiet star’s light variations to that of our Cepheids. HD 45237, which is a K0 IV 7th magnitude star, shows minor variations, totaling less than 0.01 magnitude. Specifically, it shows a low-amplitude, ‘Gaussian-shape’ brightening event in the middle of our observing session lasting for 6 days. Other than that, the frequency spectrum of the star nicely shows the alias frequencies due to the sampling around 14 c/d. We did not use this star further in our analysis.

3 Light curve analysis
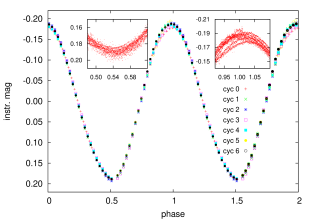
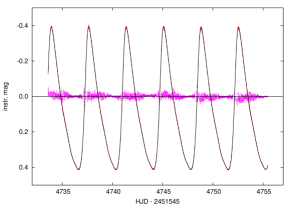
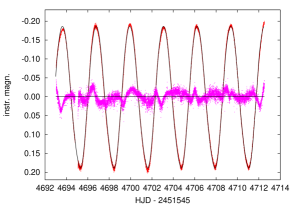
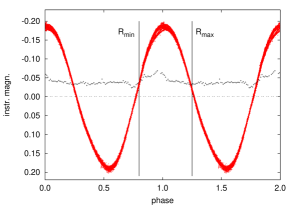
A difference between the light curves of RT Aur and SZ Tau is immediately obvious from the first plots of the light curves. Figure 1 shows the data of RT Aur phased by a period of 3.7348 d and SZ Tau phased by a period of 3.149407 d, respectively. The RT Aur light curve repeats very precisely, notably at maximum light. On the other hand, SZ Tau shows tight sequences at maximum for each cycle which, however, vary in brightness from cycle to cycle. Similar but less pronounced behavior is seen at minimum light.
The next step is to investigate the departures of the data from a strict cycle-to-cycle repetition. In Fig. 1 we plot the consecutive pulsational cycles with different symbols and colors. This figure shows that while the pulsational cycles of RT Aur repeat regularly, there is a considerable deviation in the light variation of SZ Tau, especially around and before the brightness maximum.
The rest of this discussion will be to quantify the contrasting behavior between the fundamental and the overtone pulsators.
The first step in the analysis is to fit a Fourier polynomial to the data:
| (1) |
where is the magnitude, is the amplitude, is the frequency, is the time of observation, is the phase and runs from 1 to , where is 9 and 10 for SZ Tau and RT Aur, respectively. The sequence in was stopped when there were only many low frequency peaks left. Tables LABEL:rtfreqs and LABEL:szfreqs list the result of our Fourier analysis performed by using Period04 (Lenz & Breger, 2005), i.e. frequencies, amplitudes, and phases and their errors for RT Aur and SZ Tau. Frequencies identified as harmonics of the fundamental oscillation are indicated in the first column. Other frequencies found in the analysis are listed in the tables (in the order of increasing frequency) but are not included in further analysis.
| ID | Frequency () | Amplitude () | Phase () | S/N |
|---|---|---|---|---|
| d-1 | mag | rad | ||
| f0 | 0.26819 (0.00001) | 0.34690 (0.00009) | 0.40947 (0.00004) | 4954 |
| 2f0 | 0.53639 (0.00002) | 0.12895 (0.00009) | 0.23672 (0.00011) | 1840 |
| 3f0 | 0.80458 (0.00004) | 0.05576 (0.00009) | 0.06397 (0.00024) | 795 |
| 4f0 | 1.07277 (0.00009) | 0.02515 (0.00009) | 0.92108 (0.00053) | 357 |
| 5f0 | 1.34097 (0.00020) | 0.01098 (0.00009) | 0.72003 (0.00123) | 155 |
| 6f0 | 1.60916 (0.00037) | 0.00582 (0.00009) | 0.54719 (0.00230) | 81 |
| 7f0 | 1.87736 (0.00075) | 0.00293 (0.00009) | 0.37458 (0.00472) | 40 |
| 8f0 | 2.14555 (0.00147) | 0.00149 (0.00009) | 0.16564 (0.00917) | 19 |
| 9f0 | 2.41374 (0.00248) | 0.00078 (0.00009) | 0.00967 (0.01546) | 9 |
| 10f0 | 2.68194 (0.00344) | 0.00055 (0.00009) | 0.81981 (0.02165) | 6 |
| 0.03766 (0.00869) | 0.00113 (0.00619) | 0.52539 (0.00839) | 14 | |
| 0.08529 (0.00990) | 0.00103 (0.00505) | 0.68228 (0.00828) | 13 | |
| 0.18232 (0.00210) | 0.00088 (0.00009) | 0.63075 (0.01142) | 11 |
| ID | Frequency () | Amplitude () | Phase () | S/N |
|---|---|---|---|---|
| d-1 | mag | rad | ||
| f0 | 0.31752 (0.00001) | 0.18800 (0.00001) | 0.44034 (0.00002) | 6526 |
| 2f0 | 0.63307 (0.00010) | 0.00811 (0.00002) | 0.61723 (0.00041) | 280 |
| 3f0 | 0.95463 (0.00023) | 0.00374 (0.00002) | 0.71700 (0.00092) | 128 |
| 4f0 | 1.27259 (0.00057) | 0.00130 (0.00002) | 0.00012 (0.00250) | 43 |
| 5f0 | 1.59586 (0.00077) | 0.00077 (0.00002) | 0.95622 (0.00416) | 25 |
| 6f0 | 1.91050 (0.00092) | 0.00062 (0.00002) | 0.39391 (0.00501) | 20 |
| 7f0 | 2.22325 (0.00097) | 0.00059 (0.00002) | 0.50797 (0.00466) | 19 |
| 8f0 | 2.54686 (0.00103) | 0.00054 (0.00002) | 0.94617 (0.00573) | 17 |
| 9f0 | 2.86753 (0.00146) | 0.00038 (0.00002) | 0.15596 (0.00812) | 11 |
| 0.04669 (0.00066) | 0.00125 (0.00002) | 0.93945 (0.00309) | 42 | |
| 0.18431 (0.00193) | 0.00074 (0.00003) | 0.61063 (0.00441) | 24 | |
| 0.24663 (0.00050) | 0.00275 (0.00003) | 0.53542 (0.00122) | 94 | |
| 0.49502 (0.00060) | 0.00168 (0.00002) | 0.92675 (0.00288) | 57 | |
| 0.54126 (0.00043) | 0.00243 (0.00002) | 0.74911 (0.00192) | 83 | |
| 1.07039 (0.00330) | 0.00113 (0.00014) | 0.44314 (0.00679) | 38 | |
| 1.11149 (0.00426) | 0.00087 (0.00010) | 0.79006 (0.04108) | 29 | |
| 1.14850 (0.00323) | 0.00099 (0.00011) | 0.01984 (0.10169) | 33 | |
| 1.39226 (0.00074) | 0.00088 (0.00002) | 0.76267 (0.00361) | 29 |
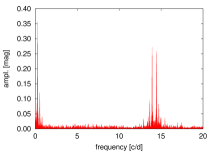
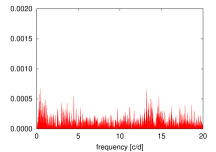
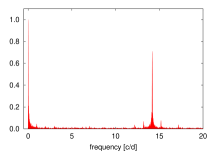
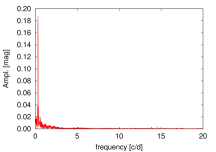
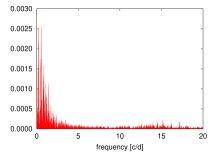
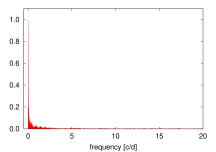
Figures 2 and 3 show the Fourier spectra of RT Aur and SZ Tau, respectively. In the left and center panels of Fig. 2, the Fourier spectrum of RT Aur is shown (left) and then again prewhitened by the 10 harmonics in Table LABEL:rtfreqs (center). A residual orbital signal near 14 c/d is apparent in similar figures which extend out to that frequency because the target was interleaved with another target. The prewhitened spectrum (Fig. 2 center) shows that the removal of the main frequency and its harmonics reduces the signal from the star to noise. The right panel of Fig. 2 is the window function for RT Aur. Fig. 3 provides the Fourier spectrum for SZ Tau. The prewhitened spectrum (Fig. 3 center) with the harmonics of the pulsational frequency in Table LABEL:rtfreqs removed, however, leaves a complicated pattern of frequencies. This contrasts to the reduction to a noise spectrum in the prewhitened RT Aur spectrum (Fig. 2 center).
The noise level and were estimated from a quiet portion of the Fourier spectrum (Figs. . 2 and 3 center). By noise in RT Aur’s Fourier spectrum we mean the average of the residuals after removing f0 and its harmonics, which we find featureless. Sigmas in Tables 1 and 2 are the uncertainty of a given fitted parameter determined with the Monte Carlo simulation performed using Period04. For RT Aur and SZ Tau they are noise: 1.3 10-4 and 4.9 10-5, respectively. The S/N in Tables 1 and 2 was generated using these values.
3.1 Comparison of SZ Tau and RT Aur
The RT Aur data are well represented by Fourier series for a single frequency and its harmonics and the pattern due to the orbit of the satellite. The SZ Tau data, on the other hand, have deviations from the Fourier fit.
3.1.1 Light curve stability
In Section 3 we showed that the fundamental pulsator RT Aur has the expected behavior for a Cepheid. While there is some scatter for the moments of maximum brightness, the median brightness on the ascending branch repeats in a strictly regular manner. (Median brightness is the average value of the adjacent minimum and maximum, which is not identical to the mean magnitude calculated for the complete pulsational cycle). The other MOST Cepheid, SZ Tauri (overtone pulsator) shows perceptible cycle-to-cycle changes. In this section we will consider how this contrasting stability of the light curves of a fundamental mode and an overtone mode pulsator is manifested in the Fourier parameters. For this, we fitted a high-order Fourier polynomial at the primary frequency and its harmonics using Equation 1 for each cycle. Then, we characterized the light-curve shapes with the Fourier parameters (Simon & Teays 1982), and show results for .

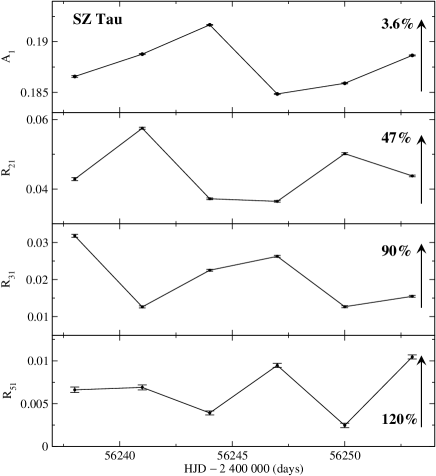
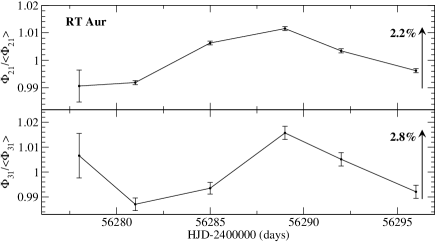

The top left panel of Fig. 4 shows the amplitude of RT Aur for the 6 cycles covered. The arrows in each panel show the approximate range of variation between cycles, together with the percentage of variation. Note that the variation in this amplitude is only about 0.9% between the cycles. In SZ Tau (top right panel in Fig. 4) the variation in the Fourier amplitude is 3.6%. Similarly, the variation of the amplitudes , , and is shown in Fig. 4 for RT Aur (lower left panels) and for SZ Tau (lower right panels). For RT Aur , , and vary by approximately 1.5%, 3.2%, and 9.2% respectively. For SZ Tau, the respective variations are closer to 50%, 100% and 120%. Similarly, the variations in phase parameters and are modest in RT Aur (left panels in Fig. 5) but much larger in SZ Tau (right panels in Fig. 5).
In summary, all the light curve quantities are much more variable in SZ Tau than in RT Aur. We can also compare the variations in RT Aur with those of the fundamental mode Cepheid in the Kepler field (V1154 Cyg), which has a much longer series of observations (Derekas et al. 2012). The amplitude for V1154 Cyg has comparably small variations over the intervals that correspond to the length of the MOST observations. However, on time scales as long as a year it has larger amplitude variations. Thus there may be larger variations than we have seen in the MOST RT Aur data, but it is on a much longer time scale. Other Fourier parameters in V1154 Cyg have variations comparable to those of RT Aur.
3.1.2 Phase dependence
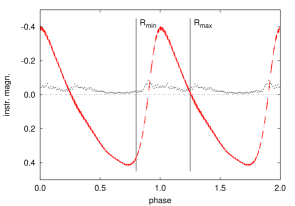
To further study the deviations from the Fourier representation of SZ Tau, Fig. 6 (right) shows the deviations from the 9-term representation. The high quality of the data allows us to inspect individual cycles of the two stars. As a comparison, the left panel of Fig. 6 features the much smaller residuals of RT Aur. These small residuals show clear pattern however. They almost vanish around minimum light, and are larger in other pulsational phases. For SZ Tau, there are some differences in the residuals from cycle to cycle (Fig. 6 top right). However, the deviations have a reasonably consistent pattern, including sharp inflections following minimum radius (Fig. 6, top right). When the standard deviations between cycles are created as a function of phase (Fig. 6 bottom), the phase dependence is surprisingly similar for RT Aur (left) and SZ Tau (right). That is both the fundamental and overtone pulsators show an increased standard deviation around minimum radius when the next pulsation cycle is initiated by a “shove” from the pulsation piston. After maximum radius, the “coasting phase” the deviations between cycles decrease, and remain small until the “shove” from the next cycle.
4 diagrams


To put the MOST observations into the long-term context, Fig. 7 shows the diagrams of both stars and Fig. 8 shows the diagrams from the MOST observations.
4.1 RT Aur
For RT Aur, several studies of the variations in the pulsation period are available in the literature, of which the latest are: Szabados (1991), Berdnikov et al. (2003), Meyer (2004), and Turner et al. (2007). The diagram based on the normal brightness maxima published by Turner et al. (2007) is shown in the left panel of Fig. 7. Their Tables 2 and 3 are used, but data with an assigned weight less than 1 have been omitted and several values based on photometric data which they omitted are included, as well as the new MOST data. The new set of normal maxima together with references is listed in Table 3, which is available in the electronic version. In that table the residuals correspond to the updated ephemeris:
| (2) |
This ephemeris was obtained by a weighted linear least squares method based on the tabulated normal maxima. A weight of 1, 2 , or 3 has been assigned to the individual data series depending on the number and quality of the data points. For a better visualization, we only plotted the most reliable residuals (those with weights 2 or 3) in the left panel of Fig. 7. Part of the scatter may be due to the uncertainty in the determination of the moments of individual normal maxima. However, another cause is also present. The 0.05 day difference within 3 weeks between the values for the brightness maxima (denoted as open circles in the left panel of Fig. 8) from the accurate and uninterrupted MOST data is intrinsic to stellar pulsation. It is also seen, however, that the pulsation period of RT Aur is very stable for the moments of the median brightness on the ascending branch of the light curve (filled circles in the left panel of Fig. 8). This means that the fluctuation in the values is caused by the slight variability in the shape of the light curve. In fact, the 0.05 day fluctuation in the MOST values corresponds to 1.3% of the pulsation period which is quite compatible with the fluctuations of the Fourier amplitude and phase parameters visualized in the left panel of Fig. 6.
| JD⊙ | Data source | |||
|---|---|---|---|---|
| 2 400 000 | (d) | |||
| 20957.478 | 5570 | 0.091 | 1 | Turner et al. (2007) |
| 22784.241 | 5080 | 0.009 | 1 | Turner et al. (2007) |
| 26419.438 | 4105 | 0.157 | 2 | Turner et al. (2007) |
| 26971.249 | 3957 | 0.186 | 2 | Turner et al. (2007) |
| 27504.400 | 3814 | 0.197 | 1 | Turner et al. (2007) |
In RT Aur the diagram (period change; left panel of Fig. 7) has relatively smooth variation. If the pattern of the residuals is approximated by a positive parabola, then the rate of period increase is 0.000986 d/century. The pattern of the residuals of RT Aur has been interpreted in different ways, from a simple parabola (Fernie 1993) to a more complicated form (Turner et al. 2007). The amplitude from the variations, however, is commensurate with an evolutionary time scale, and as noted by Fernie, is much smaller than that of the first overtone pulsator Polaris. Turner et al. interpret a wavelike structure to the residuals as light-time effect in a very long period orbit (26429 days = 72 years); however, they find this difficult to reconcile with the constraints on the companion. We present a summary of the systemic () velocity data in Fig. 9 and Table 4 including the most recent data from Takeda et al. (2013). None of the systemic velocities differs from a band of km s-1 around the mean value by more than 1 , making it unlikely that orbital motion has been detected, although a tendency of a slight decrease in the -velocity values is noticeable. Further observations are necessary to clarify the question of binarity of RT Aur.
| JD | Data source | ||
|---|---|---|---|
| 2 400 000 | (km s-1) | (km s-1) | |
| 18230 | 21.0 | 0.5 | Petrie (1932) (obs.: Duncan) |
| 21210 | 19.9 | 2.0 | Kiess (1917) |
| 24800 | 21.0 | 0.5 | Petrie (1932) |
| 40979 | 19.8 | 1.0 | Evans (1976) |
| 43449 | 19.2 | 1.5 | Wilson et al. (1989) |
| 43457 | 19.7 | 1.0 | Beavers & Eitter (1986) |
| 43962 | 18.0 | 2.0 | Barnes et al. (1987) |
| 45717 | 20.0 | 1.0 | Gieren (1985) |
| 46866 | 19.7 | 1.5 | Gorynya et al. (1996) |
| 48600 | 19.3 | 0.5 | Gorynya et al. (1996) |
| 50100 | 20.0 | 0.5 | Gorynya et al. (1996) |
| 50350 | 20.0 | 0.8 | Kiss (1998) |
| 55110 | 18.5 | 0.5 | Takeda et al. (2013) |
4.2 SZ Tau
SZ Tau, on the other hand, has more erratic variations in its diagram, and in particular, times when the is increasing alternating with periods when it is decreasing. That is, periods are neither monotonically increasing nor decreasing as expected for evolution through the instability strip. diagrams showing the variability of the pulsation period for many stars are available in Szabados (1977, 1991) and Berdnikov & Pastukhova (1995). These latter authors approximated the graph of SZ Tau with a parabola implying a continuous period decrease with erratic changes superimposed. According to Szabados (1977, 1991), however, the linear sections in the graph imply that there are preferred values of the period to which the Cepheid returns during its pulsation on a time scale of several years-decades. The residuals based on previous photoelectric and CCD observations are plotted in the right panel of Fig. 7, extending the time base by two decades as compared with the latest one by Berdnikov & Pastukhova (1995).
The residuals based on all available accurate (photoelectric or CCD) measurements are listed in Table 5 together with the references in the electronic version. For low-amplitude Cepheids, such as SZ Tau, the preferred light-curve feature for studies is not the moment of the light maximum because of the large uncertainty in determining the phase of the brightness extremum during the shallow variation. Instead, the behaviour of the pulsation period can be followed by studying the moment of the median brightness on the ascending branch of the light curve where the variations in the brightness are the steepest during the pulsational cycle (see Sect. 2.2 in Derekas et al. 2012). The residuals are determined from the band light curves (or the nearest band to it), and refer to the moments of median brightness on the ascending branch corresponding to the ephemeris:
| (3) |
A least squares linear fit has been applied to the residuals after = HJD 2,447,450 that resulted in Eq. 3. The resulting diagram is plotted in the right panel of Fig. 7. Table 5 contains some residuals based on photoelectric observations obtained with the photometer attached to the 50 cm Cassegrain telescope at the Piszkéstető Mountain Station of the Konkoly Observatory between 1991 and 2003. The individual photometric data are listed in Table 6 (observer: L. Szabados). The full table is provided in the electronic version.

| JD⊙ | Data source | |||
|---|---|---|---|---|
| 2 400 000 + | (d) | |||
| 32851.7111 | 1970 | 0.2719 | 3 | Eggen (1951) |
| 35541.0382 | 1116 | 0.0116 | 1 | Walraven et al. (1958) |
| 37619.1476 | 456 | 0.0626 | 3 | Mitchell et al. (1964) |
| 37962.1697 | 347 | 0.2556 | 1 | Williams (1966) |
| 38528.9506 | 167 | 0.2521 | 3 | Wisniewski & Johnson (1968) |
| JD⊙ | |||
|---|---|---|---|
| 2 400 000 + | (mag) | (mag) | (mag) |
| 48593.5264 | 6.385 | 0.739 | 0.526 |
| 48594.5173 | 6.616 | 0.874 | 0.612 |
| 48646.3869 | 6.488 | 0.779 | 0.528 |
| 48647.3421 | 6.431 | 0.758 | 0.562 |
| 49032.3006 | 6.670 | 0.875 | 0.615 |
The scatter of the plot for the last decades where the pulsation period was approximated as a constant value of 3.148763 d exceeds the observational uncertainty, and this is the case for the residuals derived from the MOST data, as well. Cycle-to-cycle period change is present in the right panel of Fig. 8, similar to V1154 Cyg. The period in individual cycles varies within 0.7% of the average value of the pulsation period. On a longer time scale, there are erratic cycle-to-cycle variations (right panel of Fig. 7).
4.3 Pulsation mode
The erratic cycle-to-cycle variation of SZ Tau (as compared with RT Aur) is characteristic of overtone pulsators (e.g. Fig. 2 in Berdnikov et al. 1997). In the past shorter data strings have been fitted to parabolas implying to rapid period changes (see Szabados 1983) but more extensive data appear to suggest that for many overtone pulsators the period variations are more complicated than simple monotonic changes.
The rigorous interpretation of diagrams has been discussed extensively by Koen (2006), based on the combination of measurement error, a long term change in period, and random changes in the period. Specifically, he demonstrates that it is possible for random changes in the period to mimic long term changes in the period. Full analysis of the period changes in Figure 7 is beyond the scope of this paper, but we will put the charactistics of the overtone (SZ Tau) in context, and discuss instances where the diagram is consistent with a Koen dominant long term variation, and where it is consistent with a Koen dominant random period jitter.
In this section, we develop a qualitative summary of period variation in overtone Cepheids based on the curves of Berdnikov et al. (1997) of low amplitude Cepheids. The first step is to confirm the pulsation mode. For this we have used primarily the classifications of Groenewegen & Oudmaijer (2000), Kienzle et al. (1999) and Sachkov (1997). The pulsation mode of V1334 Cyg was discussed by Evans (2000) and the pulsation mode of V473 Lyr by Burki et al. (1986). FF Aql was found not to be an overtone pulsator by Benedict et al. (2007). In 3 cases, (GI Car, V532 Cyg, and VZ CMa) the star was classified as an overtone pulsator by Kienzle et al. but not Groenewegen & Oudmaijer. We have retained the overtone designation since the sensitivity to pulsation mode varies depending on both the period ranges and the diagnostic itself.
We then have used the diagrams of Berdnikov et al., and identified three categories of period change. First, 7 stars (EU Tau, UMi, SU Cas, GI Car, V1726 Cyg, V473 Lyr [second overtone pulsator], and UY Mon) were found to have diagrams consistent with a parabolic fit (Figs. 1 and 2 in Berdnikov et al.) all indicating increasing period (discussed below). Only EU Tau and UMi, however, have diagrams which were unquestionably parabolic fits, showing period variation which is particularly rapid. These are consistent with the Koen class of long term period variation.
In the second group, 7 other stars (BY Cas, V379 Cas, DT Cyg, V532 Cyg, DX Gem, EV Sct, and SZ Tau; Figs. 3 and 4 in Berdnikov et al.) clearly have variations in their diagrams, but the variations switched from between positive and negative and back in an apparently cyclic way. SZ Tau (right panel of Fig. 7) exhibits this behavior. This “activity” in the period is clearly not caused by monotonic evolution through the instability strip, and suggest a that Koen period jitter is dominant. The excursions around a mean period suggest a pulsation related cause rather than a secular change due to evolution.
There is a third group of 15 stars (VZ CMa, GH Car, V419 Cen, BG Cru, V1334 Cyg, V526 Mon, QZ Nor, V440 Per, EK Pup, MY Pup, V335 Pup, V950 Sco, AH Vel, FZ Car, and AZ Cen; Fig. 5 in Berdnikov et al.) which have no pattern in the photometric residuals. This may be because the data series are not long enough, or the values are not accurate enough or in many cases the gaps between the times of observation obscure any correlation. It is likely that at least some of these have period jitter, possibly at a lower level and over a longer time scale than the more prominent fluctuations in the first two groups.
In summary, the photometric monitoring of these 29 overtone pulsators shows that nearly half of them have period variation. This includes the second group showing substantial period jitter. Thus on the scale of decades there is evidence of considerable period variation in overtone pulsators, including both the Koen categories of long term change and random period jitter.
5 Discussion
The MOST observations display two characteristics of pulsation not seen before in less plentiful and less accurate data. First, the light curves as exhibited by the Fourier parameters are more variable in the overtone pulsator SZ Tau than in the fundamental mode pulsator RT Aur. On the other hand, the differences between cycles display a similar pattern as a function of phase (Fig. 6). We have made preliminary explorations for explanations as discussed in the sections below.
5.1 Mode dependence
The intensive observations of RT Aur and SZ Tau with the MOST satellite have demonstrated that the overtone pulsator (SZ Tau) has more instability in its pulsation cycle than the fundamental mode Cepheid (RT Aur). This is apparent in simple repetition of the light curve from cycle to cycle (Figs. 1 and 2), the Fourier spectrum of the observations (Figs. 3 and 4), the Fourier parameters cycle by cycle (Figs. 5 and 6) and the diagrams (Figs. 8 and 9). As a preliminary consideration, we note that the node of a first overtone pulsator occurs higher in the envelope than that of a fundamental mode pulsator. This may create differences in the pulsation even for stars of reasonably similar period, mass, and temperature.
5.2 Effect of turbulent convection
The quality and quantity of MOST and Kepler satellite observations has revealed changes in the periods and light curves of SZ Tau and V1154 Cyg. Explanations due to evolution, mass loss, and binary light-time effect are not adequate for the nonmonotonic variations as discussed in Section 5.3. It is suggested that there is an instability in the pulsation itself which is responsible.
In order to check whether turbulent convection in the partial ionization zones can cause cycle-to-cycle light curve variations we computed models with the Florida-Budapest code (Kolláth et al. 2002). We used similar parameters and settings as Szabó, Buchler & Bartee (2007). To study SZ Tau we computed an overtone pulsator model, with a mass of 5.25 M⊙, and = 6075 K and solar metallicity. The model has a linear overtone period of 3.106 days.
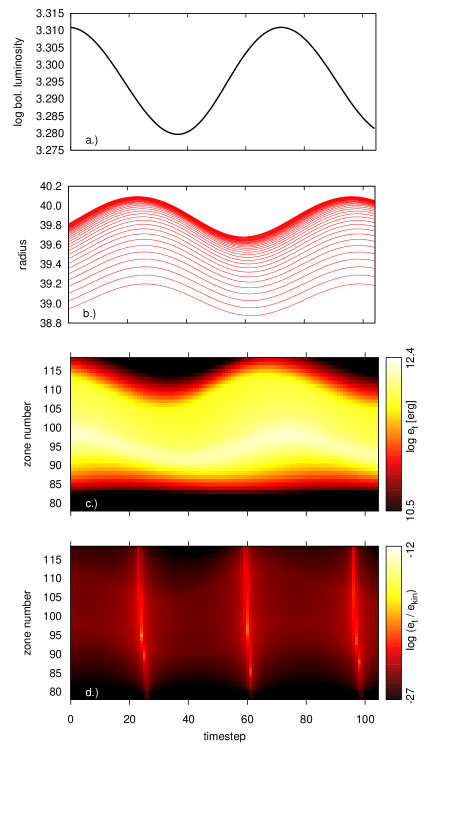
Figures 10a and 10b show the variation of the bolometric luminosity and the radii of the topmost layers of the model after reaching its limit cycle corresponding to the radial first overtone mode, respectively. In panel c we plot the turbulent energy as a function of time and zone number (from 78 to 121). The magnitude of the turbulent energy is color coded. This range of zones captures the hydrogen ionization zone featuring the strongest turbulent energy throughout the pulsational cycle, on the order of erg per zone. The energy is highest where the MOST light curve of SZ Tau shows the largest scatter.
However, the magnitude of the turbulent energy content is negligible compared to the kinetic energy due to the pulsation as is shown in Fig. 10d. Here we show the logarithm of the ratio of the turbulent and kinetic energy for each zone as a function of time. The largest values are attained for the local velocity minima (for a given mass zone), which is the dominant term in this quantity. The discrepancy is huge, the turbulent energy is 10-20 orders of magnitude less than the kinetic energy. Even if the total turbulent energy could be converted to kinetic energy the modulation of the light curve would be still very small. However, the efficiency of the energy transfer is much lower than 100%, therefore we conclude that – at least in our 1D code – the turbulent convection has a negligible effect in altering the light curve shape from cycle to cycle, although it provides the necessary viscosity to control the amplitude. We note in passing that Buchler, Kolláth & Cadmus (2004) found a much more significant turbulent energy in RV Tauri models.
A logical step in this direction would be the use of multi-dimension hydrocodes, such as Mundprecht, Muthsam & Kupka (2013), that would naturally enable the enhancement of turbulent energy or turbulent flux locally (see their Fig. 12) as opposed to the zone-averaged quantities in our 1D simulations. However, given the large difference we found between the kinetic and turbulent energies, it is highly questionable whether the required drastic change can occur in these overtone Cepheid models.
5.3 Period change
Several causes have been suggested for period variations in Cepheids, both fundamental mode pulsators and overtone pulsators:
Evolution through the instability strip: This is almost certainly responsible for some of the period changes seen. While evolution does not necessarily proceed at a uniform pace (Fernie et al. 1993), one direction of period change would predominate and result in a parabolic diagram.
Light-time effects in binary systems: This produces cyclic apparent period changes. They must, however, be consistent with what is known about the orbit of the system. Possibly the best example is AW Per (Welch & Evans 1989). Light-time effect has been suggested to explain the residuals in RT Aur (Turner et al. 2007). However, the velocity variations shown in Fig. 9 indicate no variation larger than 1 km s-1 of the mean. This implies that an orbital velocity variation has not been observed for data drawn from many different instruments over a long time interval.
As discussed above, a substantial fraction (24%) of overtone pulsators have period variations characterized by alternate (though cyclic) increases and decreases.
Light-time effect is the one explanation for period change which is cyclic, but it is not viable for many of the overtone pulsators because of the scale and erratic nature. This implies that these quasi-cyclic period variations are caused by something in the pulsation process itself.
Star spots: Neilson and Ignace (2014) have suggested that the period variations of the Kepler Cepheid V1154 Cyg could be produced by a hot spot on the surface caused by convection. In a study of yellow supergiants including several Cepheids, Percy and Kim (2014) suggest a similar possible cause for amplitude variation, large convection cells causing variation as the star rotates. While starspots could affect the time of maximum light, they would not have a cumulative effect as seen in the diagram.
Mass loss: This has been suggested, for instance by Neilson et al. (2011, 2012), and worked out in detail. However, since periods change monotonically, the quasi-cyclic variations frequently seen in overtone pulsators are not due to mass loss. We note, however, that the period changes in overtone pulsators discussed in Sect. 5 which can reasonably be fit with parabolas all show increasing periods. This is consistent with mass loss, although it may be only one of several factors.
Pulsation: Amplitude variation in Blazhko RR Lyr stars is not fully understood, but one possible explanation is that it is produced by high-order resonance (Buchler and Kolláth 2011). Pulsation and excitation of a complicated group of modes may also play a role in Cepheid period change. Percy and Kim (2014) suggest that convection may drive pulsation mode excitation and hence amplitude variation, and the same might also affect Cepheid periods. As discussed above, the fact that the level of pulsation instability on both short and long timescales appears to depend on pulsation mode suggests a role for pulsation in period changes.
The observed period changes may be due to a combination of these factors. However, the morphology of diagrams, particularly for overtone pulsators, provides some clues. In particular the high fraction of overtone pulsators which have quasi-cyclic period variations is not consistent with stellar evolution nor mass-loss. Furthermore, the size of the variations is too large to uniquely originate from binary light-time effects. Hence the pulsation process itself is indicated as a cause.
6 Conclusions
There are three primary results from the MOST observations of Cepheids.
The observations of a fundamental mode pulsator (RT Aur) and an overtone pulsator (SZ Tau) find greater instability in the pulsation of the overtone Cepheid in the repetition of the light curve and the Fourier parameters.
On the other hand, the deviations between cycles for both RT Aur and SZ Tau follow a similar pattern as a function of phase of increase after minimum radius and a return to a smaller value after maximum radius.
The curves indicate that on a time scale of decades, the period changes of the overtone pulsator are more erratic.
Thus at both long and short time scales, the period variations of RT Aur (fundamental mode) and SZ Tau (overtone mode) differ, with the overtone mode pulsator exhibiting greater instability at all time scales.
Acknowledgments
We are happy to thank Joseph E. Postma for his unpublished photometric data. We also thank Zoltán Kolláth for enlightening discussions. Comments from an anonymous referee have improved the text, particularly in Section 4. This project has been supported by the ‘Lendület-2009 Young Researchers’ Program of the Hungarian Academy of Sciences, and the Hungarian OTKA grant K83790. The research leading to these results has received funding from the European Community’s Seventh Framework Programme (FP7/2007-2013) under grant agreement no. 269194 (IRSES/ASK)and No. 312844 (SPACEINN). Funding has also been received from the ESA PECS Contract No. 4000110889/14/NL/NDe. RSz and AD were supported by the János Bolyai Research Scholarship of the Hungarian Academy of Sciences. RSz thanks the hospitality of CfA during a visit. Financial support for LSz was provided from the ESTEC Contract No.4000106398/12/NL/KML. Support for this work was also provided from the Chandra X-ray Center NASA Contract NAS8-03060 (for NRE). JMM, DBG, AFJM and SR are grateful for financial aid from NSERC (Canada) and AFJM also to FRQNT (Quebec). WWW was supported by the Austrian Science Fonds (FWF P22691-N16) This research has made use of the SIMBAD database, operated at CDS, Strasbourg, France.
References
- Arellano Ferro (1983) Arellano Ferro, A., 1983, ApJ, 274, 755
- Arellano Ferro et al. (1998) Arellano Ferro, A., Rojo Arellano, E., Gonzalez-Bedolla, S., Rosenzweig, P., 1998, ApJS, 117, 167
- Astbury (1905) Astbury, T. H., 1905, JBAA, 15, 270
- Barnes et al. (1987) Barnes, T. G. III, Moffett, T. J., and Slovak, M. H., 1987, ApJS, 65, 307
- Barnes et al. (1997) Barnes, T. G. III, Fernley, J. A., Frueh, M. L., Navas, J. G., Moffett, T. J., and Skillen, I., 1997, PASP, 109, 645
- Beavers & Eitter (1986) Beavers, W. I., and Eitter, J. J., 1986, ApJS, 62, 147
- Benedict et al. (2007) Benedict, G. F., et al., 2007, AJ, 133, 1810
- Berdnikov (2008) Berdnikov, L. N., 2008, VizieR On-line Data Catalog: II/285
- Berdnikov & Pastukhova (1995) Berdnikov, L. N., and Pastukhova, E. N., 1995, AstrL, 21, 369
- Berdnikov et al. (1997) Berdnikov, L. N., Ignatova, V. V., Pastukhova, E. N., and Turner D. G., 1997, AstL, 23, 177
- Berdnikov et al. (2003) Berdnikov, L., Mattei, J. A., and Beck, S. J., 2003, JAAVSO, 31, 146
- Bersier et al. (1994) Bersier, D., Burki, G., and Burnet, M., 1994, A&AS, 108, 9
- Bruntt et al. (2008) Bruntt H., et al., 2008, ApJ, 683, 433
- Buchler and Kollath (2011) Buchler J. R., and Kolláth Z. 2011, ApJ, 731, 24
- Buchler et al. (2004) Buchler, J. R., Kolláth, Z., and Cadmus, R. R., 2004, ApJ, 613, 532
- Burki et al. (1986) Burki, G., Schmidt, E. G., Arellano Ferro, A., Fernie, J. D., Sasselov, D., Simon, N. R., Percy, J. R., and Szabados, L., 1986, A&A, 168, 139
- Derekas et al. (2012) Derekas, A. et al., 2012, MNRAS, 425, 1312
- Eggen (1951) Eggen, O. J., 1951, ApJ, 113, 367
- ESA (1997) ESA 1997, The Hipparcos and Tycho Catalogues, ESA SP-1200
- Evans (1976) Evans, N. R., 1976, ApJS, 32, 399
- Evans (2000) Evans, N. R., 2000, AJ, 119, 3050
- Evans, Sasselov & Short (2002) Evans, N. R., Sasselov, D. D., and Short, C. I., 2002, ApJ, 567, 1121
- Feltz & McNamara (1980) Feltz, K. A. Jr., and McNamara, D. H., 1980, PASP, 92, 609
- Fernie (1993) Fernie, J. D., 1993, IBVS, 3854
- Fernie et al. (1993) Fernie, J. D., Kamper, K. W., and Seager, S., 1993, AJ, 416, 820
- Gieren (1985) Gieren, W. P., 1985, A&A, 148, 138
- Gorynya et al. (1996) Gorynya, N. A., Samus, N. N., Rastorguev, A. S., Sachkov, M. E., 1996, AstrL, 22, 175
- Groenewegen & Oudmaijer (2000) Groenewegen, M. A. T., and Oudmaijer, R. D., 2000, A&A, 356, 849
- Kienzle et al. (1999) Kienzle, F., Moskalik, P., Bersier, D., and Pont, F., 1999, A&A, 341, 818
- Kiess (1917) Kiess, C. C., 1917, Publ. Obs. Michigan, 3, 131
- Kiss (1998) Kiss, L. L., 1998, JAD, 4, No. 3, 1
- Koen (2006) Koen, C. 2006, MNRAS, 365, 489
- Kolláth et al. (2002) Kolláth, Z., Buchler, J. R., Szabó, R., and Csubry, Z., 2002, A&A, 385, 932
- Lenz & Breger (2005) Lenz, P., and Breger, M., 2005, CoAst, 146, 53
- Matthews et al. (2004) Matthews, J. M., Kuschnig, R., Guenther, D. B., Walker, G. A. H., Moffat, A. F. J., Rucinski, S. M., Sasselov, D., and Weiss, W. W., 2004, Nature, 430, 51
- Meyer (2004) Meyer, R., 2004, BAV Rundbrief, 53, 37
- Milone (1970) Milone, E. F., 1970, IBVS, No. 482
- Mitchell et al. (1964) Mitchell, R. I., Iriarte, B., Steinmetz, D., and Johnson, H. L., 1964, Bol. Obs. Tonantzintla y Tacubaya, 3, No. 24
- Moffett & Barnes (1984) Moffett, T. J., and Barnes, T. G. III, 1984, ApJS, 55, 389
- Molnár & Szabados (2014) Molnár L., and Szabados L. 2014, MNRAS 442, 3222
- Mundprecht et al. (2013) Mundprecht, E., Muthsam, H. J., and Kupka, F., 2013, MNRAS, 435, 3191
- Neilson et al. (2011) Neilson, H. R., Cantiello, M., and Langer, N., 2011, A&A, 529, L9
- Neilson et al. (2012) Neilson, H., Engle, S. G., Guinan, E. et al. 2012, ApJ, 745, 32
- Neilson and Ignace (2014) Neilson, H. R., and Ignace, R. 2014, A&A, 563, L4
- Peña et al. (2010) Peña, J. H., et al., 2010, RMxAA, 46, 291
- Percy and Kim (2014) Percy, J. R., Kim, R. Y. H. 2014, arXiv:1405.6993v2
- Petrie (1932) Petrie, R. M., 1932, Publ. Obs. Michigan, 5, No. 3
- Postma (2007) Postma, J. E., 2007, MSc Thesis, Univ. of Calgary
- Rowe (2006) Rowe, J. F., et al. 2006a, Mm. S. A. It., 77, 282
- Rowe (2006) Rowe, J. F., et al. 2006b, ApJ, 646, 1241
- Sachkov (1997) Sachkov, M. E., 1997, IBVS, 4522
- Schwarzschild (1910) Schwarzschild, K., 1910, Astr. Nachr., 185, 133
- Simon & Teays (1982) Simon, N. R., and Teays, T. J., 1982, ApJ, 261, 586
- Sterken & Jaschek (1996) Sterken C., Jaschek C. (eds), 1996, Light Curves of Variable Stars: a Pictorial Atlas, Cambridge Univ. Press, Cambridge
- Szabados (1977) Szabados, L., 1977, Mitt. Sternw. ung. Akad. Wiss., Budapest, No. 70
- Szabados (1983) Szabados, L., 1983, Ap&SS, 96, 185
- Szabados (1991) Szabados, L., 1991, CoKon, No. 96
- Szabó, Buchler & Bartee (2007) Szabó R., Buchler J. R., Bartee J., 2007, ApJ, 667, 1150
- Szabó et al. (2010) Szabó R., Kolláth, Z., Molnár, L. et al., 2010, MNRAS, 409, 1244
- Takeda et al. (2013) Takeda, Y., Kang, D. I., Han, I., Lee, B. C., and Kim, K. M., 2013, MNRAS, 432, 769
- Turner et al. (2007) Turner, D. G., et al., 2007, PASP, 119, 1247
- Walker et al. (2003) Walker, G., et al., 2003, PASP, 115, 1023
- Walraven et al. (1958) Walraven, Th., Muller, A. B., and Oosterhoff, P. Th., 1958, BAN, 14, 98
- Wamsteker (1972) Wamsteker, W. 1972, IBVS, No. 690
- Welch & Evans (1989) Welch, D. L., and Evans, N. R., 1989, AJ, 97, 1153
- Williams (1966) Williams, J. A., 1966, AJ, 71, 615
- Wilson et al. (1989) Wilson, T. D., Carter, M. W., Barnes, T. G. III, van Citters, G. W. Jr, and Moffett, T. J., 1989, ApJS, 69, 951
- Wisniewski & Johnson (1968) Wisniewski, W. Z., and Johnson, H. L., 1968, Commun. Lunar Planet. Lab., 7, No. 112