Far-infrared line spectra of Seyfert galaxies from the Herschel-PACS Spectrometer
Abstract
We present spectroscopic observations of far-IR fine-structure lines of 26 Seyfert galaxies obtained with the PACS spectrometer onboard Herschel. These observations are complemented by spectroscopy with both the Spitzer IRS and the Herschel SPIRE spectrometers. The ratios of the [OIII], [NII], [SIII] and [NeV] lines have been used to determine electron densities in the ionised gas regions. The [CI] lines, observed with SPIRE, have been used to measure the densities in the neutral gas, while the [OI] lines provide a measure of the gas temperature, at densities below 104 cm-3. Using the [OI]145m/63m and [SIII]33/18.7m line ratios we find an anti-correlation of the temperature with the gas density.
Using various fine-structure line ratios, we find that density strati cation is common in these active galaxies. On average, the electron densities increase with the ionisation potential of the ions producing the [NII], [SIII] and [NeV] emission. The infrared emission lines arise partly in the Narrow Line Region (NLR) photoionised by the AGN central engine, partly in HII regions photoionised by hot stars, and partly in neutral gas in photo-dissociated regions (PDRs).
We attempt to separate the contributions to the line emission produced in these different regions by comparing our observed emission line ratios to empirical and theoretical values.
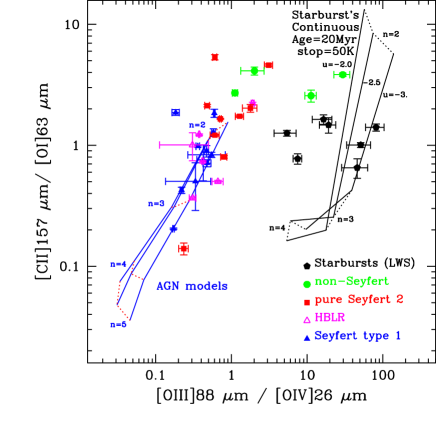
In particular, we tried to separate the contribution of AGN and star formation by using a combination of Spitzer and Herschel lines, and we found that, besides the well known mid-IR line ratios, the mixed mid-IR/far-IR line ratio of [OIII]88m/[OIV]26m can reliably discriminate the two emission regions, while the total far-IR line ratio of [CII]157m/[OI]63m is only able to mildly separate the two regimes.
By comparing the observed [CII]157 m/[NII]205 m ratio with photoionisation models, we also found that most of the [CII] emission in the galaxies we examined is due to PDRs.
Subject headings:
- Galaxies: ISM, nuclei, active, starburst, Seyfert - Techniques: infrared spectroscopy1. Introduction
The luminosity of a galaxy may ultimately be produced by young or old stars, or accretion onto a central massive black hole. The latter two sources emit large portions of ionising photons, which are usually absorbed by gas, producing emission lines. These are particularly strong in the far-infrared because of their ease of excitation. The strongest lines can exceed a percent of the total far-IR luminosity. Through the observation of various line ratios, it is possible to infer what has ionised the gas, and to characterise its physical properties, such as the nature and strength of the interstellar radiation fields, chemical abundances, local temperatures and gas densities. The observed mid- and far-IR fine structure lines from different species, with a wide range different ionisation potentials and excitation conditions (see, e.g. Spinoglio & Malkan, 1992) trace different physical conditions and phases of the ISM, all the way from the neutral atomic gas in interstellar PDRs, to the extremely ionised coronal gas powered by X-rays from the AGN.
Hot (young) stars and black hole accretion discs have strongly different ionising continuum spectra. However this continuum, which produces a considerable fraction of the bolometric luminosity in both processes, is not observable directly, due to absorption by HI and, at longer wavelengths, by dust. Emission lines ratios from the photoionised gas are the best tracers and discriminators of accretion and star formation processes (see, e.g., Spinoglio & Malkan, 1992; Osterbrock & Ferland, 2006). In order to overcome heavy extinction, observations in the mid- to far-IR are needed to probe obscured regions. The rest-frame mid- to far-IR spectral region contains several extinction-free emission lines which measure the contributions from AGN and star formation to the overall energy budget. Since the spectroscopic observations of the Infrared Space Observatory (ISO) (Kessler et al., 1996) Short Wavelength Spectrometer (SWS) (de Graauw et al., 1996) a useful family of spectroscopic diagnostics has been found, such as the ratios of emission lines tracing the hard UV field found in the narrow line region of AGN (e.g., [Ne V], [OIV]) to those tracing stellar HII regions (e.g., [S III], [Ne II]), as well as the strength of the PAH emission features – indicators of star formation. These spectroscopic tools are able to separate the star-forming from AGN-dominated galaxies because of the large differences in ionisation potential of the observed mid-IR emission lines (e.g., Spinoglio & Malkan, 1992; Genzel et al., 1998). The Spitzer Space Telescope (Werner et al., 2004) IR Spectrograph (IRS) (Houck et al., 2004) observations have further extended these results for ultra luminous IR galaxies, Seyfert galaxies and starburst galaxies (Armus et al., 2007; Smith et al., 2007; Tommasin et al., 2008; Veilleux et al, 2009; Tommasin et al., 2010; Brandl et al., 2006; Bernard-Salas et al., 2009).
At longer wavelengths, spectroscopy of some of the brighter nearby star-forming galaxies and AGN with the ISO Long Wavelength Spectrometer (LWS) (Clegg et al., 1996) has demonstrated the importance and diagnostic power of the rest-frame far-IR (Fischer et al., 1999; Braine & Hughes, 1999; Spinoglio et al., 2005). Fischer et al. (1999) observed in a sample of highly obscured ultraluminous IR galaxies a variety of line ratios indicative of contributions from a wide range of physical regions, and even some peculiar spectra (e.g in Arp220) showing some atomic lines in absorption. ISO spectroscopy also showed, for example, that far-IR fine structure line ratios (e.g. the diagram of [C II]/[OI] vs. [OIII]/[OI]) can be used to separate starburst and AGN (Spinoglio et al., 2000). A full decomposition of the primary ionising continua from the AGN and the starburst in the Seyfert 2 galaxy NGC1068 has been performed through photoionisation models thanks to the detection of tens of mid- and far-IR emission lines (Spinoglio et al., 2005).
The mid-IR spectroscopic diagnostics of active and starburst galaxies has been shown in the last decade using results by Spitzer (Werner et al., 2004) IRS (Houck et al., 2004). In a previous study, Abel et al. (2009) have compared Spitzer and ISO spectroscopic data of ULIRG galaxies with photoionisation models, focusing on the predictions of far-IR line ratios and line to continuum ratios, with models with high incident photon to particle densities. They found that these models can reproduce many ULIRG observational characteristics, such as the [CII] line deficit (see, e.g. Luhman et al., 2003). Our goal here is to model the Seyfert galaxies.
We have now extended the spectral range up to the far-IR, using the results from the Herschel (Pilbratt et al., 2010) Photodetector Array Camera and Spectrometer (PACS) (Poglitsch et al., 2010). We present here the Herschel PACS spectroscopic observations of 26 Seyfert galaxies. These objects have been chosen because they are among the brightest local active galaxies at 60–100 m, most of which belong to the 12m galaxy sample (Rush, Malkan & Spinoglio, 1993), they have been observed by Spitzer IRS and their luminosity has been separated between AGN and Starburst components through mid-IR spectroscopy. The immediate goals are to obtain a large set of FIR tracers to be able to classify and model the various levels of non-thermal and starburst activity in local Seyfert’s, using fine-structure ionic and neutral transitions that have been observed with Herschel and Spitzer. Most of the galaxies (2/3) have been selected from the Seyfert galaxy catalog of the 12m Galaxy Sample (Rush, Malkan & Spinoglio, 1993), those not in this latter catalog have been selected because they are the brightest accretion-powered galaxies locally, as measured by the [OIV]26m line with Spitzer. Following the mid-IR spectroscopic classification of Tommasin et al. (2010), the selected sample includes 10 Seyfert 1’s, 5 Hidden Broad Line Region (HBLR) Seyfert 2’s (for a total of 13 AGN1’s), 9 ”pure” AGN2’s and three lower activity objects, classified as non-Seyfert’s (Table 1). Following the classifications given in Tommasin et al. (2010), we have divided the narrow-line Seyfert type 2 galaxy population into two classes, based on spectropolarimetry. The “HBLR” and “pure type 2’s” are those Seyfert nuclei either having, or not having broad emission line wings detected only in polarized light (see, e.g. Tran, 2001, 2003).
2. Observations
2.1. PACS Spectroscopy
We obtained far-infrared spectroscopic observations of a sample of 26 Seyfert nuclei, made with the PACS instrument (Poglitsch et al., 2010) onboard the ESA Herschel Space Observatory (Pilbratt et al., 2010). The selected sources belong to the two observational programmes in guaranteed time Bright Seyfert Nuclei: PACS spectroscopy (GT1 lspinogl_4, PI: L. Spinoglio) and PACS spectroscopy of bright Seyfert galaxies in the [OIV]26m line (GT2 lspinogl_6, PI: L. Spinoglio), with a total time investment of 32 hours of Herschel. In this article we present the analysis of seven fine-structure lines (Table 2), while leaving for a forthcoming article the molecular line observations (four high-J CO lines and three OH doublets). Whenever observations of the atomic lines of interest were carried out by other programs, we complemented our data with PACS archival data. The final sample comprises observations acquired in single-pointing mode, carried out in chopping/nodding mode with a throw of 6’. Most of the observations were obtained in the range spectroscopy mode, whereas–for enlarging the sample–line spectroscopy observations were included. Standard rebinned cubes were used for the scientific analysis. Thus the spectral maps are composed by squared spatial pixels (spaxels), with a size of 9.”7, covering a field of view of . Our observations were conducted in staring mode, so our maps are not Nyquist-sampled with respect to the Point Spread Function (PSF), which ranges from at 57 m to at 163 m, but the beam size is dominated by the spaxel size below 120 m (see Table 2).
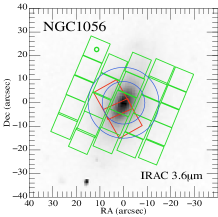
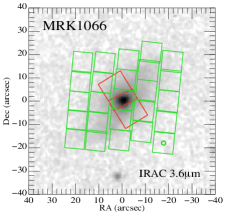
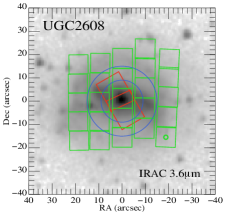
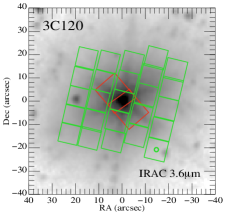
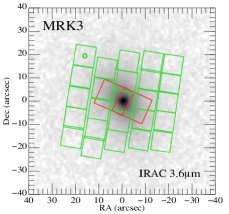
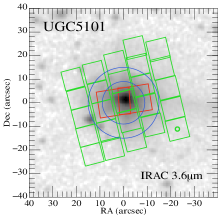
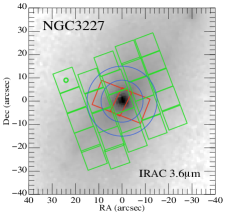
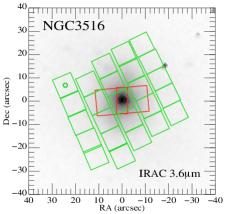
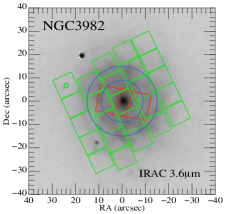
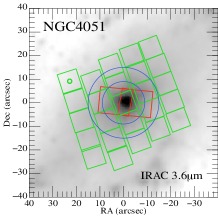
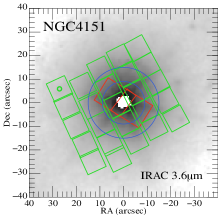
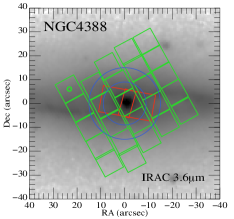
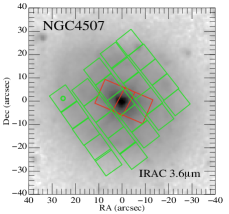
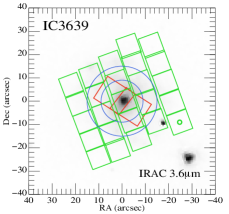
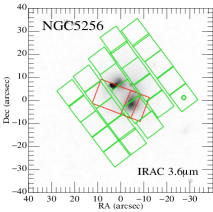
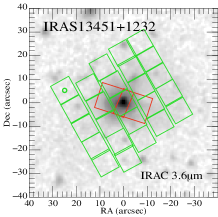
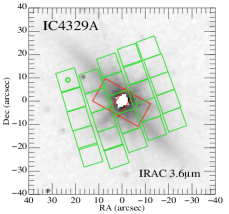
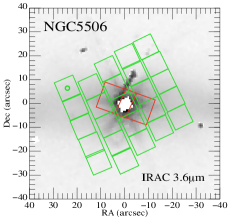
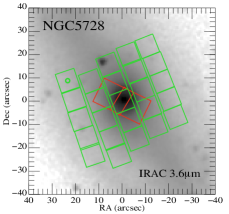
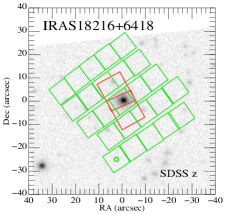
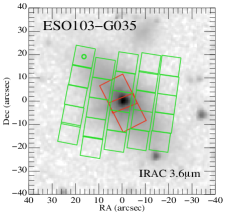
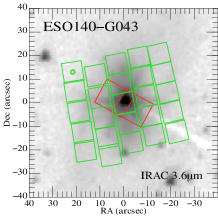
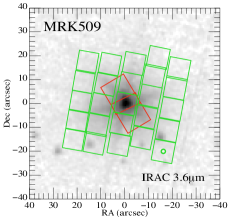
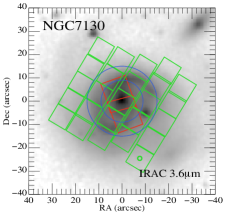
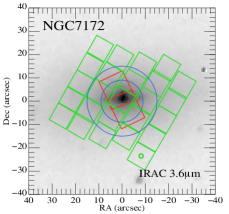
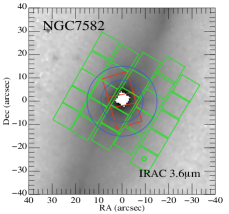
The Spitzer IRAC 3.6m images of each galaxy in our sample, superposed to the frame of the PACS spectrometer of 47 47 and the slit of 22.3 11.1 of the long-wavelength high-resolution mode (LH) of the IRS spectrometer of Spitzer, are shown in Appendix C.
Data reduction has been performed with standard recipes within HIPE111HIPE is a joint development by the Herschel Science Ground Segment Consortium, consisting of ESA, the NASA Herschel Science Center, and the HIFI, PACS and SPIRE consortia. v10, starting from Level 0 data, and including the specFlatFieldLine task for applying the flat-field correction at every observed line. An external package, developed in the IDL language, was built for performing the spectral analysis over the wide sample of spectral profiles. The software looks for spectral lines in every spaxel by adopting a threshold approach and, if spectral features are identified, a polynomial continuum plus a gaussian profile was fitted by using the IDL GAUSSFIT routine. The estimations provided by the fitting procedure were used to build maps of physical (continuum level, line intensity, line peak emission) and kinematical (peak velocity, velocity dispersion) parameters.
The observations were based on the assumption that the galactic nuclei are point-like sources located at the central spaxel position. However, taking into account small telescope mispointings (less than 1/2 spaxel) and the large, non-Gaussian point spread function (especially at the longer wavelengths), we integrated the line intensity measured over the central 33 spaxels. To recover the absolute flux level of the nuclear emission, we applied an aperture correction factor consistent with the spectra extracted from the central 9 spaxels. The point-source aperture correction factors were obtained by using the calibration product pointSpuceLoss (version 4), provided within the HIPE environment for the PACS spectrometer.
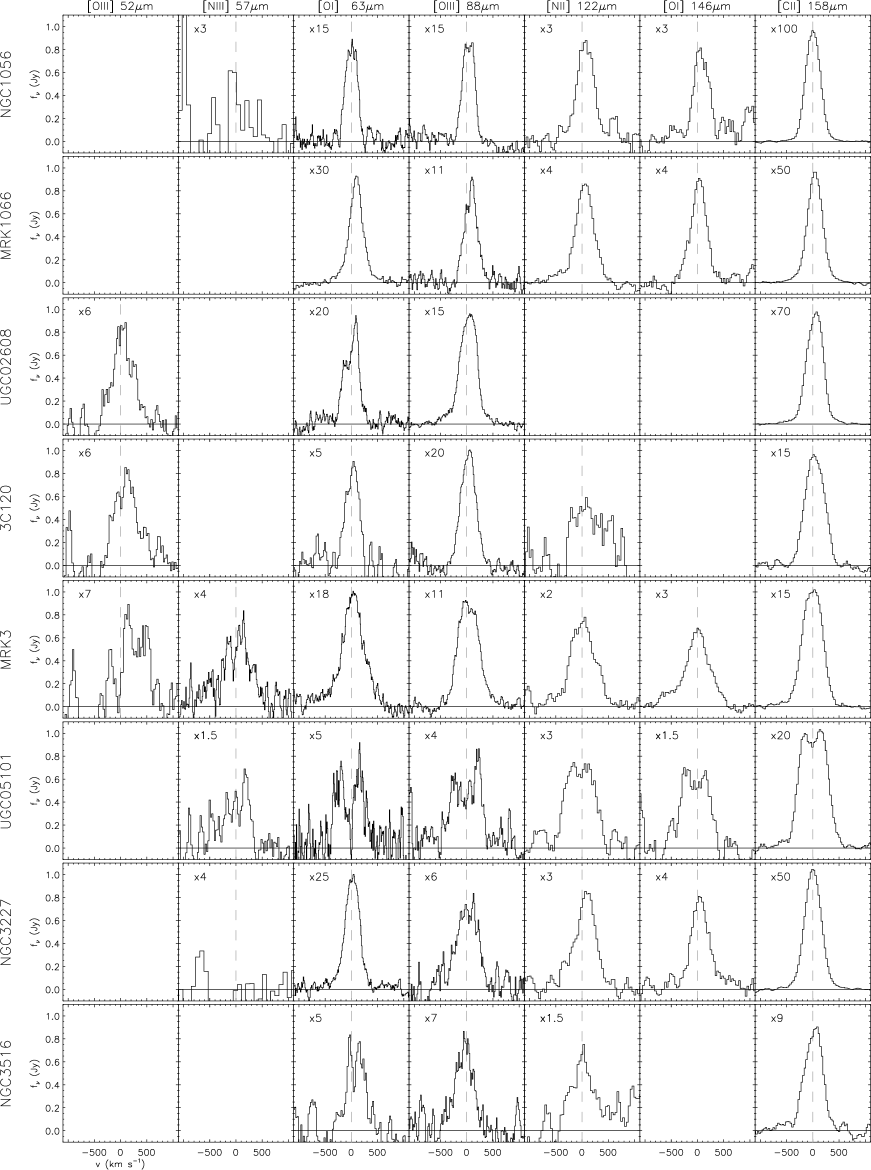
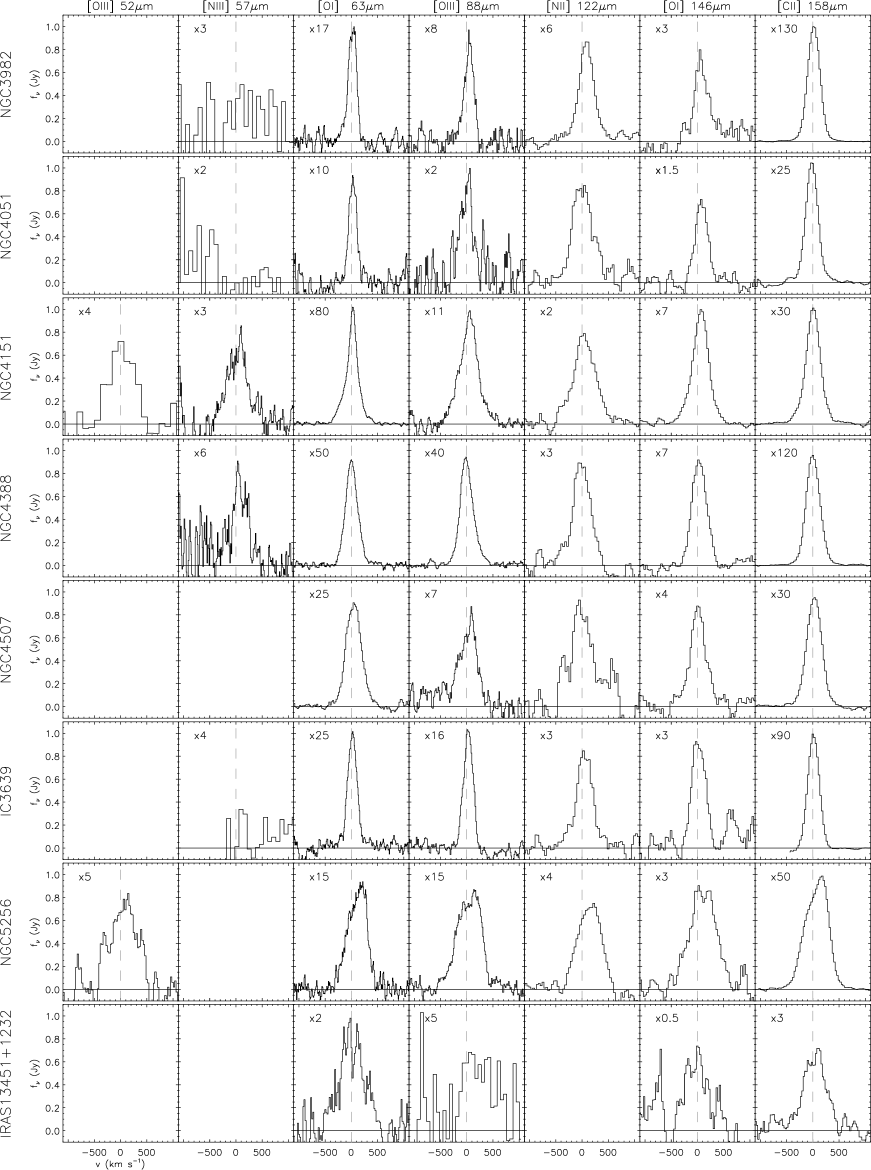
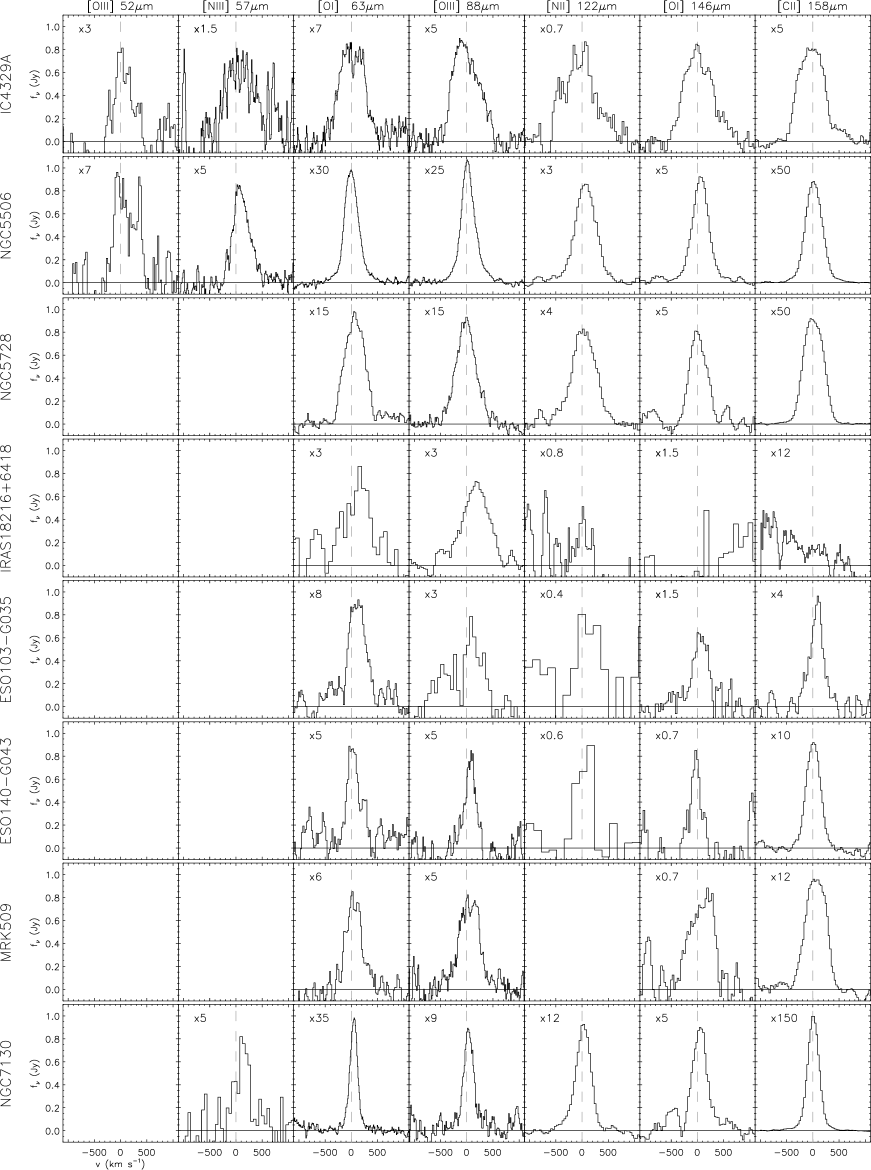
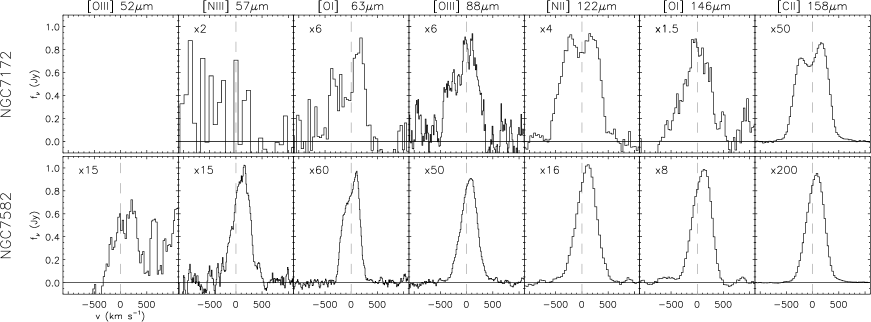
The obtained line profiles are shown in Appendix A and the measured fluxes are reported in Table 3. Upper limits were provided by computing the integrated flux within an unresolved Gaussian profile with peak equal to 3RMS and sigma derived by the spectral resolution at the considered wavelength. The spectral profiles reveal that often the lines are not well represented by single Gaussians; thus the line intensities have been obtained with a numerical integration across the line profiles. The velocity limits of the lines were inferred by computing the RMS and adopting a threshold approach. A comparison of the two flux estimates for lines with Gaussian-shape profiles results in a difference of less than of the flux calibration accuracy, i.e. less than 10%.
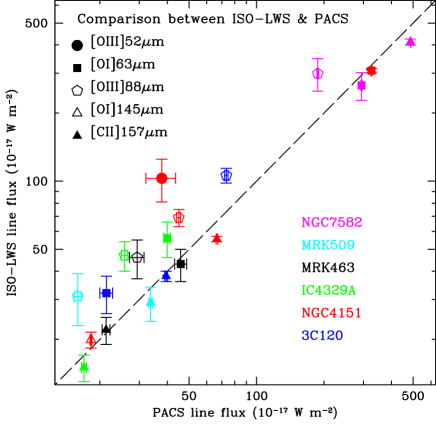
We point out that the OIII]52m line lies at the edge of the spectral coverage of the PACS BLUE detector, where the relative spectral response function is not well characterised. As a result, the 52m uxes measured in the galaxies UGC2608, 3C120, MRK3, NGC5256, IC4329A, NGC5506 and NGC7582 can be affected by a calibration error that exceeds the noise of the spectrum, as it is shown in Table 3. This error is hard to quantify, because few calibration data are available for it. As an example, in NGC4151, this line was detected by ISO-LWS with a flux of (10322)10-17W m-2 (Spinoglio et al., 1997), whereas the same line was detected by PACS with a flux of (40.856.30)10-17W m-2. This indicates a factor of 2.5 uncertainty in the flux measurement, which cannot be accounted for by aperture effects, that are negligible for this high-ionisation line. This uncertainty does not account for cross calibration errors between the two instruments. Nevertheless, the measured fluxes are not affected by leakage from other wavelengths because the observations have been made with the second-order grating. In order to explore the discrepancies found between the ISO-LWS and the Herschel-PACS observations, we present in Appendix B the observations of Seyfert galaxies obtained with both spectrometers.
Table 2 also contains the SPIRE FTS fluxes of the [NII]205m, the [CI]370m and the [CI]609m lines. Most detected objects have been published in Pereira-Santaella et al. (2013), while for UGC2608, we have reduced the FTS spectrum. We downloaded SPIRE/FTS high resolution (1.45 GHz) spectroscopic observations of UGC2608 from the Herschel archive. The data were reduced as described by Pereira-Santaella et al. (2013), using the standard pipeline provided by the Herschel interactive pipeline environment software (HIPE) version 11 (Ott, 2010). We assumed the point-like corrections for the flux calibrations and extracted the spectra from the central bolometer detector. The line fluxes were measured by fitting a sinc function to the emission profiles.
2.2. Ancillary data: Spitzer IRS Spectroscopy
As complementary data, that we will use in the analysis, we also present the Spitzer IRS high-resolution spectroscopy of the 26 galaxies of our sample. Most of the data have been taken from Tommasin et al. (2008, 2010), while for the galaxies not observed there, we have reduced the IRS data from the Spitzer Archive. The Spitzer IRS spectroscopy is presented in Table 4.
3. Results
3.1. Density diagnostics
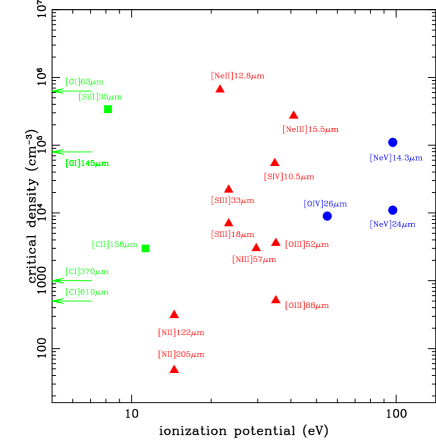
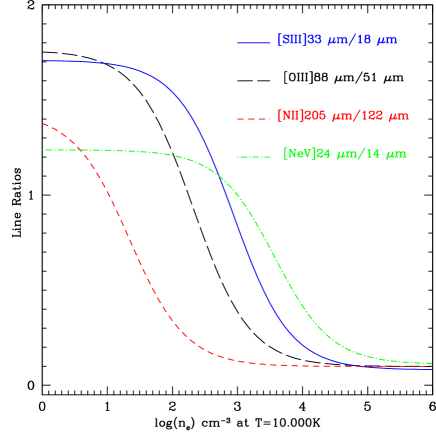
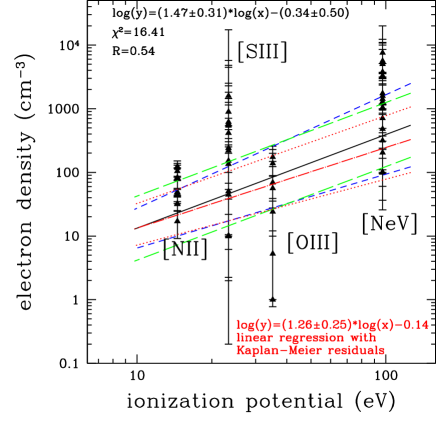
The ratio of two fine-structure lines from the same ion or neutral atom is frequently most sensitive to the electron densities of the gas (e.g., Rubin et al., 1994). Using the Herschel PACS, SPIRE and Spitzer-IRS line measurements (Tables 3 and 4), we are able to use the [OIII], [NII], [SIII] and [NeV] lines to determine the electron densities in the ionised line-emitting regions. Moreover, the [CI] lines can be used to measure the densities in the neutral gas, while the ratio of the [OI] lines, provides a measure of the neutral gas temperature (Tielens & Hollenbach, 1985). We present in Fig.1(a), the critical densities of the fine structure lines considered in this work as a function of the ionisation potential of the ions (Spinoglio & Malkan, 1992).
The line ratios for thermalized gas at 104K that is purely collisionally excited are shown in Fig.1(b). As can be seen from the figure, the [NII] line ratio is sensitive at electron densities in the range of 1 ne 103 cm-3, the [OIII] line ratio at densities in the range of 10 ne 104 cm-3, the [SIII] line ratio at densities in the range of 102 ne 104 cm-3, and, finally, the [NeV] line ratio at densities in the range of 103 ne 105 cm-3. In combination, these lines provide a sequence that can trace the density across a large range, from ne=10 to ne=105 cm-3.
Using the level population equations of a constant density gas in a pure collisional regime (see, e.g., Osterbrock & Ferland, 2006), we have determined the theoretical line ratios, and compared them with the observations. We have considered gas temperatures of 1,000 and 10,000K for ratios of ionised lines and of 100K and 1,000K for the neutral lines line ratios, namely the [OI]145m/63m and the [CI]609m/370m line ratios. The atomic data used to calculate the line ratios as a function of density and temperature have been taken from the IRON project for [SIII], [NII] and [OIII] (Hummer et al., 1993), and from the LAMDA database for the other ions (Schoier et al., 2005). Some caution has to be taken in comparing differences in the plots, because not all galaxies have been observed in all line ratios (see Tables 3 and 4). Moreover, because of the lack of knowledge of a precise calibration for the [OIII]52m line flux (see Section 2), we warn the reader that the densities obtained from the [OIII] line ratio should be regarded as very rough approximations.
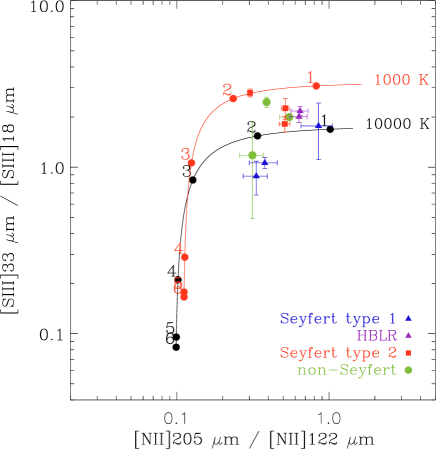
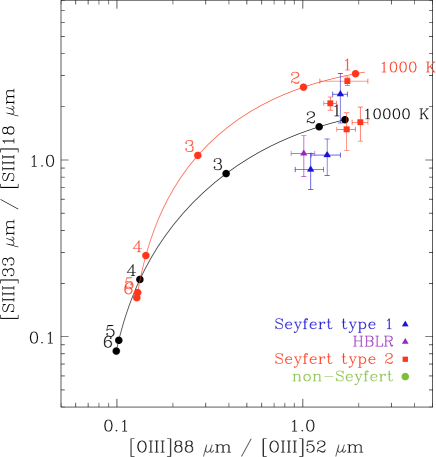
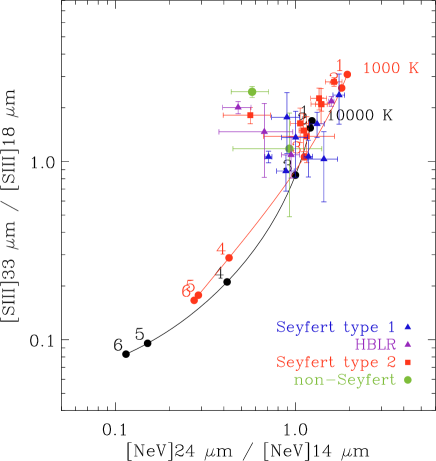
Fig.2(a) shows the [SIII]33m/18m line ratio, which traces the density in HII regions, versus the [NII]205m/122m line ratio, tracing the low-density diffuse ionised gas, as well as the HII region gas. It appears that the diffuse ionised gas of the observed galaxies has densities in the range of 10n102 cm-3, while the HII regions gas has densities below 103 cm-3, down to the low-density limit, where the [SIII] ratio no longer measures the density. Fig.2(b) shows the [SIII]33m/18m line ratio vs the [OIII]88m/52m line ratio. These lines are primarily emitted in HII regions around young stars. They indicate densities in the range 10n103 cm-3. Fig.3 plots the [SIII]33m/18m line ratio vs the [NeV]24m/14m line ratio. The observed galaxies here cluster around densities of 102-103 cm-3. However there are some galaxies for which the density measured by the [SIII] ratio is below the low density limit (ne 102 cm-3), while the [NeV] density is much higher (103 ne 104 cm-3). This is because the [NeV] is emitted from the high excitation/ionisation NLR of the AGN, whereas the [SIII] lines are emitted mostly by stellar HII regions. We refer to the discussion presented in Tommasin et al. (2010), where it has been shown in detail that many observed line ratios indicate densities below the low density limit.
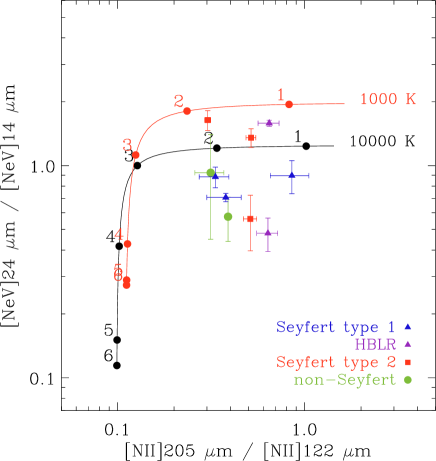
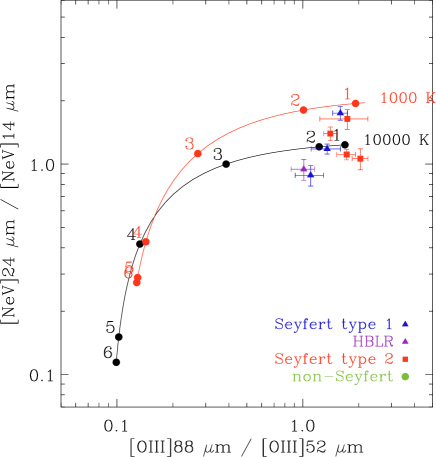
Fig.4(a) plots the [NeV]24m/14m line ratio vs the [NII]205m/122m line ratio. As in Fig.3, the two line ratios are sampling different regions in the observed galaxies: the AGN NLR in the first case and the low density diffuse ionised ISM in the other ratio. Fig.4(b) plots the [NeV]24m/14m line ratio vs the [OIII]88m/52m line ratio, which indicates that the NLR detected in the few observed galaxies (for the 52m line we only have 8 detections) has densities in the range 10 ne 103 cm-3.
However, the [OIII] line ratio samples lower densities compared to the [NeV] line ratio, as can be seen from the difference in the critical densities of the two sets of transitions in Fig. 1(a).
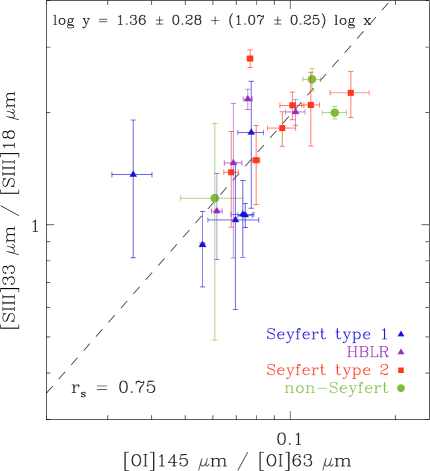
Fig.5(a) plots the [SIII]33m/18m line ratio vs the [OI]145m/63m line ratio222No model has been included in this figure because the collision strengths for [SIII] are available only at 1,000K, and not at 100K while for the [OI] ratio the 100K data should be used.. A least-squares fit yields the following relation between the [SIII]33m/18m line ratio vs the [OI]145m/63m line ratio:
relation reflects an anti-correlation between the ionised gas density and the neutral ISM gas temperature.
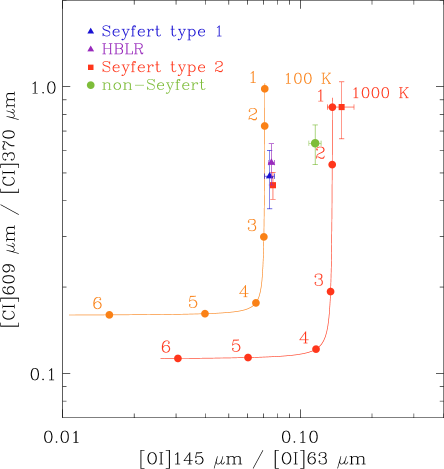
Finally, Fig.5(b) plots the [CI]609m/370m line ratio vs the [OI]145m/63m line ratio. The primarily molecular hydrogen gas traced by these lines spans densities from 102 n 103 cm-3 at the lower temperature of 100K to 10 n 102 cm-3 at the higher temperature of 1,000K.
The [OI] ratio does not constrain the density, because it is below nH 104 cm-3, but the gas temperature instead (Tielens & Hollenbach, 1985). An anti-correlation between density and temperature seems present, which is expected at these low densities in the optically thin case, because the [CI] line ratio measures the molecular hydrogen density, while the [OI] line ratio is sensitive to the temperature. From Fig.5(b), we can see that at a temperature of T=100K, the [CI] line ratios are consistent with densities of 102 n 103 cm-3. For the same Seyfert galaxies reported in this work, assuming that the [CI] emission is thermalized, Pereira-Santaella et al. (2013) have derived a temperature of 30K and a density of n 103 cm-3. However, according to Fig. 9 of Pereira-Santaella et al. (2013), the [CI] ratios presented in their work are also compatible with higher temperature and lower density (i.e. 102 n 103 cm-3 for 102 T 102.5 K). In the present work, we have added the [OI] ratio in the diagram and the result might be different, also considering that the [CI] and [OI] emission might not be produced exactly in the same regions.
3.2. Density stratifications
As already shown in the previous section, different lines in the same galaxy can originate in different emission line regions, arising from physically distinct components in the galaxy. The nuclear region is characterised by emission of NLR gas directly illuminated by the AGN and excited by the hard primary ionising spectrum originating from black hole accretion. The NLR can have by itself a stratification of densities, that can be mapped by transitions with different collisional critical densities.
Table 5 gives, for each galaxy, the [OIII]88/52, [SIII]33/18, [NII]205/122 and [NeV]24/14 line ratio values and their errors, and the average electron densities derived from each ratio, as well as the range in density due to the uncertainty of the line ratio, assuming a gas temperature of 10,000K.
In Fig.6(a) we present the derived electron densities as a function of the ionisation potential for all galaxies for which we determined the density in Table 5. A weighted least-squares fit to the whole set of data indicates a correlation between density and ionisation, with a correlation coefficient of R=0.54, a =16.4 and a regression line slope of = 1.470.31. To compute this fit we have also included the upper limits, by artificially assigning errors which are the semi-difference between the two values of the range given in Table 5, with the lower values of the range being set to one decade below the upper limit values. If no density range was assigned, an error of half a decade was given. We also used another approach, that naturally includes the upper limits: a linear regression based on Kaplan-Meier residuals333The linear regression was performed using the BUCKLEYJAMES routine, available in the stsdas data analysis package. The description can be found at: http://stsdas.stsci.edu/cgi-bin/gethelp.cgi?buckleyjames.hlp. A description of this method, which is part of the ASURV444ASTRONOMY SURVIVAL ANALYSIS PACKAGE, whose description can be found at: http://stsdas.stsci.edu/cgi-bin/gethelp.cgi?survival package, can be found in Isobe, Feigelson & Nelson (1986). The results of this linear regression fit give a regression line slope of = 1.260.25 and are consistent with the weighted least squares fit, as shown in Fig. 6(a).
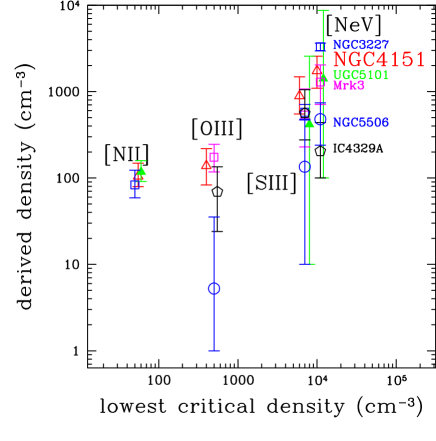
For the six galaxies for which at least three density-probing line ratios have been observed, we plotted the density estimate as a function of the lowest collisional critical density of that particular pair of transitions from the same ion (i.e., the critical density of [NII]205m, [OIII]88m, [SIII]18m and [NeV]24m; Fig.6(b)). From Fig.6(b), it appears that the probed densities increase with the lowest critical density (as they should). The trend between the derived density and the ionisation potential of the species emitting the lines is harder to deduce for this sample, with IC4329A not showing a monotonic increase of the derived densities as a function of ionisation. In a previous study based on spectrally-resolved mid-IR lines, Dasyra et al. (2011) reported a stratification of densities, with different fine-structure lines probing different (locations within the) clouds, with high ionisation potential ions being preferentially found nearer to the black hole.
In conclusion we have found that there is a tendency for the higher ionisation lines to originate in gas with higher density. This can be seen as an average result from Fig.6(a). An explanation of this result is that the gas in the Narrow Line Region includes clouds of varying densities, which are highest nearest to the ionising AGN, confirming the results of Dasyra et al. (2011).
3.3. [OI] diagnostics
The [OI]145m/63m ratio is sensitive to the gas temperature at a given gas density below 104 cm-3 (see, e.g., Tielens & Hollenbach, 1985).
In Table 6 we present the temperature determinations computed from the [OI]145/m/63m line ratio555When [OI]145/m/63m 0.14, no temperature value could be derived. , using the analytic models presented in section 3.1 for a density of n=102 cm-3.
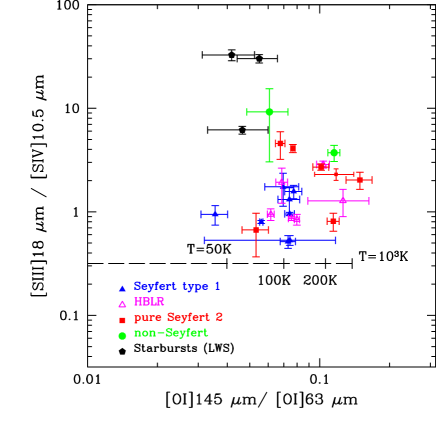
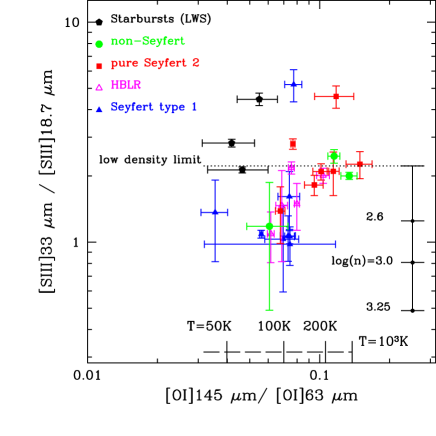
In order to test whether a harder radiation field corresponds to a warmer interstellar medium, we explored whether there is a correlation between temperature and ionisation. For the latter, we used the ionisation-sensitive line ratio [SIV]10.5m/[SIII]18.7m. According to Fig.7(a), no such correlation holds. Even excluding the literature data, we could not find any correlation. Fig.7(b) shows the [OI]145m/63m vs the [SIII]33/18.7m line ratio, where we can see a trend, which reflects into an anti-correlation between electron density and gas temperature, which is also shown for our data in Fig.5(a). The correlation seen in this latter figure disappears with the inclusion of the literature data (three starburst galaxies and two Seyfert 1’s from observations of ISO-LWS reported in Brauher et al. (2008)) because both the different types of the objects included and the different instrument used (see Appendix B) could introduce a bias.
3.4. AGN vs starburst diagnostics
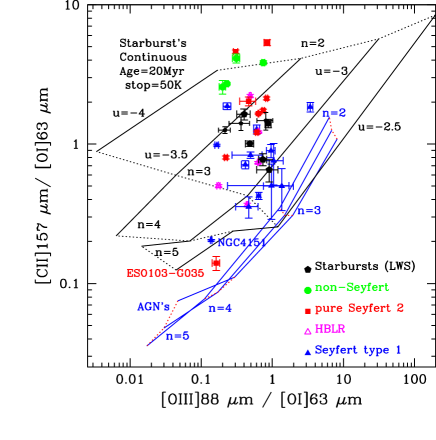
We have used the Cloudy666Available at: http://www.nublado.org photoionisation code (version 10.00), last described by Ferland et al. (1998), to make constant density, constant ionisation parameter models for both AGN NLR and starburst emission regions. For the AGN models, we chose a slope of the ionising continuum of = -1.4, with a grid of hydrogen densities nH = 102, 103, 104, 105 and 106 cm-3 and ionisation parameters of U = 10-1.5, 10-2.0 and 10-2.5. To allow the models to also reproduce the photodissociation regions (PDR) located outside the ionised regions, the integration was allowed to continue until the low temperature of 50K was reached.
The starburst models adopted the ionising spectrum from the Starburst’99 code (Leitherer et al., 1999) for continuous star formation with an age of 20 106 yr. The starburst grid spans values of densities of nH = 102, 103, 104, 105 and 106 cm-3 and ionisation parameters of U = 10-2.0, 10-2.5, 10-3.0, 10-3.5, 10-4.0 and 10-4.5. To be able to directly compare the AGN with the starburst models, we have used almost the same parameter grid for the two sets of models, the difference being in the ionisation parameters that extend up to U=10-1.5 for AGN, while the starburst models extend down to U=10-4.5. We note that in the following figures (from 8 to 12) we were not able to plot all models for all values of the two parameters, because some lines are not produced in some models. Also for the starburst models, the integration was continued till the low temperature of 50K was reached to model the photodissociation regions (PDR) located outside the HII regions. However, we have also computed ”pure” starburst models, with the stopping temperature set to the default of 1000K, that will be used to separate the PDR emission from that due to photoionisation.
We show in the following the predicted line ratio diagrams, compared with observations of the galaxies observed in this work, the PACS data for MRK463 and HII region galaxies and LINERs (Farrah et al., 2013), as well as starburst and Seyfert galaxies from the ISO-LWS literature (Brauher et al., 2008).
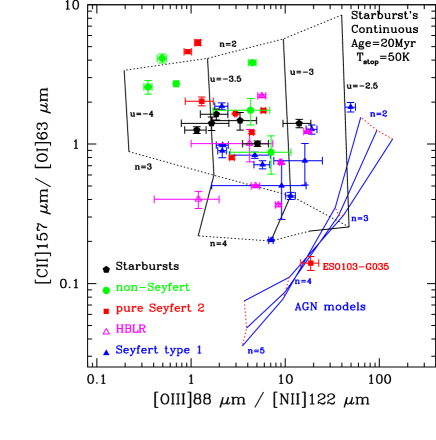
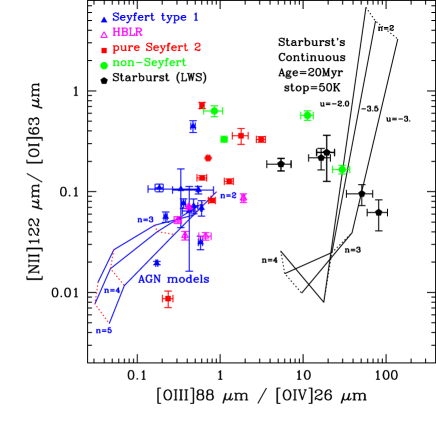
The first sequence of diagrams, Fig. 8(a,b) and Fig. 9(a,b), show the [CII]157m/[OI]63m line ratio as a function of various ionisation-sensitive line ratios: [OIII]88m/[OI]63m, [OIII]88m/[NII]122m, [NeII]12.8m/[NeIII]15.5m and [OIII]88m/[OIV]26m. It can be seen that the [CII]157m/[OI]63m line ratio is mainly sensitive to the gas density. Only in Fig. 8(a), because it includes [OI]63m also in the x-axis, some ionisation dependence of the [CII]157m/[OI]63m line ratio is seen. In general, the combination of these two line ratios is only able to weakly separate the AGN and starburst emission. AGN and starburst models overlap when we consider a possible high-ionization starburst model with U=10-2.5, which is considered to be the extreme value for energetic starburst galaxies.
In Fig. 8(b) the [CII]157m/[OI]63m versus [OIII]88m/[NII]122m line ratio diagram, is only able to weakly separate, through photoionisation models, some of the Seyfert galaxies from others which are photoionised purely by starbursts. The greatest ambiguities occur when starburst models are included with as large as 10-2.5. This only partially confirms the results of the ISO-LWS spectrometer (Spinoglio et al., 2000). It appears therefore that in galaxies where the nucleus dominates over the galactic emission, the [OI]63m/ [CII]157m ratio increases. This latter line ratio is indeed higher in X-ray Dominated Regions (XDR), characterised by the presence of an AGN, compared to classical photodissociation regions, at a given density, column and radiation field strength. This is because in PDRs, the fine-structure lines are only produced at the edge of the cloud, whereas the deeply penetrating AGN X-rays in XDRs generate emission throughout the entire volume. While in PDRs the [OI]63m/ [CII]157m ratio depends only on density and radiation field, in XDR it depends also on column density. Moreover [OI] emission dominates over [CII] emission in XDR because carbon does not become fully ionised (Meijerink, Spaans & Israel, 2007).
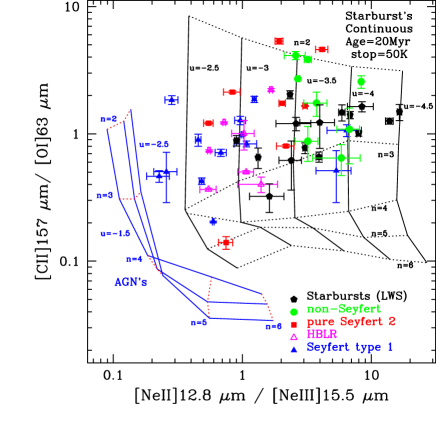
Fig. 9(a) shows that the combination of the [CII]157m/[OI]63m line ratio with the mid-IR line ratios from the neon lines, observed with the IRS onboard of Spitzer, is not only able to separate AGN from starburst galaxies, but it also defines a sequence of excitation among the Seyfert nuclei. This diagram shows most Seyfert 1’s in the region of pure AGN models, HBLR galaxies at intermediate locations between AGN and starburst models and ”pure” Seyfert 2’s towards the starburst models. In these plots most starburst and even LINER galaxies (from the observations of Farrah et al. (2013)) are well explained by starburst photoionisation models. Fig. 9(b), showing the [CII]157m/[OI]63m versus the [OIII]88m/[OIV]26m line ratio, is able to separate, by two orders of magnitude on its x-axis, AGN from starbursts: in this diagram all detected Seyfert 1’s, HBLR and Seyfert 2’s are close to the AGN grid models, while starburst galaxies and what we considered non-Seyfert nuclei, including a few LINERs and ULIRGs, are located at intermediate positions between AGN and starburst models.
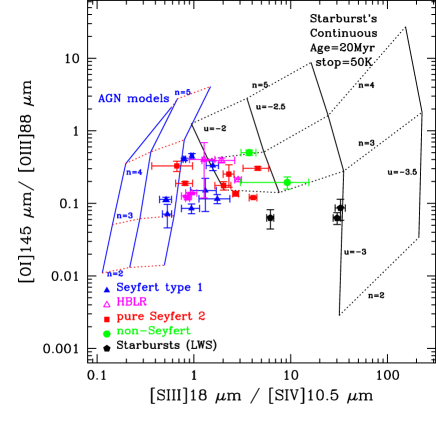
Fig. 10(a) shows the [NII]122m/[OI]63m line ratio, which is mostly sensitive to density, mainly because the lines of [NII] and [OI] are characterised by very different critical densities for collisional de-excitation (namely ncrit 4 102 cm-3 for [NII]122m) as a function of the [OIII]88m/[OIV]26m ratio. The diagram of Fig. 11(a) shows that most Seyfert 2 galaxies have line ratios consistent with a combination of AGN and starburst emission, while Seyfert 1’s and HBLR’s ratios are well reproduced by pure AGN models. Fig. 10(b) shows the [OI]145m/[OIII]88m line ratio, which is mostly sensitive to density, again as a function of the ionisation-sensitive ratio of [SIII]18m/[SIV]10.5m. The [OI]145m/[OIII]88m line ratio does not seem to be able to separate AGN and starburst emission, while, as seen already, the ionisation sensitive ratio in the x-axis can do this.
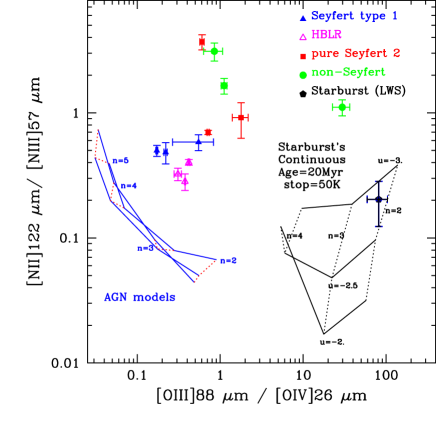
Fig. 11 shows the [NII]122m/[NIII]57m line ratio vs. the [OIII]88m/[OIV]26m ratio. As noted above, the [OIII]88m/[OIV]26m ratio is able to separate AGN versus starburst galaxies, while the observed [NII]122m/[NIII]57m line ratios in most galaxies show an excess compared to photoionisation models, which is higher in the lower excitation active galaxies (the pure Seyfert 2’s and the non-Seyferts). All observed ratios are offset with respect to any line connecting the two grids of models, indicating that they cannot be reconciled with any combination of AGN and starburst models. However, no conclusion can be drawn from this diagram because of the few data points and also because of the lack of predictions of the [OIV]26m line for low ionisation starburst models, which prevents their inclusion in the diagram. However, the low ionisation parameter (logU=-3.5 and -4) starburst models predict [NII]122m/[NIII]57m line ratios of 2.5 and of 1.2 for logU=-3.5 and 20 and 10 for logU=-4, at densities of and cm-3, respectively, indicating that the high [NII]/[NIII] ratios observed in a few galaxies in Fig. 11 are consistent with starburst models.
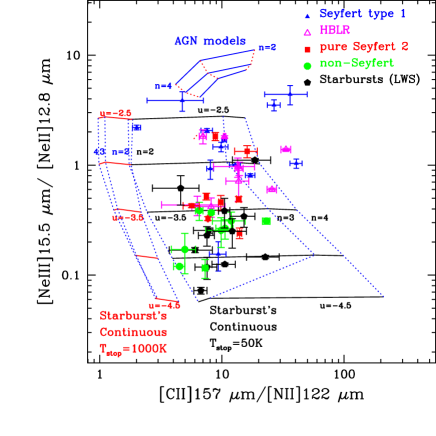
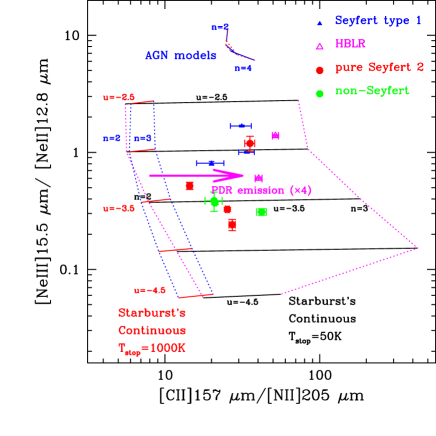
Fig. 12(a) and (b) show the [NeII]12.8m/[NeIII]15.5m ionisation-sensitive line ratio versus [CII]157m/[NII]122m and [CII]157m/[NII]205m, which are able to quantitatively separate the photoionisation and photodissociation regions contributions (e.g., Oberst et al., 2006). In particular, Fig. 12(a) shows that most of the Seyfert galaxies of this study can well be represented in this line ratio diagram by starburst photoionisation models which include photodissociation region emission, which is accounted for by Cloudy models, when the integration is continued down to the low gas temperature of 50K. In the figure we have included for comparison the “bare” starburst models which have only the photoionisation component, but not the photodissociated one, by using the default stopping criterion in Cloudy for HII regions: T=1000K. As can be seen from the figure, no one object can be reproduced by the photoionised-only models, but the PDR component is always needed to reproduce the observations.
Fig. 12(b) shows the [NeII]12.8m/[NeIII]15.5m ratio as a function of the [CII]157m/[NII]205m ratio. Although here we have fewer objects observed in the [NII]205m line, we can use this figure to measure how much [CII] is due to PDR emission. The comparison of the observed [CII]/[NII] ratios with starburst photoionisation models that included PDR emission, which adequately represent the data, shows that the [CII] emission due to the PDR component is at least times brighter that the photoionised component for most detected galaxies.
4. Conclusions and summary
We have reported here the results of a spectroscopic survey of 26 local Seyfert galaxies in the far-IR ionic and neutral fine-structure lines with the PACS Spectrometer, onboard Herschel. PACS data have been combined with Herschel-SPIRE and Spitzer-IRS spectroscopy of fine-structure lines at both longer and shorter wavelengths. This allowed us to use the line ratios of the ions [SIII], [NeV], [OIII], [NII], and the neutral atoms of [OI] and [CI] as density estimators of the gas, assumed to be in a pure collisional regime. The [OIII]88m/52m and the [NII]205m/122m and the [CI]609m/370m line ratios are confirmed to provide good density estimates of ionised and neutral gas, respectively, at densities of nH = 101-103 cm-3. The mid-IR line ratios, measured by Spitzer, [SIII]33m/18m and the [NeV]24m/14m, are density-sensitive for nH 104 cm-3. Using the different line ratios of ionised lines, we have determined the gas densities in the sample galaxies. Because each line ratio is sensitive to a particular density range, we have also identified in this way density stratifications which are present in the same galaxy. We have found that higher ionisation lines are, on average, emitted from higher density gas.
The [OI]145m/63m line ratio provides a measure of the gas temperature of the neutral ISM gas, for nH 104 cm-3 and it anti-correlates with the [SIII]33m/18m line ratio. This relation reflects into an anti-correlation between the ionised gas density and the neutral ISM gas temperature.
The use of the observed [CII]157m/[OI]63m line ratio with other far-IR line ratios (e.g. [OIII]88m/[OI]63m, or [OIII]88m/[NII]122m), in combination with photoionisation models, is only moderately able to discriminate the excitation mechanism at the origin of the line emission, between young stars, or black hole accretion. This separation is better traced by mid-IR line ratios (e.g. [NeII]12.8m/[NeIII]15.5m or [SIII]18m/[SIV]10.5m) or mixed mid- and far-IR ratios (e.g. [OIII]88m/[OIV]26m).
The [CII]157m/[NII]122m and [CII]157m/[NII]205m line ratios are able to quantify the amount of PDR emission in a galaxy compared to what is expected by photoionisation. We find that most of the [CII] emission arises from photodissociation regions, while only about one fifth of it is on average produced in pure HII regions.
| Target | R.A.(2000) | Dec.(2000) | type | 12m | Ref. | |
|---|---|---|---|---|---|---|
| (h:m:s) | (d:m:s) | km s-1 | sample | |||
| NGC1056 | 02:42:48.3 | +28:34:27 | 1545 | non-Sy | ✓ | (1) |
| MRK 1066 | 02:59:58.6 | +36:49:14 | 3605 | Sy2/nHBLR | ||
| UGC 2608 | 03:15:01.4 | +42:02:09 | 6998 | Sy2/nHBLR | ||
| 3C120 | 04:33:11.1 | +05:21:16 | 9896 | Sy1 | ✓ | (1) |
| MRK 3 | 06:15:36.3 | +71:02:15 | 4050 | Sy2/HBLR | ||
| UGC5101 | 09:35:51.6 | +61:21:11 | 11802 | non-Sy | ✓ | |
| NGC3227 | 10:23:30.6 | +19:51:54 | 1157 | Sy1 | ✓ | (2) |
| NGC 3516 | 11:06:47.5 | +72:34:07 | 2649 | Sy1 | ✓ | (3) |
| NGC3982 | 11:56:28.1 | +55:07:31 | 1109 | Sy2/nHBLR | ✓ | (1) |
| NGC4051 | 12:03:09.6 | +44:31:53 | 700 | Sy1 | ✓ | (1) |
| NGC4151 | 12:10:32.6 | +39:24:21 | 995 | Sy1 | ✓ | (2) |
| NGC4388 | 12:25:46.7 | +12:39:44 | 2524 | Sy2/HBLR | ✓ | (1) |
| NGC 4507 | 12:35:36.6 | –39:54:33 | 3538 | Sy2/HBLR | ||
| TOL1238-364 (IC3639) | 12:40:52.8 | –36:45:21 | 3275 | Sy2/HBLR | ✓ | (3) |
| NGC 5256 (Mrk266) | 13:38:17.5 | +48:16:37 | 8353 | Sy2/nHBLR | ✓ | (1) |
| IRAS13451+1232 | 13:47:33.3 | +12:17:24 | 36497 | Sy2/HBLR | ||
| IC 4329A | 13:49:19.2 | –30:18:34 | 4813 | Sy1 | ✓ | (1) |
| NGC 5506 | 14:13:14.9 | –03:12:27 | 1853 | Sy2/nHBLR | ✓ | (1) |
| NGC 5728 | 14:42:23.9 | –17:15:11 | 2804 | Sy2/nHBLR | ||
| IRAS18216+6418 | 18:21:57.3 | +64:20:36 | 89038 | Sy1 | ||
| ESO103-G035 | 18:38:20.3 | –65:25:39 | 3983 | Sy2/nHBLR | ||
| ESO140-G043 | 18:44:54.0 | –62:21:53 | 4250 | Sy1 | ||
| MRK 509 | 20:44:09.7 | –10:43:25 | 10312 | Sy1 | ✓ | (1) |
| NGC7130 | 21:48:19.5 | –34:57:05 | 4842 | non-Sy | ✓ | (1) |
| NGC7172 | 22:02:01.9 | –31:52:11 | 2603 | Sy2/nHBLR | ✓ | (1) |
| NGC7582 | 23:18:23.5 | –42:22:14 | 1575 | Sy2/nHBLR | ✓ | (1) |
| Line | Spec. Resolution | Angular Resolution | ||
|---|---|---|---|---|
| (m) | (GHz) | ( km s-1) | (arcsec) | |
| [OIII]3P2–3P1 | 51.81 | 5787.57 | 105 | 9.71 |
| [NIII]2P3/2–2P1/2 | 57.32 | 5230.43 | 105 | 9.7 |
| [OI]3P1–3P2 | 63.18 | 4744.77 | 9.7 | |
| [OIII]3P1–3P0 | 88.36 | 3393.01 | 9.7 | |
| [NII]3P2–3P1 | 121.90 | 2459.38 | 9.7 | |
| [OI]3P0–3P1 | 145.52 | 2060.07 | 10.3 | |
| [CII]2P3/2–2P1/2 | 157.74 | 1900.54 | 11.2 |
Notes: 1: beam size is dominated by the spaxel size (9.7”) below 120m
| Line fluxes (10) | ||||||||||
|---|---|---|---|---|---|---|---|---|---|---|
| NAME | [OIII] | [NIII] | [OI] | [OIII] | [NII] | [OI] | [CII] | [NII]1 | [CI]1 | [CI]1 |
| (51.81) | (57.32) | (63.18) | (88.36) | (121.90) | (145.52) | (157.74) | (205.18) | (370.52) | (609.31) | |
| NGC1056 | 8.320.64 | 55.521.56 | 41.470.96 | 9.220.63 | 7.440.38 | 213.10.86 | 5.050.34 | 0.770.15 | 1.22 | |
| MRK1066 | 136.822.35 | 30.420.84 | 11.200.36 | 9.260.28 | 109.721.18 | |||||
| UGC2608 | 31.662.72 | 77.651.50 | 64.590.75 | 165.30.85 | 4.660.322 | 1.360.022 | 2.482 | |||
| 3C120 | 46.023.33 | 21.411.39 | 73.291.37 | 1.560.45 | 39.510.54 | |||||
| MRK3 | 54.47.16 | 15.122.68 | 124.082.41 | 55.050.76 | 6.500.38 | 7.640.12 | 45.420.34 | |||
| UGC5101 | 5.890.41 | 19.091.22 | 14.910.96 | 12.070.73 | 1.160.16 | 78.780.85 | 3.79.0.44 | 1.580.21 | 1.6 | |
| NGC3227 | 3.00 | 133.11.34 | 22.081.06 | 10.20.99 | 9.880.37 | 130.810.79 | 3.860.43 | 4.660.19 | 2.270.43 | |
| NGC3516 | 23.101.93 | 22.131.18 | 4.140.53 | 20.720.53 | ||||||
| NGC3982 | 4.33 | 52.121.22 | 15.940.77 | 17.210.68 | 4.940.34 | 239.880.91 | 8.810.37 | 1.00.15 | 1.32 | |
| NGC4051 | 1.50 | 26.800.72 | 6.220.60 | 2.930.18 | 2.070.12 | 50.091.42 | 2.500.43 | 0.780.13 | 1.13 | |
| NGC4151 | 40.856.30 | 12.780.85 | 325.831.68 | 45.00.92 | 6.370.22 | 18.250.19 | 66.530.52 | 2.120.31 | 0.840.10 | 0.69 |
| NGC4388 | 26.011.66 | 199.691.50 | 127.961.30 | 7.340.65 | 15.080.34 | 245.510.86 | 4.740.19 | 2.670.07 | 1.450.2 | |
| NGC4507 | 128.312.03 | 22.510.78 | 4.640.32 | 8.810.37 | 64.360.45 | |||||
| IC3639 | 2.35 | 82.801.43 | 40.520.67 | 7.160.59 | 8.570.40 | 183.661.26 | 4.550.21 | 0.580.07 | 1.17 | |
| NGC5256 | 48.372.89 | 91.261.69 | 68.011.27 | 11.560.44 | 9.250.56 | 158.720.68 | ||||
| IRAS 13451+1232 | 10.390.84 | 3.05 | 0.420.06 | 5.610.24 | ||||||
| IC4329A | 19.072.81 | 4.66 0.51 | 39.961.38 | 25.770.84 | 2.250.19 | 2.920.12 | 17.00.41 | |||
| NGC5506 | 55.055.85 | 26.210.84 | 150.161.41 | 94.750.88 | 10.540.21 | 11.980.19 | 110.820.58 | |||
| NGC5728 | 112.821.95 | 68.51.26 | 15.490.47 | 12.910.53 | 136.90.48 | |||||
| IRAS18216+6418 | 13.141.01 | 11.640.38 | 0.75 | 2.10 | 2.05 | |||||
| ESO103-G035 | 48.32.19 | 7.840.59 | 0.420.06 | 2.570.22 | 6.760.46 | |||||
| ESO140-G043 | 27.061.30 | 11.270.78 | 1.960.24 | 0.960.08 | 19.260.34 | |||||
| MRK509 | 26.441.52 | 15.940.58 | 1.840.20 | 33.720.63 | ||||||
| NGC7130 | 19.202.35 | 95.461.21 | 21.980.87 | 31.620.70 | 11.010.51 | 258.771.31 | 12.30.18 | 2.820.10 | 1.790.22 | |
| NGC7172 | 6.300.70 | 32.421.46 | 27.431.31 | 23.240.61 | 4.830.40 | 173.400.78 | 12.00.41 | 4.50.4 | 3.820.52 | |
| NGC7582 | 108.130.40 | 90.972.57 | 294.141.93 | 187.681.48 | 63.370.59 | 22.550.29 | 486.61.27 | 19.20.54 | 7.590.20 | 3.440.28 |
| Line fluxes (10) in SH (4.7″ 11.3″) | Line fluxes (10) in LH (11.1″ 22.3″) | Ref. | ||||||||
|---|---|---|---|---|---|---|---|---|---|---|
| NAME | [SIV] | [NeII] | [NeV] | [NeIII] | [SIII] | [NeV] | [OIV] | [SIII] | [SiII] | |
| (10.51) | (12.81) | (14.32) | (15.56) | (18.71) | (24.32) | (25.89m) | (33.48m) | (34.82m) | ||
| NGC1056 | 1.31 | 33.61.04 | 1.80 | 10.40.34 | 18.30.35 | 1.23 | 1.400.30 | 36.60.69 | 49.10.97 | (1) |
| MRK1066 | 9.912.02 | 101.18.93 | 7.081.32 | 46.43.18 | 45.34.23 | 8.181.95 | 38.12.54 | 62.712.2 | 93.814.4 | (2) |
| UGC2608 | 28.742.07 | 58.274.91 | 30.332.13 | 69.464.52 | 28.502.62 | 32.181.42 | 134.378.39 | 46.615.89 | 83.1913.26 | (2) |
| 3C120 | 24.10.86 | 7.84 0.63 | 16.60.89 | 27.60.93 | 7.341.48 | 290.62 | 1230.76 | 17.31.93 | 36.33.02 | (1) |
| MRK3 | 55.92.92 | 95.307.47 | 63.83.22 | 174.11.7 | 52.94.09 | 60.33.87 | 178.15.7 | 57.6 10.5 | 85.06.7 | (2) |
| UGC5101 | 1.150.450 | 34.742.61 | 2.940.41 | 13.41.49 | 10.62.97 | 2.721.02 | 7.001.43 | 12.53.80 | (2) | |
| NGC3227 | 25.60.33 | 74.30.86 | 22.60.38 | 74.40.43 | 24.40.57 | 16.00.45 | 61.10.38 | 25.91.33 | 55.91.60 | (3) |
| NGC3516 | 13.330.38 | 8.070.25 | 7.880.50 | 17.720.33 | 5.860.35 | 10.390.33 | 46.920.35 | 9.520.96 | 22.140.54 | (4) |
| NGC3982 | 1.480.33 | 11.40.34 | 2.890.31 | 6.790.30 | 3.160.39 | 1.620.30 | 5.110.40 | 15.40.61 | 32.81.07 | (1) |
| NGC4051 | 4.750.38 | 21.20.31 | 10.70.35 | 17.10.36 | 7.450.49 | 32.20.21 | 33.70.52 | 38.83.93 | 39.61.01 | (1,5) |
| NGC4151 | 84.644.37 | 132.97.78 | 76.96 4.10 | 205.39.72 | 69.485.55 | 68.13.97 | 243.613.26 | 61.409.17 | 132.94.12 | (2) |
| NGC4388 | 45.30.76 | 76.60.97 | 46.10.86 | 1061.11 | 39.11.19 | 73.01.05 | 3402.15 | 85.12.78 | 1352.76 | (1) |
| NGC4507 | 8.351.63 | 30.551.84 | 12.52.93 | 28.52.21 | 16.12.85 | 8.391.73 | 33.84.53 | 23.66.31 | 45.68.21 | (2) |
| IC3639 | 5.700.28 | 45.150.54 | 11.150.61 | 27.000.44 | 16.320.48 | 5.350.67 | 21.210.58 | 32.801.62 | 44.991.62 | (4) |
| NGC5256 | 2.570.25 | 19.80.20 | 2.310.15 | 10.60.23 | 8.380.39 | 11.90.31 | 56.80.76 | 48.21.09 | 92.31.46 | (1) |
| IRAS13451+1232 | 0.26 | 4.340.57 | 0.81 | 3.100.65 | 1.89 | 1.31 | 0.60 | (2) | ||
| IC4329A | 29.11.32 | 27.60.73 | 29.30.88 | 57.00.97 | 15.01.44 | 34.60.85 | 1171.42 | 16.02.19 | 32.53.06 | (1) |
| NGC5506 | 25.40.32 | 26.40.40 | 18.50.28 | 45.60.24 | 19.10.50 | 56.50.50 | 2390.87 | 90.11.71 | 1372.40 | (1) |
| NGC5728 | 28.93.63 | 28.331.61 | 21.21.28 | 51.71.44 | 23.41.71 | 29.41.76 | 113.13.2 | 49.17.44 | 67.39.94 | (2) |
| IRAS18216+6418 | 5.670.32 | 3.340.32 | 4.630.58 | 10.031.75 | 3.350.51 | 4.581.13 | 23.042.58 | (2) | ||
| ESO103-G035 | 12.02.05 | 29.232.53 | 16.72.41 | 39.01.60 | 8.012.24 | 9.911.10 | 33.32.29 | 4.52 | 4.18 | (2) |
| ESO140-G043 | 8.390.78 | 9.420.54 | 7.050.65 | 13.80.58 | 7.920.95 | 7.070.51 | 23.51.17 | 10.83.05 | 10.91.80 | (2) |
| MRK509 | 4.130.76 | 14.00.79 | 4.740.59 | 14.50.60 | 7.191.20 | 6.820.46 | 27.50.57 | 7.411.91 | 14.53.41 | (1) |
| NGC7130 | 5.270.84 | 79.30.93 | 9.090.64 | 29.40.77 | 19.60.33 | 5.220.86 | 19.70.84 | 48.22.59 | 93.94.90 | (1) |
| NGC7172 | 5.870.61 | 33.01.01 | 10.20.67 | 17.10.68 | 11.91.00 | 13.80.49 | 45.40.48 | 26.91.51 | 59.32.42 | (1) |
| NGC7582 | 21.31.43 | 3226.41 | 38.81.54 | 1052.05 | 87.31.99 | 63.64.29 | 2625.54 | 2447.85 | (1) | |
| NAME | class | [OIII] | log(ne) (range)1 | [SIII] | log(ne)(range) | [NII] | log(ne)(range) | [NeV] | log(ne)(range) |
|---|---|---|---|---|---|---|---|---|---|
| 88.36/51.81 | (cm-3) | 33.48/18.71 | (cm-3) | 205.18/121.90 | (cm-3) | 24.32/14.32 | (cm-3) | ||
| NGC1056 | no-S | 2.000.08 | 1.2 | 0.540.07 | 1.65 (1.55-1.76) | ||||
| MRK1066 | Sy2 | 1.380.40 | 2.34 (1.-2.85) | 1.150.49 | 2.50 (2.-3.59) | ||||
| UGC2608 | Sy2 | 2.040.20 | 0. | 1.630.36 | 1.65 (1.-2.51) | 1.060.12 | 2.85 (2.31-3.13) | ||
| 3C120 | Sy1 | 1.590.14 | 1.38 (0.59-1.68) | 2.360.74 | 1.(0.-1.70) | 1.750.13 | 2. | ||
| MRK3 | HBLR | 1.010.15 | 2.24 (2.07-2.39) | 1.090.28 | 2.73 (2.36-3.03) | . | 0.950.11 | 3.11 (2.85-3.31) | |
| UGC5101 | no-S | 1.180.69 | 2.62 (1.-3.41) | 0.310.05 | 2.07 (1.96-2.20) | 0.930.48 | 3.15 (2.-3.94) | ||
| NGC3227 | Sy1 | 1.060.08 | 2.76 (2.67-2.85) | 0.380.08 | 1.92 (1.77-2.09) | 0.710.03 | 3.52 (3.47-3.56) | ||
| NGC3516 | Sy1 | 1.620.26 | 1.70 (1.-2.38) | 1.320.13 | 2.(1.-2.22) | ||||
| NGC3982 | Sy2 | 1.820.19 | 1.(0.-1.65) | 0.510.04 | 1.69 (1.63-1.76) | 0.560.16 | 3.75 (3.50-4.03) | ||
| NGC4051 | Sy1 | 1.770.66 | 1.(0.-2.70) | 0.850.20 | 1.23 (0.95-1.50) | 0.900.16 | 3.20 (2.85-3.47) | ||
| NGC4151 | Sy1 | 1.100.19 | 2.14 (1.92-2.34) | 0.880.20 | 2.95 (2.74-3.17) | 0.330.06 | 2.02 (1.90-2.17) | 0.880.10 | 3.24 (3.04-3.41) |
| NGC4388 | HBLR | 2.180.14 | 1. | 0.650.08 | 1.50 (1.39-1.61) | 1.580.05 | 2. | ||
| NGC4507 | HBLR | 1.470.65 | 2.18 (1.-3.02) | 0.670.30 | 3.58 (3.07-4.10) | ||||
| IC3639 | HBLR | 2.010.16 | 1. | 0.640.08 | 1.51 (1.40-1.62) | 0.480.09 | 3.88 (3.73-4.05) | ||
| NGC5256 | Sy2 | 1.410.11 | 1.75 (1.55-1.91) | 2.090.18 | 1. | 1.400.10 | 2. | ||
| IC4329A | Sy1 | 1.350.24 | 1.84 (1.38-2.13) | 1.070.25 | 2.75 (2.44-3.02) | 1.180.06 | 2.31 (2.-2.64) | ||
| NGC5506 | Sy2 | 1.720.20 | 0.72 (0.-1.55) | 1.490.36 | 2.13 (1.-2.68) | 1.110.06 | 2.68 (2.38-2.87) | ||
| NGC5728 | Sy2 | 2.100.47 | 1.(0.-1.65) | 1.390.17 | 2.(1.-1.78) | ||||
| IRAS18216+6418 | Sy1 | 0.990.37 | 3.02 (2.-3.66) | ||||||
| ESO103-G035 | Sy2 | 0.660.41 | 3.20 (2.75-3.87) | 0.590.15 | 3.70 (3.47-3.96) | ||||
| ESO140-G043 | Sy1 | 1.360.55 | 2.38 (1.-3.03) | 1.000.16 | 3.00 (2.44-3.31) | ||||
| MRK509 | Sy1 | 1.030.44 | 2.79 (2.18-3.28) | 1.440.28 | 2.(1.-2.44) | ||||
| NGC7130 | no-S | 2.460.17 | 1. | 0.390.01 | 1.90 (1.88-1.92) | 0.570.13 | 3.73 (3.53-3.96) | ||
| NGC7172 | Sy2 | 2.260.32 | 1. | 0.520.03 | 1.68 (1.63-1.72) | 1.350.14 | 2.(1.-1.98) | ||
| NGC7582 | Sy2 | 2.790.15 | 1. | 0.300.01 | 2.09 (2.07-2.12) | 1.640.18 | 2. |
| NAME | class | Derived Temperature |
|---|---|---|
| (K) | ||
| NGC1056 | no-S | |
| MRK1066 | Sy2 | 93.76.5 |
| UGC2608 | Sy2 | |
| 3C120 | Sy1 | |
| MRK3 | HBLR | 82.83.6 |
| UGC5101 | no-S | 81.522.8 |
| NGC3227 | Sy1 | 106.56.6 |
| NGC3516 | Sy1 | |
| NGC3982 | Sy2 | 154.332.1 |
| NGC4051 | Sy1 | 112.13.4 |
| NGC4151 | Sy1 | 74.61.2 |
| NGC4388 | HBLR | 108.94.2 |
| NGC4507 | HBLR | 95.77.7 |
| IC3639 | HBLR | 186.333.7 |
| NGC5256 | Sy2 | 177.937.2 |
| IRAS13451+1232 | HBLR | 56.69.7 |
| IC4329A | Sy1 | 104.310.3 |
| NGC5506 | Sy2 | 116.93.9 |
| NGC5728 | Sy2 | 247.868.1 |
| IRAS18216+6418 | Sy1 | |
| ESO103-G035 | Sy2 | 70.79.7 |
| ESO140-G043 | Sy1 | 51.84.5 |
| MRK509 | Sy1 | 97.621.8 |
| NGC7130 | no-S | 255.376.1 |
| NGC7172 | Sy2 | |
| NGC7582 | Sy2 | 111.02.8 |
References
- Abel et al. (2009) Abel, N.P., Dudley, C., Fischer, J., Satyapal, S., van Hoof, P.A.M., 2009, ApJ, 701, 1147
- Armus et al. (2004) Armus, L., Charmandaris, V., Spoon, H. W. W. et al. 2004, ApJS, 154, 178
- Armus et al. (2007) Armus, L., Charmandaris, V., Bernard-Salas, J. et al. 2007, ApJ, 656, 148
- Bernard-Salas et al. (2009) Bernard-Salas, J., Spoon, H. W. W., Charmandaris, V. et al. 2009, ApJS, 184, 230
- Brandl et al. (2006) Brandl, B.R., Bernard-Salas, J., Spoon, H. W. W. et al. 2006, ApJ, 653, 1129
- Braine & Hughes (1999) Braine, J. & Hughes, D. H. 1999, A&A, 344, 779
- Brauher et al. (2008) Brauher, J.R., Dale, D.A., Helou, G. 2008, ApJS, 178, 280
- Buchanan et al. (2006) Buchanan, C.L., Gallimore, J. F., O’Dea, C. P. et al. 2006, AJ, 132, 401
- Clegg et al. (1996) Clegg, P.E., Ade, P. A. R., Armand, C. et al 1996, A&A, 315, L38
- Dasyra et al. (2008) Dasyra, K. M., Ho, L. C., Armus, L., et al. 2008, ApJ, 644, L9
- Dasyra et al. (2011) Dasyra, K. M., Ho, L. C., Netzer, H., et al. 2011, ApJ, 740, 94
- de Graauw et al. (1996) de Graauw, T. Haser, L. N., Beintema, D. A. et al. 1996, A&A, 315, 49
- Farrah et al. (2013) Farrah, D. Lebouteiller, V., Spoon, H. W. W. et al.. 2013, ApJ, 776, 38
- Ferland et al. (1998) Ferland, G. J., Korista, K.T., Verner, D.A. et al. 1998, PASP, 110, 761
- Fischer et al. (1999) Fischer, J., Luhman, M. L., Satyapal, S. et al. 1999, ApSS, 266, 91
- Genzel et al. (1998) Genzel, R., Lutz, D., Sturm, E. et al. 1998, ApJ, 498, 579
- Houck et al. (2004) Houck, J.R. Roellig, T. L., van Cleve, J. et al. 2004, ApJS, 154, 18
- Hummer et al. (1993) Hummer, D.G., Berrington, K. A., Eissner, W. et al. 1993, A&A, 279, 298
- Kessler et al. (1996) Kessler, M.F., Steinz, J. A., Anderegg, M. E. et al. 1996, A&A, 315, L27
- Isobe, Feigelson & Nelson (1986) Isobe, T., Feigelson, E.D. & Nelson, P.I. 1986 ApJ, 306, 490
- Leitherer et al. (1999) Leitherer, C., Schaerer, D., Goldader, J. D. et al 1999, ApJS, 123, 3
- Luhman et al. (2003) Luhman, M. L., Satyapal, S., Fischer, J. et al. 2003, ApJ, 594, 758
- Maiolino et al. (1995) Maiolino, R., Ruiz, M., Rieke, G.H. and Keller, L.D. 1995, ApJ, 446, 561
- Meijerink, Spaans & Israel (2007) Meijerink, R., Spaans, M., Israel, F.P. 2007, A&A, 461, 793
- Oberst et al. (2006) Oberst, T.E., Parshley, S. C., Stacey, G. J. et al. 2006, ApJ, 652, L125
- Osterbrock & Ferland (2006) Osterbrock, D.E. & Ferland, G.J. 2006, Astrophysics of gaseous nebulae and active galactic nuclei, 2nd ed., Sausalito, CA: University Science Books, 2006
- Ott (2010) Ott, S. 2010, Astronomical Society of the Pacific, 434, p.139
- Pereira-Santaella et al. (2013) Pereira-Santaella, M., Spinoglio, L., Busquet, G. et al. 2013, ApJ, 768, 55
- Pilbratt et al. (2010) Pilbratt, G.L., Riedinger, J. R., Passvogel, T. et al. 2010, A&A, 518, L1
- Poglitsch et al. (2010) Poglitsch, A., Waelkens, C., Geis, N. et al. 2010, A&A, 518, L2
- Rubin et al. (1994) Rubin, R.H., Simpson, J. P., Lord, S. D. et al 1994, ApJ, 420, 772
- Rush, Malkan & Spinoglio (1993) Rush, B., Malkan, M.A. & Spinoglio, L. 1993, ApJS, 89, 1
- Schoier et al. (2005) Schoier, F.L., van der Tak, F. F. S., van Dishoeck, E. F., Black, J. H. 2005, A&A, 432, 369
- Smith et al. (2007) Smith, J.D.T., Draine, B. T., Dale, D. A. et al. 2007, ApJ, 656, 770
- Spinoglio & Malkan (1992) Spinoglio, L. & Malkan, M.A. 1992, ApJ, 399, 504
- Spinoglio et al. (1997) Spinoglio, L., et al. 1997, Extragalactic Astronomy in the Infrared. Edited by G. A. Mamon, Trinh Xuan Thuan, and J. Tran Thanh Van. Paris: Editions Frontieres, p.333
- Spinoglio et al. (2000) Spinoglio, L., Benedettini, M., de Troia, G. et al. 2000, Proc. Conf. ”ISO beyond the Peaks”, Villafranca del Castillo, Spain, 2-4 February 2000, ESA-SP, 456, 261
- Spinoglio et al. (2005) Spinoglio, L., Malkan, M.A., Smith, H.A., González-Alfonso, E., Fischer, J. 2005, ApJ, 623, 123
- Tielens & Hollenbach (1985) Tielens, A.G.G.M & Hollenbach, D. 1985, ApJ, 291, 722
- Tommasin et al. (2008) Tommasin, S., Spinoglio, L., Malkan, M.A., Smith, H., Gonzalez-Alfonso, E., Charmandaris, V. 2008, ApJ, 676, 836.
- Tommasin et al. (2010) Tommasin, S., Spinoglio, L., Malkan, M., Fazio, G., 2010, ApJ, 709, 1257
- Tommasin et al. (2012) Tommasin, S.,Netzer, H., Sternberg, A. et al. 2012, ApJ, 753, 155
- Tran (2001) Tran, H.D., 2001, ApJ, 554, L19
- Tran (2003) Tran, H.D., 2003, ApJ, 583, 632
- Veilleux et al (2009) Veilleux, S., Rupke, D. S. N., Kim, D.-C. et al. 2009, ApJS, 182, 628
- Werner et al. (2004) Werner, M.W., Roellig, T. L., Low, F. J. et al. 2004, ApJS, 154, 1
Appendix A A. Line profiles
In this section we present the line profiles in Fig.13.
Appendix B B. Comparision of line fluxes from ISO-LWS and Herschel-PACS
We present in Fig. 14 the line fluxes observed with ISO-LWS (Brauher et al., 2008; Spinoglio et al., 1997) and PACS (this work). Besides the [OIII]52m line, reported in the text, most discrepancies happens to be for the [OIII]88m line, for which a significantly higher flux for all sources has been measured from ISO-LWS, with respect to PACS. In two cases, for 3C120 and IC4329A, also the [OI]63m flux is higher. We argue that this result is unlikely to be due to aperture effects, because the [OIII] lines are produced in high-ionisation environments, which are located in the central regions of galaxies. We do not have an explanation for this behaviour, other from instrumental systematic effects.
Appendix C C. Spitzer images of the observed galaxies
In this section we present the 3.6m IRAC Spitzer images of the sample galaxies, overplotted to the frame of the PACS spectrometer of 47 47 and the slit of 22.3 11.1 of the long-wavelength high-resolution mode (LH) of the IRS spectrometer of Spitzer and the short- and long-wavelengths beams of the SPIRE FTS spectrometer, for the galaxies for which these observations are available, in Fig.15 and 16