-titleConference Title, to be filled 11institutetext: Laboratoire AIM, CEA/DSM/IRFU/SAp - CNRS - Univ. Paris Diderot, Centre de Saclay, 91191 Gif-sur-Yvette Cedex, France 22institutetext: Space Science Institute, 4750 Walnut Street, Suite 205, Boulder, Colorado 80301 USA
Extracting surface rotation periods of solar-like Kepler targets
Abstract
We use various method to extract surface rotation periods of Kepler targets exhibiting solar-like oscillations and compare their results.
1 Introduction
Rotation plays a very important part in the evolution of a star, mainly because of transport processes due to meridional circulation. Furthermore, it remains difficult to account for the the internal rotation profiles of sub and red giants that were inferred from asteroseismic studies. In this work, we study the surface rotation rates and activity levels of Kepler solar-like oscillating stars - including Main-Sequence stars, subgiants and red giants - which are good asteroseimic targets.
2 Methodology
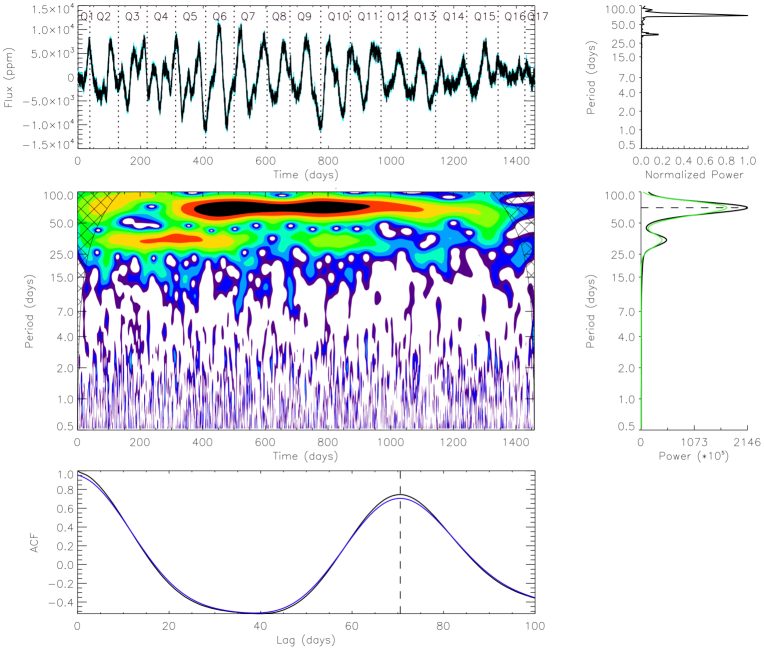
In order to get a robust determination of rotation periods, we use two types of data correction – PDC-MAP ThompsonRel21 and KADACS 2011MNRAS.414L…6G – as well as two different ways of getting an estimation of the rotation period – wavelets decomposition like in 2010A&A…511A..46M and autocorrelation function following 2013MNRAS.432.1203M . We then compare the four results obtained. If they all concur, we select the period obtained as the rotation period with a high confidence. As a last verification, we check visually all the stars for which a rotation period has been derived. The activity index is then calculated as in 2014JSWSC…4A..15M .
The results of this methodology applied on the sample of solar-like oscillating stars on the Main Sequence and the Subgiant phases have been reported in 2014arXiv1403.7155G .
3 Example for a red giant star
This methodology has also been used to study a sample of Kepler Red Giants and will be described in details in Ceillier et al. 2015 (in preparation). Due to their low activity levels, these stars are not supposed to show clear rotational modulations in their lightcurve. This is why only a small fraction of the global sample (around 2%) give conclusive results. These peculiar Red Giants could result from mergers, as discussed by Tayar et al. 2015 (in preparation).
An example of a Reg Giant star’s light curve analysis can be seen in Fig. 1. The 70 days modulation is clearly visible.
References
- (1) S.E. Thompson, J.L. Christiansen, J.M. Jenkins, D.A. Caldwell, T. Barclay, S.T. Bryson, C.J. Burke, J. Campbell, B.D. Catanzarite, B.D. Clarke et al., Kepler Data Release 21 Notes (KSCI-19061-001), Kepler mission (2013)
- (2) R.A. García, S. Hekker, D. Stello, J. Gutiérrez-Soto, R. Handberg, D. Huber, C. Karoff, K. Uytterhoeven, T. Appourchaux, W.J. Chaplin et al., Monthly Notices of the RAS 414, L6 (2011), 1103.0382
- (3) S. Mathur, R.A. García, C. Régulo, O.L. Creevey, J. Ballot, D. Salabert, T. Arentoft, P.O. Quirion, W.J. Chaplin, H. Kjeldsen, Astronomy and Astrophysics 511, A46 (2010), 0912.3367
- (4) A. McQuillan, S. Aigrain, T. Mazeh, Monthly Notices of the RAS 432, 1203 (2013), 1303.6787
- (5) S. Mathur, D. Salabert, R.A. García, T. Ceillier, Journal of Space Weather and Space Climate 4, A15 (2014), 1404.3076
- (6) R.A. García, T. Ceillier, D. Salabert, S. Mathur, J.L. van Saders, M. Pinsonneault, J. Ballot, P.G. Beck, S. Bloemen, T.L. Campante et al., ArXiv e-prints (2014), 1403.7155