ALMA Observations of Warm Dense Gas in NGC 1614 — Breaking of Star Formation Law in the Central kpc
Abstract
We present ALMA Cycle-0 observations of the CO (6-5) line emission and of the 435 dust continuum emission in the central kpc of NGC 1614, a local luminous infrared galaxy (LIRG) at a distance of 67.8 Mpc (). The CO emission is well resolved by the ALMA beam () into a circum-nuclear ring, with an integrated flux of , which is of the total CO (6-5) flux measured by Herschel. The molecular ring, located between from the nucleus, looks clumpy and includes seven unresolved (or marginally resolved) knots with median velocity dispersion of . These knots are associated with strong star formation regions with and . The non-detections of the nucleus in both the CO (6-5) line emission and the 435 continuum rule out, with relatively high confidence, a Compton-thick AGN in NGC 1614. Comparisons with radio continuum emission show a strong deviation from an expected local correlation between and , indicating a breakdown of the Kennicutt-Schmidt law on the linear scale of 100 pc.
Subject headings:
galaxies: interactions — galaxies: evolution — galaxies: starburst — galaxies: general1. Introduction
Luminous infrared galaxies (LIRGs) with , including ultra-luminous infrared galaxies (ULIRGs: ) are mostly advanced mergers (Sanders et al., 1988; Sanders & Mirabel, 1996; Scoville et al., 2000; Veilleux et al., 2002). They harbor extreme starbursts (star formation rate (SFR) ) and sometimes strong active galactic nuclei (AGN), and are among the most luminous objects in the local Universe (Sanders et al., 1988; Genzel et al., 1998; Surace et al., 1998; Veilleux et al., 1999; Scoville et al., 2000; Veilleux et al., 2009). Observations and theoretical simulations have shown that mergers can transform spirals to ellipticals (Toomre, 1977; Schweizer, 1982; Barnes, 1990; Genzel et al., 2001; Veilleux et al., 2002; Dasyra et al., 2006). Gas outflows ubiquitously found in (U)LIRGs (Armus et al., 1990; Heckman et al., 2000; Walter et al., 2002; Rupke et al., 2005; Sakamoto et al., 2009; Fischer et al., 2010; Feruglio et al., 2010; Sturm et al., 2011; Aalto et al., 2012; Veilleux et al., 2013; Cicone et al., 2014) may play an important role in quenching the star formation that leads to the formation of red sequence galaxies (Bell et al., 2007; Faber et al., 2007; Hopkins et al., 2008, 2013).
| SB | Date | Time (UTC) | Config | ||||
|---|---|---|---|---|---|---|---|
| (yyyy/mm/dd) | (m) | (min) | (K) | ||||
| (1) | (2) | (3) | (4) | (5) | (6) | (7) | (8) |
| X49990a_X505 | 2012/08/13 | 11:31:46 – 12:52:33 | E&C | 23 | 402 | 24.7 | 537 |
| X4b58a4_X1ee | 2012/08/28 | 08:58:50 – 10:23:37 | E&C | 27 | 402 | 24.7 | 756 |
Note. — Column (1) – schedule-block number; (2) & (3) – observation date and time; (4) – configuration; (5) – number of antennae; (6) – maximum baseline length; (7) – on-target integration time; (8) – median .
Extensive surveys of CO rotation lines in low J transitions such as CO (1-0) at 2.6 mm and CO (2-1) at 1.3 mm have found very large concentrations of molecular gas (up to a few times ) in the central kpc of (U)LIRGs (Solomon & Sage, 1988; Scoville et al., 1989; Sanders et al., 1991; Solomon et al., 1997; Downes & Solomon, 1998; Bryant & Scoville, 1999; Gao & Solomon, 1999; Evans et al., 2002). This gas, funneled into the nuclear region by the gravitational torque during a merger (Barnes & Hernquist, 1996; Hopkins et al., 2009), provides fuel for the nuclear starburst and/or AGN. However, due to the heavy dust extinction for the UV/optical/NIR observations and the lack of high angular resolution FIR/sub-mm/mm observations, it is still not very clear how the different constituents (i.e., gas, dust, stars, and black holes) in (U)LIRG nuclei interplay with each other. Some studies (Scoville et al., 1997; Downes & Solomon, 1998; Bryant & Scoville, 1999; Gao et al., 2001) suggest that much of the low J CO luminosities may be due to the emission of diffuse gas not closely related to the active star formation regions. Indeed, single dish and interferometry mm and submm observations have found that the intensities and spatial distributions of star formation in (U)LIRGs correlate significantly stronger with those of higher J CO lines (with upper level J ), which probe warmer and denser gas than low J lines (Yao et al., 2003; Iono et al., 2004; Wang et al., 2004; Wilson et al., 2008; Iono et al., 2009; Sakamoto et al., 2008; Tsai et al., 2012; Sakamoto et al., 2013; Xu et al., 2014). This is consistent with results of observations of other dense molecular gas indicators such as HCN lines (Solomon et al., 1992; Gao & Solomon, 2004b; Narayanan et al., 2008; Graciá-Carpio et al., 2008; García-Burillo et al., 2012). The multi-J CO observations of Papadopoulos et al. (2012) indicate that for many (U)LIRGs the global CO spectral line energy distribution (SLED) is dominated by a very warm () and dense () gas phase. Lu et al. (2014a) found a strong and linear correlation between the mid-J (with upper level J between 5 and 10) luminosity and the in a Herschel SPIRE Fourier Transform Spectrometer (FTS) survey of a large (U)LIRG sample.
In order to study the warm dense gas in nuclear regions of (U)LIRGs, we observed the CO (6-5) line emission (rest-frame frequency = 691.473 GHz) and associated dust continuum emission in two nearby examples, NGC 34 and NGC 1614, using the Band 9 receivers of the Atacama Large Millimeter Array (ALMA; Wootten & Thompson 2009). Both NGC 34 and NGC 1614 were chosen for these early ALMA observations, among the complete sample of 202 LIRGs of the Great Observatories All-sky LIRG Survey (GOALS; Armus et al. 2009), because of their close proximity () and bright CO (6-5) line fluxes () observed in the Herschel SPIRE FTS survey of GOALS galaxies (angular resolution: ; van der Werf et al. 2010; Lu et al. 2014a). This enables high signal-to-noise-ratio ALMA observations of warm gas structures with linear resolutions of for the given angular resolutions of . Further, both LIRGs have declination angles close to the latitude of the ALMA site, therefore the Band 9 observations are affected by minimal atmospheric absorption when being carried out near transit.
In this paper, we present ALMA Cycle-0 observations of the CO (6-5) line emission and the 435 dust continuum emission in the central kpc of NGC 1614 (also known as Mrk 617 and Arp 186). This LIRG has an infrared luminosity of (Armus et al., 2009) at a distance of 67.8 Mpc (). Most of the current star formation activity is in a circum-nuclear starburst ring (Neff et al., 1990; Alonso-Herrero et al., 2001; Díaz-Santos et al., 2008; Olsson et al., 2010), presumably triggered by a minor merger with a mass ratio of (Neff et al., 1990; Väisänen et al., 2012). The nucleus itself may harbor a much weaker and older starburst (Alonso-Herrero et al., 2001) and a Compton-thick AGN (Risaliti et al. 2000, but see Olsson et al. 2010; Väisänen et al. 2012). The observations and data reductions are described in Section 2; the results are presented in Section 3; Section 4 and Section 5 are devoted to a discussion and the summary, respectively. All velocities in this paper are in the radio LSR convention. Throughout this paper, we adopt the -cosmology with and , and .
2. Observations
We observed the central region of NGC 1614 in CO (6-5) line emission and 435 dust continuum emission using the Band 9 receivers of ALMA in the time division mode (TDM; velocity resolution: 6.8 km sec-1). The four basebands (i.e. “Spectral Windows”, hereafter SPWs) were centered at the sky frequencies of 680.539, 682.308, 676.826 and 678.764 GHz, respectively, each with a bandwidth of 2 GHz. Observations were carried out in the extended & compact (E&C) configuration using up to 27 antennae (Table 1). The total on-target integration time was 50.4 minutes. During the observations, phase and gain variations were monitored using QSO 0423-013. Observations of the minor planet Ceres were made for the flux calibration. The error in the flux calibration was estimated to be 17%.
The final data reduction was done using CASA 4.1.0. Images were cleaned using Briggs weighting. Both phase and amplitude self-calibrations have been carried out. The primary beam is . However, emission features larger than are poorly sampled because of limited uv-coverage for short baselines. Two data sets were generated from the observations. In the first data set, the CO (6-5) line data cube was generated using data in SPW-0 (sky-freq = 680.539 GHz), which encompass the CO (6-5) line emission at the system velocity () with an effective bandpass of . The continuum was estimated using data in the other 3 SPWs. In the second data set, the CO (6-5) line data cube was generated using three SPWs: SPW-0, SPW-1 and SPW-3, respectively. The bandwidth of this CO (6-5) line data cube is . For the second data set, the continuum was estimated using data in SPW-2 (sky-freq = 676.826 GHz). The first data set has better continuum estimation and subtraction, and was therefore used for most of the analysis; the second data set was used to search for evidence of molecular outflows or nuclear (8-7) line emission. The continuum subtraction was carried out using the CASA task UVcontsub. For the first data set, the channel maps of the CO (6-5) line emission have 1- rms noise of per , and for the continuum it is . The CO (6-5) line emission map, integrated over the LSR velocity range between and (), has 1- rms noise of . The synthesized beams of these maps are nearly identical, having FWHMs of , corresponding to physical scales of , and a P.A. of . The absolute pointing accuracy of these ALMA observations is on the order of .

3. Results
3.1. The CO (6-5) Line Emission
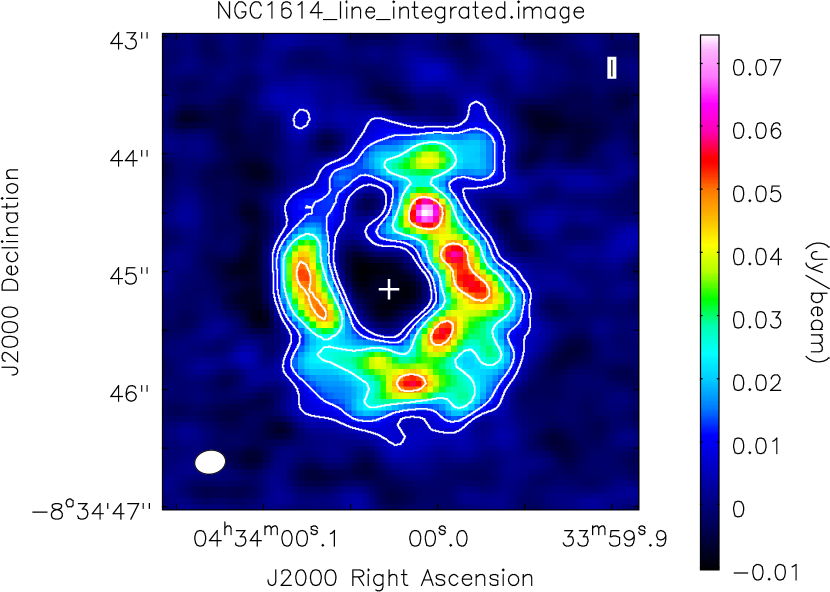
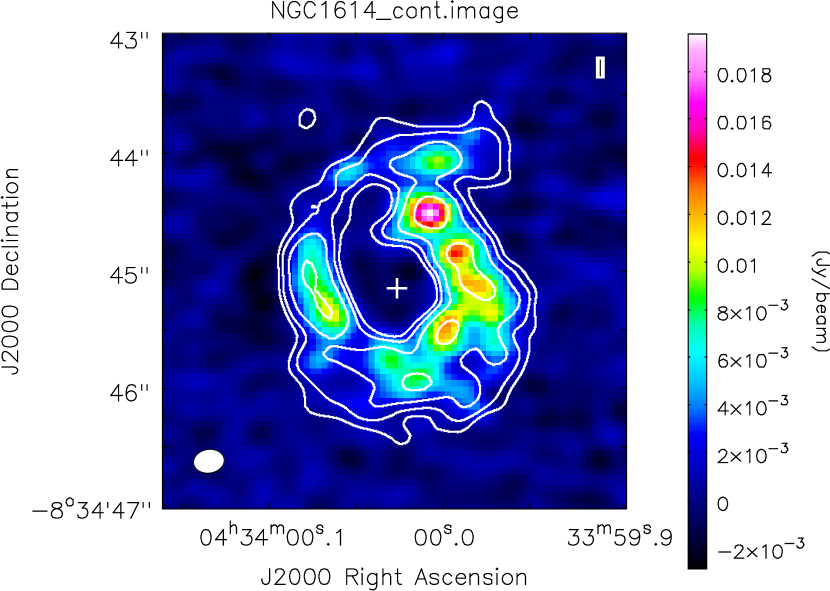
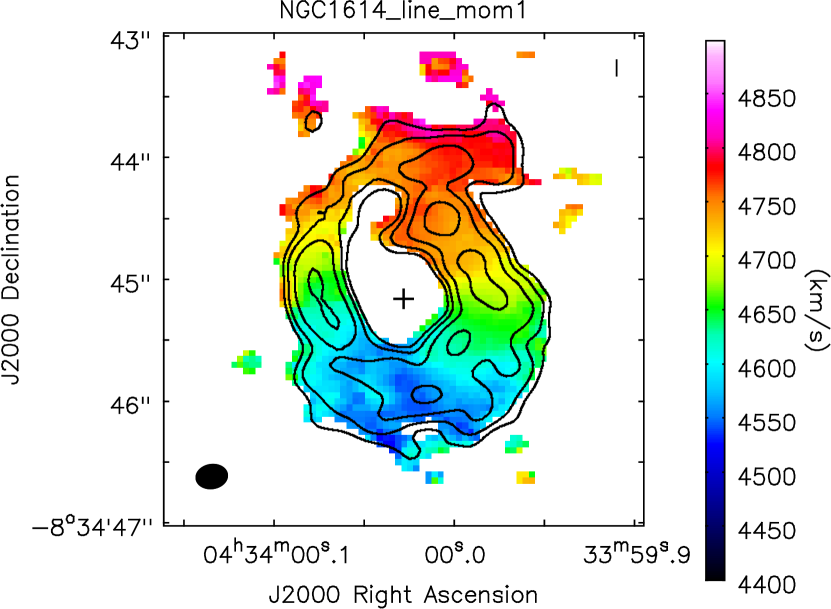
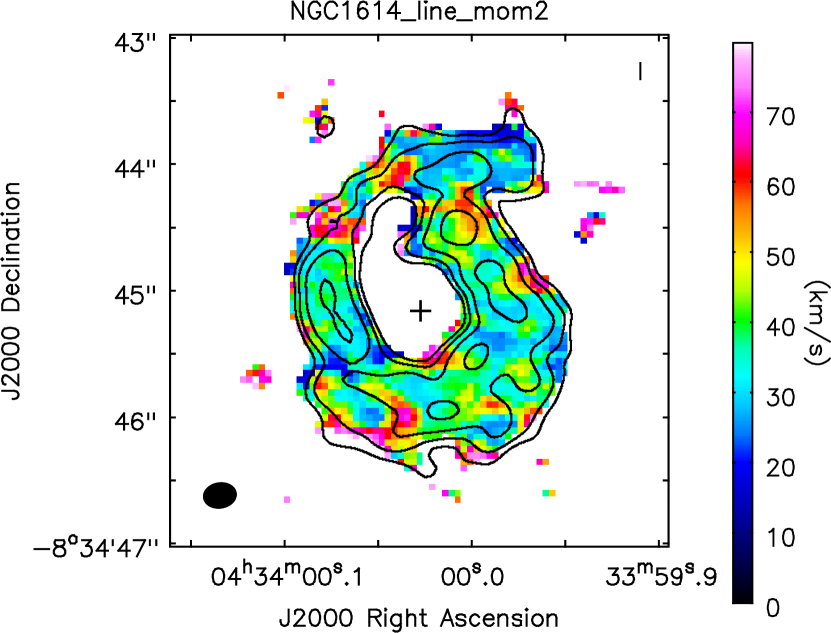
In Figure 1 we present images of the integrated CO (6-5) line emission, the continuum at 435 , the first moment map, and the second moment map. All images are overlaid by the same contours of the integrated CO (6-5) line emission at levels of [1, 2, 4, 8] . The line and the continuum emissions correlate closely with each other, both showing a ring configuration without a detectable nucleus. The ring has a diameter of (). In both the line and the continuum maps, the ring looks clumpy and can be decomposed into several knots. The first moment map shows a clear velocity gradient along the south-north direction, consistent with an inclined rotating ring. According to Olsson et al. (2010), the inner disk of NGC 1614 has an inclination angle of . In the second moment map, the velocity dispersion in most regions in the ring is rather constant at the level of , though in some inter-knot regions it can be as low as . From the first moment map, the velocity gradient due to the rotation can be estimated to be , corresponding to a line widening of within individual beams (linear size: ). This is consistent with the lowest velocity dispersion seen in the second moment map.
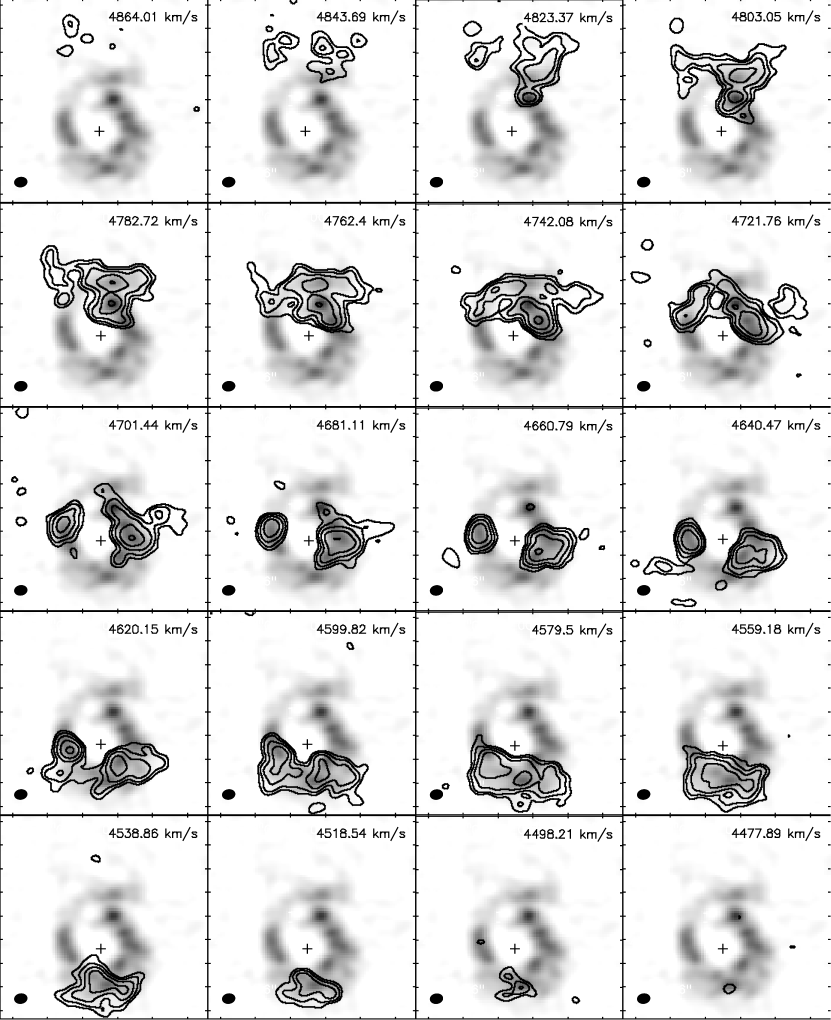
The channel maps () are shown in Figure 2, overlaid on the image of the integrated line emission. They provide more details about the rotating ring. First of all, given the relatively narrow local velocity dispersions (see the second moment map in Figure 1), the channel maps dissect the ring spatially. It appears that the spatial width of ring segments in individual channel maps are generally broader than that in the integrated emission map. This is because, by co-adding all channel maps, the integrated emission map is affected more severely by the (negative) sidelobes of different segments of the ring. This is a significant effect because some ring segments are separated by , the angular scale limit of our interferometer observations. Indeed the total flux of the CO (6-5) line emission, (the error being dominated by the calibration uncertainty) which is derived from the sum of the aperture photometry of individual channels (centered on the emission features for each given channel), is 31% higher than that measured on the integrated CO (6-5) line emission map. Comparison with the Herschel measurement of the integrated CO (6-5) line emission of NGC 1614 ( within a beam of ; van der Werf et al. 2010; Lu et al. 2014a) yields an interferometer-to-single-dish flux ratio of . This suggests that most warm dense gas in NGC 1614 is concentrated in the circum-nuclear ring.
Figure 3 shows plots of the velocity distributions of the central region () and of the peak position (, ) of the integrated CO (6-5) line emission map. In order to reduce the noise, we used relatively broad bins of . The velocity distribution has a FWHM of . Its shape is rather irregular and spiky, reflecting the clumpiness of the rotating ring and the narrow velocity dispersions of individual clumps (Figure 1). No evidence for any outflow/inflow of , nor any detection of the (8-7) line (rest-frame frequency = 690.552 GHz), can be found in the spectrum. In the velocity distribution of the peak position, which is in the north-western quadrant of the ring (Figure 1), we also found no evidence of outflow/inflow or of the (8-7) line emission.

3.2. The 435 Continuum Emission
The flux density of the 435 continuum measured by ALMA is . The continuum correlates spatially with the CO (6-5) emission in the central kpc of NGC 1614 (Figure 1). This suggests that dust heating and gas heating in the warm dense gas cores are strongly coupled, a conclusion also reached by Lu et al. (2014a) in a Herschel FTS study of the CO SLED of LIRGs. NGC 1614 was observed by Herschel-SPIRE (Griffin et al., 2010) both in the photometry mode (Chu et al., in preparation) and in the FTS mode (van der Werf et al., 2010; Lu et al., 2014a), with beams of . Because the error of the continuum measured in the FTS mode is large (), we estimated the total flux of the 435 continuum of NGC 1614 using SPIRE photometer fluxes and . Assuming a power-law spectrum for the dust continuum (i.e. depending on linearly), we carried out linear interpolation in the logarithmic domain of the flux and of the frequency between 350 and 500 , and found . The ratio between and then yields an interferometer-to-single-dish flux ratio of . This is a factor of lower than the interferometer-to-single-dish flux ratio of the line emission, indicating that the distribution of dust is substantially more extended than that of the warm dense gas.
The total dust mass in NGC 1614 can be estimated using the mid- and far-IR fluxes in the Spitzer/MIPS 24 band and in the Herschel 70, 100, 160, 250, 350 and 500 bands. The Herschel data are taken from Chu et al. (in preparation). A least-squares fit to the IR SED by a 2-graybody model, with the emissivity spectral index for both components, yields a total dust mass of with a cold dust temperature of (Figure 4). Fits by 2-graybody models with as a free parameter or by the model of Draine & Li (2007) yield very similar results. If dust in the central region has the same , then . Taking into account the uncertainties due to the assumption on the cold dust temperature (), the dust mass in the central region observed by ALMA is . NGC 1614 has a metallicity of (Armus et al., 1989; Vacca & Conti, 1992; Engelbracht et al., 2008; Modjaz et al., 2011). According to Rémy-Ruyer et al. (2014), for galaxies with , the gas-to-dust ratio is 100 with a 1- uncertainty of dex. Therefore, assuming , the gas mass in the central region of NGC 1614 is . This is consistent with the molecular gas mass (which should dominate the total gas mass) found in the same region (, with a conversion factor of ; König et al. 2013). It should be pointed out that both the ALMA continuum observations and the SMA observations of CO (2-1) by König et al. (2013) detected mostly dust and gas emission in dense gas structures and missed significantly the diffuse emission, therefore the dust and gas mass derived from these observations are lower limits.
There has been a debate on whether there is an AGN in NGC 1614. Risaliti et al. (2000) argued, based on the detection of a hard X-ray source and its spectrum, that in the center of NGC 1614 there is a hidden AGN obscured by Compton-thick gas (; Comastri 2004). However such high column density gas in the nucleus, which shall not be affected by the missing flux issue, is not detected in either the CO (6-5) map or the dust continuum map. Using the scaling factor between the gas mass and the continuum flux derived above, the non-detection of the continuum in the nucleus () sets a 3- upper-limit for the gas surface density of . Since an AGN cannot hide itself in the emission of dust that absorbs its UV/optical/NIR radiation, our results can rule out this possibility with relatively high confidence. Indeed a Compton-thick torus with a radius of (García-Burillo et al., 2014), which fills 23% of the ALMA beam, should be detectable in the continuum with a signal-to-noise ratio of . The could be even higher since the in a torus is likely much warmer than the assumed dust temperature of . The high resolution MIR L-band observations of Väisänen et al. (2012) also argue against a Compton-thick AGN in NGC 1614. As pointed out by Olsson et al. (2010) and Herrero-Illana et al. (2014), the X-ray source detected by Risaliti et al. (2000) could be explained by low-mass X-ray binaries.
4. Discussion
4.1. Comparison with Previous CO Observations
There is a rich literature on molecular line observations in the submm and mm bands for NGC 1614 (Young et al., 1986; Solomon & Sage, 1988; Scoville et al., 1989; Sanders et al., 1991; Casoli et al., 1991; Gao & Solomon, 2004a; Albrecht et al., 2007; Wilson et al., 2008; Olsson et al., 2010; Costagliola et al., 2011; König et al., 2013; Imanishi & Nakanishi, 2013). The single dish CO (1-0) observations of Sanders et al. (1991) found a total molecular gas mass of , aasuming a standard conversion factor of and distance of . This is consistent with the result of Casoli et al. (1991), but significantly larger than those obtained in earlier and less sensitive observations (Young et al., 1986; Solomon & Sage, 1988). The OVRO observations of Scoville et al. (1989), with a beam of , allocated of the total CO (1-0) emission within a nuclear region of . The more recent and higher resolution () observations of Olsson et al. (2010) resolved the central CO (1-0) line emission into an arc-like feature in length and in width, but did not resolve the ring. The SMA map of CO (3-2) (beam ; Wilson et al. 2008) and the ALMA maps of HCN/HCO+/HNC (4-3) (beam ; Imanishi & Nakanishi 2013) also did not resolve the ring.
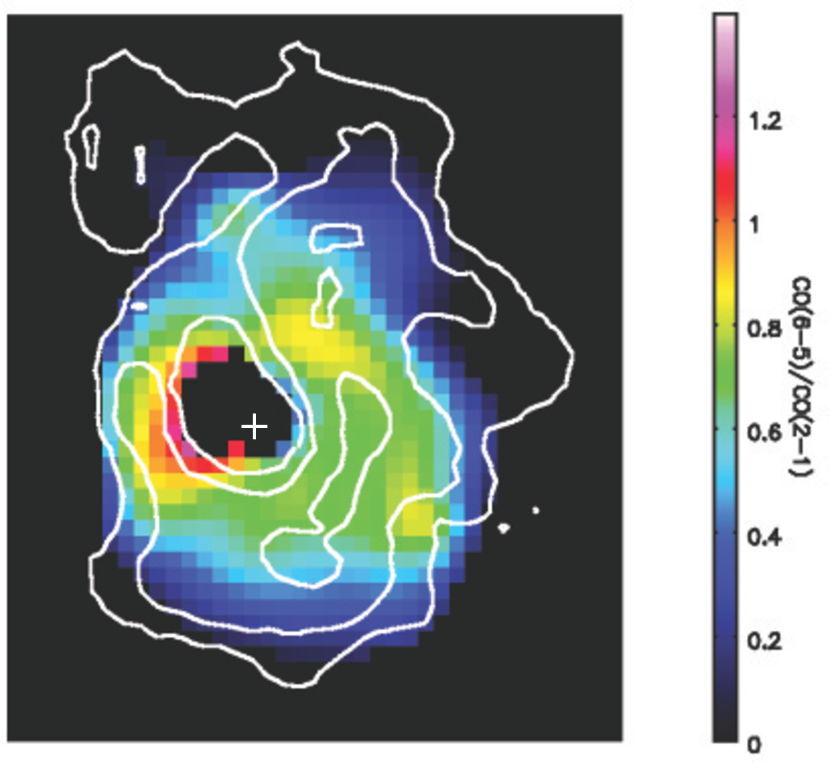
Before our ALMA observations, the best angular resolution for any CO rotation lines was obtained by König et al. (2013) in their SMA observations of the CO (2-1) line, with a beam of . In Figure 5 we compare their CO (2-1) map with our CO (6-5) map. In the ring the two maps have good correspondence, though the CO (6-5) emission looks clumpier, most likely due to the better angular resolution. König et al. (2013) noticed a strong asymmetry in the CO (2-1) distribution between the eastern and western sides of the ring, and interpret it as a consequence of the feeding of the ring by the dust lane on the north-west of the ring. In the CO (6-5) map, we still see this asymmetry albeit being less prominent than in CO (2-1). When smoothed to a common beam, the ratio between the two emissions is rather constant in most regions of the ring, with a median brightness temperature ratio of 0.72 (Figure 5). The east quadrant of the ring has the highest brightness temperature ratio (). This could be due, at least partially, to a slight mismatch between the two maps, given the steep gradient in both maps in this region. On the other hand, this seems to be consistent with the stronger east-west asymmetry seen in the CO (2-1) map than in the CO (6-5) map. König et al. (2013) argued that the reason of the asymmetry could be the feeding of the ring by a dust lane on the northwest of the ring. In this scenario, the east quadrant has higher CO (6-5)/CO (2-1) ratio than the west quadrant because it has less diffuse gas (freshly fed by the dust lane) compared to the west quadrant. The nucleus is not detected in either map. The CO (6-5) 3- upper-limit of 742 () for the surface density of the warm dense gas, derived by assuming the same relation between and CO (6-5) surface brightness in the ring region (Eq 3), is consistent with the upper-limit set by the 435 continuum. If the conversion factor advocated by Downes & Solomon (1998) for (U)LIRGs is used, which is a factor of lower than the standard value adopted in Eq 3, the result is a significantly lower value for the upper limit of in the nucleus. In the region north of the ring, where significant CO (2-1) emission is found, little CO (6-5) emission is detected and the brightness temperature ratio is .
| (1) | (2) | (3) | (4) | (5) | (6) | (7) | (8) |
|---|---|---|---|---|---|---|---|
| ID | R.A. | Dec. | Notes | ||||
| (J2000) | (J2000) | () | ( | ( | () | ||
| 1 | 04:34:00.006 | -08:34:44.49 | 34.0 | 19.6 | 3.94 | 2.49 | 4 |
| 2 | 04:33:59.991 | -08:34:44.86 | 27.2 | 13.8 | 3.87 | 2.40 | 6 |
| 3 | 04:33:59.981 | -08:34:45.10 | 25.5 | 12.1 | 3.91 | 2.33 | 6 |
| 4 | 04:33:59.998 | -08:34:45.52 | 25.5 | 11.7 | 3.88 | 2.41 | 7 |
| 5 | 04:34:00.015 | -08:34:45.95 | 25.7 | 7.7 | 3.87 | 2.14 | 8 |
| 6 | 04:34:00.069 | -08:34:45.29 | 22.8 | 10.3 | 3.81 | 2.36 | 10 |
| 7 | 04:34:00.077 | -08:34:45.04 | 23.6 | 8.2 | 3.84 | 2.00 | 10 |
Note. — Column (4) – CO (6-5) peak flux; (5) – continuum peak flux; (6) – peak molecular gas surface density, after smoothed to the beam of 8.4 GHz observations (041026); (7) – peak SFR density, derived using flux of the nonthermal radio at 8.4 GHz; (8) – corresponding GMA in König et al. (2013).
4.2. Relation Between Warm Dense Gas and Star Formation
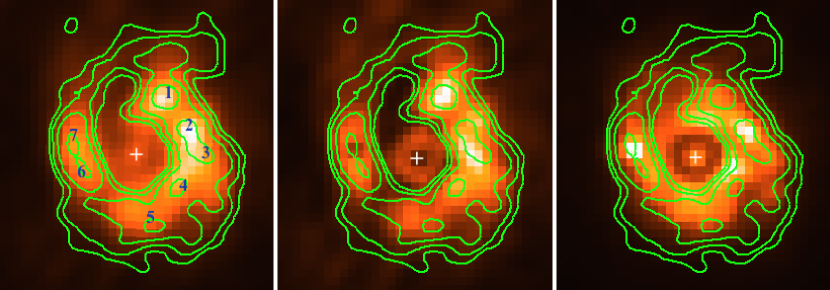
Most star formation in NGC 1614 is occurring in the circum-nuclear starburst ring. Soifer et al. (2001) found that 72% of the 12 flux of NGC 1614 measured by IRAS is contained within the 2″ beam of their Keck observations. The comparison between the high resolution 8.4 GHz map of the central kpc region (Herrero-Illana et al., 2014) and that of a lower resolution map at the same frequency by Schmitt et al. (2006) indicates that of the total SFR is contributed by the starburst ring and the nucleus. The star formation in the ring has been studied by Alonso-Herrero et al. (2001) using a HST Pa map, Díaz-Santos et al. (2008) using a Gemini 8 map, Väisänen et al. (2012) using a 3.3 polycyclic aromatic hydrocarbon (PAH) map obtained with UIST (an imager-spectrometer for integral field spectroscopy) at UKIRT, Olsson et al. (2010) and Herrero-Illana et al. (2014) using VLA and Merlin radio continuum maps. While the NIR and MIR observations may still be affected by the dust obscuration associated with the dense gas (Imanishi & Nakanishi, 2013), the radio continuum is an SFR indicator insensitive to dust obscuration.
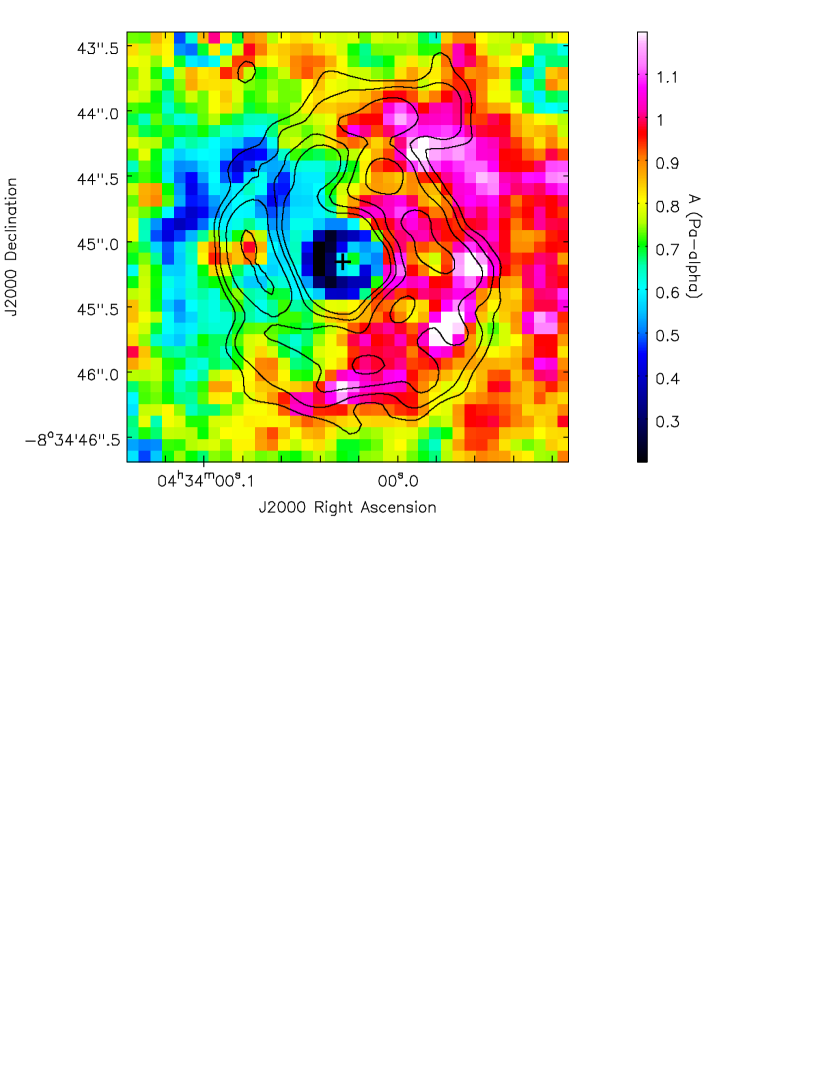
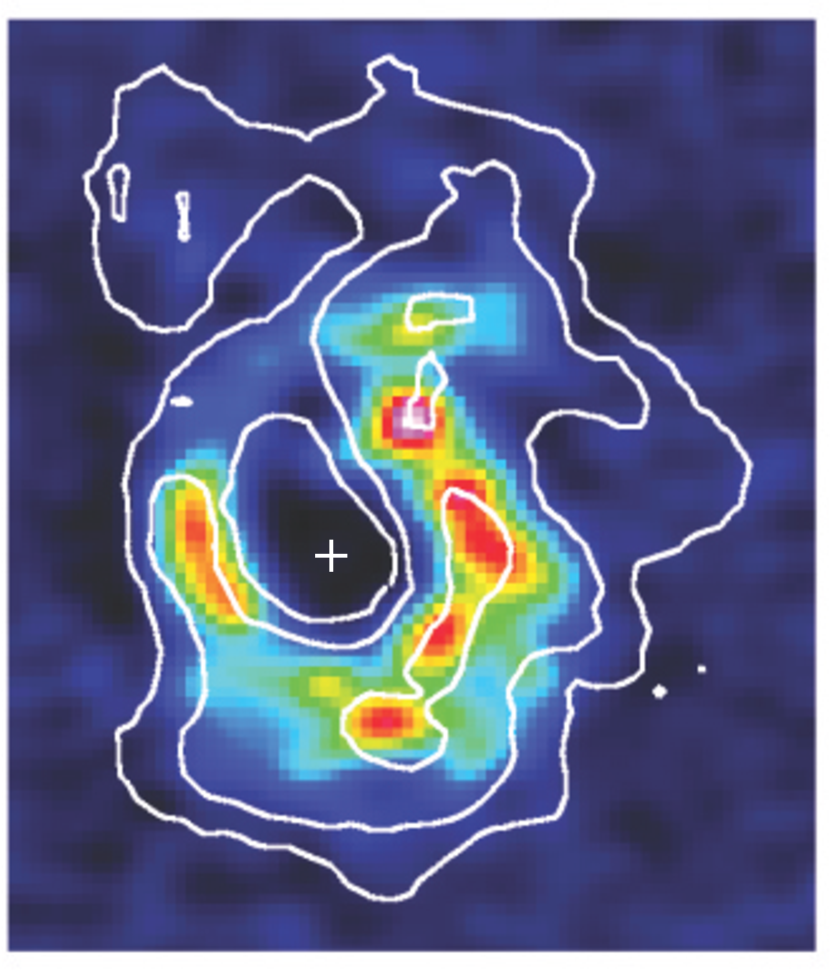
In the left panel of Figure 6, we compare the CO (6-5) contours with the radio continuum at 8.4 GHz (beam = , Herrero-Illana et al. 2014). The CO (6-5) knots in the ring (Table 2) are marked in the image. While there is a radio nucleus, the CO map has a hole at the ring’s center. Herrero-Illana et al. (2014) argued that the radio nucleus is not an AGN, which is consistent with our conclusion that there is no (Compton-thick) AGN in NGC 1614 (Section 3.2). In the other two panels of Figure 6, the CO (6-5) emission is compared to the thermal and nonthermal radio emission components, respectively. Following Herrero-Illana et al. (2014), the thermal radio emission is estimated using a high-resolution, extinction-corrected Pa- map obtained from a set of HST NIR narrow- and broad-band images. The method involves the comparison of a Pa- equivalent width map as well as an NIR color (F160W/F222M) image to stellar population synthesis models (Starburst99; Leitherer et al. 1999) to derive a spatially-resolved dust obscuration map with which to correct the original Pa- image (see also Díaz-Santos et al. 2008). The details of this procedure can be found in the Appendix. As a final step, the nonthermal component is derived by subtracting from the total radio emission the thermal component. The thermal fraction of the radio continuum at 8.4 GHz is found to be 51% in the ring region ( pc).
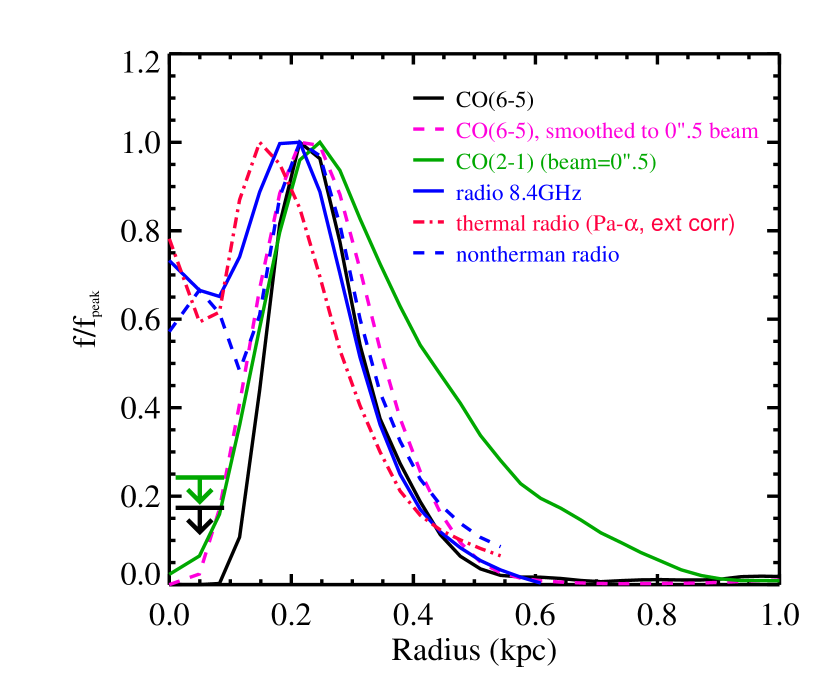
In Figure 7 the radial profiles of the emissions are compared. The peak of the radial distribution of the thermal radio is shifted (by pc) toward the smaller radius compared to that of the CO (6-5) radial distribution. The peak of the distribution of the total radio emission also has a small offset compared to that of the CO (6-5), while the radial profile of nonthermal radio emission is similar to that of the CO (6-5) in the ring region. The radio profile of CO (2-1) (König et al., 2013) is also shown in the same plot. If we compare the CO (2-1) profile with the profile of CO (6-5), which has been smoothed to the same resolution of CO (2-1), we see that the former is significantly more extended than the latter. Beyond , the cold and diffuse molecular gas probed by CO (2-1) emission is devoid of any significant star formation (as revealed by the profiles of the radio emissions).
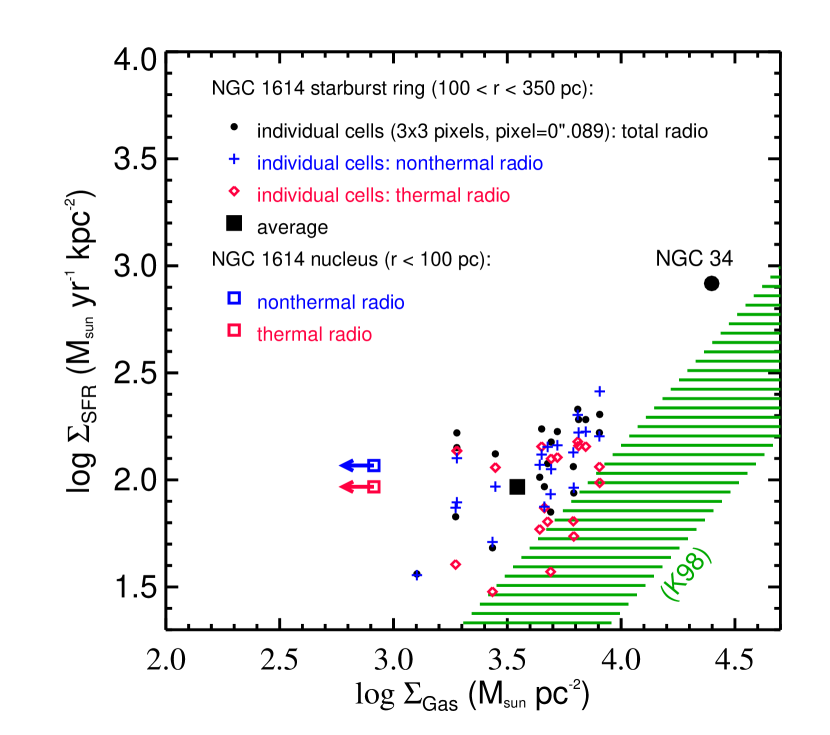
In Figure 8 we plot the SFR surface density () vs. the gas surface density () (i.e. the Kennicutt-Schmidt law) for the nuclear starburst and individual cells ( pixels, pixel=0089) in the ring, using the thermal and nonthermal maps to derive and the CO (6-5) map (smoothed and regridded to match the radio maps) to obtain . The SFR can be estimated from the nonthermal and thermal radio luminosities using two formulae given in Murphy et al. (2012), respectively:
| (1) |
and
| (2) | |||||
where , , and (Herrero-Illana et al., 2014). For individual cells in the ring, we also plotted in Figure 8 the vs. relation with the estimated from the total radio emission, assuming a constant nonthermal fraction () and the SFR vs. relation in Eq 1.
The gas surface density was estimated using the CO (6-5) surface brightness as following: According to König et al. (2013), the total mass in the ring is (for D=67.8 Mpc), estimated using the CO (1-0) map of Olsson et al. (2010) and assuming a conversion factor of . Dividing this by the integrated CO (2-1) flux of the ring, (König et al., 2013) and assuming a brightness temperature ratio of 0.72 between CO (6-5) and CO (2-1) (Figure 5), we have:
| (3) |
In the ring region, only cells that are detected in both radio and CO (6-5) maps above a 3- threshold are plotted (therefore the random errors are dex for these data points). In the nuclear region ( pc), the 3- upper-limit for was derived using the CO (6-5) map assuming the same relation for the ring region (Eq 3). For individual cells in the ring, the vs. relation is systematically above that for local starbursts (Kennicutt, 1998), indicating a higher star formation efficiency (SFE). This is because, by relating the SFR to the warm dense gas probed by the high resolution ALMA observations of CO (6-5), much of the cold diffuse gas probed by low J CO (more extended than the warm dense gas) is excluded from the in our results. It is worth noting that we used a standard CO conversion factor () for NGC 1614 data. In the literature, arguments for high SFE in (U)LIRGs are very often based on results obtained using a CO conversion factor times lower than the standard value (e.g., Daddi et al., 2010; Genzel et al., 2010).
It appears that, on the linear scale of 100 pc, the tight correlation previously found between vs. (Kennicutt, 1998; Genzel et al., 2010; Leroy et al., 2013; Yao et al., 2003; Iono et al., 2004; Wilson et al., 2008) breaks down in the central kpc of NGC 1614. In particular, the non-detections of the nucleus in both CO (6-5) and CO (2-1) maps set a lower-limit of the -to- ratio about an order of magnitude above the nominal value, corresponding to a very short gas exhaustion time scale of Myr. The low extinction (Alonso-Herrero et al., 2001; Kotilainen et al., 2001; Díaz-Santos et al., 2008) and low PAH emission (Väisänen et al., 2012) also indicate an ISM depression in the nuclear region. The star formation time scale associated with the thermal radio is Myr and that with the nonthermal radio is Myr. Alonso-Herrero et al. (2001) argued that, based on detections of deep CO stellar absorption, NGC 1614 harbors a nuclear starburst older than 10 Myr, which could have blown away the ambient ISM (Väisänen et al., 2012). If the time scale for the feedback effects, including both the gas consumption by star formation and mass loss by superwinds, is significantly shorter than 10 Myr (the dynamic time scale of the nuclear region is only Myr), then the deviation of the nucleus from the vs. relation may indeed be due to the feedback of the old nuclear starburst. This is consistent with the results of García-Burillo et al. (2012) who found that NGC 1614 has the highest value of the SFE (estimated from the FIR/HCN ratio) among a sample of normal star-forming galaxies and mergers, and argued that this could be due to the exhaustion of the dense molecular gas by starburst activity.
In the starburst ring, the correlation between and is rather weak (Spearman’s rank correlation coefficient with the significance of its deviation from zero ). Also, the correlation between (estimated using total radio emission) and has a large scatter, and is only marginally significant ( and ). This is consistant with the systematic offset between the radial profiles of the total radio and CO (6-5) in Figure 7. While the weak correlation between and could be mainly due to the uncertainties associated with the obscuration correction of the (the thermal radio is estimated using the obscuration-corrected ), this cannot explain the lack of correlation between and . We have already seen a breakdown of the -to- correlation in the nucleus, and interpreted it as a consequence of starburst feedback. The same scenario can be applied to the individual cells in the ring. Given the high resolutions of the radio and CO (6-5) maps, these cells correspond to star formation regions of linear scales of . On such fine scales, the -to- relation could be sensitive to the local star-formation history. Indeed, Alonso-Herrero et al. (2001) suggested that in NGC 1614 the starburst propagates like a “wild fire” from the nucleus outward. Väisänen et al. (2012) proposed that even the ring is stratified in terms of the star formation age. In a CO (1-0) survey of M33, Onodera et al. (2010) found a breakdown of the Kennicutt-Schmidt law on the linear scale of , and attributed it to the various evolutionary stages of giant molecular clouds (GMCs) and to the drift of young clusters from their parent GMCs. These interpretations are applicable to our results, although our ALMA observations probe an even tighter correlation between CO (6-5) and SFR in a LIRG associated with a starburst merger.
A stronger correlation is found between and in the starburst ring ( and ). This is puzzling because, given the longer star formation time scale associated with the nonthermal radio, this relation should be more sensitive to the star formation history than the and relation. It is likely that the and correlation is driven by other factors than the Kennicutt-Schmidt law. One possibility is that it is due to the correlation between the magnetic field strength and the gas density (Fiebig & Guesten, 1989; Helou & Bicay, 1993; Niklas & Beck, 1997). Observationally, this correlation extends from the smallest (Fiebig & Guesten, 1989) to the largest cosmic scales (Vallée, 1990, 1995), and has the form of for , where B is the magnetic field strength, n the gas density, and (Fiebig & Guesten, 1989). Since the emissivity of the nonthermal (synchrotron) radiation is proportional to , the B vs. n correlation leads naturally to a localized ( linear) correlation between nonthermal surface brightness and gas surface density. Another possibility is that the nonthermal radio and the CO (6-5) correlate with each other because they are both powered by cosmic rays (CRs). Indeed, CSO observations of 12CO(6-5) and 13CO(6-5) by Hailey-Dunsheath et al. (2008) of the nuclear starburst in the central 180 pc of NGC 253 suggested that warm molecular gas is most likely to be heated by an elevated density of CRs or by turbulence. In order to test whether CRs dominate the heating of warm molecular gas in NGC 1614, we carried out model-fitting using theoretical models (Meijerink & Spaans, 2005; Kazandjian et al., 2012, 2014) of the Cosmic Ray Dominated Regions (CDRs) and Photon Dominated Regions (PDRs) to fit the emission lines of 12CO, 13CO, HCN, HNC, and HCO+. These are mostly single dish data for the entire system of NGC 1614 (Sanders et al., 1991; Albrecht et al., 2007; Costagliola et al., 2011; Lu et al., 2014b), plus some high resolution interferometry data for the central region taken from the literature (Wilson et al., 2008; Olsson et al., 2010; König et al., 2013; Imanishi & Nakanishi, 2013) and from this work. The results show that PDR models with strong mechanical heating (by turbulence) provide the best fit while CDR models fit the data rather poorly. Details of these results will be presented elsewhere (Meijerink et al., in preparation). This is consistent with Rosenberg et al. (2014a) who modeled the Herschel observations of 12CO up to upper J=13 and 13CO up to upper J=6, together with data of other submm lines taken from the literature, of NGC 253. They found that mechanical heating by turbulence is necessary to reproduce the observed molecular emission and CR heating is a negligible heating source. Rosenberg et al. (2014b) reached a similar conclusion for Arp 299A, a nuclear starburst in Arp 299 (a merger-induced LIRG). In principle, the turbulence can be related to the CRs through shocks generated by supernova remnants (SNRs) which can both power the turbulence (Draine, 1980) and accelerate CRs (Drury et al., 1994). However, given the very different mechanisms for energizing low velocity turbulence and for CR acceleration by SNR shocks, it is unlikely that this can explain the localized correlation between and in the starburst ring down to the linear scale of 100 pc.
4.3. NGC 1614 and NGC 34: A Tale of Two LIRGs
| NGC 1614 | NGC 34 | ||
|---|---|---|---|
| R.A. (J2000)a | |||
| Dec. (J2000)a | |||
| Distance (Mpc) | 67.8 | 84.1 | |
| ()b | |||
| (mag)c | |||
| ()d | |||
| )e | 51.3 | 34.7 | |
| ()f | |||
| ()g | |||
| AGN | No | Yes | |
| Merger mass ratio | 4:1 – 5:1 | 3:2 – 3:1 | |
| (mJy)h | 41.1 | ||
| ()i | |||
| (mJy)j | |||
| Central Starburst: | |||
| Morphology | circum-nuclear ring | nuclear disk | |
| radius (pc) | |||
| (mJy)k | 26.5 | 15.2 | |
| )l | 32.8 | 26.0 | |
| ()m | 92.8 | 827.6 | |
| ()n | |||
| ()o | |||
| ()p | |||
| (mJy)q | |||
| ()r |
Note. —
a Coordinates of the nucleus in the 8.4 GHz radio continuum.
b IR luminosity between 8 – 1000
(Armus et al., 2009).
c Absolute K band magnitude (Rothberg & Joseph, 2004).
d Total mass of neutral atomic hydrogen gas, taken from
compilation by (Kandalyan, 2003).
e Total star formation rate (U et al., 2012).
f Total mass of molecular hydrogen gas (assuming
);
NGC 1614: Sanders et al. (1991); NGC 34: Kruegel et al. (1990).
g Total dust mass; NGC 1614: this work; NGC 34: Esquej et al. (2012).
h Total flux of the 8.4 GHz radio continuum (Schmitt et al., 2006).
i Total flux of the CO (6-5) emission (Lu et al., 2014b).
j Total flux of the 435 continuum emission;
NGC 1614: this work; NGC 34: Xu et al. (2014).
k Flux of the 8.4 GHz radio continuum in the central region;
NGC 1614: Herrero-Illana et al. (2014); NGC 34: Condon et al. (1991).
l The SFR of central starburst:
,
where
for NGC 1614, and
for NGC 34.
m Mean SFR column density of the central starburst.
n Mass of molecular hydrogen gas in the central region;
NGC 1614 ():
(König et al., 2013);
NGC 34 ():
Fernandez et al. (2014).
o Mean gas column density of the central starburst
().
p Flux of the CO (6-5) emission in the central starburst region;
NGC 1614: this work; NGC 34: Xu et al. (2014).
q Flux of the 435 continuum emission in the central starburst region;
NGC 1614: this work; NGC 34: Xu et al. (2014).
r Dust mass in the central starburst region;
NGC 1614: this work; NGC 34: Xu et al. (2014).
In this section we compare NGC 1614 with NGC 34, another local LIRG observed by our team using ALMA band-9 receivers (Xu et al., 2014). Both galaxies are late-stage mergers (Neff et al., 1990; Schweizer & Seitzer, 2007). As shown in Table 3, they have similar absolute K-band magnitude (indicating similar stellar mass), similar total gas mass as obtained by HI and CO observations, and similar total SFR as derived from the IR+UV luminosities (U et al., 2012). On the other hand, as revealed by the ALMA observations and high angular resolution observations in other bands, the two galaxies are very different in the central kpc.
First of all, our ALMA data ruled out a Compton-thick AGN in NGC 1614. By comparison, there is a weak AGN in NGC 34 according to the X-ray data (Brightman & Nandra, 2011; Esquej et al., 2012), and the ALMA results (Xu et al., 2014) are consistent with the AGN being Compton thick. Nevertheless, for both galaxies, the central kpc is dominated by starburst activity and AGN contributions to both dust and gas heatings are insignificant (Xu et al., 2014; Stierwalt et al., 2013). In NGC 34, the starburst is concentrated in a compact nuclear disk of , with very high and . In NGC 1614, a starburst ring between and dominates the central region, with moderate mean and mean compared to other local starbursts (Figure 8). It is worth pointing out that different CO conversion factors have been adopted for the two cases: For the nuclear starburst in NGC 34, the ALMA observations showed that the molecular gas is concentrated in a well organized disk controlled mostly by the gravity of stars (Xu et al., 2014). Therefore, we choose to use the conversion factor for (U)LIRGs: (Scoville et al., 1997; Downes & Solomon, 1998). On the other hand, for the starburst ring in NGC 1614, the ALMA observations presented here and the SMA observations of König et al. (2013) reveal that much of the CO emission is clumped in individual knots associated with giant molecular associations (GMAs), which might be self-gravitating. In this case, a standard Galactic CO conversion factor is more appropriate (Papadopoulos et al., 2012): . Nevertheless, these conversion factors are very uncertain and are the major error sources for the molecular gas mass estimates.

In Figure 9 we compare the spectral line energy distributions (SLEDs) of the total CO emission (measured by single-dish observations) of these two galaxies, taken from observations of Herschel SPIRE FTS observations (Lu et al., 2014b). The CO SLED of NGC 1614 peaks around upper J = 5-7, while that of NGC 34 reaches a plateau after a rapid increase, and the peak is around upper J=9. In order to further investigate the physical conditions of these two galaxies, we modeled the observed CO SLEDs using simple two-component RADEX large velocity gradient (LVG) radiative transfer models (van der Tak et al., 2007), and adopting a similar procedure to that in Kamenetzky et al. (2012). Admittedly, results from such model fittings suffer significant degeneracy between parameters (Rosenberg et al., 2014a). Nevertheless, they are useful for translating the information in the CO SLED into quantitative estimates of physical parameters of the gas, albeit with large uncertainties. We find that both SLEDs can be well fitted by the combination of a cool and a warm component. Both galaxies have similar gas densities of (, ) cm-3 and (, ) cm-3, for the cool and warm components in (NGC 34, NGC 1614), respectively. However, the kinetic temperature of the warm component in NGC 34 (890 K) is 2 times higher than that of NGC 1614 (445 K), consistent with the fact that the nuclear starburst in NGC 34 is 5 times more compact than the circum-nuclear starburst ring in NGC 1614. It is worthwhile noting that the AGN contribution to the warm gas in NGC 34 is insignificant (Xu et al., 2014). Given the overall similarities between the two host galaxies (Table 3), it is likely that the staunch difference between the two central starbursts is caused by the difference in the merging processes that the two LIRGs have experienced.
The morphology of NGC 1614—one prominent tail and one relatively small secondary tail—suggests an unequal mass encounter (mass ratio ) and/or a scenario in which one of the galaxies experienced a retrograde passage. Several authors have argued for a high mass ratio encounter; Rothberg & Joseph (2006) note the isophotal shape of NGC 1614 and its correspondence with simulations of high mass ratio mergers, while Väisänen et al. (2012) identify a possible remnant body of the lower-mass companion. Both Rothberg & Joseph (2006) and Väisänen et al. (2012) come to the same conclusion—that NGC 1614 is a 4:1 mass ratio merger—but the former assumes the nuclei have already merged and the latter relies on the identification of an interacting galaxy.
NGC 34 has no clear evidence for dual nuclei, suggesting the two galaxies have already coalesced. Owing to the asymmetry of integrated brightness of the two tidal tails Schweizer & Seitzer (2007) argue this system is the result of a merger of two disk galaxies with a mass ratio between 3:2 and 3:1. The disky isophotal shape of the remnant (which shows no evidence for a disk in the K-band morphology) is consistent with a formation scenario of a major but unequal mass merger (Rothberg & Joseph, 2006; Naab et al., 2006). Preliminary dynamical modeling of this system is consistent with the aforementioned mass ratio and both disks experiencing prograde interactions (G. C. Privon et al. in prep). This dynamical model is consistent with the system being observed Myr since the first passage of the two galaxies, somewhat lower than the suggested Myr age of the stellar disk (Schweizer & Seitzer, 2007).
Hence, NGC 34 has experienced a major merger of two galaxies of similar mass, which was catastrophic and destroyed both progenitor disks (Schweizer & Seitzer, 2007). Simulations by Cox et al. (2008) exploring the effect of mass ratio on merger-induced starbursts found a decreasing burst strength with increasing primary/secondary mass ratio; given the previously mentioned estimates of the mass ratios for NGC 34 and NGC 1614, the star formation surface densities are consistent with this interpretation. It might be that the higher mass ratio merger experienced by NGC 1614 caused less efficient torquing of the gas, leading to much of the central gas settling into the nuclear ring (with the help of either the inner Lindblad resonance associated with a bar (Olsson et al., 2010) or the non-axisymmetric potential caused by a minor merger (Combes, 1988; Knapen et al., 2004; Mazzuca et al., 2006)) rather than collecting in the center, as in NGC 34. This may also hint at the answer to the question why NGC 1614 has not yet developed an AGN (Väisänen et al., 2012) while NGC 34 has one. According to Hopkins (2012), the built-up of a centrally peaked dense gas disk is a necessary condition for triggering of the AGN activity in late stage mergers.
An alternate explanation for NGC 1614’s comparatively lower , if the scenario proposed by Väisänen et al. (2012) is accurate, is that the merger has simply not yet run to completion and so has not yet caused the final funneling of gas towards the nucleus at the time of the merger (e.g., Mihos & Hernquist, 1994; Hopkins, 2012). Olsson et al. (2010) and König et al. (2013) both show that indeed most of the molecular gas in NGC 1614 sits in the dust lane (outside the ring) and even further out. It could be that the relatively minor perturbation of the first pass (which led to the northeast tail) created the outward propagating starburst (i.e. the “wild fire”), as revealed by the nuclear ring and the weak and old nuclear starburst, while a future merger will trigger a much stronger nuclear starburst as seen in NGC 34.
With current knowledge of the encounters in NGC 34 and NGC 1614, we cannot firmly assign the cause for the different starburst characteristics in the two systems. It is likely to be due to the effect of different mass ratios, but we cannot rule out other possible causes such as different current phases of the encounters and different encounter geometries. While NGC 34 represents a large population of LIRGs with starburst nuclei (e.g. Arp 220), NGC 1614 represents those with circum-nuclear starburst rings, which are also common in LIRGs. Among the GOALS sample, at least five other LIRGs (NGC 1068, NGC 5135, NGC 7469, NGC 7552, and NGC 7771) have such rings. Future dynamical models (G. C. Privon et al. in prep) matched to the kinematics and morphology of NGC 34 and NGC 1614 may provide a more concrete answer to the question of how the two galaxies, and the two LIRG populations they represent, developed such different central starbursts over the merging process.
5. Summary
We carried out ALMA observations of the CO (6-5) line emission and of the 435 dust continuum emission in the central kpc of NGC 1614, a local LIRG at distance of 67.8 Mpc (). The CO emission and the continuum are both well resolved by the ALMA beam () into a circum-nuclear ring. The integrated flux of CO (6-5) is , and the flux of the continuum is . These are and of the total CO (6-5) flux and 435 continuum flux of NGC 1614 measured by Herschel, respectively. The molecular ring, located between , looks clumpy and includes several unresolved (or marginally resolved) knots with median velocity dispersion of . These knots are associated with star formation regions with and . The non-detections of the nucleus in both the CO (6-5) and the 435 continuum rule out, with relatively high confidence, a Compton-thick AGN in NGC 1614. Comparisons with the radio continuum show that the local correlation, on the linear scale of pc, between and (i.e. the Kennicutt-Schmidt law) is severely disturbed. In particular, the nucleus has a lower-limit of the -to- ratio about an order of magnitude above the nominal value in the standard Kennicutt-Schmidt law. This break-down of the star formation law could be caused by an outward propagation of the central starburst (i.e. the “wild fire” scenaio proposed by Alonso-Herrero et al. 2001). Our results also show that the CO (6-5) correlates stronger with the nonthermal radio component than both the total radio emission and the thermal radio component, possibly due to an in situ correlation between the magnetic field strength and the gas density.
Acknowledgments: Adam Leroy and Tony Remijan from NAASC are thanked for their help with data reduction. An anonymous referee is thanked for constructive comments. Y.G. is partially supported by NSFC-11173059, NSFC-11390373, and CAS-XDB09000000. Y.Z. thanks the NSF of Jiangsu Province for partial support under grant BK2011888. V.C. would like to acknowledge partial support from the EU FP7 Grant PIRSES-GA-2012-316788. This paper makes use of the following ALMA data: ADS/JAO.ALMA-2011.0.00182.S. ALMA is a partnership of ESO (representing its member states), NSF (USA) and NINS (Japan), together with NRC (Canada) and NSC and ASIAA (Taiwan), in cooperation with the Republic of Chile. The Joint ALMA Observatory is operated by ESO, AUI/NRAO and NAOJ. This research has made extensive use of the NASA/IPAC Extragalactic Database (NED) which is operated by the Jet Propulsion Laboratory, California Institute of Technology, under contract with the National Aeronautics and Space Administration.
References
- Aalto et al. (2012) Aalto, S., Garcia-Burillo, S., Muller, S., et al. 2012, A&A, 537, A44
- Albrecht et al. (2007) Albrecht, M., Krügel, E., & Chini, R. 2007, A&A, 462, 575
- Alonso-Herrero et al. (2001) Alonso-Herrero, A., Engelbracht, C. W., Rieke, M. J., et al. 2001, ApJ, 546, 952
- Armus et al. (1989) Armus, L., Heckman, T. M., & Miley, G. K. 1989, ApJ, 347, 727
- Armus et al. (1990) Armus, L., Heckman, T. M., & Miley, G. K. 1990, ApJ, 364, 471
- Armus et al. (2009) Armus, L. et al. 2009, PASP, 121, 599
- Barnes & Hernquist (1996) Barnes, J. & Hernquist, L. 1996, ApJ, 471, 115
- Barnes (1990) Barnes, J. E. 1990, Nature, 344, 379
- Bell et al. (2007) Bell, E. F. et al. 2007, ApJ, 663, 834
- Brightman & Nandra (2011) Brightman, M. & Nandra, K. 2011, MNRAS, 413, 1206
- Bryant & Scoville (1999) Bryant, P. M. & Scoville, N. Z. 1999, AJ, 117, 2632
- Calzetti et al. (2000) Calzetti, D., Armus, L., Bohlin, R. C., et al. 2000, ApJ, 533, 682
- Casoli et al. (1991) Casoli, F., Dupraz, C., Combes, F., & Kazes, I. 1991, A&A, 251, 1
- Cicone et al. (2014) Cicone, C., Maiolino, R., Sturm, E., et al. 2014, A&A, 562, A21
- Comastri (2004) Comastri, A. 2004, in Astrophysics and Space Science Library, Vol. 308, Supermassive Black Holes in the Distant Universe, ed. A. J. Barger, 245
- Combes (1988) Combes, F. 1988, in NATO ASIC Proc. 232: Galactic and Extragalactic Star Formation, ed. R. E. Pudritz & M. Fich, 475
- Condon et al. (1991) Condon, J. J., Huang, Z.-P., Yin, Q.-F., & Thuan, T. 1991, ApJ, 378, 65
- Costagliola et al. (2011) Costagliola, F., Aalto, S., Rodriguez, M. I., et al. 2011, A&A, 528, A30
- Cox et al. (2008) Cox, T. J., Jonsson, P., Somerville, R. S., Primack, J. R., & Dekel, A. 2008, MNRAS, 384, 386
- Daddi et al. (2010) Daddi, E. et al. 2010, ApJL, 714, 118
- Dasyra et al. (2006) Dasyra, K. M. et al. 2006, ApJ, 638, 745
- Díaz-Santos et al. (2008) Díaz-Santos, T., Alonso-Herrero, A., Colina, L., et al. 2008, ApJ, 685, 211
- Downes & Solomon (1998) Downes, D. & Solomon, P. M. 1998, ApJ, 507, 615
- Draine (1980) Draine, B. T. 1980, ApJ, 241, 1021
- Draine & Li (2007) Draine, B. T. & Li, A. 2007, ApJ, 657, 810
- Drury et al. (1994) Drury, L. O., Aharonian, F. A., & Voelk, H. J. 1994, A&A, 287, 959
- Engelbracht et al. (2008) Engelbracht, C. W., Rieke, G. H., Gordon, K. D., et al. 2008, ApJ, 678, 804
- Esquej et al. (2012) Esquej, P., Alonso-Herrero, A., Perez-Garcia, A. M., et al. 2012, MNRAS, 423, 185
- Evans et al. (2002) Evans, A. S., Mazzarella, J. M., Surace, J. A., & Sanders, D. B. 2002, ApJ, 580, 749
- Faber et al. (2007) Faber, S. M. et al. 2007, ApJ, 665, 265
- Fernandez et al. (2014) Fernandez, X., Petric, A. O., Schweizer, F., & van Gorkom, J. H. 2014, arXiv: 1401.1821
- Feruglio et al. (2010) Feruglio, C., Maiolino, R., Piconcelli, E., et al. 2010, A&A, 518, L155
- Fiebig & Guesten (1989) Fiebig, D. & Guesten, R. 1989, A&A, 214, 333
- Fischer et al. (2010) Fischer, J., Sturm, E., González-Alfonso, E., et al. 2010, A&A, 518, L41
- Gao et al. (2001) Gao, Y., Lo, K. Y., Lee, S.-W., & Lee, T.-H. 2001, ApJ, 548, 172
- Gao & Solomon (1999) Gao, Y. & Solomon, P. M. 1999, ApJ, 512, L99
- Gao & Solomon (2004a) —. 2004a, ApJS, 152, 63
- Gao & Solomon (2004b) —. 2004b, ApJ, 606, 271
- García-Burillo et al. (2014) García-Burillo, S., Combes, F., Usero, A., et al. 2014, A&A, 567, A125
- García-Burillo et al. (2012) García-Burillo, S., Usero, A., Alonso-Herrero, A., et al. 2012, A&A, 539, A8
- Genzel et al. (1998) Genzel, R., Lutz, D., Sturm, E., et al. 1998, ApJ, 498, 579
- Genzel et al. (2010) Genzel, R., Tacconi, L. J., Gracia-Carpio, J., et al. 2010, MNRAS, 407, 2091
- Genzel et al. (2001) Genzel, R. et al. 2001, ApJ, 563, 527
- Graciá-Carpio et al. (2008) Graciá-Carpio, J., García-Burillo, S., Planesas, P., et al. 2008, A&A, 479, 703
- Griffin et al. (2010) Griffin, M. J., Abergel, A., Abreu, A., et al. 2010, A&A, 518, L3
- Hailey-Dunsheath et al. (2008) Hailey-Dunsheath, S., Nikola, T., Stacey, G. J., et al. 2008, ApJ, 689, L109
- Heckman et al. (2000) Heckman, T. M., Lehnert, M. D., Strickland, D. K., & Armus, L. 2000, ApJS, 129, 493
- Helou & Bicay (1993) Helou, G. & Bicay, M. D. 1993, ApJ, 415, 93
- Herrero-Illana et al. (2014) Herrero-Illana, R. et al. 2014, ApJ, 786, 156
- Hopkins (2012) Hopkins, P. F. 2012, MNRAS, 420
- Hopkins et al. (2008) Hopkins, P. F., Cox, T. J., Kere, D., & Hernquist, L. 2008, ApJS, 75, 390
- Hopkins et al. (2013) Hopkins, P. F., Kereš, D., Murray, N., et al. 2013, MNRAS, 433, 78
- Hopkins et al. (2009) Hopkins, P. F. et al. 2009, ApJ, 691, 1186
- Imanishi & Nakanishi (2013) Imanishi, M. & Nakanishi, K. 2013, AJ, 146, 47
- Iono et al. (2004) Iono, D., Ho, P. T. P., Yun, M. S., et al. 2004, ApJ, 616, L63
- Iono et al. (2009) Iono, D., Wilson, C. D., Yun, M. S., et al. 2009, ApJ, 695, 1537
- Kamenetzky et al. (2012) Kamenetzky, J., Glenn, J., Rangwala, N., et al. 2012, ApJ, 753, 70
- Kandalyan (2003) Kandalyan, R. A. 2003, A&A, 398, 493
- Kazandjian et al. (2012) Kazandjian, M. V., Meijerink, R., Pelupessy, I., et al. 2012, A&A, 542, A65
- Kazandjian et al. (2014) —. 2014, ArXiv e-prints
- Kennicutt (1998) Kennicutt, R. C. 1998, ApJ, 498, 541
- Knapen et al. (2004) Knapen, J. H., Whyte, L. F., de Blok, W. J. G., et al. 2004, A&A, 423, 481
- König et al. (2013) König, S., Aalto, S., Muller, S., Beswick, R. J., & Gallagher, J. S. 2013, A&A, 553, A72
- Kotilainen et al. (2001) Kotilainen, J. K., Reunanen, J., Laine, S., & Ryder, S. D. 2001, A&A, 366, 439
- Kruegel et al. (1990) Kruegel, E., Chini, R., & Steppe, H. 1990, A&A, 229, 17
- Leitherer et al. (1999) Leitherer, C., Schaerer, D., Goldader, J. D., et al. 1999, ApJS, 123, 3
- Leroy et al. (2013) Leroy, A. K., Walter, F., Sandstrom, K., et al. 2013, AJ, 146, 19
- Lu et al. (2014a) Lu, N., Zhao, Y., Xu, K. C., et al. 2014a, ApJ, 787, L23
- Lu et al. (2014b) Lu, N. et al. 2014b, in preparation
- Maiolino et al. (1997) Maiolino, R., Ruiz, M., Rieke, G. H., & Papadopoulos, P. 1997, ApJ, 485, 552
- Mazzuca et al. (2006) Mazzuca, L. M., Sarzi, M., Knapen, J. H., et al. 2006, ApJ, 649, L79
- Meijerink & Spaans (2005) Meijerink, R. & Spaans, M. 2005, A&A, 436, 397
- Mihos & Hernquist (1994) Mihos, J. C. & Hernquist, L. 1994, ApJ, 431, L9
- Modjaz et al. (2011) Modjaz, M., Kewley, L., Bloom, J. S., et al. 2011, ApJ, 731, L4
- Murphy et al. (2012) Murphy, E. J., Bremseth, J., Mason, B. S., Condon, J. J., Schinnerer, E., Aniano, G., Armus, L., Helou, G., Turner, J. L., & Jarrett, T. H. 2012, ApJ, 761, 97
- Naab et al. (2006) Naab, T., Jesseit, R., & Burkert, A. 2006, MNRAS, 372, 839
- Narayanan et al. (2008) Narayanan, D., Cox, T. J., Shirley, Y., et al. 2008, ApJ, 684, 996
- Neff et al. (1990) Neff, S. G., Hutchings, J. B., Standord, S. A., & Unger, S. W. 1990, AJ, 99, 1088
- Niklas & Beck (1997) Niklas, S. & Beck, R. 1997, A&A, 320, 54
- Olsson et al. (2010) Olsson, E., Aalto, S., Thomasson, M., & Beswick, R. 2010, A&A, 513, A11
- Onodera et al. (2010) Onodera, S., Kuno, N., Tosaki, T., et al. 2010, ApJ, 722, L127
- Papadopoulos & Seaquist (1998) Papadopoulos, P. P. & Seaquist, E. R. 1998, ApJ, 492, 521
- Papadopoulos et al. (2012) Papadopoulos, P. P., van der Werf, P. P., Xilouris, E. M., et al. 2012, MNRAS, 426, 2601
- Rémy-Ruyer et al. (2014) Rémy-Ruyer, A., Madden, S. C., Galliano, F., et al. 2014, A&A, 563, A31
- Risaliti et al. (2000) Risaliti, G., Gilli, R., Maiolino, R., & Salvati, M. 2000, A&A, 357, 13
- Rosenberg et al. (2014a) Rosenberg, M. J. F., Kazandjian, M. V., van der Werf, P. P., et al. 2014a, A&A, 564, A126
- Rosenberg et al. (2014b) Rosenberg, M. J. F., Meijerink, R., Israel, F. P., et al. 2014b, ArXiv e-prints
- Rosenberg et al. (2012) Rosenberg, M. J. F., van der Werf, P. P., & Israel, F. P. 2012, A&A, 540, A116
- Rothberg & Joseph (2004) Rothberg, B. & Joseph, R. D. 2004, AJ, 128, 2098
- Rothberg & Joseph (2006) —. 2006, AJ, 132, 976
- Rupke et al. (2005) Rupke, D. S., Veilleux, S., & Sanders, D. B. 2005, ApJS, 115, 148
- Sakamoto et al. (2013) Sakamoto, K., Aalto, S., Costagliola, F., et al. 2013, ApJ, 764, 42
- Sakamoto et al. (2009) Sakamoto, K., Aalto, S., Wilner, D. J., et al. 2009, ApJL, 700, 104
- Sakamoto et al. (2008) Sakamoto, K., Wang, J., Wiedner, M. C., et al. 2008, ApJ, 684, 957
- Sanders & Mirabel (1996) Sanders, D. B. & Mirabel, I. F. 1996, ARA&A, 34, 749
- Sanders et al. (1991) Sanders, D. B., Scoville, N. Z., & Soifer, B. T. 1991, ApJ, 370, 158
- Sanders et al. (1988) Sanders, D. B. et al. 1988, ApJ, 325, 74
- Schmitt et al. (2006) Schmitt, H. R., Calzetti, D., Armus, L., et al. 2006, ApJS, 164, 52
- Schweizer (1982) Schweizer, F. 1982, ApJ, 252, 455
- Schweizer & Seitzer (2007) Schweizer, F. & Seitzer, P. 2007, AJ, 133, 2132
- Scoville et al. (2000) Scoville, N. Z., Evans, A. S., Thompson, R., et al. 2000, AJ, 119, 991
- Scoville et al. (1989) Scoville, N. Z., Sanders, D. B., Sargent, A. I., et al. 1989, ApJ, 345, L25
- Scoville et al. (1997) Scoville, N. Z., Yun, M. S., & Bryant, P. M. 1997, ApJ, 484, 702
- Soifer et al. (2001) Soifer, B. T. et al. 2001, AJ, 122, 1213
- Solomon et al. (1992) Solomon, P. M., Downes, D., & Radford, S. J. E. 1992, ApJ, 387, L55
- Solomon et al. (1997) Solomon, P. M., Downes, D., Radford, S. J. E., & Barrett, J. W. 1997, ApJ, 478, 144
- Solomon & Sage (1988) Solomon, P. M. & Sage, L. J. 1988, ApJ, 334, 613
- Stierwalt et al. (2013) Stierwalt, S., Armus, L., Surace, J. A., et al. 2013, ApJS, 206, 1
- Sturm et al. (2011) Sturm, E., González-Alfonso, E., Veilleux, S., et al. 2011, ApJL, 733, 16
- Surace et al. (1998) Surace, J. A., Sanders, D. B., Vacca, W. D., et al. 1998, ApJ, 492, 116
- Toomre (1977) Toomre, A. 1977, in Evolution of Galaxies and Stellar Populations, ed. B. M. Tinsley & R. B. G. Larson D. Campbell, 401
- Tsai et al. (2012) Tsai, M., Hwang, C.-Y., Matsushita, S., et al. 2012, ApJ, 746, 129
- U et al. (2012) U, V., Sanders, D. B., Mazzarella, J. M., et al. 2012, ApJS, 203, 9
- Vacca & Conti (1992) Vacca, W. D. & Conti, P. S. 1992, ApJ, 401, 543
- Väisänen et al. (2012) Väisänen, P., Rajpaul, V., Zijlstra, A. A., et al. 2012, MNRAS, 420, 2209
- Vallée (1990) Vallée, J. P. 1990, A&A, 239, 57
- Vallée (1995) —. 1995, Ap&SS, 234, 1
- van der Tak et al. (2007) van der Tak, F. F. S., Black, J. H., Schöier, F. L., et al. 2007, A&A, 468, 627
- van der Werf et al. (2010) van der Werf, P. P., Isaak, K. G., Meijerink, R., et al. 2010, A&A, 518, L42
- Veilleux et al. (1999) Veilleux, S., Kim, D.-C., & Sanders, D. B. 1999, ApJ, 522, 113
- Veilleux et al. (2002) —. 2002, ApJS, 143, 315
- Veilleux et al. (2013) Veilleux, S., Melendez, M., Sturm, E., et al. 2013, ApJ, 776, 27
- Veilleux et al. (2009) Veilleux, S., Rupke, D. S. N., Kim, D.-C., et al. 2009, ApJS, 182, 628
- Walter et al. (2002) Walter, F., Weiss, A., & Scoville, N. 2002, ApJ, 580, L21
- Wang et al. (2004) Wang, J., Zhang, Q., Wang, Z., et al. 2004, ApJ, 616, L67
- Wilson et al. (2008) Wilson, C. D., Petitpas, G. R., Iono, D., et al. 2008, ApJS, 178, 189
- Wootten & Thompson (2009) Wootten, A. & Thompson, A. R. 2009, IEEE, 97, 1463
- Xu et al. (2014) Xu, C. K., Cao, C., Lu, N., et al. 2014, ApJ, 787, 48
- Yao et al. (2003) Yao, L., Seaquist, E. R., Kuno, N., & Dunne, L. 2003, ApJ, 588, 771
- Young et al. (1986) Young, J. S., Kenney, J. D., Tacconi, L., et al. 1986, ApJ, 311, L17
Appendix A Thermal/Nonthermal Decomposition of the Radio Continuum
The thermal radio emission is estimated from an extinction-corrected Pa- map of the central region of NGC1614 derived from HST NICMOS imaging data (Alonso-Herrero et al., 2001) taken in four NIR continuum and emission line bands (F160W and F222M, and F187N and F190N respectively). The maps are background-subtracted (Díaz-Santos et al., 2008). The dust-attenuated Pa- emission map was obtained from the F190N narrow-band line+continuum image after the subtraction of the adjacent continuum emission obtained with the F187N filter. In order to correct the Pa- map for the significant extinction (e.g., Neff et al. 1990; Alonso-Herrero et al. 2001; Kotilainen et al. 2001; Rosenberg et al. 2012), we used the equivalent width (EW) map of the emission line plus two broad-band NIR continuum images obtained at 1.6 and 2.2um.
First, we used Starburst99 (v7.0.0; Leitherer et al. 1999) to generate a stellar population synthesis model for an instantaneous burst of star formation with Geneva evolutionary stellar tracks, Kroupa initial mass function, and solar metallicity. The model outputs were obtained with a 0.1 Myr step for starburst ages ranging from 0.01 to 50 Myr. In addition to the spectral energy distribution (SED) of the continuum, the model also provides the nebular emission from hydrogen recombination lines. Assuming that the extinction to the gas is similar to that towards the dust, the observed Pa- EW map was compared to the model predictions to estimate the age of the young stellar population. We note that the ages are upper limits to the real ages since the presence of an older, underlying stellar population would increase the NIR continuum, thus aging the regions.
Once the ages of the stellar populations are estimated, we can compare the NIR continuum slope derived from the two continuum broad-band filter images with the model SEDs to derive the obscuration. To this end, the Starburst99 spectra were convolved for each age step with the corresponding continuum filters. The synthetic NIR colors (F160W/F222M) were interpolated to the ages derived from the Pa- EW map and compared with the observed values, and the extinction was estimated from this comparison. The dust attenuation law used to derive the extinction was that of Calzetti et al. (2000) for a foreground dust screen configuration. The resulting extinction map in units of is shown Figure 10. The typical error of is 0.3 mag, estimated from the uncertainties of the age and the color map. The strong east-west asymmetry in the map is in agreement with that seen in the low-J CO maps (Olsson et al., 2010; König et al., 2013), and is likely associated with a broad dust-lane extended from the north to the west of the ring (König et al., 2013). Finally, the observed Pa- image was corrected using the obscuration map obtained from this method. The extinction-corrected Pa- emission was then scaled to obtain the thermal component of the radio emission at 8.4 GHz (see equation 4 in Herrero-Illana et al. 2014). The nonthermal component was then obtained by subtracting the thermal emission from the original radio map.