Mixed modes in red giants: a window on stellar evolution††thanks: Table 1 is only available in electronic form at the CDS via anonymous ftp to cdsarc.u-strasbg.fr (130.79.128.5) or via http://cdsweb.u-strasbg.fr/cgi-bin/qcat?J/A+A/
Abstract
Context. The detection of oscillations with a mixed character in subgiants and red giants allows us to probe the physical conditions in their cores.
Aims. With these mixed modes, we aim at determining seismic markers of stellar evolution.
Methods. Kepler asteroseismic data were selected to map various evolutionary stages and stellar masses. Seismic evolutionary tracks were then drawn with the combination of the frequency and period spacings.
Results. We measured the asymptotic period spacing for more than 1170 stars at various evolutionary stages. This allows us to monitor stellar evolution from the main sequence to the asymptotic giant branch and draw seismic evolutionary tracks. We present clear quantified asteroseismic definitions that characterize the change in the evolutionary stages, in particular the transition from the subgiant stage to the early red giant branch, and the end of the horizontal branch.
Conclusions. The seismic information is so precise that clear conclusions can be drawn independently of evolution models. The quantitative seismic information can now be used for stellar modeling, especially for studying the energy transport in the helium-burning core or for specifying the inner properties of stars entering the red or asymptotic giant branches. Modeling will also allow us to study stars that are identified to be in the helium-subflash stage, high-mass stars either arriving or quitting the secondary clump, or stars that could be in the blue-loop stage.
Key Words.:
Stars: oscillations - Stars: interiors - Stars: evolution1 Introduction
High-precision photometry has revealed that red giant stars oscillate like the Sun (De Ridder et al. 2009). Unlike the Sun, where the oscillations are pressure modes, red giants also show gravity modes. These oscillations have been used to distinguish between stars that are burning only hydrogen in a thin shell around their cores and those that are additionally burning helium inside their cores (Bedding et al. 2011; Mosser et al. 2011a; Stello et al. 2013). The spacings between oscillation periods reported by these studies are significantly offset compared to their theoretical counterparts, however, so they cannot be used for identifying specific evolutionary tracks. However, exact measurements of the asymptotic period spacings are now available (Mosser et al. 2012b), which are directly related to the core size (Montalbán et al. 2013).
The combined information on the core and on the envelope of red giants can be obtained from observing the oscillation mixed-mode pattern (Beck et al. 2011). These modes result from the coupling of acoustic waves that probe the mostly convective stellar envelope and gravity waves that probe the dense radiative stellar core. They share the properties of acoustic and gravity modes. Acoustic modes have frequencies approximately equally spaced (Tassoul 1980). The frequency difference between consecutive radial oscillation modes, hereafter denoted , is called the large frequency separation and depends on the mean stellar density. Unlike pressure modes, gravity modes are equally spaced in period. For dipole modes this spacing is denoted and is dependent upon the density stratification in central regions (Tassoul 1980). Determining allows us to probe the core, to monitor its rotation (Beck et al. 2012; Mosser et al. 2012a; Deheuvels et al. 2012, 2014), and to investigate how angular momentum is transferred between the stellar core and the envelope (Cantiello et al. 2014).
Here, we use such frequency and period spacings to track evolutionary stages ranging from the end of the main sequence to the asymptotic giant branch (AGB) in a selection of stars observed by Kepler. Seismic observations are precise enough to derive model-independent conclusions.
2 Data and methods
The data set is composed of 38 subgiants observed by Kepler during at least one month (Chaplin et al. 2011) and of about 12 700 red giants observed during 44 months (Stello et al. 2013). Out of these, were selected to map the whole range in frequency spacings and masses. This selection precludes any population analysis, but it provides an exhaustive view on low-mass star evolution.
We have used an automated method for measuring the frequency spacing of radial pressure modes and have developed a semi-automated method for measuring the period spacing of dipole mixed modes, both based on asymptotic expansions (Mosser et al. 2011b, 2012b). The mean accuracy of the large separation is about 0.04 Hz; this translates into a relative precision at the red clump of 1 %. The measurement of relies on the number of mixed modes with high signal-to-noise ratio, which depends on the evolutionary status (Dupret et al. 2009; Mosser et al. 2012b). The precise fit of the oscillation spectrum must account for any rotational splitting (Beck et al. 2012; Mosser et al. 2012a; Goupil et al. 2013).
For red giants, the observed gravity-mode orders are high enough to ensure the validity of the asymptotic expansion and a high precision of the asymptotic global parameters. Hence, the period spacing is determined with a precision better than 2 % and in many cases better than 0.5 %. For subgiants, the gravity-mode orders of the few observed mixed modes are small, down to 2 in many cases, so that the quantitative use of the asymptotic expansion may not be accurate. However, comparison with a different approach (Benomar et al. 2013, 2014) indicates agreement in the obtained values of the period spacings to within 10 % for subgiants and better than 3 % for red giants.
We measured in 1142 red giants and 36 subgiants. Reliable measurements are impossible in oscillation spectra with low signal-to-noise ratio or, most often, in absence of enough gravity-dominated mixed modes. This occurs at low , when gravity-dominated mixed modes have high inertia (Dupret et al. 2009; Grosjean et al. 2014) so that major difficulties occur for stars with Hz on the red giant branch (RGB). In that case, measurements are possible only for bright stars seen pole-on, when the rotational structure of the dipole mixed modes is simple since only modes are visible. The number of ambiguous cases, with a large number of mixed modes but a poor fit of the mixed-mode oscillation pattern, is less than 0.1 % (the spectra of 2 stars out of 2800 that were treated remain obscure despite a decent signal-to-noise ratio; they certainly corresponds to blended light curves).
The stellar masses and radii were derived from the seismic scaling relations calibrated with nine red giants and eleven subgiants (Mosser et al. 2013). Luminosity was derived from the stellar radius and effective temperature, assuming the Stefan-Boltzmann law. The precision is 15-25 % in mass, 5-10 % in radius, 15-25 % in luminosity (Huber et al. 2012; Silva Aguirre et al. 2012).
3 Seismic HR diagram
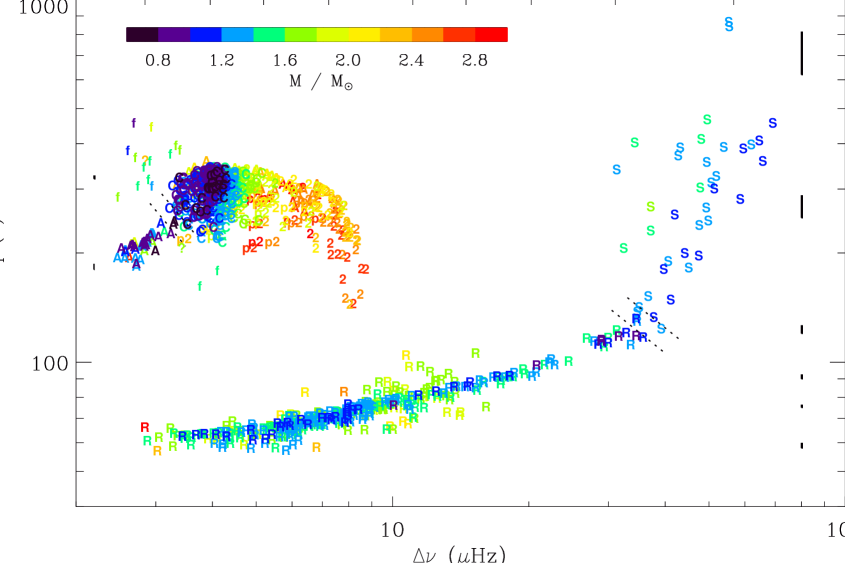
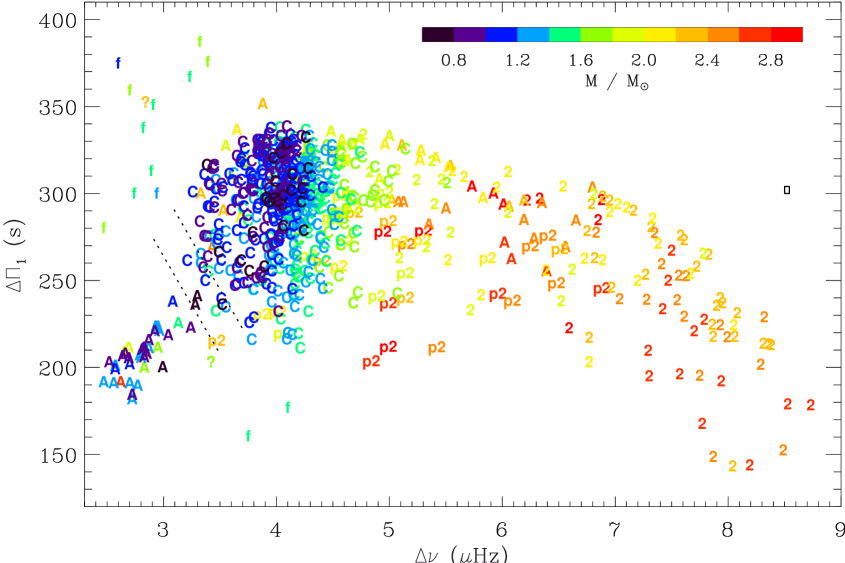
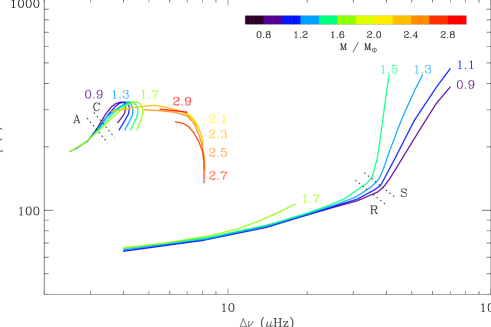
Examining the variation of as a function of in a seismic Hertzsprung-Russell (HR) diagram allows us to map stellar evolution and to distinguish the late evolutionary stages (Fig. 1). This – diagram provides richer information than the classical HR diagram. Without seismic data, determining precise evolutionary stages for field stars is uncertain or impossible because of an observable quantity that probes the innermost region of the stars and because of the large uncertainties associated with the fundamental stellar parameters (luminosity, effective temperature, and chemical composition). Here, the density of stars in the – diagram enables constructing seismic evolutionary tracks (Fig. 2) directly derived from the mean location of stars identified in mass ranges 0.2- wide.
3.1 Subgiant stage
A star leaves the main sequence and enters the subgiant stage (stars S in Fig. 1) when the hydrogen fuel is exhausted in its core. In a star of mass lower than 1.5 , the observation of mixed modes indicates a dense radiative core and the beginning of the subgiant phase, as is the case for the bright F-star Procyon (Bedding et al. 2010). The slow contraction of the core on a thermal timescale implies a quasi-static adjustment, hence the extension of the envelope. Accordingly, as a subgiant evolves, the mean stellar density, and therefore the large separation, decreases. The contraction of the radiative core also results in a decreased period spacing. We also note a clear mass dependence of the – relation (Fig. 2), as predicted by stellar modeling (Montalbán et al. 2013).
3.2 From subgiants to the red giant branch
As stars evolve from subgiants onto the RGB, the increase of the stellar radius induces the decrease of the large separation. We note the convergence of the evolutionary paths in the seismic – diagram. The properties of the stellar interior become increasingly dominated by the physical conditions of the quasi-isothermal degenerate helium core and its surrounding hydrogen-burning shell (Kippenhahn et al. 2012). Accordingly, the structural properties of the envelope are also related to the core mass, which explains the degeneracy in the – diagram for low-mass red giants (stars R in Fig. 1). Although the transition from the subgiant phase to the RGB can be seen in the classical HR diagram, it is impossible to unambiguously infer the evolutionary status of a given star from its location in that diagram. In contrast, the evolution from the subgiant to the red giant phase is clear in the – diagram: almost independent of the initial conditions (mass, metallicity), all low-mass stars on the RGB with the same core structure have the same mean density. The influence of metallicity should be investigated to understand the higher dispersion seen for stars more massive than 1.5 ; this is beyond the scope of this work. We can summarize the change of regime with an empirical criterion: a subgiant with a mass below 1.5 starts climbing the RGB when . This threshold is determined to better than 8 %, based on the identification of the ‘elbow’ in the evolutionary tracks. The boundary and its uncertainties are indicated with dotted lines in Figs. 1 and 2. Translated into a stellar age, this uncertainty represents a very short event, much shorter than 0.5 % of the evolution time on the main sequence.
3.3 Structure of the red clump
When the helium core of a low-mass star on the RGB reaches about , runaway ignition in degenerate conditions produces the helium flash, which very rapidly transports the star from the tip of the RGB to the red clump (Salaris et al. 2002). The highest mass a star can have to undergo the helium flash is , with an uncertainty of about 10 %. We did not take into account the scaling revision proposed by Miglio et al. (2012) for red-clump stars. Red-clump stars (stars C in Fig. 1) occupy a small region of the – diagram, around 300 s and 4.1 Hz (Mosser et al. 2012b). They have similar core masses, hence similar luminosities, and are therefore used as standard candles (Paczyński & Stanek 1998). Seismic information provides useful constraints for improving the structure of the red clump, hence for improving distance measurements.
Models still have difficulties in reproducing the period spacing in the red clump (Bildsten et al. 2012; Montalbán et al. 2013; Stello et al. 2013). In part this is due to an incorrect treatment of a chemical discontinuity at the convective-core boundary in core-helium-burning models (Gabriel et al. 2014), resulting in insufficient mixing in the core (Noels & Montalbán 2013). More importantly, the accuracy of the measurements of and is high enough to track the evolution of the stars in the helium-burning phase. Low-mass stars have lower than more massive stars, hence lower mean density. This is in agreement with the fact that the inner pressure is fixed by the hydrogen shell that produces the largest part of the stellar luminosity. During the first stage of helium burning, the core grows in mass and expands, so that the envelope contracts: both and increase. In a second stage, both decrease, due to a less efficient energy production. This evolution is predicted by models (Lagarde et al. 2012; Montalbán et al. 2013; Stello et al. 2013). Now, we can precisely quantify it (Fig. 2).
3.4 Structure of the secondary clump
In stars with masses above about , the ignition of helium occurs gradually rather than in a flash because the core is not fully degenerate (Girardi 1999; Huber et al. 2012; Miglio et al. 2012). Therefore, these secondary-clump stars (stars 2 in Fig. 1) show a wider spread in the diagram (Bildsten et al. 2012): decreases with increasing stellar mass up to 2.7 , as does the mass of the helium core at ignition. Then, for masses above 2.8 , increases significantly with increasing stellar mass. This behavior is expected from stellar modeling, which however often fails at reproducing the mass corresponding to minimum values (e.g., Stello et al. 2013). This again emphasizes the crucial role of the seismic HR diagram and the necessity of accurately calibrating seismic scaling relations.
We defined the p2 status for each mass range; this status corresponds to possible progenitors of secondary-clump stars. The mass-dependent threshold value between the two stages p2 and 2 was arbitrarily defined at lower than 25 % of the median value in the secondary clump and below the mean value observed in the secondary clump for the considered mass range. Progenitors of secondary-clump stars have a lower (a higher luminosity) than the median stage in each mass interval, and also a low corresponding to an extended inner radiative region. Comparison with modeling is necessary to confirm the nature of these progenitors.
3.5 From the red and secondary clumps to the asymptotic giant branch
A few stars appear in the vicinity of the clump, but with significantly smaller period spacings. They most probably correspond to stars in which the core is contracting because helium becomes exhausted, leaving the main region of the red clump and preparing to ascend the AGB (Lagarde et al. 2012; Corsaro et al. 2012; Montalbán & Noels 2013). Since a wide range of masses, including high masses, are present on the same trajectory, we exclude the scenario that these stars are entering the red clump. We empirically considered that a star leaves the red clump and enters this stage, labeled with A in the – diagram, when its large separation is 15 % below the mean value observed in the clump for stars with similar masses. For low-mass stars, this occurs when . This threshold is determined to better than 6 %, based on the narrowing of the evolutionary tracks. In the classical HR diagram, such low-mass stars remain hidden in the red clump since they have similar luminosity. This better characterization of the clump stars is important for using them as accurate standard candles.
High-mass stars exiting the secondary clump can also be identified. When core-helium burning becomes inefficient, decreases and first increases. This behavior and the mass criterion ensure a significant difference between the p2 and A stages. In a second step, and vary as for lower mass stars, but with a wider spread. This leads to a reliable definition of the A stage when , even with a limited set of stars.
3.6 Helium flash
Finally, we identified a small number of stars that clearly lie outside the evolutionary paths mentioned above. It is likely that these stars have very recently undergone the helium flash (stars f in Fig. 1). At low , we identified stars with an unusually high period spacing, corresponding to a small inner radiative region. For low-mass stars, this situation matches a helium subflash (Bildsten et al. 2012). For higher mass, the evolutionary stage cannot be determined among helium ignition or blue-loop stage; two stars that may be in this stage are marked with the symbol ‘?’. Stages between subflashes are hard to detect because they have simultaneously small and (Lagarde et al. 2012). We also identified stars with just below the main clump, which certainly evolve toward the clump with an almost fully ignited helium core.
4 Conclusion
Precise markers of stellar evolution of low-mass stars were derived in the – diagram. For each stellar mass interval, evolutionary tracks were derived. All transitions between the various stages of evolution, such as hydrogen-shell burning, helium-core burning, and the end of helium burning in the core, are marked by changes in the relationship between the frequency and period spacings. For low-mass stars arriving on the RGB, the period spacing varies with the frequency spacing because the core and envelope structures are closely linked at that stage. Similar variation is seen for core-helium-burning stars, but with a mass-dependent relationship since nuclear burning in the core removes the degeneracy of helium. When helium is exhausted, the core is degenerate again, so that the relation between and is independent of mass, as on the RGB. A few outliers are identified as stars starting the helium-burning stage in the unstable contraction phase following the helium flash (Bildsten et al. 2012).
Comparison with modeling will help to link the phenomenological threshold values with evolution parameters such as the helium fraction in the core, especially for secondary-clump stars, to assess the p2 stage. This comparison is currently impossible, since modeling has first to accurately reproduce the observed tracks. Independent of this forthcoming analysis, we note that there are fewer than 1% of stars with ambiguous identifications in the clump, which are identified as stars close to the boundaries. Among these, we identified two high-mass stars that might be in a blue-loop stage.
Acknowledgements.
We thank the referee for his/her constructive comments. We acknowledge the entire Kepler team, whose efforts made these results possible. BM, KB, MJG, EM, MV, CB, and RS acknowledge financial support from the Programme National de Physique Stellaire (CNRS/INSU) and from the ANR program IDEE Interaction Des Étoiles et des Exoplanètes. OB is supported by the Japan society for promotion of science fellowship for research (n∘ 25-13316). Funding for this Discovery mission was provided by NASA’s Science Mission Directorate. JDR acknowledges support of the FWO Flanders under project O6260-G.0728.11 This work partially used data analyzed under the NASA grant NNX12AE17GPGB and under the European Community fs Seventh Framework Program grant (FP7/2007–2013)/ERC grant agreement n. PROSPERITY.References
- Beck et al. (2011) Beck, P. G., Bedding, T. R., Mosser, B., et al. 2011, Science, 332, 205
- Beck et al. (2012) Beck, P. G., Montalban, J., Kallinger, T., et al. 2012, Nature, 481, 55
- Bedding et al. (2010) Bedding, T. R., Kjeldsen, H., Campante, T. L., et al. 2010, ApJ, 713, 935
- Bedding et al. (2011) Bedding, T. R., Mosser, B., Huber, D., et al. 2011, Nature, 471, 608
- Benomar et al. (2013) Benomar, O., Bedding, T. R., Mosser, B., et al. 2013, ApJ, 767, 158
- Benomar et al. (2014) Benomar, O., Belkacem, K., Bedding, T. R., et al. 2014, ApJ, 781, L29
- Bildsten et al. (2012) Bildsten, L., Paxton, B., Moore, K., & Macias, P. J. 2012, ApJ, 744, L6
- Cantiello et al. (2014) Cantiello, M., Mankovich, C., Bildsten, L., Christensen-Dalsgaard, J., & Paxton, B. 2014, ApJ, 788, 93
- Chaplin et al. (2011) Chaplin, W. J., Kjeldsen, H., Christensen-Dalsgaard, J., et al. 2011, Science, 332, 213
- Corsaro et al. (2012) Corsaro, E., Stello, D., Huber, D., et al. 2012, ApJ, 757, 190
- De Ridder et al. (2009) De Ridder, J., Barban, C., Baudin, F., et al. 2009, Nature, 459, 398
- Deheuvels et al. (2014) Deheuvels, S., Doğan, G., Goupil, M. J., et al. 2014, A&A, 564, A27
- Deheuvels et al. (2012) Deheuvels, S., García, R. A., Chaplin, W. J., et al. 2012, ApJ, 756, 19
- Dupret et al. (2009) Dupret, M., Belkacem, K., Samadi, R., et al. 2009, A&A, 506, 57
- Gabriel et al. (2014) Gabriel, M., Noels, A., Montalbán, J., & Miglio, A. 2014, A&A, 569, A63
- Girardi (1999) Girardi, L. 1999, MNRAS, 308, 818
- Goupil et al. (2013) Goupil, M. J., Mosser, B., Marques, J. P., et al. 2013, A&A, 549, A75
- Grosjean et al. (2014) Grosjean, M., Dupret, M.-A., Belkacem, K., et al. 2014, ArXiv e-prints: 1409.6121G
- Huber et al. (2012) Huber, D., Ireland, M. J., Bedding, T. R., et al. 2012, ApJ, 760, 32
- Kippenhahn et al. (2012) Kippenhahn, R., Weigert, A., & Weiss, A. 2012, Stellar Structure and Evolution
- Lagarde et al. (2012) Lagarde, N., Decressin, T., Charbonnel, C., et al. 2012, A&A, 543, A108
- Miglio et al. (2012) Miglio, A., Brogaard, K., Stello, D., et al. 2012, MNRAS, 419, 2077
- Montalbán et al. (2013) Montalbán, J., Miglio, A., Noels, A., et al. 2013, ApJ, 766, 118
- Montalbán & Noels (2013) Montalbán, J. & Noels, A. 2013, in European Physical Journal Web of Conferences, Vol. 43, European Physical Journal Web of Conferences, 3002
- Mosser et al. (2011a) Mosser, B., Barban, C., Montalbán, J., et al. 2011a, A&A, 532, A86
- Mosser et al. (2011b) Mosser, B., Belkacem, K., Goupil, M., et al. 2011b, A&A, 525, L9
- Mosser et al. (2012a) Mosser, B., Goupil, M. J., Belkacem, K., et al. 2012a, A&A, 548, A10
- Mosser et al. (2012b) Mosser, B., Goupil, M. J., Belkacem, K., et al. 2012b, A&A, 540, A143
- Mosser et al. (2013) Mosser, B., Michel, E., Belkacem, K., et al. 2013, A&A, 550, A126
- Noels & Montalbán (2013) Noels, A. & Montalbán, J. 2013, in Astronomical Society of the Pacific Conference Series, Vol. 479, Astronomical Society of the Pacific Conference Series, ed. H. Shibahashi & A. E. Lynas-Gray, 435
- Paczyński & Stanek (1998) Paczyński, B. & Stanek, K. Z. 1998, ApJ, 494, L219
- Salaris et al. (2002) Salaris, M., Cassisi, S., & Weiss, A. 2002, PASP, 114, 375
- Silva Aguirre et al. (2012) Silva Aguirre, V., Casagrande, L., Basu, S., et al. 2012, ApJ, 757, 99
- Stello et al. (2013) Stello, D., Huber, D., Bedding, T. R., et al. 2013, ApJ, 765, L41
- Tassoul (1980) Tassoul, M. 1980, ApJS, 43, 469