Astrometric Calibration of the Gemini NICI Planet-Finding Campaign111Based on observations obtained at the Gemini Observatory, which is operated by the Association of Universities for Research in Astronomy, Inc. under a cooperative agreement with the NSF on behalf of the Gemini partnership: the National Science Foundation (United States), the National Research Council (Canada), CONICYT (Chile), the Australian Research Council (Australia), Ministério da Ciência, Tecnologia e Inovação (Brazil), and Ministerio de Ciencia, Tecnología e Innovación Productiva (Argentina).
Abstract
We describe the astrometric calibration of the Gemini NICI Planet-Finding Campaign. The Campaign requires a relative astrometric accuracy of mas across multi-year timescales in order to distinguish true companions from background stars by verifying common proper motion and parallax with their parent stars. The calibration consists of a correction for instrumental optical image distortion, plus on-sky imaging of astrometric fields to determine the pixel scale and image orientation. We achieve an accuracy of mas between the center and edge of the 18′′ NICI field, meeting the 20 mas requirement. Most of the Campaign data in the Gemini Science Archive are accurate to this level but we identify a number of anomalies and present methods to correct the errors.
1 Introduction
The Gemini NICI Planet-Finding Campaign was a direct-imaging survey of about 250 nearby stars for substellar and planetary-mass companions conducted at Gemini South Observatory between 2008 and 2012 (Liu et al. 2010). The Campaign used the Near-Infrared Coronagraphic Imager (NICI, Chun et al. 2008), which combines adaptive optics, coronagraphy, angular differential imaging (Liu 2004; Marois et al. 2006), and dual-channel methane-band infrared imaging to achieve an H-band contrast detection limit of 14.4 magnitudes at 1′′ radius (Wahhaj et al. 2013a). The principal scientific results have been published by Biller et al. (2010), Wahhaj et al. (2011), Nielsen et al. (2012), Wahhaj et al. (2013b), Nielsen et al. (2013), and Biller et al. (2013); the pipeline processing algorithm is described by Wahhaj et al. (2013a).
The multi-epoch imaging data acquired for the Campaign require accurate astrometric calibration in order to detect common proper motion and parallax between the host star and any candidate companions and therefore distinguish true companions from background stars. In this paper, we describe the process used to establish the alignment of the NICI science detectors relative to the celestial coordinate system and calibrate the World Coordinate System (WCS) contained in the data headers.
2 Instrument Design and Data Format
NICI consists of two parts: an adaptive optics (AO) system and a dual-channel science camera (Chun et al. 2008). The AO-corrected wavefront entering the science camera first passes through a focal plane coronagraph mask and a pupil/spider mask, then is divided between the two science channels by the Dichroic Wheel (DW). Light transmitted through the DW enters the Red channel while reflected light enters the Blue. The DW can be set to one of the following elements: H-50/50 beamsplitter, which directs 50% of H-band (1.65 µm) light to each science channel; H/K Dichroic, which divides light between the H and K (2.2 µm) bands; Mirror, which reflects all light to the Blue channel; or Open, which passes all light to the Red channel.
After the DW, each science channel contains a filter wheel, reimaging optics, and an ALADDIN II 10241024 InSb array detector. The Campaign most frequently used 4% bandpass filters centered in and out of the m methane absorption feature (named CH4-H4%L and CH4-H4%S, respectively) to search for methane-bearing planets very close to the primary star, and a broadband H filter for deeper searches at larger separations. The on-sky pixel size is milli-arcseconds (mas) and the field size is . The mapping of the sky onto each of the two science detectors is different and changes with the DW element and filter.
NICI data are processed by the Gemini Data-Handling System (DHS) and are written to Multi-Extension FITS (MEF) files (Wells et al. 1981; Pence et al. 2010) which contain a Primary Header followed by two extensions, one for each of the two science channels. The header for each extension contains its own WCS specifying the astrometric parameters for that channel (Greisen & Calabretta 2002). The calibration of the WCS for each channel is a principal subject of this work.
Details on the data format, WCS, and other header data are specified in the Appendix, and more information on NICI is available at http://www.gemini.edu/sciops/instruments/nici.
3 Astrometric Requirements
The astrometric calibration requirements for the NICI Planet-Finding Campaign arise from three aspects of the observing strategy.
First, most Campaign data were taken in a mode called Angular Differential Imaging (ADI, Liu 2004; Marois et al. 2006), in which the Cassegrain rotator is held fixed and the sky allowed to rotate on the science detectors so that astronomical objects surrounding the primary star under observation move relative to the fixed speckles in the NICI point-spread function (PSF). The individual minute exposures taken over a range of field angles (in some cases ) were derotated and registered before being co-added by the pipeline-processing software. To achieve accurate alignment over the entire field, image distortion must be corrected before derotation.
Second, targets were imaged simultaneously in the two science channels in and out of the m methane absorption feature, in a mode known as Angular Spectral Differential Imaging (ASDI), to suppress the stellar continuum further and enhance potential methane-bearing planets. The distortion, rotation and scale difference between the two channels must be corrected before the pipeline can accurately register and subtract the two images, especially when they are added in order to find non-methane-bearing planets. In practice, sufficient accuracy can be achieved because these differences are static properties of the instrument that can be measured once and applied to all data.
Third, the Campaign strategy required measuring the relative proper motion (PM) between a target star and any candidate companions detected in the surrounding field in order to distinguish true companions (with common PM) from background stars. Because only the relative PM is required, we are not concerned with absolute astrometry (i.e. the absolute celestial coordinate zero points), but only with the image distortion, field rotation, and pixel scale. In order to assess proper motion and parallax robustly, this calibration had to be maintained over multi-year timescales, during which time NICI was dismounted and remounted on the telescope, sometimes on different instrument ports with different numbers of reflections in the optical path to the instrument. Therefore, the astrometric calibration required observations of astrometric fields during each instrument mounting. In addition, because a field observed at multiple epochs was not typically observed at the same hour angle each time, the field rotation was often significantly different, again requiring correction of the image distortion before the two datasets could be compared.
The required astrometric accuracy is dictated by the PM of the target stars. In the Campaign’s target list of nearby stars, the lowest PMs are mas yr-1, or NICI pixel yr-1; most are at least a few times larger. An accuracy of 1 pixel from the center of the NICI field (the usual location of a primary star) to the edge therefore permits most candidate companions to be checked for common PM within one year, especially since accuracy near the field center will be considerably better.
For the pixel scale, 1 pixel out of 512 is 0.2%, while a rotation error of corresponds to 1 pixel across half the field. These constraints will serve as guidelines throughout this paper.
4 Astrometric Calibration
Our astrometric calibration process has three principal components:
-
1.
correcting the image distortion introduced by the instrument optics;
-
2.
measuring the field rotation and setting the instrument alignment angle;
-
3.
constructing the WCS.
4.1 Image Distortion
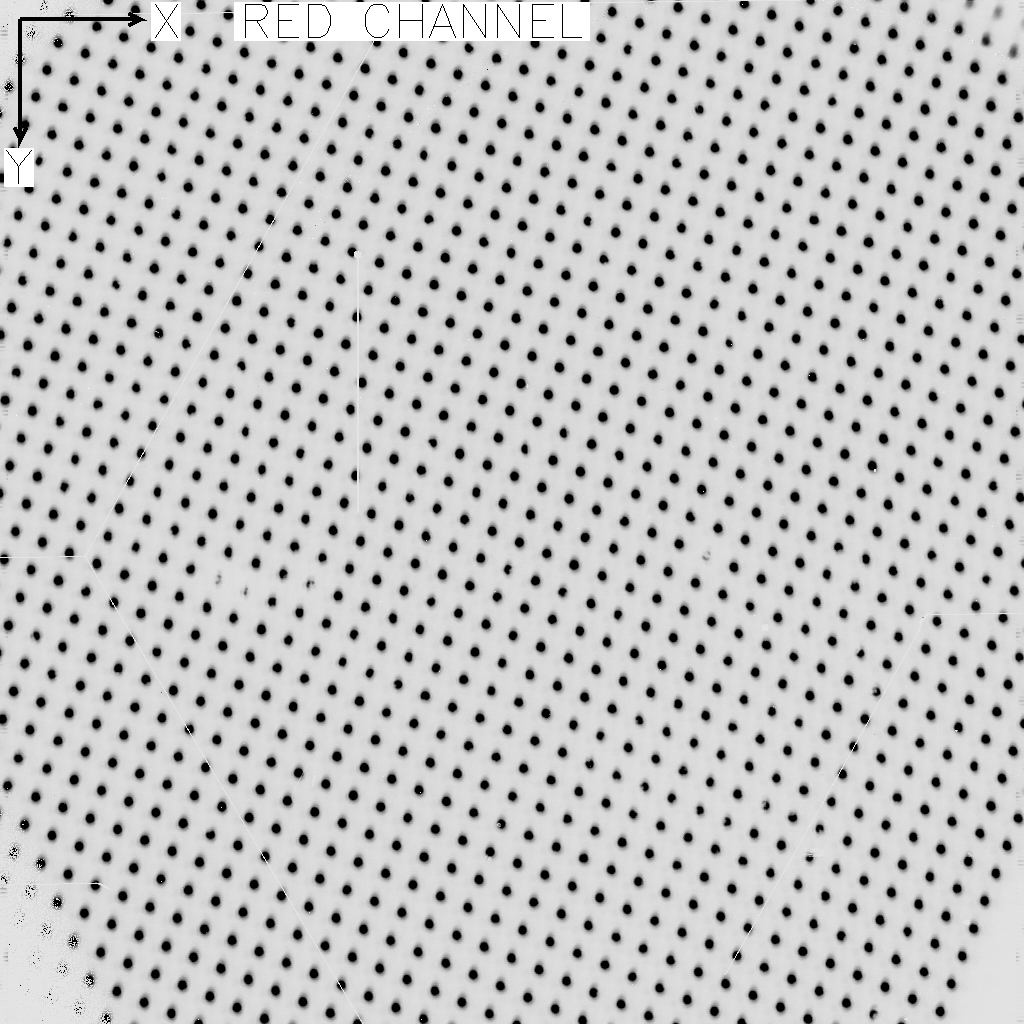
The two NICI channels suffer from image distortion arising from the off-axis reflective optics in both the AO system and science camera. To measure the distortion, we imaged a pinhole grid mask mounted in the Fiber Optic Calibration Source (FOCS), which can be deployed into the telescope focal plane at the entrance to the AO system. The FOCS mask distortion at the science detectors represents the combined distortions of the AO system and science camera optics. We preferred to use the mask rather than an astronomical field due to the grid spots’ very high signal-to-noise, their uniform size and distribution over almost the entire field, and the freedom from seeing and anisoplanatism effects.
FOCS Grid Mask images are shown in Figure 1. The grid is rotated by relative to the detector. The Blue channel image is reflected left-right relative to the Red due to the extra reflection at the DW optic in the path to the Blue channel.
4.1.1 Fitting Procedure
To determine the distortion, a grid mask image is first background-subtracted and the centroid of each spot measured. A synthetic rectilinear grid is then fitted to the spot positions within 256 pixels of the image center, the region of lowest distortion, by minimizing the statistic
| (1) |
where is the measured centroid of spot , are the spot positions in the synthetic grid, and is the uncertainty of the centroid measurement. There are four free parameters: and represent the overall grid position, is the spot separation in pixels (assumed to be the same in X and Y), and is the grid rotation. The value is minimized using the Nelder-Mead simplex method (Nelder & Mead 1965; Press et al. 1992) as implemented in the IDL built-in routine AMOEBA (Exelis Visual Information Solutions, Boulder, Colorado). The simplex algorithm begins by computing for a set of trial parameters, then finds the trajectory through parameter space that steadily reduces until a minimum is reached. The uncertainty is set to 1 for all points because we are only interested in the best-fit rectangular grid at this first stage, not the positional uncertainties.
We used the IDL routine POLY_2D to transform the images geometrically to correct the distortion. The transformation is defined by polynomials of degree :
| (2) |
| (3) |
where and are the initial pixel coordinates and and are the transformed coordinates. and are coefficients determined from a least-squares fit performed by the companion routine POLY_WARP, based on the measured grid mask () positions and the rotated rectilinear grid () positions. After computing () for all the pixels, POLY_2D generates a transformed image using cubic convolution. The residual errors of the distortion correction were computed by applying the correction to the grid mask images, then measuring the difference between the rectilinear points and the mask spots.
4.1.2 Distortion Corrections
We derived distortion corrections for six pairs of images taken in five different instrument configurations as shown in Table 1. By experimentation, we determined that a fifth-order () fit had a residual error of 0.5 – 0.6 pixels root-mean-square (rms) for both channels, and that higher-order polynomials did not reduce the error. The initial distortion is as high as 12 pixels in the array corners.
Given the high signal-to-noise images of the spots, the uncertainty of the individual centroid measurements is much smaller than 0.5 pixels, so the quality of the fits is limited by some source of systematic error. (In statistical terms, if is set to 0.1 pixel, the resultant per degree of freedom of the perfect grid relative to the distortion-corrected images is , much higher than the value of 1 expected when random errors dominate.) The main source of systematic error is most likely the use of a polynomial to approximate the distortion; an optical raytrace model may be required to improve the fit. The accuracy of the polynomial fit is within our 1 pixel goal, so we accept it as satisfactory for the Campaign.
We fitted six different images to evaluate the consistency of the distortion across multiple instrument configurations. The consistency is a concern because the grid position on the Blue channel array varies by up to a few dozen pixels (Table 2) due to the slightly different mounting angles of the optical elements in the Dichroic Wheel, and in some cases the failure of DW to seat consistently in its detent. The Blue channel variations are much larger than the Red because the reflected beam from DW is deviated more by optical element tilts than the transmitted beam. For the H-50/50 beamsplitter, the Blue channel () positions vary by up to 25 pixels between different positionings (two extremes “min” and “max” are listed in Table 2); evidently the DW does not fully settle into its detent at the H-50/50 position. Such large variations are not detected for the other DW elements.
Across the six datasets, there are only small variations in each of the parameters for scale and rotation (see Table 1). The spot separations vary by 0.05% for the Red channel and 0.10% for the Blue, while the rotations are consistent to for the Red channel and for the Blue. If the Open position is omitted, a reasonable action given that DW substrates probably introduce aberrations into the transmitted beam that would be absent for the Open position, the Red channel rotation range is only .
The Blue channel exhibits DW-dependent rotations which appear to be correlated with the largest position offsets listed in Table 2, indicating that the irreproducible positions of the DW are causing both effects. The rotations are smaller than our precision goal, and not much larger than the rms error of the fit, but nevertheless appear to be systematic.
The fitting results do reveal significant differences in scale and rotation between the Red and Blue channels. How these differences are managed is described in the WCS section below.
To evaluate distortion variations between the instrument configurations, we applied the correction for the H-50/50 + CH4-H4% images to the other four datasets. Table 3 shows that in all cases the errors are pixel rms, or .
Given the acceptable repeatability of the H-50/50 + CH4-H4% distortion correction across all the instrument configurations, we adopted it as the standard correction for all Campaign data. The distortion correction coefficients for this mode are listed in Table 4, and maps of the distortion correction vectors and the post-correction residual errors are displayed in Figure 2. More than half of the Campaign data were taken in the dual-channel ASDI mode with this configuration. Applications which require the highest possible accuracy, however, may wish to use more detailed calibration datasets taken in a particular configuration.
4.2 Instrument Alignment Angle
The Telescope Control System (TCS) uses a simple formula to control the Cassegrain Rotator (CR) so that the desired position angle on sky, , the Instrument Position Angle, is oriented parallel to the detector columns toward the top of the image. A quantity , the Instrument Alignment Angle, is defined to represent the rotation between the CR and science detector reference frames. The CR angle is related to the other angles by
| (4) |
where is the parallactic angle of the target under observation.
For example, if a detector is mounted exactly aligned with the CR frame, . To achieve (North up on detector) on the meridian where , would be 180∘. Note that is dependent on the mechanical orientation of the instrument on the telescope; small rotations or other changes in the mounting may in turn require a different setting in order to achieve an accurate .
Observations may be defined with CR in two modes: Follow mode, in which case the TCS sets and continuously updates the CR to keep the specified vertical on the detector, and Fixed mode where the TCS sets the CR to a fixed value, allowing the sky (and therefore ) to rotate on the detector during the observation. Follow mode is used for most observations with other science instruments, but Fixed is used for NICI ADI and ASDI observations.
For NICI, can represent only one of the two science channels. The natural choice is the Red channel, due to its smaller DW-dependent systematic variations in scale and rotation than the Blue’s. With this calibration, at , north is exactly vertical on the Red channel, while it is offset by on the Blue channel.
Setting requires observing an astrometric standard target or field, an exercise which must be performed each time NICI is mounted on the telescope. Table 5 lists the individual NICI mountings between 2008 and 2012, the astrometric standard observed, and the and pixel scale results. Over the course of the Campaign, our calibration technique grew more sophisticated as we added distortion corrections and switched from binary stars to a more precise astrometric field.
4.2.1 Binary Stars
For the Campaign’s first two years, from 2008 August to 2010 October, we used two binary stars for astrometric calibration. An ideal binary would have a separation between 5′′ and 10′′ (small enough to fit into NICI’s 18′′ field yet large enough to provide a sufficient lever arm for an accurate measurement), a separation precision a few mas, and a position angle precision . Such high precision requires modern speckle measurements; orbits based on older historical data are not sufficiently precise. Several well-known systems with precise orbits were rejected because their stars were too bright, saturating on NICI even with the shortest possible exposure times.
We adopted 70 Oph (catalog ) (STF 2272AB, WDS 18055+0230), which has an accurate speckle-based orbit (Pourbaix 2000; Eggenberger et al. 2008) and 55 separation in mid-2008, as our initial astrometric standard. The primary component was bright enough to provide sufficient S/N when placed under the coronagraph mask. The off-mask image of the secondary component, with , saturated slightly in the PSF core, but its position could still be measured to pixel based on the unsaturated halo. In this way, for mounting 1 was measured (see Table 5), with an estimated uncertainty of . When NICI changed ISS ports (from side-looking to up-looking) in late 2009, 70 Oph (catalog ) was not accessible, so we observed the binary HDO 171 B-C (catalog CCDM~J22398) (CCDM J22398-1942 B, WDS 22398-1942) instead. 70 Oph (catalog ) was observed again for mounting 3 in 2010 March. At this time we had not developed the distortion-correction algorithm, so these data were reduced and set with no distortion correction.
Follow-up checks and corrections of these early binary star calibrations are described in §4.2.4.
4.2.2 Trapezium Cluster
At the start of mounting 4 in 2010 October, we observed the Trapezium Cluster in Orion as an astrometric field. We used the HST-derived coordinates from Ricci et al. (2008), applied the grid mask distortion correction procedure described in §4.1, and fitted the measured position centroids to the celestial coordinates as described for the LMC field in §4.2.3. Although the technique appeared to be superior to the binary star calibrations, the fitting errors were unacceptably large: pixels rms, considerably larger than what we eventually achieved for the LMC field using the same observing and reduction techniques. The large errors may be caused by systematic errors in the HST optical astrometry or the underlying Two Micron All Sky Survey (2MASS) catalog (Cutri et al. 2003) absolute astrometry against which the HST data were registered. The magnitude of these errors led us to develop the LMC-based calibration described in the next section.
Note that during this period in 2010 October-December, while new software was being developed to apply the distortion correction, measure the alignment, and compute changes, a number of errors were made computing the direction of the corrections and the WCS parameters in the headers, as indicated in Table 5. Methods for correcting these errors are described in §4.3.
4.2.3 LMC Astrometric Field
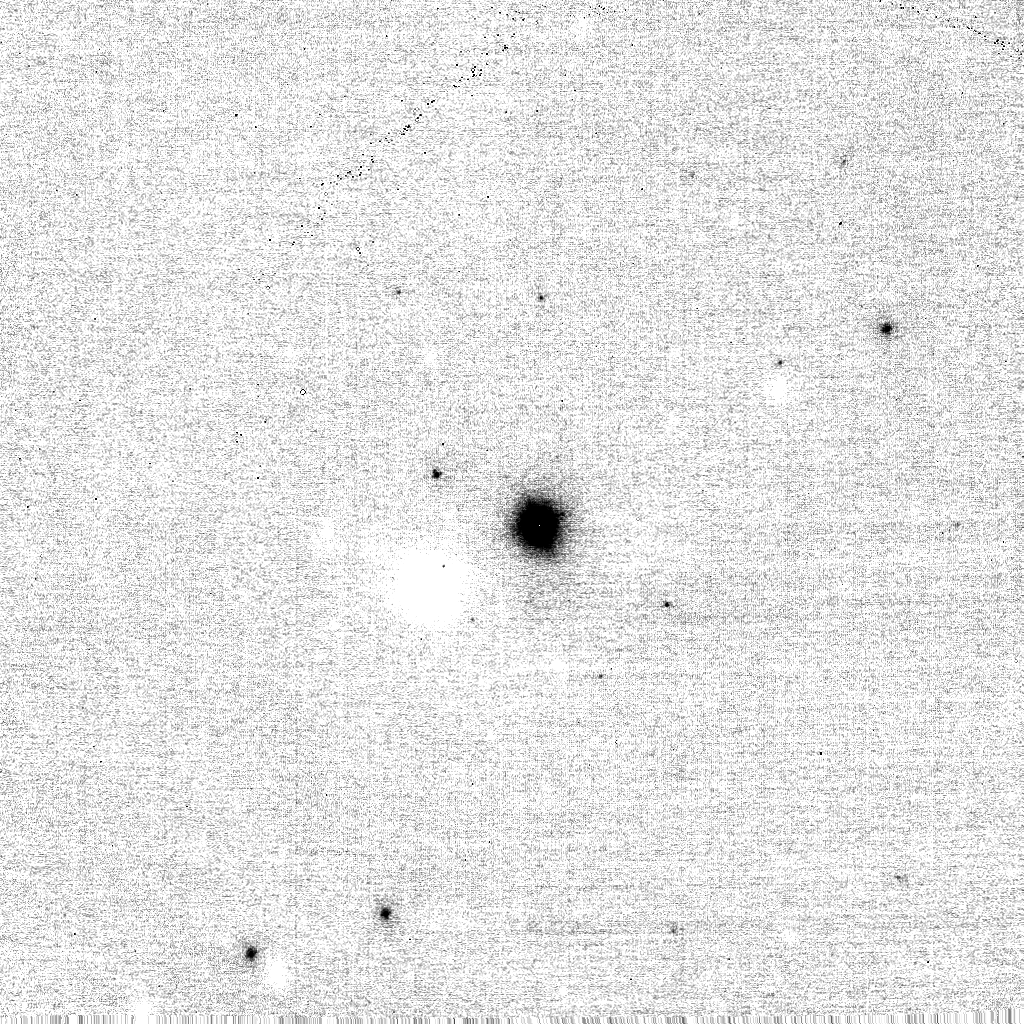
In 2010 November we began to observe a field in the Large Magellanic Cloud (LMC) that was the subject of a detailed HST-based astrometric calibration in support of JWST (Diaz-Miller 2007). For JWST, the field was chosen to be relatively free of bright stars, but fortunately it contains three mag stars bright enough to serve as natural guide stars for NICI’s AO system. The data file containing high-precision coordinates was supplied to us by J. Anderson private communication.
The subfield with the brightest guide star, named “f606w_11.341” in the STScI documentation but which we refer to as “LMC-11mag,” contains 12 stars with which can be detected by NICI in about 5 minutes observing time. For consistency, the field was observed in Cass Rotator Follow mode at = 0, always with the Clear focal-plane mask (no coronagraph), the H-50/50 beamsplitter, and the CH4-H4%L and S filters. Image pairs taken with a 4′′ dither were subtracted to cancel the background emission (Fig. 3), then the standard distortion correction was applied and the stars’ centroid positions in the Red channel measured.
The centroid position probable errors were estimated by synthesizing images with Gaussian PSF’s over a range of S/N combined with backgrounds with random variations. After the centroid for a given S/N PSF was measured for each of the random backgrounds, the standard deviation could be computed directly, and a lookup table of S/N vs. constructed. The probable error of each star in the real image was then estimated by measuring its S/N and finding the corresponding in the lookup table.
The centroid positions were fitted with a minimization technique similar to the grid mask fitting described by Eqn.1 to determine the pixel scale and the correction, using the probable errors estimated for each star.
Table 6 displays the results of an LMC-11mag astrometric fit taken for mounting 10 on 2012 December 22 UTC. The mag guide star consistently shows a large 5 - 6 pixel error in all images, so it is not included in the fit. (The exact reason for the error is unknown; the star is certainly a foreground star, but the error appears to be too large to be explained by proper motion, and no proper motion was detected between the different NICI astrometric images over a period of 3 years.) As with the pinhole-grid images, the value of per degree of freedom indicates that the errors are dominated by systematic effects. In addition to the distortion correction errors described in §4.1.1, additional sources of error on a star field are errors in the provided celestial coordinates, proper motions, atmospheric refraction, and anisoplanicity effects which cause stars far from the center of the field to become elongated.
The residual error between the expected and measured positions of all the LMC field stars is 0.68 pixels rms, with no errors pixel, better than our goal of pixel across half the field. This 2012 December dataset was taken in good seeing and is one of our best results, but in all our calibrations the residual errors are pixels across the field, or % in scale and 0046 in rotation. This corresponds to a center-to-edge accuracy of pixels or 7 mas, better than our 20 mas requirement. The errors are similar for both up-looking and side-looking port mountings, even with the extra reflection on the side port.
After 2010 the LMC-11mag field became the primary NICI astrometric reference, observed regularly after most instrument mountings and port changes and periodically during observing semesters. We find that varies by a few tenths degree between mountings, but periodic checks within a mounting are consistent to , exceeding our calibration requirements. We calibrated a secondary field, HIP 62403 (catalog ), relative to LMC-11mag for use during the southern winter months when the LMC is inaccessible; our derived astrometric data for this field are listed in Table 7.
The LMC fits also yield the image pixel scale which, unlike , should not vary between mountings. Over 12 separate LMC measurements, we find a Red channel scale of 17.9580.022 mas/pixel. The relative probable error is 0.12%, or about 1 pixel across the detector, again within our requirements.
4.2.4 Checks and Corrections of Early Calibrations
After developing the distortion correction and LMC-based calibration in late 2010, we checked the earlier binary star calibrations in two ways. First, the binary star centroids were remeasured after applying the grid mask distortion correction. We found that the mounting 1 and 2 calibrations were unaffected by the distortion correction to a level of , because both binary components were placed within the low-distortion central region. For mounting 3, however, 70 Oph B was placed in the lower left corner of the field and suffered a distortion of pixels, causing a rotation error of .
As a second check method, we utilized several Campaign target fields with multiple background stars that had been observed both with binary star and later LMC-based astrometric calibration. The results are summarized in Table 8. This method verified the accuracy of the mounting 1 and 2 calibrations and the error with mounting 3. Two good comparison fields for mounting 3 indicated an error of and a true = 112.2, which we judge to be more reliable than the 70 Oph derived value due to saturation of 70 Oph B and its position in the corner of the field. A detailed procedure for correcting the error is presented in §4.3; these corrections were applied to the Campaign data reductions, but not to the raw data stored in the Gemini Science Archive.
These checks revealed one range of dates, 2009 April 26-27 UTC, for which the field rotation is in error by , an unusually large amount. Proxima Cen (catalog ) and HD 196544 (catalog ) data taken on these dates both exhibit the anomaly. We suspect that an error in the Cass Rotator position or datum sometime between April 8 and 26 caused this error. After April 27, NICI operations were suspended for the winter, so we do not have futher data until 2009 August, by which time the Cass Rotator position is correct.
4.3 WCS
The WCS in each NICI MEF extension specifies the mapping between sky and detector for that channel, including the field rotation, pixel scale, and reflection between sky and detector. It has limitations, however, in that it describes the absolute astrometric position only to low accuracy and does not represent the image distortion. In addition, during NICI’s operations there were many instances when was set incorrectly and therefore the WCS does not represent the true astrometry. Therefore, in this section we will review how the WCS is constructed, its limitations and errors, and how the errors can be corrected.
The Gemini algorithm that builds the WCS for each MEF file begins with a mapping file that contains a series of positions in detector coordinates along with their corresponding on-sky angular offsets from the field center in the telescope coordinate system. The algorithm fits a transformation to these points, then applies the current telescope pointing and Cassegrain rotator angles to compute the on-sky WCS. The original intent was to populate the mapping file with points measured by offsetting a star to different positions on the detector and recording both the detector and celestial positions. For NICI’s very narrow field of view and small pixels, however, this technique is insufficiently precise. (It relies on the mapping accuracy of the Peripheral Wavefront Sensor probe arm, which could contain errors of several tenths of an arcsec.) Therefore, we developed a simple script to generate synthetic mapping files based on the pixel scale and rotation angle determined from the calibrations. This technique produces a WCS limited only by the quality of the astrometric field measurements as described in preceeding sections.
The Red channel mapping file is generated directly from the measured Red channel scale and . The Blue channel file is generated using the more precise scale and rotation angle relative to the Red channel determined from the grid mask images. For the LMC calibrations after 2010 November, the Blue WCS rotation angle is set from the Red angle, and the scale is 1/0.9980 = 1.0020 the Red scale (with the scale, in mas/pixel, being inversely proportional to the magnification).
Gemini’s WCS standard does not include distortion parameters such as the SIP system, which defines FITS header distortion coefficients to supplement the WCS (Shupe et al. 2005). Therefore, for NICI files after 2010 November, the WCS represents the coordinate system after the standard distortion correction (for H-50/50 + CH4-H4%) described in §4.1 has been applied.
In addition, note that the WCS represents the orientation at the beginning of the exposure. If the CR mode is Follow, then this orientation is correct throughout the exposure. However, if the CR mode is Fixed, as is the case for ADI observations, a rotation must be applied to correct the change in field angle between the start and mid-point of the exposure.
4.3.1 WCS Corrections
As we previously described in §4.2.1 and 4.2.2, the and pixel scale values measured during several calibrations contain errors. These errors are also manifested in the WCS. Known issues are:
-
1.
The WCS values for each mounting are based on the pixel scale derived from a particular calibration dataset. For highest accuracy and consistency, we recommend using the mean LMC-based scales of 17.958 mas/pixel for the Red channel and 17.994 for Blue for all epochs.
-
2.
The values of and WCS may be incorrect for data taken immediately after each mounting, until astrometric calibrations could be taken and analyzed. The affected dates are listed in Table 5. Mounting 4 is the most severe example: data from 2010 October and November contain several errors due to problems with the distortion-correction and astrometric fitting software used at that time for the Trapezium and LMC fields.
-
3.
Before 2010-12-14, the rotation of the Blue WCS relative to the Red did not use the correct value of .
-
4.
For mounting 3 from 2010 March to October, the value of 111.70 was too low by .
-
5.
Data taken on 2009 April 26-27 have a rotation error of , apparently caused by a short-term error in the Cass Rotator. (See last paragraph of §4.2.4
The WCS rotation correction for the Red channel is listed in Table 5. In addition, we have developed an IDL script that automatically corrects a MEF file’s WCS according to the date of observation (see Appendix). Note that the script does not modify the image data; only the WCS is updated to represent the true astrometry of the data. The updated file with the corrected WCS can then be pipeline-processed as usual.
5 Campaign Astrometry Statistics
Several dozen of the Campaign’s target fields contained candidate companions which required follow-up checks for common proper motion and parallax. The vast majority of these candidates were determined to be background stars. We can use these multi-epoch observations to evaluate the consistency of the astrometric calibration over the course of the Campaign.
Our technique is simply to compare the relative positions of the primary target and background stars at the available epochs, after correcting the primary’s relative parallax and proper motion to the first epoch. Differences in the corrected positions between epochs indicate errors in the position measurements themselves, the proper motion correction, the astrometric calibrations, or a combination of all three effects. Some dense fields contained multiple background stars, permitting more detailed checks independent of the proper motion correction, but because many fields just contained the primary and one background star we will discuss only the primary-to-background position differences here.
Figure 4 shows the offset distributions for a total of 218 pairs of observations of 205 background stars in 113 fields. The offsets are indicated parallel and perpendicular to the radius vector from the primary to the background star, which is appropriate given the large derotations applied to the ADI frames before stacking and helps to identify systematic errors in scale and rotation.
The left panel of Figure 4 shows the separation and perpendicular offsets vs. itself. The distribution of the offsets shows a possible increase with radius, suggesting scale errors on the order of 0.1%. The offsets, however, maintain a consistent width from small to large , indicating that the primary source of error is in the individual position measurements of the stars. In other words, if the dominant source of errors were in the rotation calibration, the distribution would be expected to increase proportional to , which is not observed.
The right panel shows the distribution histograms in the same pixel units. The distributions have a central core with pixels in and 1.20 in ; values that are only slightly larger than the rms errors of the distortion correction and the LMC field astrometric fits. Above 3.5 pixels total offset lie 9 outlier points, all of which have . The large errors in these cases are caused by inaccurate distortion correction near the edges of the field and very different positions of the stars on the detector between the two epochs – due to either different field angles, or to the two observations being taken on different telescope ports with an odd and even number of reflections, which reversed the image and caused the same object to appear on opposite sides of the detector.
That the primary source of the offset errors appears to be due to individual position errors does not have an obvious explanation. Because the PSF core FWHM is usually 3-4 pixels, centroid measurement errors as large as 3 pixels would typically be several . It should be noted that the astrometry is measured from final images which are coadded from many derotated ADI frames, which tends to broaden the individual stars. Possible causes of systematic error are small-scale irregularities in the distortion correction, shifts in the position of the primary star which is dimmed by more than 6 magnitudes by the partially transparent occulting mask, or other irregularities in the mask.
6 Conclusions
We have developed an astrometric calibration for the NICI Planet-Finding Campaign based on a grid mask distortion correction and an LMC astrometric field. The accuracy achieved by the calibration is % in scale and in rotation, corresponding to mas center-to-edge. The calibration for each channel is represented by the MEF header WCS. Before 2010 November the calibrations and WCS contain known errors; we provide tables and an IDL routine to correct archival NICI data to the final calibration.
Appendix A NICI MEF Format
The two NICI science channels are Red (transmitted light through DW) and Blue (reflected by DW). The Red and Blue channels are also referred to as “Holmes” and “Watson,” respectively.
The MEF files contain a primary header unit (PHU) followed by two extensions:
-
1.
Primary Header
-
2.
Extension 1: Red (holmes) channel header and data
-
3.
Extension 2: Blue (watson) channel header and data
Selected astrometry-related keywords in an example NICI MEF Header.
# PRIMARY HEADER UNIT
OBJECT  = ’f606w_11.341’       / Object Name
FRAME   = ’FK5     ’           / Target coordinate system
EQUINOX =                2000. / Equinox of coordinate system
EPOCH   =                2000. / Target Coordinate Epoch
RA      =          80.48629583 / Target Right Ascension
DEC     =         -69.44843889 / Target Declination
HA      = ’-00:52:22.05’       / Telescope hour angle
PA      =                   0. / Sky Position Angle at start of exposure (IPA)
INPORT  =                    1 / Number of ISS port where instrument is located
CRPA    =    -49.5685362028393 / Current Cass Rotator Position Angle
CRMODE  = ’FOLLOW  ’           / Cass Rotator Mode
IAA     =                247.5 / Instrument Alignment Angle
FOCS    = ’Open    ’           / Fiber Optic Calib. Src.
FPMW    = ’Clear_G5710’        / NICI Focal Plane Mask Wheel
DICHROIC= ’H-50/50_G5701’      / NICI Dichroic Wheel

# EXTENSION 1 HEADER
CHANNEL = ’RED     ’           / NICI Science Camera Channel
FILTER_R= ’CH4-H4\%L_G0740’    / NICI Red Filter Wheel
RADECSYS= ’FK5     ’           / R.A./DEC. coordinate system reference
CTYPE1  = ’RA---TAN’           / R.A. in tangent plane projection
CTYPE2  = ’DEC--TAN’           / DEC. in tangent plane projection
CRVAL1  =           80.4883844 / RA at Ref pix in decimal degrees
CRVAL2  =          -69.4482734 / DEC at Ref pix in decimal degrees
CRPIX1  =           413.999522 / Ref pix of axis 1
CRPIX2  =           594.997314 / Ref pix of axis 2
CD1\_1  =       5.01646534E-06 / WCS matrix element 1 1
CD1\_2  =       8.26096075E-11 / WCS matrix element 1 2
CD2\_1  =      -3.29874171E-10 / WCS matrix element 2 1
CD2\_2  =      -5.01703714E-06 / WCS matrix element 2 2

# EXTENSION 2 HEADER
CHANNEL = ’BLUE    ’           / NICI Science Camera Channel
FILTER_B= ’CH4-H4\%S_G0743’    / NICI Blue Filter Wheel
RADECSYS= ’FK5     ’           / R.A./DEC. coordinate system reference
CTYPE1  = ’RA---TAN’           / R.A. in tangent plane projection
CTYPE2  = ’DEC--TAN’           / DEC. in tangent plane projection
CRVAL1  =           80.4883844 / RA at Ref pix in decimal degrees
CRVAL2  =          -69.4482734 / DEC at Ref pix in decimal degrees
CRPIX1  =           570.000515 / Ref pix of axis 1
CRPIX2  =           650.997321 / Ref pix of axis 2
CD1\_1  =       -5.0159887E-06 / WCS matrix element 1 1
CD1\_2  =      -6.99793144E-08 / WCS matrix element 1 2
CD2\_1  =       7.03997325E-08 / WCS matrix element 2 1
CD2\_2  =      -5.01655469E-06 / WCS matrix element 2 2
Appendix B WCS Corrections
An IDL routine NICI_FIXWCS is available at http://www.gemini.edu/sciops/instruments/nici/data-format-and-reduction to correct known errors in the NICI WCS. It automatically applies corrections stored in lookup tables according to the observation date, using the following algorithm:
-
1.
Extract the ISS Port (INPORT) and (IAA) from the Primary Header Unit and the Red WCS from extension 1.
-
2.
Compute the WCS rotation angle .
-
3.
Determine from a lookup table according to the observation date.
-
4.
Compute .
-
5.
Compute the new Red WCS angle .
-
6.
Compute the new Blue WCS angle .
-
7.
Compute the new Red and Blue WCS’s with a left-handed coordinate system using the mean pixel scales and new rotation angles.
-
8.
Reflect the Red WCS left-right for the side-looking port or the Blue WCS left-right for the up-looking port.
-
9.
Write the new WCS’s into the MEF extension headers.
These WCS computations can also be performed with standard WCS processing routines such as the IDL Astronomy Library astrometry routines GETROT and HROTATE. Table 9 lists the date-specific values used by NICI_FIXWCS.
A typical data-reduction strategy is outlined below. Additional details, up-to-date information, and the distortion correction files are available at http://www.gemini.edu/sciops/instruments/nici/data-format-and-reduction.
-
1.
Apply recommended corrections to the Red and Blue channel WCS’s.
-
2.
Apply the standard distortion corrections to the Red and Blue data.
-
3.
For CassRot Fixed data, apply a rotation to the WCS to correct it to the mid-point of the exposure. The amount of correction is proportional to the rate of change of the parallactic angle during the exposure, which may vary significantly as targets rise, transit, and set. At this point the WCS should accurately represent the astrometric properties of the data.
-
4.
Reflect both channels up-down so that pixel (1,1) appears in the lower-left corner of standard image display tools, using a routines such the IDL Astronomy Library’s HROTATE that also reflects the WCS.
-
5.
Depending on the ISS port, reflect either the Red or Blue channel left-right to produce a left-handed coordinate system.
-
6.
Apply further processing (ADI pipeline, derotation, etc.) using the WCS to correct the rotation and scale of individual exposures.
References
- Biller et al. (2010) Biller, B. A., Liu, M. C., Wahhaj, Z., et al. 2010, ApJ, 720, L82
- Biller et al. (2013) —. 2013, ApJ, 777, 160
- Chun et al. (2008) Chun, M., Toomey, D., Wahhaj, Z., et al. 2008, in Proc. SPIE, Vol. 7015, Adaptive Optics Systems, ed. B. Ellerbroeck et al.
- Cutri et al. (2003) Cutri, R. M., Skrutskie, M. F., van Dyk, S., et al. 2003, 2MASS All Sky Catalog of point sources.
- Diaz-Miller (2007) Diaz-Miller, R. I. 2007, in Astronomical Society of the Pacific Conference Series, Vol. 364, The Future of Photometric, Spectrophotometric and Polarimetric Standardization, ed. C. Sterken, 81
- Eggenberger et al. (2008) Eggenberger, P., Miglio, A., Carrier, F., Fernandes, J., & Santos, N. C. 2008, A&A, 482, 631
- Greisen & Calabretta (2002) Greisen, E. W., & Calabretta, M. R. 2002, A&A, 395, 1061
- Libralato et al. (2014) Libralato, M., Bellini, A., Bedin, L. R., et al. 2014, A&A, 563, A80
- Liu (2004) Liu, M. C. 2004, Science, 305, 1442
- Liu et al. (2010) Liu, M. C., Wahhaj, Z., Biller, B. A., et al. 2010, in Proc. SPIE, Vol. 7736, Adaptive Optics Systems II, ed. N. Hubin et al.
- Marois et al. (2006) Marois, C., Lafrenière, D., Doyon, R., Macintosh, B., & Nadeau, D. 2006, ApJ, 641, 556
- Nelder & Mead (1965) Nelder, J. A., & Mead, R. 1965, The Computer Journal, 7, 308
- Nielsen et al. (2012) Nielsen, E. L., Liu, M. C., Wahhaj, Z., et al. 2012, ApJ, 750, 53
- Nielsen et al. (2013) —. 2013, ApJ, 776, 4
- Pence et al. (2010) Pence, W. D., Chiappetti, L., Page, C. G., Shaw, R. A., & Stobie, E. 2010, A&A, 524, A42
- Pourbaix (2000) Pourbaix, D. 2000, A&AS, 145, 215
- Press et al. (1992) Press, W. H., Teukolsky, S. A., Vetterling, W. T., & Flannery, B. P. 1992, Numerical recipes in C (2nd ed.): the art of scientific computing (New York, NY, USA: Cambridge University Press)
- Ricci et al. (2008) Ricci, L., Robberto, M., & Soderblom, D. R. 2008, AJ, 136, 2136
- Shupe et al. (2005) Shupe, D. L., Moshir, M., Li, J., et al. 2005, in Astronomical Society of the Pacific Conference Series, Vol. 347, Astronomical Data Analysis Software and Systems XIV, ed. P. Shopbell, M. Britton, & R. Ebert, 491
- Wahhaj et al. (2011) Wahhaj, Z., Liu, M. C., Biller, B. A., et al. 2011, ApJ, 729, 139
- Wahhaj et al. (2013a) —. 2013a, ApJ, 779, 80
- Wahhaj et al. (2013b) Wahhaj, Z., Liu, M. C., Nielsen, E. L., et al. 2013b, ApJ, 773, 179
- Wells et al. (1981) Wells, D. C., Greisen, E. W., & Harten, R. H. 1981, A&AS, 44, 363
| Red Channel | Blue Channel | ||||||||||
|---|---|---|---|---|---|---|---|---|---|---|---|
| DW | Filter | rms Err | Filter | rms Err | B/R Mag | R-B Rot | |||||
| (pixels) | (∘) | (pixels) | (pixels) | (∘) | (pixels) | (∘) | |||||
| H-50/50 (max)aaThe terms “max” and “min” indicate extremes in the range of the Blue channel spot positions due to the non-repeatable DW detent for H-50/50, as explained in the text. | 4%L | 29.574 | 22.313 | 0.54 | 4%S | 29.514 | -21.210 | 0.53 | 0.9980 | -1.103 | |
| H-50/50 (min) | 4%L | 29.574 | 22.311 | 0.54 | 4%S | 29.507 | -21.148 | 0.53 | 0.9977 | -1.163 | |
| Mirror | – | – | – | – | 4%S | 29.495 | -21.125 | 0.56 | – | – | |
| Open | 4%L | 29.568 | 22.382 | 0.57 | – | – | – | – | – | – | |
| H/K | 4%L | 29.560 | 22.286 | 0.57 | 4%S | 29.487 | -21.213 | 1.01 | 0.9974 | -1.073 | |
| H/K | Ks | 29.562 | 22.293 | 0.57 | H | 29.484 | -21.206 | 0.59 | 0.9974 | -1.087 | |
Note. — Derived from grid mask data taken 2010 Dec 14 (H-50/50, Mirror, Open) and 2011 May 12 (H/K). The filter names 4%L and 4%S refer to the CH4-H4%L and S filters, respectively, and are the separation and rotation of the grid spots for each channel, and rms Err is the rms error of the fit. The last two columns indicate the magnification and rotation of the Blue channel relative to the Red.
| Red Channel | Blue Channel | ||||||
|---|---|---|---|---|---|---|---|
| DW | Filter | Filter | |||||
| H-50/50 (max) | 4%L | 530 | 514 | 4%S | 450 | 566 | |
| H-50/50 (min) | 4%L | 530 | 514 | 4%S | 451 | 542 | |
| Mirror | – | – | – | 4%S | 455 | 580 | |
| Open | 4%L | 529 | 513 | – | – | – | |
| H/K | 4%L | 531 | 508 | 4%S | 465 | 593 | |
| H/K | Ks | 531 | 508 | H | 465 | 593 | |
Note. — The reference spot (same physical pinhole in the grid mask) positions in pixels for the datasets in Table 1. The filter names 4%L and 4%S refer to the CH4-H4%L and S filters, respectively.
| Red Channel | Blue Channel | ||||
|---|---|---|---|---|---|
| DW | Filter | rms Error | Filter | rms Error | |
| (pixels) | (pixels) | ||||
| H-50/50 | 4%L | 0.54 | 4%S | 0.53 | |
| Mirror | – | 4%S | 0.66 | ||
| Open | 4%L | 0.62 | – | – | |
| H/K | 4%L | 0.62 | 4%S | 0.67 | |
| H/K | Ks | 0.68 | H | 0.72 | |
Note. — Residuals after applying the distortion correction derived for the H-50/50, CH4-H4% configuration to itself and four other configurations. The residuals for the other four cases are only slightly greater than the first, indicating that the same distortion correction may be applied to all configurations.
| i = 0 | i = 1 | i = 2 | i = 3 | i = 4 | i = 5 | |
|---|---|---|---|---|---|---|
| Red channel , CH4-H4%L filter | ||||||
| j=0 | 3.30330e+00 | -3.24809e-02 | 1.71647e-04 | -4.15214e-07 | 4.42279e-10 | -1.64635e-13 |
| 1 | 9.56919e-01 | 6.51225e-04 | -4.02601e-06 | 1.04369e-08 | -1.13916e-11 | 4.35036e-15 |
| 2 | 2.56604e-04 | -3.82735e-06 | 2.39133e-08 | -6.28410e-11 | 6.92881e-14 | -2.67375e-17 |
| 3 | -6.51553e-07 | 9.23475e-09 | -5.73017e-11 | 1.50925e-13 | -1.66960e-16 | 6.47106e-20 |
| 4 | 7.14946e-10 | -9.69040e-12 | 5.96375e-14 | -1.56947e-16 | 1.73795e-19 | -6.75174e-23 |
| 5 | -2.79985e-13 | 3.67357e-15 | -2.24523e-17 | 5.89872e-20 | -6.53292e-23 | 2.54179e-26 |
| Red channel , CH4-H4%L filter | ||||||
| j=0 | 1.42582e+01 | 9.41488e-01 | 2.18931e-04 | -5.22009e-07 | 6.23837e-10 | -2.70063e-13 |
| 1 | -5.40761e-02 | 6.07982e-04 | -3.77042e-06 | 9.95836e-09 | -1.15149e-11 | 4.81094e-15 |
| 2 | 0.000191206 | -3.30812e-06 | 2.08871e-08 | -5.49720e-11 | 6.29836e-14 | -2.60687e-17 |
| 3 | -3.77292e-07 | 7.52945e-09 | -4.79591e-11 | 1.26167e-13 | -1.44296e-16 | 5.96523e-20 |
| 4 | 3.80158e-10 | -7.67197e-12 | 4.89736e-14 | -1.28818e-16 | 1.47450e-19 | -6.10716e-23 |
| 5 | -1.42414e-13 | 2.88797e-15 | -1.84127e-17 | 4.84259e-20 | -5.55290e-23 | 2.30676e-26 |
| Blue channel , CH4-H4%S filter | ||||||
| j=0 | -1.49018e+00 | 1.07896e-03 | 1.57155e-05 | -4.13557e-08 | 3.27833e-11 | -8.19736e-15 |
| 1 | 9.93247e-01 | 6.31284e-05 | -4.91790e-07 | 1.18236e-09 | -1.03838e-12 | 2.99391e-16 |
| 2 | 8.41072e-05 | -5.02536e-07 | 3.61158e-09 | -8.97672e-12 | 8.16102e-15 | -2.40618e-18 |
| 3 | -2.42011e-07 | 1.44899e-09 | -1.03877e-11 | 2.65441e-14 | -2.48127e-17 | 7.50551e-21 |
| 4 | 2.74100e-10 | -1.79337e-12 | 1.29831e-14 | -3.36450e-17 | 3.20101e-20 | -9.88390e-24 |
| 5 | -1.10542e-13 | 8.03376e-16 | -5.82388e-18 | 1.51399e-20 | -1.45466e-23 | 4.55593e-27 |
| Blue channel , CH4-H4%S filter | ||||||
| j=0 | 1.17133e+01 | 9.88950e-01 | -5.97344e-05 | 1.98457e-07 | -2.06889e-10 | 7.90131e-14 |
| 1 | -6.68061e-03 | -3.01784e-04 | 1.63966e-06 | -3.76719e-09 | 3.90648e-12 | -1.50652e-15 |
| 2 | -6.09404e-05 | 1.72898e-06 | -9.59428e-09 | 2.21625e-11 | -2.30184e-14 | 8.88496e-18 |
| 3 | 1.92937e-07 | -4.21968e-09 | 2.39915e-11 | -5.58094e-14 | 5.78653e-17 | -2.22094e-20 |
| 4 | -2.04690e-10 | 4.55594e-12 | -2.63308e-14 | 6.15381e-17 | -6.36298e-20 | 2.42601e-23 |
| 5 | 7.95641e-14 | -1.77333e-15 | 1.03499e-17 | -2.42680e-20 | 2.50371e-23 | -9.49402e-27 |
| WCS | ||||||||||
|---|---|---|---|---|---|---|---|---|---|---|
| Mounting | Port | WCS Revision | Target | Scale | ||||||
| # | Date UTC | Date UTC | Red | Blue | Red | Example Dataset | ||||
| (∘) | (mas/pixel) | (∘) | (∘) | |||||||
| 1 | 2008-07-27 | 5 | 10-07 | 70 Oph | 112.30 | 17.900 | 17.900 | – | GS-NICI-COMM1-318 | |
| 2 | 2009-10-24 | 1 | 10-29 | HDO 171 B-C | 247.50 | 18.060 | 18.060 | – | Eng files 20101024 1-11 | |
| 3 | 2010-03-20 | 5 | 05-09 | 70 Oph | 111.70aaHeader value of erroneous due to image distortion. | 17.800 | 17.800 | GS-CAL20100509-2 | ||
| 4 | 2010-10-20 | 5 | 10-28 | Trapezium | 111.32bbTrapezium-based correction applied with wrong sign. | 17.910 | 17.910 | GS-CAL20101031 | ||
| 5 | 11-02 | Trapezium | 112.20ccCorrected , but introduced Red channel WCS Error. | 17.960 | 17.960 | |||||
| 5 | 11-10 | ddCorrected Red channel WCS Error. | ||||||||
| 5 | 11-20 | 1.137 | ||||||||
| 5 | 12-14 | LMC-11mag | 112.61eeFinal LMC-11mag-based Mounting 4 calibration with updated . | 17.932 | 17.970 | 1.1 | eeFinal LMC-11mag-based Mounting 4 calibration with updated . | GS-CAL20101225-2 | ||
| 5 | 2011-01-14 | 1 | 02-16 | LMC-11mag | 247.50 | 17.973 | 18.009 | – | GS-CAL20110117-2 | |
| 6 | 2011-03-11 | 1 | 03-14 | LMC-11mag | 247.50 | 17.973 | 18.009 | – | GS-CAL20110314-2 | |
| 7 | 2011-04-27 | 1 | 05-12 | LMC-11mag | 247.50 | 17.973 | 18.009 | – | GS-CAL20110512-1 | |
| 8 | 2011-06-08 | 5 | 06-24 | HIP 62403 | 112.82 | 17.978 | 18.014 | – | GS-CAL20110626-3 | |
| 9 | 2012-02-15 | 5 | 02-21 | LMC-11mag | 112.64 | 17.950 | 17.986 | – | GS-CAL20120331-1 | |
| 10 | 2012-07-13 | 5 | 08-27 | LMC-11mag | 112.42 | 17.936 | 17.973 | – | GS-CAL20121222-5 | |
| 11 | 2013-05-07 | 5 | 05-12 | HIP 62403 | 112.25 | 17.936 | 17.973 | – | GS-CAL20130512-1 | |
| 12 | 2013-06-19 | 1 | 06-21 | HIP 62403 | 247.50 | 17.936 | 17.973 | – | GS-CAL20130621-1 | |
Note. — Columns are:
#: Number of NICI Mounting on the telescope, requiring a new measurement.
Port: ISS port; 5 = side-looking, 1 = up-looking.
WCS Revision Date: Date of and WCS verification or revision for the Mounting.
Target: Star or Field observed for astrometric measurements.
: Originally derived value. Values found to be erroneous upon later checks indicated in boldface; see §4.2.4.
Scale: Red and Blue scales used to construct the header WCS.
: Rotation between Red and Blue header WCS’s; the true rotation is always .
: Angle by which to rotate Red WCS to correct calibration error; see Appendix B.
Example Dataset: A representative astrometric data set taken after the final WCS update.
| Coordinates | Meas’d from Image | Transformed | ||||||||||||||
|---|---|---|---|---|---|---|---|---|---|---|---|---|---|---|---|---|
| # | Name | (J2000.0) | (J2000.0) | S/N | ||||||||||||
| 0 | 46787aa mag AO guide star, not included in fit due to large . | 80.486295 | -69.448440 | 538.2 | 495.8 | 3500 | 0.01 | 535.7 | 499.7 | 4.58 | 535.7 | 499.7 | 4.58 | |||
| 1 | 46775 | 80.490369 | -69.450562 | 251.4 | 70.4 | 71 | 0.09 | 251.3 | 70.5 | 0.19 | 251.2 | 70.6 | 0.28 | |||
| 2 | 46767 | 80.488462 | -69.450358 | 385.7 | 111.3 | 86 | 0.08 | 385.7 | 110.3 | 0.99 | 385.6 | 110.3 | 0.96 | |||
| 3 | 3014 | 80.488284 | -69.447263 | 398.2 | 731.8 | 15 | 0.28 | 397.8 | 732.7 | 0.95 | 397.8 | 732.7 | 0.95 | |||
| 4 | 46799 | 80.487740 | -69.448175 | 436.5 | 549.0 | 82 | 0.08 | 436.7 | 549.6 | 0.67 | 436.7 | 549.6 | 0.69 | |||
| 5 | 3421 | 80.487645 | -69.448639 | 443.1 | 457.7 | 14 | 0.29 | 443.5 | 457.5 | 0.43 | 443.5 | 457.5 | 0.42 | |||
| 6 | 2771 | 80.486258 | -69.447291 | 540.8 | 726.2 | 23 | 0.20 | 541.4 | 726.3 | 0.64 | 541.4 | 726.3 | 0.68 | |||
| 7 | 46768 | 80.484459 | -69.448820 | 667.4 | 419.7 | 34 | 0.16 | 667.0 | 418.9 | 0.84 | 667.0 | 418.9 | 0.87 | |||
| 8 | 3694 | 80.484371 | -69.450446 | 673.6 | 93.6 | 14 | 0.29 | 674.2 | 94.4 | 0.99 | 674.1 | 94.4 | 0.92 | |||
| 9 | 2518 | 80.482859 | -69.447614 | 780.0 | 661.4 | 19 | 0.23 | 779.7 | 661.1 | 0.47 | 779.7 | 661.1 | 0.48 | |||
| 10 | 2053 | 80.481952 | -69.446614 | 843.9 | 862.3 | 12 | 0.32 | 843.5 | 862.1 | 0.44 | 843.6 | 862.0 | 0.42 | |||
| 11 | 46772 | 80.481336 | -69.447447 | 887.2 | 694.9 | 88 | 0.08 | 886.9 | 695.1 | 0.36 | 886.9 | 695.0 | 0.30 | |||
| , | rms = | 0.69 | 0.68 | |||||||||||||
Note. — Example astrometric data for Mounting 10, side-looking Port, for the Red channel with the H-50/50 beamsplitter and CH4-H4%L filter. For each star, the , coordinates from HST are indicated in degrees; and are the corresponding pixel coordinates after applying the nominal WCS transformation: scale = 17.95 mas/pixel, rotation = 0; and are the measured image coordinates; and and are the transformed image coordinates after fitting, with scale 17.9553 mas/pixel and rotation . The two columns indicate the distance between that position and the initial HST-derived position. This image was taken to verify an already-calibrated WCS, therefore the two sets of values and the rms in the last row are nearly identical.
| Coordinates | Red Channel | |||
|---|---|---|---|---|
| No. | ||||
| 62403 | 191.8289838 | -66.2374484 | 507.5 | 487.5 |
| 1 | 191.8346683 | -66.2355670 | 49.0 | 864.0 |
| 2 | 191.8333292 | -66.2348526 | 157.0 | 1007.0 |
| 3 | 191.8305338 | -66.2394045 | 382.5 | 96.0 |
| 4 | 191.8283639 | -66.2360693 | 557.5 | 763.5 |
| 5 | 191.8277686 | -66.2394120 | 605.5 | 94.5 |
| 6 | 191.8250159 | -66.2385176 | 827.5 | 273.5 |
| 7 | 191.8247250 | -66.2357544 | 851.0 | 826.5 |
| 8 | 191.8245947 | -66.2363066 | 861.5 | 716.0 |
Note. — Derived coordinates for the HIP 62403 field. The celestial coordinates are in degrees for equinox J2000, epoch 2011.37. HIP 62403 computed for 2011.37 from J2000.0 coordinates plus the parallax and proper motion; other stars from their position relative to 62403 using the LMC-11mag WCS. The estimated mean error is degrees, dominated by the distortion correction. The Red channel (,) represent the image coordinates in pixels after correcting distortion.
| Early Dataset | Reference Dataset | |||||||||||||||||
|---|---|---|---|---|---|---|---|---|---|---|---|---|---|---|---|---|---|---|
| Target | # Bgd | Date UTC | Chan | DW | Filter | Date UTC | Chan | DW | Filter | Mounting | Port | Calib. | rms Error | Note | ||||
| Stars | (∘) | (∘) | Field | (∘) | (pixels) | |||||||||||||
| Mounting 1, 2008 Jul 27, Port 5 (Side-looking), Calibrator = 70 Oph | ||||||||||||||||||
| HD 61005 | 2 | 2009-01-13 | B | 50/50 | 4%S | 112.30 | 2011-04-25 | B | Mir | H | 6 | 1 | 247.50 | LMC | 0.215 | 0.23 | ||
| RXJ 1224.8 | 2 | 2009-02-06 | R | 50/50 | 4%L | 112.30 | 2012-04-06 | R | H/K | Ks | 9 | 5 | 112.64 | LMC | 0.040 | 0.92 | ||
| Gamma Oph | 7 | 2009-04-08 | B | Mir | H | 112.30 | 2010-04-08 | B | Mir | H | 3 | 5 | 112.20 | 0.150 | 1.54 | aa2010 WCS corrected from = 112.15 to 112.20. | ||
| Prox Cen | 8 | 2009-04-26 | R | 50/50 | 4%L | 112.30 | 2009-04-08 | R | 50/50 | 4%L | 1 | 5 | 112.30 | 70 Oph | 0.478 | 0.39 | bb2009-04-26 anomalous by 0478; see §4.2.4 | |
| HD 196544 | 2 | 2009-04-26 | R | 50/50 | 4%L | 112.30 | 2011-04-25 | B | Mir | H | 6 | 1 | 247.50 | LMC | 0.700 | ccDerived from HD star and 1 background star. | ||
| HD 196544 | 2 | 2009-04-27 | R | 50/50 | 4%L | 112.30 | 2011-04-25 | B | Mir | H | 6 | 1 | 247.50 | LMC | 0.400 | |||
| Mounting 2, 2009 Oct 24, Port 1 (Up-looking), Calibrator = HDO 171 B-C | ||||||||||||||||||
| HIP 41373 | 2010-01-10 | B | 50/50 | 4%S | 247.50 | 2011-02-05 | B | Mir | H | 5 | 1 | 247.50 | LMC | 0.274 | 0.93 | |||
| HIP 62403 | 4 | 2010-02-28 | R | 50/50 | 4%L | 247.50 | 2011-04-15 | R | 50/50 | 4%L | 6 | 1 | 247.50 | LMC | 0.077 | 2.04 | ddLMC field also taken 2011-04-15, confirmed to -002. | |
| Mounting 3, 2010 Mar 20, Port 5 (Side-looking), Calibrator = 70 Oph | ||||||||||||||||||
| 70 Oph | 2010-04-07 | R&B | 50/50 | 4%L,S | ||||||||||||||
| HD 168443 | 6 | 2010-04-08 | B | 50/50 | 4%L | 112.15 | 2012-04-06 | R | 50/50 | 4%L | 9 | 5 | 112.64 | LMC | 0.046 | eeDataset = 112.15 is nearly correct. | ||
| 70 Oph | 2010-04-09 | R&B | 50/50 | 4%L,S | 112.15 | ffDerived = 111.7 without distortion correction, 112.4 with correction. | ||||||||||||
| 70 Oph | 2010-05-09 | R&B | 50/50 | 4%L,S | 111.70 | ggDataset confirms 112.4 with distortion correction. | ||||||||||||
| HIP 59315 | 2 | 2010-05-09 | R | 50/50 | 4%L | 111.70 | 2011-05-12 | R | H/K | Ks | 7 | 1 | 247.50 | LMC | -0.604 | hh = 111.70 is erroneous. | ||
| 112.20 | 0.02 | 0.92 | iiChanging to 112.2 corrects error. | |||||||||||||||
Note. — The table compares Early binary-star based astrometric calibrations to later more reliable Reference calibrations for several fields observed over multiple epochs. For each field, the parameters of both the Early and Reference datasets are listed, followed by = the residual rotation angle between the two images after derotating according to the nominal WCS, and the rms difference between the star positions in the two datasets. Abbreviations are: R: Red channel; B: Blue channel; 50/50: H-50/50 beamsplitter; Mir: Mirror; 4%L, 4%S: CH4-H4%L, S filters.
| Mounting | |||
|---|---|---|---|
| # | Date UTC | Port | |
| (∘) | |||
| 1 | 2008-07-27 | 5 | 112.30 |
| 2 | 2009-10-24 | 1 | 247.50 |
| 3 | 2010-03-20 | 5 | 112.20 |
| 4 | 2010-10-20 | 5 | 112.61 |
| 5 | 2011-01-14 | 1 | 247.50 |
| 6 | 2011-03-11 | 1 | 247.50 |
| 7 | 2011-04-27 | 1 | 247.50 |
| 8 | 2011-06-08 | 5 | 112.82 |
| 9 | 2012-02-15 | 5 | 112.64 |
| 10 | 2012-07-13 | 5 | 112.42 |
| 11 | 2013-05-07 | 5 | 112.25 |
| 12 | 2013-06-19 | 1 | 247.50 |
Note. — values used by the NICI_FIXWCS routine. Pixel Scales used are: Red = 17.958, Blue = 17.994 mas/pixel.