Universidad Complutense de Madrid, 28040 Madrid, Spain
Young Stellar Object candidates toward
the Orion region selected from GALEX
We analyze 359 ultraviolet tiles from the All Sky Imaging Survey of the space mission GALEX covering roughly 400 square degrees toward the Orion star-forming region. There is a total of 1,555,174 ultraviolet sources that were cross-matched with others catalogs (2MASS, UCAC4, SDSS, DENIS, CMC15 and WISE) to produce a list of 290,717 reliable sources with a wide range of photometric information. Using different color selection criteria we identify 111 Young Stellar Object candidates showing both ultraviolet and infrared excesses, of which 81 are new identifications. We discuss the spatial distribution, the spectral energy distributions and other physical properties of these stars. Their properties are, in general, compatible with those expected for T Tauri stars. This population of TTS candidates is widely dispersed around the Orion molecular cloud.
Key Words.:
stars: low-mass – stars: pre-main-sequence – stars: variables: T Tauri, Herbig Ae/Be – ultraviolet: stars1 Introduction
The current paradigm for low-mass star formation categorizes Young Stellar Objects (YSO) into four general classes: Class 0 sources are faint central protostars surrounded by a massive envelope, Class I sources are more evolved protostars with both circumstellar disks and envelopes, Class II sources (which include the Classical T Tauri stars) correspond to pre-main sequence stars with significant levels of circumstellar material in an accretion disk configuration, and Class III (or Weak-lined T Tauri stars) refers to pre-main sequence stars that have very low or even no accretion (see, for example, the reviews by Shu et al., 1987; Bertout, 1989; McKee & Ostriker, 2007). Deriving and comparing the physical properties among these different evolutive phases is necessary for a full understanding of disk evolution and both planet and star formation. T Tauri stars (TTSs) are particularly interesting because of the great variety of physical processes occurring in them. The central star and its circumstellar disk interact via the magnetic field so the gas is channeled through the magnetic field lines and accelerated forming an accretion shock on the stellar surface. The magnetic interaction between star and disk is complex, simultaneously producing accretion flows, collimated outflows and winds (see reviews in Bouvier et al., 2007; Gómez de Castro, 2013).
From the observational point of view, the distinction between Classical and Weak-lined TTSs is based on the presence and strength of H emission and Lithium absorption lines (Basri et al., 1991; Martin, 1997; Barrado y Navascués & Martín, 2003). Strong emission in the Balmer lines and also in other non-hydrogen elements is considered to be an indicator of youth because these lines are mainly formed due to the accretion process and magnetic stellar activity (Edwards et al., 1994; Muzerolle et al., 1998). As spectroscopic observations are time consuming and sometimes are restricted to bright objects, a good strategy is to perform spectroscopic follow-ups only for the most reliable YSO candidates selected using photometric methods. With the public release of all-sky photometric surveys at different wavelengths, the need of efficient and reliable techniques to identify and improve the “automatic” photometric classification of YSOs has led to an increasing amount of work in this field. The shapes of the spectral energy distributions (SEDs) of young stars may, in principle, be used for separating YSOs from main sequence stars. The circumstellar gas and dust (disk and/or envelope) produces an excess of infrared (IR) emission that can be used as a diagnostic tool (e.g. Allen et al., 2004; Hartmann et al., 2005). IR color-color diagrams have been widely used to distinguish between different types of YSOs in different star-forming regions (see Gutermuth et al., 2009; Luhman et al., 2010; Rebull et al., 2011; Koenig et al., 2012; Megeath et al., 2012; Spezzi et al., 2013; Stutz et al., 2013; Broekhoven-Fiene et al., 2014; Esplin et al., 2014, as recent examples). The accretion of this surrounding material onto the surface of the star produces intense ultraviolet (UV) line and continuum emission observed also as an excess over the predicted photospheric emission. The combination of ultraviolet and infrared photometry has proven to be an useful tool for identifying YSOs (Findeisen & Hillenbrand, 2010; Rodriguez et al., 2011, 2013; Gómez de Castro et al., 2014). However, an unambiguous identification of YSOs only on the basis of color-color diagrams is far from being a trivial task because, among other issues, of contamination from non-YSO sources such as unresolved background galaxies. A multi-wavelength fit to the full observed SED using a Bayesian approach (as in Barentsen et al., 2013; Sarro et al., 2014) seems to be a promising alternative to object-by-object spectroscopic follow-up. However, in general, SED fitting (and consequently color-color diagrams) may be highly degenerate between evolutionary stage and the geometry of the star-disk system (Robitaille et al., 2007).
The Galaxy Evolution Explorer mission (GALEX, Martin et al., 2005) has provided images in the far-ultraviolet (FUV, 1350-1780 Å) and near-ultraviolet (NUV, 1770-2730 Å) bands. The GALEX All Sky Imaging Survey (AIS) has covered a large part of the sky and all its products are available online, providing a unique opportunity to carry out extensive and systematic searches for UV-emitting YSO candidates (Rodriguez et al., 2013). In general, GALEX avoids the Galactic plane and fields containing bright UV sources that could damage its detectors and, unfortunately, these are precisely the fields in which YSOs are most likely to be found. Despite this, GALEX data are especially useful to study the UV properties of the dispersed populations of young stars around star-forming regions (e.g., in Orion, Biazzo et al., 2012) that may be caused by the drift of these stars away from their formation sites (Feigelson, 1996). In this work, we have undertaken a search for UV-emitting young stars that are suitable targets to be observed with the next UV space telescope WSO-UV (Sachkov et al., 2014; Shustov et al., 2014). We are building GALEX-based catalogs of YSO candidates over large areas of different star-forming regions (see Gómez de Castro et al., 2011, 2014). Here we report our results toward the Orion region.
2 The GALEX-AIS survey toward Orion
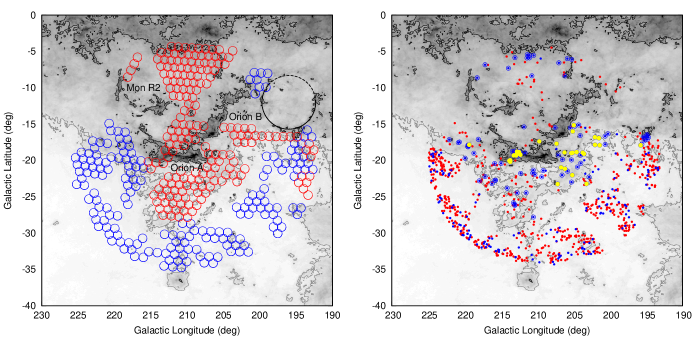
We first retrieved all the GALEX-AIS tiles centered in Orion with a search radius of deg. This yielded a total of 359 tiles that can be seen in Figure 1 overlaid on a thermal dust emission map from the Planck mission (Planck Collaboration et al., 2011).
From them, there are 173 tiles with observations both in FUV and NUV bands whereas 185 tiles have observations in NUV but not FUV. Most of the exposure times are in the range sec, although some tiles have higher exposures times but always below sec. The limiting magnitude (at level) for the AIS Survey with 100 sec is 19.9 mag (FUV band) and 20.8 (NUV) (Morrissey et al., 2007). For each tile, we used the band-merged source catalog (data product “xd-mcat.fits”) which combines data in one table containing all the extracted FUV and NUV sources matched to the best candidate from the other band. Sources with signal-to-noise ratio smaller than 2 or separation greater than 3 arcsec are not matched but are also listed in the merged catalogs. We joined all these catalogs to make one single list containing the positions, the calibrated FUV and NUV magnitudes and their corresponding errors for 1,555,174 GALEX sources in the studied region.
In order to discard spurious sources that may be present in the GALEX point source catalog (Bianchi et al., 2011) we cross-correlated these sources with the 2MASS catalog (Skrutskie et al., 2006). We searched the 2MASS All-Sky Point Source Catalog within a radius of 15 degrees around Orion for objects with good photometric quality111By “good” quality we mean having valid measurements in the JHK bands, with signal to noise ratio higher than 5 and magnitude uncertainties smaller than 0.21714, that is having a photometric quality flag of C or better in the 2MASS catalog. We also discarded sources with flags indicating possible contamination and/or confusion. and we obtained a total of 3,086,388 sources. The 2MASS point source catalog is complete down to , and mag, although fainter sources are also included in the catalog. Generally speaking GALEX-AIS survey would be shallower than the 2MASS survey for Galactic sources because extinction prevents UV radiation to propagate large distances in the Galactic plane. Thus, we expect that no UV-emitting candidates are lost during the cross-correlation. We consider as “reliable” objects those GALEX sources having measurements in FUV and/or NUV bands and also having a 2MASS counterpart within a matching radius of 3 arcsec (see Bianchi et al., 2011; Gómez de Castro et al., 2011). The total number of obtained sources is 290,717; that is about 18.7 % of the initial number of GALEX sources. We do not know the true nature of the % of the UV sources that did not match with any 2MASS source. Point sources listed in the GALEX band-merged catalog have signal-to-noise ratios as low as , so that many of these sources may probably be spurious. However, this seems to be a very large number for spurious detections when compared with the % of expected reliability achieved in the AIS at according to GALEX documentation. An empirical test about the reliability of the GALEX point source catalog is, although interesting, out of the scope of this paper.
To improve the photometric information we have also cross-matched the sources with other publicly available catalogs with, again, a matching radius of 3 arcsec. We have found significant matches (i.e. point sources unaffected by known artifacts) in the UCAC4 (Zacharias et al., 2013), SDSS (Ahn et al., 2012), DENIS (Epchtein et al., 1999), CMC15 (Niels Bohr Institute et al., 2014), and WISE (Wright et al., 2010) catalogs. Thus, apart from GALEX (,) and 2MASS () photometric data we added, when available, magnitudes and errors in from UCAC4, from SDSS, from DENIS, from CMC15 and from WISE.
3 Young star candidate selection
We are particularly interested in TTSs, so we performed a search for this type of objects in the 290,717 sources of the sample. We used the SIMBAD database to search for confirmed (not candidate) TTSs and we found 56 stars. We have addressed the candidate selection process from an empirical point of view, by preparing different combinations of color-color diagrams and looking at the distribution of the sources in each diagram. After many different tests we concluded that the versus diagram gives reasonably good results, at least for the sample we are working with. On the one hand, is a color index that may indicate UV excess and that has been previously used by other authors for searching and finding active low-mass stars (e.g., Findeisen & Hillenbrand, 2010; Rodriguez et al., 2011; Shkolnik et al., 2011). On the other hand, the IR excess produced by the presence of protoplanetary disks in Classical TTSs can be quantified by . The utilization of different color indices such as (as in Findeisen & Hillenbrand, 2010; Rodriguez et al., 2011) or (Rodriguez et al., 2013) shifted stars with infrared excess closer to or further away from the main sequence but did not result in any significant difference in the selection procedure.
In Figure 2, the vs. diagram for the 290,717 sources of the sample is shown.
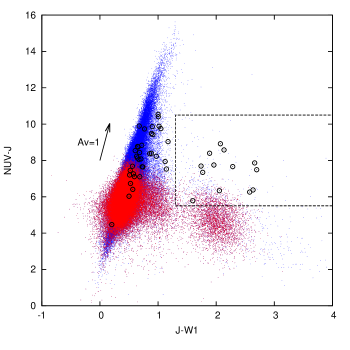
Most of the SIMBAD-identified sources (all of them except one) are located in the range , whereas the infrared excess exhibits two well-defined groups separated at . We have made a first list of candidates by selecting the region of the reddest known TTSs (dashed line in Figure 2), that is by using the following criteria:
| (1) |
There is a group of less reddened TTSs (), probably including Weak-lined TTSs, that can not be separated from main sequence objects in this color-color diagram. To extend the selection criterion to smaller values would include these TTSs but also a lot of main sequence stars and other contaminants that are difficult to separate at a later stage. We have decided to keep a more restrictive criterion (Equations 1) at this stage to ensure a more reliable list of TTS candidates and mitigate contamination. Despite this, it is necessary to remove contamination by non-YSO sources by applying additional criteria. For this we adopt the photometric scheme based on WISE colors developed by Koenig et al. (2012). They classified as unresolved star-forming galaxies those satisfying all the following constraints:
| (2) |
whereas unresolved AGNs are those sources for which either
| (3) |
or
| (4) |
There are 83,484 objects fulfilling the extragalactic contamination criteria (Equations 2 or 3 or 4) that are indicated as red dots in Figure 2 and were excluded from the TTS candidate selection criteria (Equations 1). The remaining 259 sources are shown in the right panel of Figure 1 as blue dots, whereas red dots in this figure represent unresolved galaxies and AGNs according to the criteria of Koenig et al. (2012). We note that the latter are distributed preferentially along the lower semicircumference of the studied region where there is no or very little dust present. The pre-selected candidates (blue dots) that are located in this region are precisely the faintest objects, with apparent magnitudes in the range (as shown in Figure 3).

Thus, it is likely that at least part of these sources are background extragalactic contaminants that are still present in the sample because, obviously, these color/magnitude selection criteria are not perfect and there can be source misclassification either including some extragalactic objects or removing some YSOs (see Figures 7 and 8 in Koenig et al., 2012). Instead of making a cut in magnitude we use the spatial distribution to perform a final cleaning of the sample keeping the faintest TTS candidates. Thus, from the 259 sources fulfilling the above mentioned criteria (blue dots in right panel of Figure 1), we select as “good” TTS candidates (blue circles surrounding the dots in Figure 1) those sources that are not located along or close to the semicircumference with a relatively high density of extragalactic sources. We also excluded nine objects that Sloan classifies as extended sources and the object 2MASS J06235520+0018433 because it is a quasar discovered by Im et al. (2007).
Our final list of 111 TTS candidates is shown in Table 1. There are 30 of these objects that were previously classified as YSOs or YSO candidates by other authors; in these cases the specified object type and the corresponding reference are included in last columns of Table 1. Of these 30 previously identified objects, 14 have been classified as Classical TTS whereas 13, although probable Classical TTS, have been generically classified as TTS or YSO. There are only 3 sources that were classified as Herbig Ae/Be objects. The remaining 81 sources are new TTS candidates identified in this work. We expect that most of these candidates are Classical TTS (they have UV and IR excesses).
| ID(2MASS) | (deg) | (deg) | (GALEX) | (UCAC4) | (2MASS) | (WISE) | Ref (known) |
|---|---|---|---|---|---|---|---|
| (col 1) | (col 4) | (col 5) | (col 89) | (col 1213) | (col 3435) | (col 4041) | (col 49) |
| J05071385-1020045 | 210.512 | -27.796 | 21.0970.416 | (…) | 15.3060.058 | 13.6710.027 | |
| J05113654-0222484 | 203.205 | -23.212 | 17.0350.019 | 12.6980.17 | 10.5580.022 | 7.87 0.023 | Lee07 |
| J05141589-0138583 | 202.856 | -22.279 | 19.2510.098 | 13.58 0.04 | 10.1080.024 | 8.7520.023 | |
| J05160265-0356398 | 205.273 | -22.976 | 21.7510.854 | (…) | 15.3620.065 | 13.8750.028 | |
| J05160402+0618525 | 195.751 | -17.904 | 18.7870.074 | 15.5320.33 | 11.2860.022 | 8.6830.023 | Tak10 |
4 Properties of the selected TTS candidates
4.1 Spatial distribution
A detailed analysis of the spatial distribution is difficult because of the bias in the non-uniform GALEX pointing distribution toward Orion. For instance, the lack of sources in the range deg is likely more related to the lack of pointings than anything else (see Figure 1). Despite this, we note that in general sources are spread almost uniformly except for two apparent overdensities. The first one is located at galactic coordinates deg and deg corresponding to one of the clouds of the Orionis ring of clouds (B 223). The second overdensity is at and deg toward the Orion A cloud and it agrees with the cluster rich in Class III stars found by Pillitteri et al. (2013) in the southern end of L1641. These apparent overdensities are seen in regions in which GALEX-AIS covered a dense part of these molecular clouds (B 223 and Orion A, see left panel in Figure 1). At this point we can only say that there seems to be a relatively high density of sources toward denser and dust-richer regions embedded within an almost more or less homogeneous distribution of TTS candidates. This picture is consistent with the result of Biazzo et al. (2012) concerning the existence of a mixture of a young clustered population and a widespread population originated from an earlier episode of star formation. However, this scenario is a little uncertain because of the presence of a rich foreground population of young ( Myr) stars toward Orion (Bouy et al., 2014).
4.2 Spectral energy distributions
The SEDs of the TTS candidates were analyzed by using the VOSA web-tool developed by the Spanish Virtual Observatory (Bayo et al., 2008). VOSA performs a statistical test to determine the theoretical spectral model that best reproduces the observed data. VOSA has a flexible environment allowing the user to choose among different available collections of models and to define the parameters (and their ranges) to be fitted (see details in Bayo et al., 2008). We have used the available photometry (magnitudes and errors in Table 1) for fitting the observed SEDs allowing veiling (UV excess) at wavelengths shorter than 3000 Å (i.e. in the GALEX FUV and NUV bands) and infrared excess at any of the WISE bands. The distance to the sources is a fixed value in VOSA and mandatory to calculate the bolometric luminosities. The distance to the well-studied Orion Nebular Cluster (ONC) seems to be pc (Sandstrom et al., 2007; Menten et al., 2007). However, when dealing with a very sparse population distance variations may be significant. Lombardi et al. (2011) obtained a distance of pc for Orion A and pc for Orion B. Schlafly et al. (2014) obtained larger values and significant distance variations ( pc) toward different lines of sight suggesting a complex 3D structure in Orion. In fact, it seems that the eastern edge of Orion is pc farther from us than the ONC. Since VOSA allows us to provide a value for the distance error, which is propagated to the derived luminosity, we adopted a distance of pc to all the sources. The SED fitting process is quite insensitive to some parameters such as, for instance, the surface gravity of the source (Bayo et al., 2008). Thus, in order to improve the convergence of the fitting procedure we fixed both metallicity and surface gravity around the expected values (solar metallicty and ). We leave the visual extinction as a free parameter constrained to the range and the effective temperature of the theoretical model is left completely free. There were 65 sources that converged to physically reasonable solutions and their SEDs were well-fitted by the BT-Settl models (Allard et al., 2012). Figure 4 shows the result for an example fitted SED.

Most, though not all, the fitted SEDs displayed significant UV and IR excesses and we consider these sources as very good candidates to TTSs.
4.3 Derived physical properties
The effective temperature (), bolometric luminosity () and visual extinction () derived for each object from their fits are shown in Table 2.
| ID(2MASS) | a𝑎aa𝑎aUncertainty in is 50 K. | Type | Ref. | |||||
|---|---|---|---|---|---|---|---|---|
| (deg) | (deg) | (K) | () | () | (mag) | |||
| J05071385-1020045 | 210.512 | -27.796 | 4700 | 0.035 | 0.003 | 1.0 | ||
| J05141589-0138583 | 202.856 | -22.279 | 4400 | 2.355 | 0.275 | 0.0 | ||
| J05160402+0618525 | 195.751 | -17.904 | 3600 | 1.343 | 0.155 | 1.25 | TTS | Tak10 |
| J05170743-1143036 | 213.069 | -26.18 | 4200 | 0.029 | 0.003 | 0.0 | ||
| J05173566-1140050 | 213.073 | -26.054 | 3800 | 0.024 | 0.003 | 0.0 |
Last two columns give the object type and reference for previously identified stars. Given the large uncertainties in their distances the derived luminosities must be taken with caution. However, the calculated temperatures allow us to confirm the cool photospheres expected for TTSs. Most of the sources (58) have stellar effective temperatures K (spectral type K0 or later). There is only one discrepant case (J05401176-0942110) for which we obtain K but that, according to Manoj et al. (2006), is a probable Herbig Ae/Be star. We do not notice any particular behavior in the derived physical properties or in their spatial distribution, although obviously there are too few data points to draw any robust conclusion in this sense.
5 Conclusions
We constructed a catalog of 111 reliable TTS candidates with detected UV emission in an area of 400 square degrees toward the Orion star-forming region, from which 81 sources are new candidates identified in this work. We derived physical properties for 65 of these candidates. Most of the sources show photospheric temperatures and both UV and IR excesses compatible with the expected for TTSs. These TTS candidates likely belong to a dispersed population of young stars, as also observed on other star forming regions (e.g. Comerón et al., 2013), whose origin remains unclear. Their study will allow further understanding of the physical properties and origin of this population of young stars.
Acknowledgements.
We thank the referee for his/her comments which improved this paper. We acknowledge financial support from Ministerio de Economía y Competitividad of Spain through grant AYA2011-29754-C03-01.References
- Ahn et al. (2012) Ahn, C. P., Alexandroff, R., Allende Prieto, C., et al. 2012, ApJS, 203, 21.
- Allard et al. (2012) Allard, F., Homeier, D., Freytag, B., & Sharp, C. M. 2012, EAS Publications Series, 57, 3.
- Allen et al. (2004) Allen, L. E., Calvet, N., D’Alessio, P., et al. 2004, ApJS, 154, 363.
- Barentsen et al. (2013) Barentsen, G., Vink, J. S., Drew, J. E., & Sale, S. E. 2013, MNRAS, 429, 1981.
- Barrado y Navascués & Martín (2003) Barrado y Navascués, D., & Martín, E. L. 2003, AJ, 126, 2997.
- Basri et al. (1991) Basri, G., Martin, E. L., & Bertout, C. 1991, A&A, 252, 625.
- Bayo et al. (2008) Bayo, A., Rodrigo, C., Barrado Y Navascués, D., et al. 2008, A&A, 492, 277.
- Bertout (1989) Bertout, C. 1989, ARA&A, 27, 351.
- Bianchi et al. (2011) Bianchi, L., Efremova, B., Herald, J., et al. 2011, MNRAS, 411, 2770.
- Biazzo et al. (2012) Biazzo, K., Alcalá, J. M., Covino, E., et al. 2012, A&A, 542, A115.
- Comerón et al. (2013) Comerón, F., Spezzi, L., López Martí, B., & Merín, B. 2013, A&A, 554, AA86.
- Bouvier et al. (2007) Bouvier, J., Alencar, S. H. P., Harries, T. J., Johns-Krull, C. M., & Romanova, M. M. 2007, Protostars and Planets V, 479.
- Bouy et al. (2014) Bouy, H., Alves, J., Bertin, E., Sarro, L. M., & Barrado, D. 2014, A&A, 564, A29.
- Briceño et al. (2005) Briceño, C., Calvet, N., Hernández, J., et al. 2005, AJ, 129, 907.
- Broekhoven-Fiene et al. (2014) Broekhoven-Fiene, H., Matthews, B. C., Harvey, P. M., et al. 2014, ApJ, 786, 37.
- Clarke et al. (2005) Clarke, A. J., Oudmaijer, R. D., & Lumsden, S. L. 2005, MNRAS, 363, 1111.
- Edwards et al. (1994) Edwards, S., Hartigan, P., Ghandour, L., & Andrulis, C. 1994, AJ, 108, 1056.
- Epchtein et al. (1999) Epchtein, N., Deul, E., Derriere, S., et al. 1999, A&A, 349, 236.
- Esplin et al. (2014) Esplin, T. L., Luhman, K. L., & Mamajek, E. E. 2014, ApJ, 784, 126.
- Feigelson (1996) Feigelson, E. D. 1996, ApJ, 468, 306.
- Findeisen & Hillenbrand (2010) Findeisen, K., & Hillenbrand, L. 2010, AJ, 139, 1338.
- Gómez de Castro (2013) Gómez de Castro, A. I. 2013, Planets, Stars and Stellar Systems. Volume 4: Stellar Structure and Evolution, 279.
- Gómez de Castro et al. (2011) Gómez de Castro, A. I., Lopez-Santiago, J., Sestito, P., et al. 2011, Ap&SS, 335, 97.
- Gómez de Castro et al. (2014) Gómez de Castro, A. I., Lopez-Santiago, J., Lopez-Martinez, F., Sanchez, N., et al. 2014, MNRAS (submitted).
- Gutermuth et al. (2009) Gutermuth, R. A., Megeath, S. T., Myers, P. C., et al. 2009, ApJS, 184, 18
- Hartmann et al. (2005) Hartmann, L., Megeath, S. T., Allen, L., et al. 2005, ApJ, 629, 881.
- Hernández et al. (2007) Hernández, J., Calvet, N., Briceño, C., et al. 2007, ApJ, 671, 1784.
- Im et al. (2007) Im, M., Lee, I., Cho, Y., et al. 2007, ApJ, 664, 64.
- Koenig et al. (2012) Koenig, X. P., Leisawitz, D. T., Benford, D. J., et al. 2012, ApJ, 744, 130.
- Lee & Chen (2007) Lee, H.-T., & Chen, W. P. 2007, ApJ, 657, 884.
- Lee & Chen (2009) Lee, H.-T., & Chen, W. P. 2009, ApJ, 694, 1423.
- Lombardi et al. (2011) Lombardi, M., Alves, J., & Lada, C. J. 2011, A&A, 535, A16.
- Luhman et al. (2010) Luhman, K. L., Allen, P. R., Espaillat, C., Hartmann, L., & Calvet, N. 2010, ApJS, 186, 111.
- Manoj et al. (2006) Manoj, P., Bhatt, H. C., Maheswar, G., & Muneer, S. 2006, ApJ, 653, 657.
- Martin (1997) Martin, E. L. 1997, A&A, 321, 492.
- Martin et al. (2005) Martin, D. C., Fanson, J., Schiminovich, D., et al. 2005, ApJ, 619, L1.
- McKee & Ostriker (2007) McKee, C. F., & Ostriker, E. C. 2007, ARA&A, 45, 565.
- Megeath et al. (2012) Megeath, S. T., Gutermuth, R., Muzerolle, J., et al. 2012, AJ, 144, 192.
- Menten et al. (2007) Menten, K. M., Reid, M. J., Forbrich, J., & Brunthaler, A. 2007, A&A, 474, 515.
- Morrissey et al. (2007) Morrissey, P., Conrow, T., Barlow, T. A., et al. 2007, ApJS, 173, 682.
- Muzerolle et al. (1998) Muzerolle, J., Hartmann, L., & Calvet, N. 1998, AJ, 116, 455.
- Niels Bohr Institute et al. (2014) Niels Bohr Institute, U. o. C., Institute of Astronomy, C., UK, & Real Instituto y Observatorio de La Armada en San Fernando 2014, VizieR Online Data Catalog, 1327, 0.
- Pillitteri et al. (2013) Pillitteri, I., Wolk, S. J., Megeath, S. T., et al. 2013, ApJ, 773, 80.
- Planck Collaboration et al. (2011) Planck Collaboration, Ade, P. A. R., Aghanim, N., et al. 2011, A&A, 536, A1.
- Rebull et al. (2011) Rebull, L. M., Koenig, X. P., Padgett, D. L., et al. 2011, ApJS, 196, 4.
- Robitaille et al. (2007) Robitaille, T. P., Whitney, B. A., Indebetouw, R., & Wood, K. 2007, ApJS, 169, 328.
- Rodriguez et al. (2011) Rodriguez, D. R., Bessell, M. S., Zuckerman, B., & Kastner, J. H. 2011, ApJ, 727, 62.
- Rodriguez et al. (2013) Rodriguez, D. R., Zuckerman, B., Kastner, J. H., et al. 2013, ApJ, 774, 101.
- Sachkov et al. (2014) Sachkov, M., Shustov, B., & Gómez de Castro, A. I. 2014, Advances in Space Research, 53, 990.
- Sandstrom et al. (2007) Sandstrom, K. M., Peek, J. E. G., Bower, G. C., Bolatto, A. D., & Plambeck, R. L. 2007, ApJ, 667, 1161.
- Sarro et al. (2014) Sarro, L. M., Bouy, H., Berihuete, A., et al. 2014, A&A, 563, A45.
- Schlafly et al. (2014) Schlafly, E. F., Green, G., Finkbeiner, D. P., et al. 2014, ApJ, 786, 29.
- Sherry et al. (2004) Sherry, W. H., Walter, F. M., & Wolk, S. J. 2004, AJ, 128, 2316.
- Shkolnik et al. (2011) Shkolnik, E. L., Liu, M. C., Reid, I. N., Dupuy, T., & Weinberger, A. J. 2011, ApJ, 727, 6.
- Shu et al. (1987) Shu, F. H., Adams, F. C., & Lizano, S. 1987, ARA&A, 25, 23.
- Shustov et al. (2014) Shustov, B., Gómez de Castro, A. I., Sachkov, M., et al. 2014, Ap&SS, 350.
- Skrutskie et al. (2006) Skrutskie, M. F., Cutri, R. M., Stiening, R., et al. 2006, AJ, 131, 1163.
- Spezzi et al. (2013) Spezzi, L., Cox, N. L. J., Prusti, T., et al. 2013, A&A, 555, A71.
- Stutz et al. (2013) Stutz, A. M., Tobin, J. J., Stanke, T., et al. 2013, ApJ, 767, 36.
- Takita et al. (2010) Takita, S., Kataza, H., Kitamura, Y., et al. 2010, A&A, 519, A83.
- Torres et al. (1995) Torres, C. A. O., Quast, G., de La Reza, R., Gregorio-Hetem, J., & Lepine, J. R. D. 1995, AJ, 109, 2146.
- van Eyken et al. (2011) van Eyken, J. C., Ciardi, D. R., Rebull, L. M., et al. 2011, AJ, 142, 60.
- Wright et al. (2010) Wright, E. L., Eisenhardt, P. R. M., Mainzer, A. K., et al. 2010, AJ, 140, 1868.
- Zacharias et al. (2013) Zacharias, N., Finch, C. T., Girard, T. M., et al. 2013, AJ, 145, 44.