Shrinking Galaxy Disks with Fountain-Driven Accretion from the Halo
Abstract
Star formation in most galaxies requires cosmic gas accretion because the gas consumption time is short compared to the Hubble time. This accretion presumably comes from a combination of infalling satellite debris, cold flows, and condensation of hot halo gas at the cool disk interface, perhaps aided by a galactic fountain. In general, the accretion will have a different specific angular momentum than the part of the disk that receives it, even if the gas comes from the nearby halo. Then the gas disk expands or shrinks over time. Here we show that condensation of halo gas at a rate proportional to the star formation rate in the fountain model will preserve an initial shape, such as an exponential, with a shrinking scale length, leaving behind a stellar disk with a slightly steeper profile of younger stars near the center. This process is slow for most galaxies, producing imperceptible radial speeds, and it may be dominated by other torques, but it could be important for Blue Compact Dwarfs, which tend to have large, irregular gas reservoirs and steep blue profiles in their inner stellar disks.
1 Introduction
Disk accretion is attributed to cold cosmic flows (Kereś et al., 2005; Dekel, et al., 2009; van de Voort & Schaye, 2012) and dwarf satellite capture (Fox et al., 2014) through the virial radius, which may be 20 times larger than the disk (see reviews in Sancisi et al., 2008; Sánchez Almeida et al., 2014). It is not clear whether these flows reach the disk directly. Bland-Hawthorn et al. (2007) and Fox et al. (2014) suggest that the Magellanic Stream breaks apart and gets ionized by hydrodynamic instabilities without falling onto the disk. Joung et al. (2012) also found substantial heating and ionization of the layers surrounding a cosmic cold flow in simulations of the Milky Way. The numerical algorithm used for the simulation might also be important; the AREPO code (Nelson et al., 2013) has such high resolution that the infalling gas breaks apart by instabilities and heats up before reaching the disk. These predictions are consistent with the observation that the inflow rate of neutral clouds around the Milky Way is small, yr-1 (Putman et al., 2012a), which is too low to maintain the star formation rate of several yr-1 (Chomiuk & Povich, 2011) if that is the only gas that comes in. Low accretion leads to a relatively rapid quenching of star formation, contradicting the observation that most disk galaxies form stars over a high fraction of the Hubble time (e.g., Mannucci et al., 2010).
Cosmic simulations suggest that the accreting gas moves toward larger radii over time as the specific angular momentum of the remaining cosmic filament increases; this leads to the popular picture of inside-out star formation (Pichon et al., 2011). Observations agree that accretion occurs today in the outer parts of galaxies (Lemonias et al., 2011; Moffett et al., 2012; Moran et al., 2012). This causes a problem if most of the star formation takes place in the main disk, much further inward. Why does the star formation rate equal the accretion rate, as analytical models suggest (Bouché et al., 2010; Davé et al., 2012; Lilly et al., 2013; Dekel et al., 2013), if these rates occur in different locations? One needs in-plane accretion at a comparable rate to deliver the fresh outer gas to the inner star-forming regions. Dekel et al. (2013) discuss how this might happen using a model based on energy dissipation. Forbes et al. (2014) consider in-plane accretion that is driven by disk torques from interacting clumps and turbulent viscosity.
Another model of disk accretion assumes that cosmic gas goes first into a hot halo and then condenses onto the disk in a second step via thermal cooling at the interface. A galactic fountain could provide the cool surface needed for this condensation (Fraternali & Binney, 2006; Marinacci et al., 2010, 2011; Putman et al., 2012b; Hobbs et al., 2013). The fountain model avoids the question of whether the cosmic gas goes directly from the virial radius to the disk, and it avoids the problem of accretion onto the outer regions when the gas is needed in the inner regions to form stars. Cosmic gas may be deposited in the far outer regions by cold streams while the inner disk is fed by condensing halo gas immediately adjacent to it. Fraternali et al. (2014) summarize the advantages of this model, including many comparisons to observations (Marasco et al., 2012, 2013). Halo condensation gives an accretion rate that is approximately proportional to the star formation rate at the same position, and therefore to the existing column density of molecular or self-gravitating gas. Such a model sustains star formation in the main disk.
Cosmic accretion should generally have a different specific angular momentum than the part of the disk that receives it. There will be some generation of turbulence to dissipate the relative kinetic energy, and an inflow or outflow of the combined gas until radial force equilibrium is achieved in a new circular orbit. Even in the fountain model, where the accreting gas in the disk comes directly from the adjacent rotating halo, the high velocity dispersion in the halo and the resulting radial pressure gradient cause it to rotate more slowly than the cold disk beneath it. The result will be a gradual shrinkage of the gas disk as it forms stars from condensing halo gas.
This paper calculates the radial drift speed from halo condensation at the local star formation rate in order to determine how such a drift affects the radial profiles of the gaseous and stellar components of the disk. The results suggest a relatively long timescale for disk evolution forced this way, so the process may not have strong observational signatures in disks dominated by other torques, such as bars and spirals. However it may be evident in dwarf galaxies without these stellar structures. Dwarf galaxy star formation also seems to proceed from the outside-in (Zhang et al., 2012), as if following some inflowing gas, unlike the case in spiral galaxies. The star formation history in the Large Magellanic Cloud shows an outside-in trend too, although interactions with the Small Magellanic Cloud could be involved (Dobbie et al., 2014).
Other processes involving extra-planar gas should stimulate the same type of halo condensation and disk shrinkage. Struck & Smith (2009) suggested that gas at the disk-halo interface follows the motions of spirals and bars, which concentrate star formation and increase the turbulent pressure locally. They model the resulting fountain and explain the vertical rotational velocity gradient that is observed in the interface region. Kim et al. (2006) simulated the generation of turbulence by instabilities at high latitude above spiral density wave shocks; turbulent structures like this could enhance halo condensation too.
In what follows, the equations for disk evolution driven by accretion of low angular momentum gas are solved for the case where the accretion rate is proportional to the local star formation rate. Solutions are shown that include depletion of gas by star formation and disk winds, and with rates for accretion and star formation that change over cosmological time. We show that the star-forming part of the gas disk shrinks in a self-similar way throughout this process, which means that an initially exponential profile for this component stays exponential with a shrinking scale length. This is important because exponential profiles appear very early in the universe (Fathi et al., 2012), perhaps as a result of clumpy disk dynamics (Bournaud et al., 2007; Elmegreen & Struck, 2013), and subsequent accretion at the star formation rate should not distort this profile too much. Specific applications to Blue Compact Dwarfs are discussed in Section 2.3.
2 Model: Disk evolution with local halo accretion
2.1 Surface Density Evolution
We assume a that galactic disk accretes locally at a rate equal to in units of mass per area per time. In the fountain model, this accretion is affected primarily by the star-forming component of the disk, so we divide the gas column density into two components, for the star forming part, such as the molecular and self-gravitating clouds, and for the non-star-forming part, such as the atomic diffuse gas. These two components interchange mass and mix with accreted gas on dynamical timescales, but only the fraction of the total that is involved with star-formation will drive the accretion and get depleted as stars form.
With this assumption, the star formation rate is , with a fraction of the forming stellar mass quickly returned to the gas in the form of supernovae and stellar winds. In general, there is also a disk wind. A common approximation is to use a mass loss rate in the wind proportional to the star formation rate, , for constant (e.g., Edmunds, 1990; Bouché et al., 2010; Davé et al., 2012; Lilly et al., 2013). Then the continuity equation for gas surface density, including radial drift speeds from angular momentum redistribution, and for the star-forming and non-star-forming parts, is
| (1) |
We also assume that cosmic accretion has some rotation speed, , that is not generally the same as the circular speed of gas that is already in the disk at that radius, . The equation for conservation of angular momentum for the two components is then
| (2) |
The left-hand side of this equation is the time derivative of the local disk angular momentum, following the radial drift, and the right-hand side is the angular momentum added to this part of the disk.
Assuming the circular speed changes only slowly with time, we separate from the first term on the left of equation (2) and divide the whole equation by . A term like enters so we assume a power law rotation curve of the form , which makes this term equal to . With these modifications to equation (2) we subtract equation (1) to eliminate , several common geometric terms, and the wind and star formation terms. The result is
| (3) |
for the star-forming component. We also get for the non-star forming component, leaving unchanged, because it has no source terms on the right-hand sides of equations (1) and (2).
This result is consistent with the finding by Bouché et al. (2010), Dekel et al. (2013) and others that the atomic phase of interstellar gas has approximately constant mass over time with the accretion feeding only the star formation component. Our modification here is to consider that the accreted gas has a lower specific angular momentum than the disk gas, in which case the fraction of the disk mass involved with star formation moves inward to conserve total angular momentum (eq. 3). This result is also consistent with the observation that the radial distribution of HI is usually much flatter than the molecular distribution, which matches that of the star formation rate and approximately also that of the underlying disk stars.
We assume that is proportional to the column density of disk gas that is involved with star formation,
| (4) |
because of the galactic fountain process described in the introduction, along with a Kennicutt-Schmidt relation that is linear between the star formation rate and the dense component of the gas column density (Kennicutt & Evans, 2012).
In the model by Fraternali et al. (2014) and collaborators, the accreted gas is from a large reservoir in the hot halo, in which case it was formerly in hydrostatic equilibrium in the potential well of the galaxy and did not have much rotational support. Observations indicate a %-20% slower rotation of the disk-halo interface than the disk itself (e.g., Marinacci et al., 2011). This disk-halo interface is where the condensation of halo gas onto the fountain is presumably happening, so the rotation speed there is already a mixture of the disk speed from supernova and wind ejecta, and the halo speed from hot gas condensing onto it. The unseen halo speed is probably even lower than the observed interface speed. For simplicity, we write,
| (5) |
In what follows, this ratio will only be compared to unity, so slightly different radial variations in and will not matter much.
The solution to equation (3) is now
| (6) |
We interpret this equation to mean that the star-forming part of the gas moves in at the speed . This does not mean that individual molecular clouds are drifting at that speed. As mentioned above, there should be a continuous mixing between the star-forming and diffuse parts following star formation, stellar gas return, molecular cloud disruption, and so on. Thus, equation (6) may also be interpreted to mean there is an inward drift of the whole interstellar medium at the speed , driven by the star-forming part through its interaction with the slower-moving halo. If accretion enables star formation at about the same rate, and star formation drives accretion as in the fountain model, then , giving . Thus, we can equivalently interpret our equations to mean that the star formation rate scales linearly with the fraction of the total gas, and this fraction drifts at .
The linear dependence of on implies a self similar shrinking. To solve for the resulting , we substitute into equation (1) and simplify to get
| (7) |
In the discussion above, the entire coefficient of the term on the right is independent of radius but not necessarily time, so we represent it by
| (8) |
then we have an evolution equation of the form
| (9) |
for dot and prime representing time and radial derivatives. The first term on the right can be eliminated by substituting . Then
| (10) |
This equation is solved by setting equal to any function of the variable , because then and . Thus the star-forming part of the gas column density becomes
| (11) |
represents the radial profile at . We consider an initial profile that is exponential, so for and initial scale length . Then
| (12) |
with exponentially shrinking scale length, , and initial central value . Evidently, the accretion makes the central column density of this disk component increase with time as .
Because we have assumed to be independent of radius, the radial profile of the star-forming part of the disk is always exponential following an initial exponential shape, even as it shrinks with the accretion of low-angular momentum halo gas. We might expect to have some radial variation, however, even if the star formation rate is locally proportional to the accretion rate ( is constant), because of the likely radial variations of the rotation curve slope, , and the wind mass loading factor, (cf. eqn. 8). The rotation curve should flatten with increasing , making decrease and increase. The wind factor should increase with as the disk material is less bound to the galaxy in the outer parts. These two effects compensate each other in . The other parameters, namely, the gas return fraction and the differential circular speed, should not vary as much (especially if ). Also, is not observed to vary with radius in local disk galaxies for the star forming part of the interstellar medium, i.e., the CO-emitting gas (Schruba et al., 2011). Thus may not vary much. The effects of variable can be understood intuitively because the inflow speed scales with this quantity. Locally high can make a trough, for example, by increasing the inflow rate through that region.
The star-forming gas mass in the disk is
| (13) |
showing the same exponential growth. This type of growth arises because the accretion rate is assumed to be proportional to the star-forming gas mass itself, by feedback through star formation, a galactic fountain, and condensation of halo gas onto the cool fountain debris.
2.2 Sample Solutions
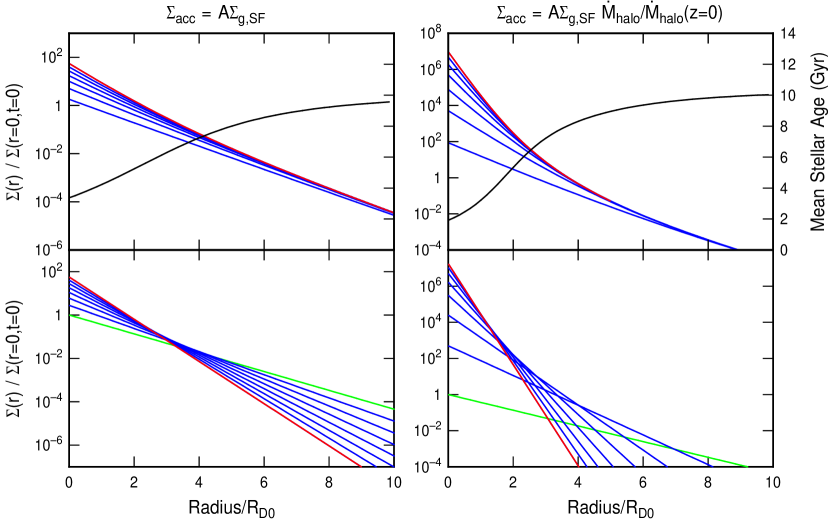
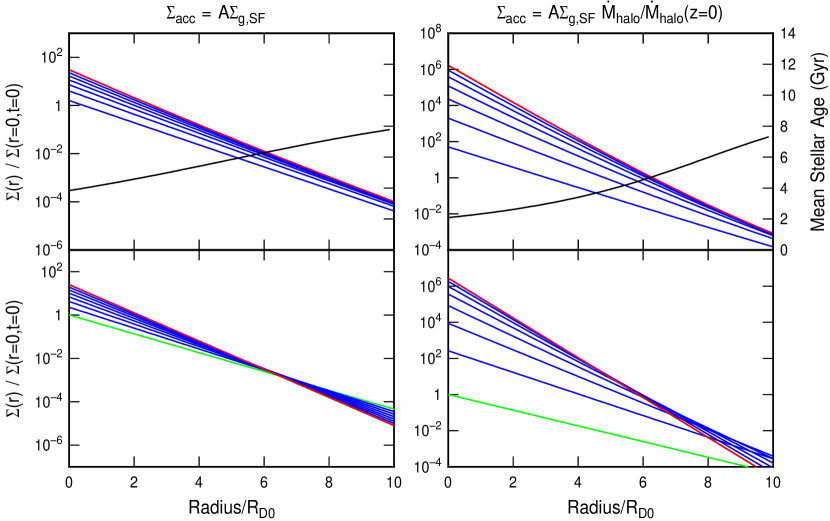
The accretion rate will generally change with time because both and the rate of cosmic accretion into the virial radius change. Sample solutions derived numerically are shown in Figures 1 and 2 for two models. On the left-hand side of each figure, we assume in the first model that the accretion rate equals the star formation rate, which gives . Following Dekel et al. (2013), we use , where is the Hubble time. On the right-hand side of each figure, we assume in the second model that also scales with the halo accretion rate, normalized to the halo accretion rate at the present time:
| (14) |
where (Dekel et al., 2013)
| (15) |
is the mass of the halo in units of , and is the redshift, related to the expansion time by CDM cosmology from Planck Collaboration XVI (2014) where km s-1 Mpc-1 and .
For the evaluation of , we assume for all radii, so there is a 10% mismatch between the halo and disk spins. We also assume a flat rotation curve, , in Figure 1, and a solid body rotation curve, , in Figure 2. From equation (6), we see that the evolution is slower for higher and lower .
The starting time for the accretion is taken to correspond to a redshift of , which is in the clumpy disk phase when the smooth exponential disk starts to appear (e.g., Genzel et al., 2011). All of the surface density profiles are normalized in the figures to the central value of the initial profile. The curves in the bottom panels show the instantaneous radial profiles at equally spaced times from the start (green curve) to today (red curve). The profiles remain exponential as they steepen, as implied by equation 12.
The top panels in the figures show the stellar surface densities calculated at each radius by integrating the local star formation rate over time,
| (16) |
Gyr at the start, where , and increases with cosmic time until today, when Gyr. Because is normalized to the central value at the start, the stellar surface density is not scaled to real units. We assume here (e.g., Edmunds, 2005; Leitner & Kravtsov, 2011; Torrey et al., 2012), and for the gas evolution equation (7), (Zahid et al., 2012). The stellar profiles steepen with time, but they do not remain exponential like the gas because the stars have the gas profiles from the times when they formed.
Also in the top panels, plotted with black curves and using the right-hand axes, are the average, mass-weighted ages of the stellar disks. The average ages are smaller near the center because the gas has moved in and formed an increasing proportion of stars there over time. This is outside-in star formation.
Surface density evolution by fountain-driven accretion is faster for more massive galaxies because of the term in ; massive galaxies tend to have flatter rotation curves in their bright inner regions (Rubin et al., 1985). The age dip at the center is also sharper for higher mass galaxies, for the same reason. Because we have ignored bulge formation and other accretion processes that happened earlier, the present results are only meant to show the part of the evolution from fountain-driven accretion.
2.3 A Fit to Blue Compact Dwarfs
There could be an application to late-type galaxies. Blue Compact Dwarfs (BCDs) have high ratios of gas mass to star mass, low metallicities, nearly solid-body rotation curves, and a generally young appearance. They also have steeper and bluer exponential profiles in the inner disk than the outer disk (Hunter & Elmegreen, 2004, 2006; Janowiecki & Salzer, 2014). Dwarf Irregulars tend to have bluer inner regions too, suggesting outside-in star formation (Zhang et al., 2012). For example, the far ultraviolet scale lengths for low mass galaxies are about half the 3.6m scale lengths, unlike the case for high-mass galaxies where these scale lengths are about the same (Zhang et al., 2012). Low mass galaxies have weak or no spiral arms to drive a radial evolution, and they have sustained star formation at a steady, though bursty, rate all of their lives. If the freshly accreted gas that drives star formation has relatively low angular momentum, then there could have been a radial accretion like that discussed here.
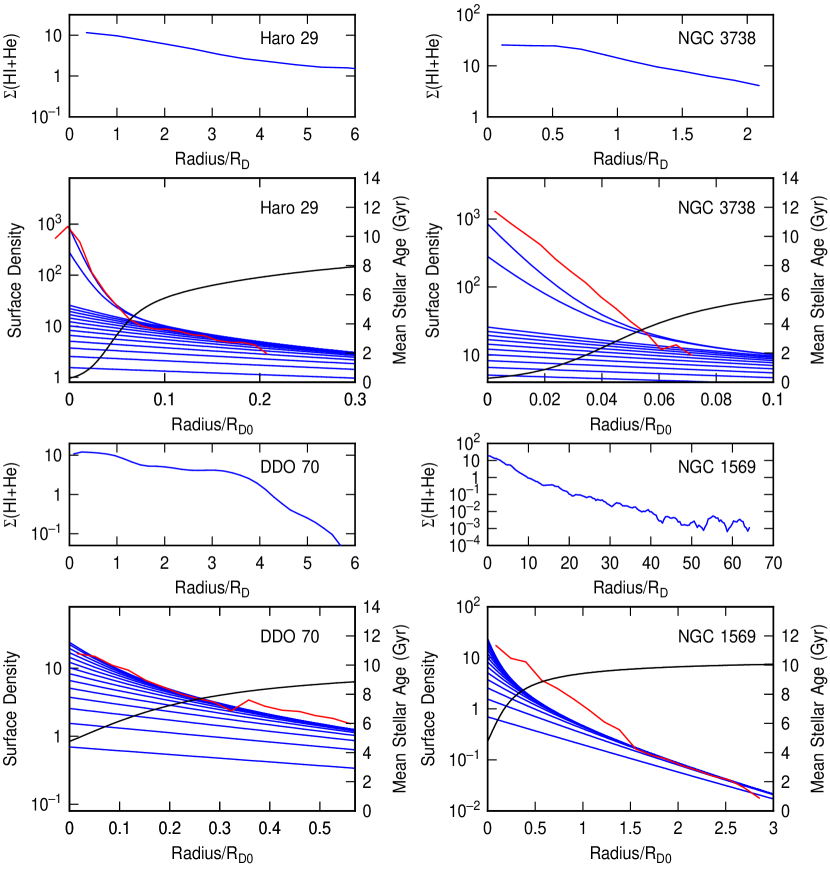
Figure 3 shows the radial profiles of stellar mass surface density in four dwarf galaxies with Type III stellar surface brightness profiles: exponential profiles with radius that have an abrupt break and become shallower in the outer disk (see Herrmann et al., 2013). These profiles are common among BCDs or dwarf galaxies with significant central star formation (current or past). Haro 29 and NGC 3738 are classical BCDs with young central parts and older, smooth outer parts (Ashley et al., 2013). NGC 1569 is a young starburst (Johnson et al., 2012), and DDO 70 is a relatively normal dwarf irregular with evidence for an event in the past that produced an enhancement in the center of the galaxy (Hunter & Elmegreen, 2004, 2006). Each galaxy has steeper surface brightness and stellar mass surface density profiles in the inner disk compared to the outer disk, presumably because of some accretion that led to the starburst there. The observed mass surface density profiles are shown as red curves (from Zhang et al., 2012), and compared to theoretical models of stellar surface density calculated as above. The models fitted the inner and outer slopes primarily by adjusting the accretion history.
All models had the same values of (a relatively large angular momentum mismatch between the halo and the disk), (a slowly rising rotation curve), (a relatively strong wind for these small galaxies, i.e., as above but now for the wind), and a redshift of 2 at the start of the evolution, as above. The two galaxies with the relatively small increase of slope in the center, DDO 70 and NGC 1569, assume without the cosmic accretion multiplier in equation (14), while the two galaxies with large increases of slope in the center, Haro 29 and NGC 3738, assume up to 1 Gyr ago and then a burst of accretion toward the end with 10 times this rate. In the figure, the top blue curve is the one corresponding to the present time, while the other curves show the evolution in equal time steps.
These simple models fit Haro 29 and DDO 70 very well (Haro 29 has a small centrally flat part for which we have artificially moved the galaxy profile slightly to the left in the figure). For NGC 1569 and NGC 3738, the models fit the outer profiles well, but produce inner mass profiles that are slightly less massive than what are observed with roughly the same average slope. Thus, aside from some irregularities in the profiles, fits to the average inner and outer slopes are possible with the accretion model. Galaxies with steeper inner profiles have a larger recent influx of low angular momentum gas. If the influx is steady, then the stars build up with a steadily decreasing scale length and there is a more gradual transition between the inner and outer parts.
Also shown in Figure 3 are the gas surface density profiles derived from the deprojected HI mass surface densities multiplied by 1.36 to account for Helium and heavy elements. These profiles go out much further in radius than the stellar parts shown in the panels below each one. They are plotted in physical units, pc-2, using the left-hand axes. The molecular gas surface density, which presumably follows the star formation rate and inner stellar disk better, is probably much lower than the HI+He surface density throughout most of the plotted region. The HI+He profile is not exponential even though the profile of star formation rate is (H profiles are in Hunter & Elmegreen, 2004).
3 Summary
The interstellar matter in galactic gas disks should migrate inward if the disk accretes from the halo regions at slightly lower specific angular momentum. Accretion at the disk-halo interface (Fraternali & Binney, 2006) could cause such migration and have a noticeable effect on the stellar age distribution after several Gyr. We have shown that this process preserves the exponential shape of the star-forming part of a gas disk initially in this form, while shrinking the disk scale length to conserve angular momentum. The radial drift speed is small, on the order of the disk size divided by the Hubble time, or km s-1. Gas consumption by star formation and gas expulsion by disk winds do not change the exponential shape nor the rate of evolution of the scale length; they only change the absolute value of the surface density. Fits of the model to BCD galaxies can account for the steep inner stellar profiles of those galaxies while explaining the origin of the dense gas in the center that drives the starburst.
We are grateful to the referee for pointing out a more general solution to equation 7 than we originally derived.
References
- Ashley et al. (2013) Ashley, T., Simpson, C., & Elmegreen, B.G. 2013, AJ, 146, 42
- Bland-Hawthorn et al. (2007) Bland-Hawthorn, J., Sutherland, R., Agertz, O., & Moore, B. 2007, ApJL, 670, L109
- Bouché et al. (2010) Bouché, N., Dekel, A., Genzel, R., et al. 2010, ApJ, 718, 1001
- Bournaud et al. (2007) Bournaud, F., Elmegreen, B.G., & Elmegreen, D.M. 2007, ApJ, 670, 237
- Chomiuk & Povich (2011) Chomiuk, L. & Povich, M. S. 2011, AJ, 142, 197
- Davé et al. (2012) Davé, R., Finlator, K., & Oppenheimer, B. D. 2012, MNRAS, 421, 98
- Dekel, et al. (2009) Dekel, A., Birnboim, Y., Engel, G., et al. 2009, Nature, 457, 451
- Dekel et al. (2013) Dekel, A., Zolotov, A., Tweed, D., et al. 2013, MNRAS, 435, 999
- Dobbie et al. (2014) Dobbie, P. D., Cole, A. A., Subramaniam, A., Keller, S. 2014, MNRAS, 442, 1680
- Edmunds (1990) Edmunds, M. G. 1990, MNRAS, 246, 678
- Edmunds (2005) Edmunds, M. 2005, Astronomy and Geophysics, 46, Issue 4, pp. 4.12-4.17
- Elmegreen & Struck (2013) Elmegreen, B.G., & Struck, C., 2013, ApJ, 775, L35
- Fathi et al. (2012) Fathi K., Gatchell, M., Hatziminaoglou, E., & Epinat, B. 2012., MNRAS, 423, L112
- Forbes et al. (2014) Forbes, J. C., Krumholz, M. R., Burkert, A., & Dekel, A. 2014, MNRAS, 438, 1552
- Fox et al. (2014) Fox, A.J., Wakker, B.P., Barger, K.A. et al. 2014, ApJ, 787, 147
- Fraternali & Binney (2006) Fraternali, F. & Binney, J. J. 2006, MNRAS, 366, 449
- Fraternali et al. (2014) Fraternali, F. 2014, IAUS 298 eds. S. Feltzing, G. Zhao, N. A. Walton & P. A. Whitelock, Cambridge: Cambridge University Press, in press, arxiv1310.2956
- Genzel et al. (2011) Genzel, R., Newman, S., Jones, T. et al. 2011, ApJ, 733, 101
- Herrmann et al. (2013) Herrmann, K.A., Hunter, D.A., & Elmegreen, B.G. 2013, AJ, 146, 104
- Hobbs et al. (2013) Hobbs, A., Read, J., Power, C., & Cole, D. 2013, MNRAS, 434, 1849
- Hunter & Elmegreen (2004) Hunter, D.A., & Elmegreen, B.G. 2004, AJ, 128, 2170
- Hunter & Elmegreen (2006) Hunter, D.A., & Elmegreen, B.G. 2006, ApJS, 162, 49
- Janowiecki & Salzer (2014) Janowiecki, S., & Salzer, J.J. 2014, ApJ, 793, 109
- Johnson et al. (2012) Johnson, M., Hunter, D.A., Oh, S.-H., et al. 2012, AJ, 144, 152
- Joung et al. (2012) Joung, M.R., Putman, M.E., Bryan, G.L., Fernández, X., & Peek, J. E. G., 2012, ApJ, 759, 137
- Kennicutt & Evans (2012) Kennicutt, R,C. & Evans, N.J. 2012, ARA&A, 50, 531
- Kereś et al. (2005) Kereś, D., Katz, N., Weinberg, D. H., & Davé, R. 2005, MNRAS, 363, 2
- Kim et al. (2006) Kim, C.-G., Kim, W.-T., & Ostriker, E.C. 2006, ApJ, 649, L13
- Leitner & Kravtsov (2011) Leitner, S. N. & Kravtsov, A. V. 2011, ApJ, 734, 48
- Lemonias et al. (2011) Lemonias, J. J., Schiminovich, D., Thilker, D., et al. 2011, ApJ, 733, 74
- Lilly et al. (2013) Lilly, S. J., Carollo, C. M., Pipino, A., Renzini, A., & Peng, Y. 2013, ApJ, 772, 119
- Mannucci et al. (2010) Mannucci, F., Cresci, G., Maiolino, R., Marconi, A., & Gnerucci, A. 2010, MNRAS, 408, 2115
- Marasco et al. (2012) Marasco, A., Fraternali, F., & Binney, J. J. 2012, MNRAS, 419, 1107
- Marasco et al. (2013) Marasco, A., Marinacci, F., & Fraternali, F. 2013, MNRAS, 433, 1634
- Marinacci et al. (2010) Marinacci, F., Binney, J., Fraternali, F., et al. 2010, MNRAS, 404, 1464
- Marinacci et al. (2011) Marinacci, F., Fraternali, F., Nipoti, C., et al. 2011, MNRAS, 415, 1534
- Moffett et al. (2012) Moffett, A. J., Kannappan, S. J., Baker, A. J., & Laine, S. 2012, ApJ, 745, 34
- Moran et al. (2012) Moran, S. M., Heckman, T. M., Kauffmann, G., et al. 2012, ApJ, 745, 66
- Nelson et al. (2013) Nelson, D., Vogelsberger, M., Genel, S., et al. 2013, MNRAS, 429, 3353
- Pichon et al. (2011) Pichon, C., Pogosyan, D., Kimm, T., et al. 2011, MNRAS, 418, 2493
- Planck Collaboration XVI (2014) Planck Collaboration XVI. 2014, A&A, 566A, 54
- Putman et al. (2012a) Putman, M. E., Peek, J. E. G., & Joung, M. R. 2012, ARA&A, 50, 491
- Putman et al. (2012b) Putman, M. E., Peek, J. E. G., Heitsch, F. 2012, EAS Publications Series, Volume 56, 2012, pp.267-274
- Rubin et al. (1985) Rubin, V. C., Burstein, D., Ford, W. K., Jr., & Thonnard, N. 1985, ApJ, 289, 81
- Sánchez Almeida et al. (2014) Sánchez Almeida, J.; Elmegreen, B. G., Muñoz-Tuñón, C., Elmegreen, D. M. 2014, arXiv1405.3178, The Astronomy and Astrophysics Review, Volume 22, Issue 1
- Sancisi et al. (2008) Sancisi, R., Fraternali, F. Oosterloo, T., & van der Hulst, T. 2008, ARA&A, 15, 189
- Schruba et al. (2011) Schruba, A., Leroy, A. K., Walter, F., et al. 2011, AJ, 142, 37
- Struck & Smith (2009) Struck, C. & Smith, D.C. 2009, MNRAS, 398, 1069
- Torrey et al. (2012) Torrey, P., Cox, T. J., Kewley, L., & Hernquist, L. 2012, ApJ, 746, 108
- van de Voort & Schaye (2012) van de Voort, F. & Schaye, J. 2012, MNRAS, 423, 2991
- Zahid et al. (2012) Zahid, H. J., Dima, G. I., Kewley, L. J., Erb, D. K., & Davé, R. 2012, ApJ, 757, 54
- Zhang et al. (2012) Zhang, H.-X., Hunter, D.A., Elmegreen, B.G., Gao, Y., Schruba, A. 2012, AJ, 143, 47