High Dynamic Range Imaging
by Perceptual Logarithmic Exposure Merging
Abstract
In this paper we emphasize a similarity between the Logarithmic-Type Image Processing (LTIP) model and the Naka-Rushton model of the Human Visual System (HVS). LTIP is a derivation of the Logarithmic Image Processing (LIP), which further replaces the logarithmic function with a ratio of polynomial functions. Based on this similarity, we show that it is possible to present an unifying framework for the High Dynamic Range (HDR) imaging problem, namely that performing exposure merging under the LTIP model is equivalent to standard irradiance map fusion. The resulting HDR algorithm is shown to provide high quality in both subjective and objective evaluations.
1 Introduction
Motivated by the limitation of digital cameras in capturing real scenes with large lightness dynamic range, a category of image acquisition and processing techniques, collectively named High Dynamic Range (HDR) Imaging, gained popularity. To acquire HDR scenes, consecutive frames with different exposures are typically acquired and combined into a HDR image that is viewable on regular displays and printers.
In parallel, Logarithmic Image Processing (LIP) models were introduced as an alternative to image processing with real based operations. While initially modelled from the cascade of two transmitting filters (Jourlin and Pinoli, 1987), later it was shown that the LIP models can be generated by the homomorphic theory and they have a cone space structure (Deng et al., 1995). The initial model was shown to be compatible with the Weber-Fechner perception law (Pinoli and Debayle, 2007), which is not unanimously accepted (Stevens, 1961). Currently, most global Human Visual System (HVS) models are extracted from the Naka-Rushton equation of photoreceptor absorption of incident energy and are followed by further modelling of the local adaptation. We will show in this paper that the new LIP extension model introduced in (Vertan et al., 2008) is consistent with the global human perception as described by the Naka-Rushton model. The model no longer uses a logarithmic generative function but only a logarithmic-like function, hence it will be named Logarithmic Type Image Processing (LTIP) model. In such a case, the generative function of the LTIP model transfers the radiometric energy domain into human eye compatible image domain; thus it mimics, by itself and by its inverse, both the camera response function and the human eye lightness perception.
The current paper claims three contributions. Firstly, we show that the previously introduced LTIP model is compatible with Naka-Rushton/Michaelis-Menten model of the eye global perception. Secondly, based on the previous finding, we show that it is possible to treat two contrasting HDR approaches unitary if the LTIP model framework is assumed. Thirdly, the reinterpretation of the exposure merging algorithm (Mertens et al., 2007) under the LTIP model produces a new algorithm that leads to qualitative results.
The paper is constructed as follows: in Section 2 we present a short overview of the existing HDR trends and we emphasize their correspondence with human perception. In Section 3, state of the art results in the LIP framework and the usage of the newly introduced LTIP framework for the generation of models compatible with human perception are discussed. In Section 4 we derive and motivate the submitted HDR imaging, such that in Section 5 we discuss implementation details and achieved results, ending the paper with discussion and conclusions.
2 Related work
| Method | CRF recovery | Fused Components | Fusion Method | Perceptual | ||||
|---|---|---|---|---|---|---|---|---|
|
Yes | Irradiance Maps |
|
Yes (via TMO) | ||||
|
No | Acquired Frames |
|
No |
 |
 |
| (a) | (b) |
| Model | Domain | Isomorphism |
|
|
|||||
|---|---|---|---|---|---|---|---|---|---|
| LIP | |||||||||
| LTIP | |||||||||
|
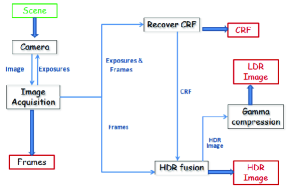
The typical acquisition of a High Dynamic Range image relies on the “Wyckoff Principle”, that is differently exposed images of the same scene capture different information due to the differences in exposure (Mann and Picard, 1995). Bracketing techniques are used in practice to acquire pictures of the same subject but with consecutive exposure values. These pictures are, then, fused to create the HDR image.
For the fusion step two directions are envisaged. The first direction, named irradiance fusion, acknowledges that the camera recorded frames are non-linearly related to the scene reflectance and, thus, it relies on the irradiance maps retrieval from the acquired frames, by inverting the camera response function (CRF), followed by fusion in the irradiance domain. The fused irradiance map is compressed via a tone mapping operator (TMO) into a displayable low dynamic range (LDR) image. The second direction, called exposure fusion, aims at simplicity and directly combines the acquired frames into the final image. A short comparison between these two is presented in Table 1 and detailed in further paragraphs.
2.1 Irradiance fusion
Originating in the work of Debevec and Malik (1997), the schematic of the irradiance fusion may be followed in Fig. 1 (a). Many approaches were schemed for determining the CRF (Grossberg and Nayar, 2004). We note that the dominant shape is that of a gamma function (Mann and Mann, 2001), trait required by the compatibility with the HVS.
After reverting the CRF, the irradiance maps are combined, typically by a convex combination (Debevec and Malik, 1997), (Robertson et al., 1999). For proper displaying, a tone mapping operator (TMO) is then applied on the HDR irradiance map to ensure that in the compression process all image details are preserved. For this last step, following Ward’s proposal (Ward et al., 1997), typical approaches adopt a HVS-inspired function for domain compression, followed by local contrast enhancement. For a survey of the TMOs we refer to the paper of Ferradans et al. (2012) and to the book by Banterle et al.(2011).
Among other TMO attempts, a notable one was proposed by Reinhard et al. (2002) which, inspired by Ansel Adams’ Zone System, firstly applied a logarithmic scaling to mimic the exposure setting of the camera, followed by dodging-and-burning (selectively and artificially increase and decrease image values for better contrast) for the actual compression. Durand et al. (2002) separated, by means of a bilateral filter, the HDR irradiance map into a base layer that encoded large scale variations (thus, needing range compression) and into a detail preserving layer to form an approximation of the image pyramid. Fattal et al. (2002) attenuated the magnitude of large gradients based on a Poisson equation. Drago et al. (2003) implemented a logarithmic compression of luminance values that matches the HVS. Krawczyk et al. (2005) implemented the Gestalt based anchoring theory of Gilchrist Gilchrist et al. (1999) to divide the image in frameworks and performed range compression by ensuring that frameworks are well-preserved. Banterle et al. (2012) segmented the image into luminance components and applied independently the TMOs introduced in Drago et al. (Drago et al., 2003) and in Reinhard et al. (Reinhard et al., 2005) for further adaptive fusion based on previously found areas. Ferradans et al. (2012) proposed an elaborated model of the global HVS response and pursued local adaptation with an iterative variational algorithm.
Yet, as irradiance maps are altered with respect to the reality by the camera optical systems, additional constraints are required for a perfect match with the HVS. Hence, this category of methods, while being theoretically closer to the pure perceptual approach, requires supplementary and costly constraints and significant computational resources for the CRF estimation and for the TMO implementation.
2.2 Exposure merging
Noting the high computational cost of the irradiance maps fusion, Mertens et al. (2007) proposed to implement the fusion directly in the image domain; this approach is described in Fig. 1 (b). The method was further improved for robustness to ghosting artifacts and details preservation in HDR composition by Pece and Kautz (2010).
Other developments addressed the method of computing local contrast to preserve edges and local high dynamic range. Another expansion has been introduced by Zhang et al. (2012), who used the direction of gradient in a partial derivatives type of framework and two local quality measures to achieve local optimality in the fusion process. Bruce (2014) replaced the contrast computed by Mertens et al. (2007) onto a Laplacian pyramid with the entropy calculated in a flat circular neighborhood for deducing weights that maximize the local contrast.
The exposure fusion method is the inspiration source for many commercial applications. Yet, in such cases, exposure fusion is followed by further processing that increases the visual impact of the final image. The post–processing includes contrasting, dodging-and-burning, edge sharpening, all merged and tuned in order to produce a surreal/fantasy-like aspect of the final image.
While being sensibly faster, the exposure fusion is not physically motivated, nor perceptually inspired. However, while the academic world tends to favor perceptual approaches as they lead to images that are correct from a perceptual point of view, the consumer world naturally tends to favor images that are photographically more spectacular and the exposure merging solution pursuits this direction.
3 Logarithmic Type Image Processing
Typically, image processing operations are performed using real-based algebra, which proves its limitations under specific circumstances, like upper range overflow. To deal with such situations, non-linear techniques have been developed (Markovic and Jukic, 2013). Such examples are the LIP models. The first LIP model was constructed by Jourlin and Pinoli (Jourlin and Pinoli, 1987) starting from the equation of light passing through transmitting filters.
The LIP model was further developed into a robust mathematical structure, namely a cone/vector space. Subsequently many practical applications have been presented and an extensive review of advances and applications for the classical LIP model is presented in (Pinoli and Debayle, 2007). In parallel, other logarithmic models and logarithmic-like models were reported. In this particular work we are mainly interested in the logarithmic-like model introduced by Vertan et al. (2008), which has a cone space structure and is named LTIP model. A summary of existing models may be followed in (Navarro et al., 2013). Recently parametric extensions of the LTIP models were also introduced (Panetta et al., 2011), (Florea and Florea, 2013). The LTIP models are summarized in Table 2.
3.1 Relation between LIP models and HVS
From its introduction in the 80s, the original LIP model had a strong argument being similar with the Weber-Fechner law of contrast perception. This similarity was thoroughly discussed in (Pinoli and Debayle, 2007), where it was shown that logarithmic subtraction models the increment of sensation caused by the increment of light with the quantity existing in the subtraction. Yet the logarithmic model of the global perceived luminance contrast system assumed by the Weber-Fechner model was vigorously challenged (Stevens, 1961) and arguments hinted to the power-law rules (Stevens and Stevens, 1963). Thus, we note that the Stevens model is more inline with the LTIP model. On the other hand, Stevens experiments were also questioned (Macmillan and Creelman, 2005), so it does not seem to be a definite answer in this regard.
Still, lately, the evidence seems to favor the Naka-Rushton/Michaelis-Menten model of retinal adaptation (Ferradans et al., 2012), thus an important class of TMO techniques following this model for the global adaptation step. The Naka-Rushton equation is a particular case of the Michaelis-Menten model that expresses the hyperbolic relationship between the initial velocity and the substrate concentration in a number of enzyme-catalyzed reactions. Such a process is the change of the electric potential of a photoreceptor (e.g. the eye cones) membrane, due to the absorption of light of intensity . The generic form, called Michaelis-Menten equation (Valeton and van Norren, 1983) is:
| (1) |
where is the maximum difference of potential that can be generated, is the light level at which the photoreceptor response is half maximal (semisaturation level) and is a constant. Valeton and van Norren (1983) determined that for rhesus monkey. If the Naka-Rushton equation (Naka and Rushton, 1966) is retrieved as a particular case of the Michaelis-Menten model:
| (2) |
For the TMO application, it is considered that the electric voltage in the right is a good approximation of the perceived brightness (Ferradans et al., 2012). Also, it is not uncommon (Meylan et al., 2007) to depart from the initial meaning of semisaturation for (the average light reaching the light field) and to replace it with a convenient chosen constant. TMOs that aimed to mimic the Naka-Rushton model (Reinhard et al., 2002), (Tamburino et al., 2008) assumed that the HDR map input was and obtained the output as .
On the other hand, the generative function of the LIP model maps the image domain onto the real number set. The inverse function acts as a homomorphism between the real number set and the closed space that defines the domain of LIP. For the LTIP model, the generative function is while the inverse is:
| (3) |
The inverse function (Eq. (3) ) mimics the Naka-Rushton model –Eq. (2), with the difference that instead of the semi-saturation, , as in the original model, it uses full saturation. Given this observation, we interpreted logarithmic-like model as the mapping of the irradiance intensity (which are defined over the real number set) onto photoreceptor acquired intensities, i.e human observable chromatic intensity. While the logarithmic-like model is only similar and not identical with the Naka-Rushton model of the human eye, it has the strong advantage of creating a rigorous mathematical framework of a cone space.
3.2 Relation between the LIP models and CRF
The dominant non-linear transformation in the camera pipe-line is the gamma adjustment necessary to adapt the image to the non-linearity of the display and respectively of the human eye. The entire pipeline is described by the Camera Response Function (CRF) which, typically, has a gamma shape (Grossberg and Nayar, 2004).
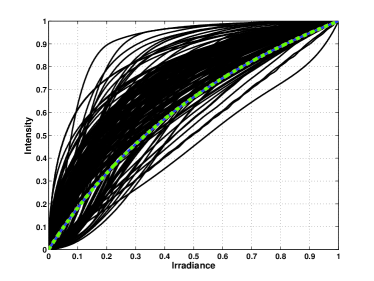
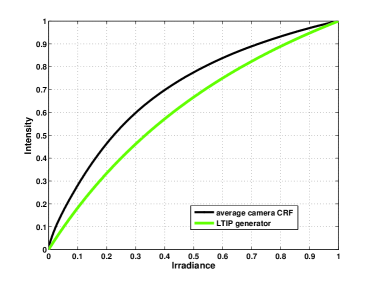
It was previously pointed to the similarity between the LTIP generative function and the CRF (Florea and Florea, 2013). To show the actual relation between the LTIP generative function and the CRF, we considered the Database of Response Functions (DoRF) (Grossberg and Nayar, 2004) which consists of 200 recorded response functions of digital still cameras and analogue photographic films. These functions are shown in Fig. 2 (a); to emphasize the relation, in subplot (b) of the same figure we represented only the LTIP generative function and the average CRF. As one may see, while the LTIP generative function is not identical to the average CRF, there do exist camera and films that have a response function identical to the LTIP generative function.
 |
 |
| (a) | (b) |
To improve the contrast and the overall appearance of the image, some camera models add an S-shaped tone mapping that no longer follows the Naka-Rushton model. In such a case, a symmetrical LTIP model, such as the one described in (Navarro et al. 2013) has greater potential to lead to better results.
4 HDR by Perceptual Exposure Merging
Once that camera response function, , has been found, the acquired images are turned into irradiance maps, by (Debevec and Malik, 1997):
| (4) |
where is the exposure time and is the pixel location. Further, the HDR irradiance map is calculated as the weighted sum of the acquired irradiance maps (Debevec and Malik, 1997), (Robertson et al., 1999):
| (5) |
where are weights depending on the chosen algorithm and is the number of frames.
However, we stress that the weights are scalars with respect to image values. This means that their sum is also a scalar and we denote it by:
| (6) |
Taking into account that the CRF may be approximated by the LTIP generative function and, also, that the final image was achieved by a tone mapping operator from the HDR irradiance map, we may write that:
| (7) |
If one expands the HDR irradiance map using Eq. (5), he will obtain:
| (8) |
where and are the LTIP operations shown in Table 2, while stands for:
Eq. (8) shows that one may avoid the conversion of the input images to irradiance maps, as the HDR image may be simply computed using additions and scalar multiplications in the logarithmic domain. Furthermore, we accentuate that Eq. (8), if written with real-based operations, matches the exposure fusion introduced in (Mertens et al., 2007); yet we have started our calculus based on the irradiance maps fusion. Thus, the use of LTIP operations creates a unifying framework for both approaches. In parallel, it adds partial motivation, by compatibility with HVS, for the exposure fusion variant. The motivation is only partial as the LTIP model follows only the global HVS transfer function and not the local adaptation.
The weights, , should complement the global tone mapping by performing local adaptation. In (Mann and Mann, 2001) these weights are determined by derivation of the CRF, while in (Mertens et al., 2007) they are extracted as to properly encode contrast, saturation and well-exposedness. More precisely:
-
•
contrast is determined by considering the response of Laplacian operators; this is a measure of the local contrast which exists in human perception as center-surround ganglion field organization.
-
•
saturation is computed as the standard deviation of the R, G and B values, at each pixel location. This component favors photographic effects since the normal consumers are more attracted to vivid images and has no straight-forward correspondence to human perception.
-
•
well-exposedness is computed by giving small weights to values in the mid-range and large weights to outliers favoring the glistening aspect of consumer approaches. More precisely, one assumes that a perfect image is modelled by a Gaussian histogram with mean and variance, and the weight of each pixel is the back–projected probability of its intensity given the named Gaussian.
We will assume the same procedure of computing the weights with some small adjustments: while in (Mertens et al., 2007) for well-exposedness both outliers were weighted symmetrically, we favor darker tones to compensate the tendency of LIP models to favor bright tones, caused by their closing property. Details about the precise implementation parameters values will be provided in Section 6, subsect. 1.
5 Implementation and evaluation procedure
Implementation
We have implemented the HDR algorithm described mainly by the equation (8) within the LTIP model and weights similar to the procedure described in (Mertens et al., 2007) in Matlab. The actual values of the weights are standard for contrast , saturation , but differs for well-exposedness, where the mid range (the parameter of the Gaussian distribution modelling it) are and . The choices are based on maximizing the objective metrics and will be further explained in Sections 6.1 and 6.3.
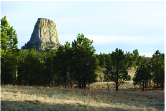
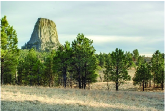
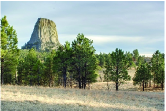
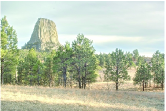
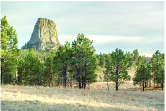
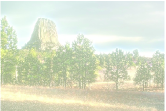
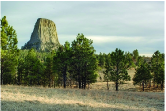
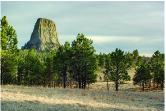
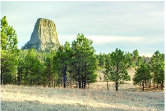
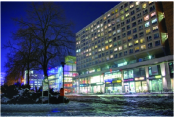
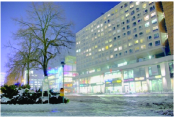
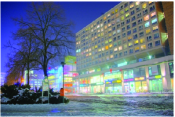
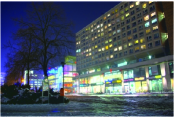
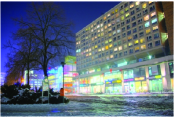
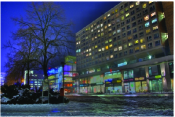
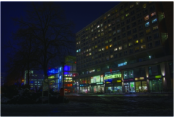
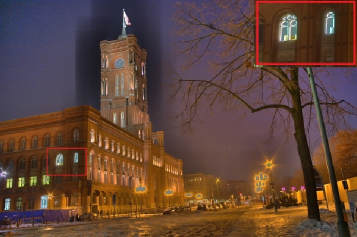
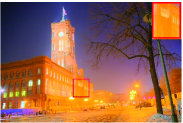
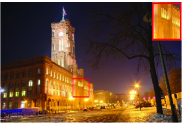
An example of the achieved extended dynamic range image may be seen in Fig. 3.
The common practice is to evaluate HDR methods using few publicly available images. We adopted the same principle, using more extensive public imagery data, such as the ones from (Čadík et al., 2008), OpenCV examples library and from (Drago et al., 2003). We have evaluated the proposed algorithm on a database containing 22 sets of HDR frames acquired from various Internet sources, being constrained by the fact that the proposed method requires also the original frames and not only the HDR image. We made public111The code and supplementary results are available at http://imag.pub.ro/common/staff/cflorea/LIP the full results and the code to obtain them so to encourage other people to further test it.
| (a) | (b) | (c) | (d) | (e) | (f) HDR |
Evaluation
The problem of evaluating HDR images is still open as HDR techniques includes two categories: irradiance map fusion which aims at correctness and exposure fusion which aims at pleasantness. As mentioned in Section 2.2, the irradiance map is physically supported and typical evaluation is performed with objective metrics that are inspired from human perception. Thus the evaluation with such objective metrics will show how realistic is one method (i.e. how closely is the produced image to the human perception of the scene).
On the other hand, the exposure fusion methods inspired from (Mertens et al., 2007) are much simpler, and produce results without physically motivation, but which are visually pleasant for the average user; consumer applications further process these image to enhance the surreal effects which is deemed, but fake. Thus, the subjective evaluation and no-reference objective metrics that evaluate the overall appearance will positively appreciate such images, although they are not a realistic reproduction of the scene.
Thus, to have a complete understanding of a method performance, we will evaluate the achieved results with two categories of methods: subjective evaluation and evaluation based on objective metrics.
5.1 Objective Evaluation
While not unanimously accepted, several metrics were created for the evaluation of TMOs in particular and HDR images in general. Here, we will refer to the metrics introduced in (Aydin et al., 2008) and respectively the more recent one from (Yeganeh and Wang, 2013).
The metric from (Aydin et al., 2008), entitled “Dynamic Range (In)dependent Image Metrics” (DRIM) uses a specific model of the HVS to construct a virtual low dynamic range (LDR) image from the HDR reference and compares the contrast of the subject LDR image to the virtual one. In fact, the HVS model and the comparison can be merged together, so that the matching is between the subject LDR image and the HDR reference, skipping the virtual LDR image. The comparison takes into consideration three categories: artificial amplification of contrast, artificial loss of contrast and reversal of contrast. The metric points to pixels that are different from their standard perception according to the authors aforethought HVS modelling and a typical monitor setting (, 30 pixels per degree and viewing distance of 0.5m). For each test image we normalized the error image by the original image size (as described in (Ferradans et al., 2012)). The metric only assigns one type of error (the predominant one) and has two shortcomings: it heavily penalizes global amplification error (which is not so disturbing from a subjective point of view) and it merely penalizes artifacts (such as areas with completely wrong luminance), which, for a normal viewer, are extremely annoying. Thus the metric, in fact, assigns a degree of perceptualness (in the sense of how close is that method to the human contrast transfer function) to a certain HDR method.
A more robust procedure for evaluation was proposed in (Yeganeh and Wang, 2013) where, in fact, three scores are introduced:
-
•
Structural fidelity, , which uses the structural similarity image metric (SSIM) (Wang et al., 2004) to establish differences between the LDR image and the original HDR one and a bank of non-linear filters based on the human contrast sensitivity function (CSF) (Barten, 1999). The metric points to structural artifacts of the LDR image with respect to the HDR image and has a 0.7912 correlation with subjective evaluation according to Yeganeh et al. (2013).
-
•
Statistical naturalness, gives a score of the closeness of the image histogram to a normal distribution which was found to match average human opinion.
-
•
Overall quality, which integrates the structural fidelity, , and statistical naturalness, , by :
(9) where , , as found in (Yeganeh and Wang, 2013). The metric has 0.818 correlation with human opinion.
The structural fidelity appreciates how close a TMO to the CSF function, thus is theoretical oriented measure, while the structural fidelity is subjective measure and shows how close is a TMO to the consumer preferences.
5.2 Subjective evaluation
On the subjective evaluation, for HDR images, Čadík et al. (Čadík et al., 2008) indicated the following criteria as being relevant: luminosity, contrast, color and detail reproduction, and lack of image artifacts. The evaluation was performed in two steps. First we analyzed comparatively, by means of example, the overall appearance and existence of artifacts with respect to the five named criteria in the tested methods; next, we followed with subjective evaluation where an external group of persons graded the images.
To perform the external evaluation, we instructed 18 students in the 20-24 years range to examine and rank the images on their personal displays, taking into account the five named criteria. We note that the students follow computer science or engineering programme, but they are not closely related to image processing. Thus, the subjective evaluation could be biased towards groups with technical expertise.
The testing was partially blind: the subjects were aware of the theme (i.e. HDR), but they were not aware about the source of each image. While we introduced them to a method for monitor calibration and discussed aspects about view angle and distance to monitor, we did not impose them as strict requirements since the average consumer does not follow rigorous criteria for visualization. Thus, the subjective evaluation was more related to how appealing an image is.
6 Results
6.1 Algorithm parameters
To determine the best parameters of the proposed method we resorted to empirical validation.
Logarithmic Model. The first choice of the proposed method is related to the specific Logarithm Image Processing model used. While we discuss this aspect by means of an example shown in Fig. 4, top row (b-d), we have to stress that all the results fall in the same line. The LTIP model provides the best contrast, while the classical LIP model (Jourlin and Pinoli, 1987) leads to very similar results, with marginal differences like slightly flatter sky and less contrast on the forest. The symmetrical model (Patrascu and Buzuloiu, 2001) produces over–saturated images. Given the choice between our solution and the one based on (Jourlin and Pinoli, 1987), as differences are rather small, the choice relies solely on the perceptual motivation detailed in Section 4.
Next, given the parametric extension of the LTIP model from (Florea and Florea, 2013), we asked which is the best value for the parameter . As shown in Fig. 4, bottom row (e-h), the best visual results are obtained for , which corresponds to the original LTIP model. Choices different from use direct or inverse transformations that are too concave and, respectively, too convex, thus distorting the final results. Also, the formulas become increasingly complex and precise computation more expensive. Concluding, the best results are achieved with models that are closer to the human perception.
 |
 |
 |
 |
| (a) Normally exposed frame | (b) LTIP, | (c) LIP | (d) symmetrical LIP |
 |
 |
 |
 |
| (e) LTIP, | (f) LTIP, | (g) LTIP, | (h) LTIP, |
Algorithm weights. In Section 4 we nominated three categories of weights (contrast – , saturation and well-exposedness) that interfere with the algorithm. For the first two categories, values different from standard ones ( and ) have little impact.
The well-exposedness, which is described by mainly the central value of the ”mid range” has significant impact. As one can see in Fig. 5, the best result is achieved for while for larger values () the image is too bright and, respectively, for smaller ones () is too dark. While a produced similar results, the objective metrics reach the optimum in . Changing the variance also has little impact. These findings were confirmed by objective testing, as further showed in Section 6.3.
 |
 |
 |
 |
| (a) | (b) | (c) | (d) |
6.2 Comparison with state of the art
To test against various state of the art methods, we used the HDR irradiance map (stored as .hdr file) which was either delivered with the images (and typically produced using the method from (Robertson et al., 1999)), or produced with some online available code222The HDR creator package is available at http://cybertron.cg.tu-berlin.de/pdci09/ hdr_tonemapping/download.html.
For comparative results we considered the exposure fusion in the variant modified according to (Mertens et al., 2007) and (Zhang and Cham, 2012) using the author released code and the TMOs applied on the .hdr images described in (Ward et al., 1997), (Fattal et al., 2002), (Durand and Dorsey, 2002), (Drago et al., 2003), (Reinhard et al., 2005), (Krawczyk et al., 2005) and (Banterle et al., 2012) as they are the foremost such methods. The code for the TMOs is taken from the Matlab HDR Toolbox (Banterle et al., 2011) and is available online333The HDR toolbox may be retrieved from http://www.banterle.com/hdrbook/downloads/ HDR_Toolbox_current.zip. The implemented algorithms were optimized by the Toolbox creators to match with initial article reported results and for better performance; hence, we used the implicit values for the algorithms parameters. We note that envisaged TMO solutions include both global operators and local adaptation. A set of examples with the results produced with all the methods is presented in Fig. 6.
 |
 |
 |
 |
| (a) Proposed | (b) Pece and Kautz (2010) | (c) Banterle et al. (2012) | (d)Krawczyk et al. (2005) |
 |
 |
 |
 |
| (e) Reinhard et al. (2005) | (f) Drago et al. (2003) | (g) Durand et al. (2002) | (h) Fattal et al. (2002) |
6.3 Objective metrics
| Method | [%] | [%] | [%] |
| Ward et al. (1997) | 66.9 | 14.38 | 72.7 |
| Fattal et al. (2002) | 59.9 | 6.4 | 61.0 |
| Durand et al. (2002) | 81.7 | 41.0 | 85.4 |
| Drago et al. (2003) | 82.3 | 50.2 | 87.0 |
| Reinhard et al. (2005) | 83.1 | 50.5 | 87.5 |
| Krawczyk et al. (2005) | 71.7 | 36.8 | 76.6 |
| Banterle et al. (2012) | 83.7 | 52.1 | 87.8 |
| Mertens et al. (2007) | 81.7 | 64.2 | 89.4 |
| Zhang et al. (2012) | 77.6 | 59.7 | 83.4 |
| Proposed, | 81.0 | 39.2 | 84.5 |
| Proposed, | 81.6 | 52.1 | 87.3 |
| Proposed, | 81.5 | 57.4 | 88.0 |
| Proposed, | 81.4 | 53.7 | 87.4 |
Structure and Naturalness. We started the evaluation using the set of three objective metrics from (Yeganeh and Wang, 2013). The results obtained are presented in Table 3. The best performing version of the proposed method was for .
The proposed method, when compared with various TMOs, ranked first, according to the overall quality and statistical naturalness, and it rank fifth according to structural fidelity (after (Banterle et al., 2012), (Reinhard et al., 2005), (Drago et al., 2003), (Durand and Dorsey, 2002)). Our method was penalized when compared to other TMO due to their general adaptation being closer to the standard contrast sensitivity function (CSF) (Barten, 1999). Yet we stress that some TMOs (Krawczyk et al., 2005) or (Banterle et al., 2012) work only for calibrated images in specific scene luminance domain.
When compared with other exposure fusion methods (Mertens et al., 2007) and (Zhang and Cham, 2012), it ranked second for the overall quality after (Mertens et al., 2007). This is an expected results as standard exposure fusion was build to match subjective opinion score as the envisaged metrics did too. Yet the proposed method outperformed the overall performance of the exposure fusion introduce in (Zhang and Cham, 2012). Furthermore a more recent algorithm, namely the ExpoBlend (Bruce, 2014) reports the overall quality on two image that we used too (”Memorial” and ”Lamp”). On these images, the proposed method outperformed ExpoBlend: on ”Memorial” we reach 95.5% compared to 93.2%, while on ”Lamp” we reach 90.1% compared to 89.4% reported in (Bruce, 2014).
Furthermore, the proposed method is the closest to the standard exposure fusion result (Mertens et al., 2007), which is currently the state of the art method for consumer applications while building HDR images. This aspect is shown in Table 4, where we computed the natural logarithm of the Root-Mean-Square to the image resulting from the standard exposure fusion and, respectively, the structural similarity when compared to the same image.
| Method | logRMSE[dB] | SSIM |
| Ward et al. (1997) | 149.9 | 83.5 |
| Fattal et al. (2002) | 281.1 | 38.1 |
| Durand et al. (2002) | 160.5 | 74.4 |
| Drago et al. (2003) | 148.4 | 74.7 |
| Reinhard et al. (2005) | 148.4 | 74.8 |
| Krawczyk et al. (2005) | 136.9 | 66.4 |
| Banterle et al. (2012) | 147.9 | 75.2 |
| Proposed | 72.1 | 93.8 |
Perceptualness. One claim of the current paper is that the proposed method adds perceptualness to the exposure fusion. To test this, we compared our method against the standard exposure fusion, (Mertens et al., 2007) using the perceptual DRIM metric from (Aydin et al., 2008). Over the considered database, the proposed method produced an average total error (the sum of three categories) with 2% smaller than the standard exposure fusion (64.5% compared to 66.8%). On individual categories, the proposed method produced a smaller amount of amplification of contrast, with comparable results on loss and reversal of contrast. Thus, overall, the results confirm the claim.
6.4 Artifacts
The HDR-specific objective metrics have the disadvantage of not properly weighting the artifacts that appear in images, while human observers are very disturbed by them. This fact was also pointed by (Čadík et al., 2008) and to compensate we performed visual inspection to identify disturbing artifacts. The proposed method never produced any artifact in the tested image sets. Examples of state of the art methods and artifacts produced may be seen in Fig. 7.
 |
 |
| (a) Durand et al. (2002) | (b) Proposed |
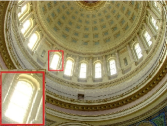
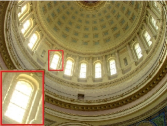
In direct visual inspection, when compared against the standard exposure fusion method (Mertens et al., 2007), our algorithm shows details in bright areas, while normal, real–based operations do not. This improvement is due to the closing property of the logarithmic addition and respectively scalar amplification. This aspect is also visible when comparing with the most robust TMO based method, namely (Banterle et al., 2012). Examples that illustrate these facts are presented in Fig. 8.
6.5 Subjective ranking
The non-experts ranked the images produced with the proposed method, standard exposure fusion, the methods from (Banterle et al., 2012), (Pece and Kautz, 2010), (Drago et al., 2003) and (Reinhard et al., 2005). Regarding the results, the proposed method was selected as the best one by 10 users, the exposure fusion (Mertens et al., 2007) by 7, while the rest won 1 case. Also the second place was monopolized by the ”glossier” exposure fusion based method.
When compared to direct exposure fusion proposed by Mertens et al. (2007), due to the perceptual nature of the proposed method, a higher percentage of the scene dynamic range is in the visible domain; direct fusion losses information in the dark-tones domain and respectively in very bright part; this is in fact the explanation for the narrow margin of our method advance.
7 Discussion and Conclusions
In this paper we showed that the LTIP model is compatible with the Naka-Rushton equation modelling the light absorption in the human eye and similar with the CRF of digital cameras. Upon these findings, we asserted that it is possible to treat different approaches to HDR imaging unitary. Implementation of the weighted sum of input frames is both characteristic to irradiance map fusion and to exposure fusion. If implemented using LTIP operations, the perceptualness is added to the more popular exposure fusion. Finally, we introduced a new HDR imaging technique that adapts the standard exposure fusion to the logarithmic type operations, leading to an algorithm which is consistent in both theoretical and practical aspects. The closing property of the LTIP operations ensures that details are visible even in areas with high luminosity, as previously shown.
The method maintains the simplicity of implementation typical to the exposure fusion, since the principal difference is the redefinition of the standard operations and different parameter values. The supplemental calculus associated with the non-linearity of LTIP operation could easily be trimmed out by the use of look-up tables, as shown in (Florea and Florea, 2013).
The evaluation results re-affirmed that in an objective assessment aiming at naturalness and pleasantness of the image, the proposed method outperforms irradiance map fusion followed by TMOs as they try to mimic more a theoretical model which is not perfect and is not how the normal user expects HDR images to look. The same conclusion was emphasized by the subjective evaluation, where methods developed in the image domain are preferred as the resulting images are more ”appealing”. The method outperformed, even by a small margin, the standard exposure fusion when evaluated with DRIM metric showing that is more HVS oriented. The proposed method, having a HVS inspired global adaptation and ”glossy” tuned local adaptation, by a narrow margin, ranks best in the subjective evaluation.
Acknowledgments
The authors wish to thank Martin Cadik for providing the frames for testing. We also would like to thank Tudor Iorga for running tests and providing valuable ideas. The work has been partially funded by the Sectoral Operational Programme Human Resources Development 2007-2013 of the Ministry of European Funds through the Financial Agreement POSDRU/159/1.5/S/134398.
References
- (1)
- Aydin et al. (2008) Aydin, T., Mantiuk, R., Myszkowski, K. and Seidel, H. (2008). Dynamic range independent image quality assessment, ACM Transactions on Graphics (TOG), Vol. 27(3), pp. 1–10.
- Banterle et al. (2011) Banterle, F., Artusi, A., Debattista, K. and Chalmers, A. (2011). Advanced High Dynamic Range Imaging: Theory and Practice, AK Peters (CRC Press), Natick, MA, USA.
- Banterle et al. (2012) Banterle, F., Artusi, A., Sikudova, E., Edward, T., Bashford-Rogers, W., Ledda, P., Bloj, M. and Chalmers, A. (2012). Dynamic range compression by differential zone mapping based on psychophysical experiments, ACM Symposium on Applied Perception (SAP), pp. 39–46.
- Barten (1999) Barten, P. G. J. (1999). Contrast Sensitivity of the Human Eye and Its Effects on Image Quality, SPIE, Washington, DC.
- Bruce (2014) Bruce, N. D. (2014). Expoblend: Information preserving exposure blending based on normalized log-domain entropy, Computers & Graphics 39: 12–23.
- Čadík et al. (2008) Čadík, M., Wimmer, M., Neumann, L. and Artusi, A. (2008). Evaluation of HDR tone mapping methods using essential perceptual attributes, Computers & Graphics 32(3): 330–349.
- Debevec and Malik (1997) Debevec, P. and Malik, J. (1997). Recovering high dynamic range radiance maps from photographs, ACM SIGGRAPH, pp. 369–378.
- Deng et al. (1995) Deng, G., Cahill, L. W. and Tobin, G. R. (1995). A study of logarithmic image processing model and its application to image enhancement, IEEE Transactions on Image Processing 4(4): 506 – 512.
- Drago et al. (2003) Drago, F., Myszkowski, K., Annen, T. and Chiba, N. (2003). Adaptive logarithmic mapping for displaying high contrast scenes, Computer Graphics Forum 22(3): 419 – 426.
- Durand and Dorsey (2002) Durand, F. and Dorsey, J. (2002). Fast bilateral filtering for the display of high-dynamic-range images, ACM Transactions on Graphics 21(3): 257 – 266.
- Fattal et al. (2002) Fattal, R., Lischinski, D. and Werman, M. (2002). Gradient domain high dynamic range compression, ACM Transactions on Graphics (TOG) 21(3): 249–256.
- Ferradans et al. (2012) Ferradans, S., Bertalmio, M., Provenzi, E. and Caselles, V. (2012). An analysis of visual adaptation and contrast perception for tone mapping, IEEE Transactions on Pattern Analysis and Machine Intelligence 33(10): 2002–2012.
- Florea and Florea (2013) Florea, C. and Florea, L. (2013). Parametric logarithmic type image processing for contrast based auto-focus in extreme lighting conditions, International Journal of Applied Mathematics and Computer Science 23(3): 637 – 648.
- Gilchrist et al. (1999) Gilchrist, A., Kossyfidis, C., Bonato, F., Agostini, T., Cataliotti, J., Li, X., Spehar, B., Annan, V. and Economou, E. (1999). An anchoring theory of lightness perception, Psychological Review 106(4): 795–834.
- Grossberg and Nayar (2004) Grossberg, M. D. and Nayar, S. K. (2004). Modeling the space of camera response functions, IEEE Transactions on Pattern Analysis and Machine Intelligence 26 (10): 1272 – 1282.
- Jourlin and Pinoli (1987) Jourlin, M. and Pinoli, J. C. (1987). Logarithmic image processing, Acta Stereologica 6: 651 – 656.
- Krawczyk et al. (2005) Krawczyk, G., Myszkowski, K. and Seidel, H.-P. (2005). Lightness perception in tone reproduction for high dynamic range images, Computer Graphics Forum, Vol. 24, pp. 635–645.
- Macmillan and Creelman (2005) Macmillan, N. and Creelman, C. (eds) (2005). Detection theory and: A user’s guide, Lawrence Erlbaum.
- Mann and Mann (2001) Mann, S. and Mann, R. (2001). Quantigraphic imaging: Estimating the camera response and exposures from differently exposed images, Porc. of IEEE Computer Vision and Pattern Recognition, Vol. 1, pp. 842–849.
- Mann and Picard (1995) Mann, S. and Picard, R. (1995). Being ’undigital’ with digital cameras: Extending dynamic range by combining differently exposed pictures, Proceedings of IS&T s 48th Annual Conference, Vol. 1, pp. 422–428.
- Markovic and Jukic (2013) Markovic, D. and Jukic, D. (2013). On parameter estimation in the bass model by nonlinear least squares fitting the adoption curve, International Journal of Applied Mathematics and Computer Science 23(1): 145 – 155.
- Mertens et al. (2007) Mertens, T., Kautz, J. and Reeth, F. V. (2007). Exposure fusion, Proceedings of Pacific Graphics, pp. 382 – 390.
- Meylan et al. (2007) Meylan, L., Alleysson, D. and Susstrunk, S. (2007). Model of retinal local adaptation for the tone mapping of color filter array images, Journal of Optical society of America, A 24: 2807 – 2816.
- Naka and Rushton (1966) Naka, K.-I. and Rushton, W. A. H. (1966). S-potentials from luminosity units in the retina of fish (cyprinidae), The Journal of Physiology 185: 587 – 599.
- Navarro et al. (2013) Navarro, L., Courbebaisse, G. and Deng, G. (2013). The symmetric logarithmic image processing model, Digital Signal Processing 23(5): 1337 – 1343.
- Panetta et al. (2011) Panetta, K., Zhou, Y., Agaian, S. and Wharton, E. (2011). Parameterized logarithmic framework for image enhancement, IEEE Transactions on Systems, Man, and Cybernetics - part B: Cybernetics 41(2): 460 – 472.
- Patrascu and Buzuloiu (2001) Patrascu, V. and Buzuloiu, V. (2001). Color image enhancement in the framework of logarithmic models, Proceedings of the 8th IEEE International Conference on Telecommunications, Vol. 1, Bucharest, Romania, pp. 199 – 204.
- Pece and Kautz (2010) Pece, F. and Kautz, J. (2010). Bitmap movement detection: Hdr for dynamic scenes, Proceedings of Conference on Visual Media Production, pp. 1–8.
- Pinoli and Debayle (2007) Pinoli, J. C. and Debayle, J. (2007). Logarithmic adaptive neighborhood image processing (LANIP): Introduction, connections to human brightness perception, and application issues, EURASIP Journal on Advances in Signal Processing 1: 114–114.
- Reinhard et al. (2002) Reinhard, E., Stark, M., Shirley, P. and Ferwerda, J. (2002). Photographic tone reproduction for digital images, ACM Transactions on Graphics 21: 267–276.
- Reinhard et al. (2005) Reinhard, E., Ward, G., Pattanaik, S. and Debevec, P. (2005). High Dynamic Range Imaging: Acquisition, Display and Image-Based Lighting, Morgan Kaufmann Publishers, San Francisco, California, S.U.A.
- Robertson et al. (1999) Robertson, M., Borman, S. and Stevenson, R. (1999). Dynamic range improvement through multiple exposures, Proceedings of International Conference on Image Processing, pp. 159 – 163.
- Stevens and Stevens (1963) Stevens, J. and Stevens, S. (1963). Brightness functions: Effects of adaptation, Jorunal of Optical Society of America A 53: 375–385.
- Stevens (1961) Stevens, S. (1961). To honor Fechner and repeal his law, Science 133: 80–133.
- Tamburino et al. (2008) Tamburino, D., Alleysson, D., Meylan, L. and Strusstruk, S. (2008). Digital camera workflow for high dynamic range images using a model of retinal process, Proceedings of SPIE, Vol. 6817.
- Valeton and van Norren (1983) Valeton, J. and van Norren, D. (1983). Light adaptation of primate cones: an analysis based on extracellular data, Vision Research 23(12): 1539 – 1547.
- Vertan et al. (2008) Vertan, C., Oprea, A., Florea, C. and Florea, L. (2008). A pseudo-logarithmic framework for edge detection, Advanced Concepts for Intelligent Vision Systems, Vol. 5259, pp. 637 – 644.
- Wang et al. (2004) Wang, Z., Bovik, A. C., Sheikh, H. R. and Simoncelli, E. P. (2004). Image quality assessment: From error visibility to structural similarity, IEEE Transactios on Image Processing 13(4): 600–612.
- Ward et al. (1997) Ward, G., Rushmeier, H. and Piatko, C. (1997). A visibility matching tone reproduction operator for high dynamic range scenes, IEEE Transactions on Visualization and Computer Graphics 3: 291–306.
- Yeganeh and Wang (2013) Yeganeh, H. and Wang, Z. (2013). Objective quality assessment of tone mapped images, IEEE Transactios on Image Processing 22(2): 657–667.
- Zhang and Cham (2012) Zhang, W. and Cham, W.-K. (2012). Gradient-directed multi-exposure composition, IEEE Transactios on Image Processing 21(4): 2318–2323.
8 Biographies
Corneliu Florea born in 1980, got his master degree from University “Politehnica” of Bucharest in 2004 and the PhD from the same university in 2009. There, he lectures on statistical signal and image processing, and has introductory courses in computational photography and computer vision. His research interests include non-linear image processing algorithms for digital still cameras and computer vision methods for portrait understanding. He is author of more than 30 peer-reviewed papers and of 20 US patents and patent applications.
Constantin Vertan Professor Constantin Vertan holds an image processing and analysis tenure at the Image Processing and Analysis Laboratory (LAPI) at the Politehnica University of Bucharest. For his contributions in image processing he was awarded with UPB ”In tempore opportuno” award (2002), Romanian Research Council ”In hoc signo vinces” award (2004) and was promoted as IEEE Senior Member (2008). His research interests are: general image processing and analysis, content-based image retrieval, fuzzy and medical image processing applications. He authored more than 50 peer-reviewed papers. He is the secretary of the Romanian IEEE Signal Processing Chapter and associate editor at EURASIP Journal on Image and Video Processing.
Laura Florea received her PhD in 2009 and M.Sc in 2004 from University “Politehnica” of Bucharest. From 2004 she teaches classes in the same university, where she is currently a Lecturer. Her interests include image processing algorithms for digital still cameras, automatic understanding of human behavior by analysis of portrait images, medical image processing and statistic signal processing theory. Previously she worked on computer aid diagnosis for hip joint replacement. She is author of more than 30 peer-reviewed journal and conference papers.