11email: shahzaman@ph1.uni-koeln.de 22institutetext: Max-Planck-Institut für Radioastronomie, Auf dem Hügel 69, 53121 Bonn, Germany 33institutetext: Department of Physics and Astronomy, University of California, Los Angeles, CA 90095, USA 44institutetext: Astronomical Institute, Academy of Sciences, Boc̆ní II 1401, CZ-14131 Prague, Czech Republic 55institutetext: Institut de Recherche en Astrophysique et Planetologie (IRAP) Université de Toulouse, CNRS Observatoire Midi-Pyrénées (OMP) 14, avenue Edouard Belin F-31400 Toulouse, France
Polarized light from Sgr A* in the near-infrared -band ††thanks: Based on NACO observations collected between 2004 and 2012 at the Very Large Telescope (VLT) of the European Organization for Astronomical Research in the Southern Hemisphere (ESO), Chile
We present a statistical analysis of polarized near-infrared (NIR) light from Sgr A*, the radio source associated with the supermassive black hole at the center of the Milky Way. The observations have been carried out using the adaptive optics instrument NACO at the VLT UT4 in the infrared -band from 2004 to 2012. Several polarized flux excursions were observed during these years. Linear polarization at 2.2 , its statistics and time variation, can be used constrain the physical conditions of the accretion process onto this supermassive black hole. With an exponent of about 4 for the number density histogram of fluxes above 5 mJy, the distribution of polarized flux density is closely linked to the single state power-law distribution of the total -band flux densities reported earlier. We find typical polarization degrees of the order of 20%10% and a preferred polarization angle of 13o15o. Simulations show the uncertainties under a total flux density of are probably dominated by observational effects. At higher flux densities there are intrinsic variations of polarization degree and angle within rather well constrained ranges. Since the emission is most likely due to optically thin synchrotron radiation, this preferred polarization angle we find is very likely coupled to the intrinsic orientation of the Sgr A* system i.e. a disk or jet/wind scenario associated with the super massive black hole. If they are indeed linked to structural features of the source the data imply a rather stable geometry and accretion process for the Sgr A* system.
Key Words.:
black hole physics: general, infrared: general, accretion, accretion disks, Galaxy: center, nucleus, statistical1 Introduction
Sagittarius A* (Sgr A*) is a bright and compact radio source associated with a supermassive black hole (MBH ) located at the center of our galaxy (Eckart & Genzel 1996, 1997; Eckart et al. 2002; Schödel et al. 2002; Eisenhauer et al. 2003; Ghez et al. 1998, 2000, 2005, 2008; Gillessen et al. 2009) which is the best example of a low-luminosity galactic nucleus accessible to observations. Sgr A* shows time variability in high spatial resolution observations in the Near-infrared (NIR) and X-ray regime compared to a lower degree of variability in the radio to sub-mm domain. The NIR counterpart to Sgr A* shows short bursts of increased radiation which can occur four to six times per day and last about 100 minutes.
Analyzing the polarization of the electromagnetic radiation can help us to reveal the nature of emission processes detected from Sgr A*. Therefore, this source has been observed since 2004 in the polarimetric imaging mode with NACO using its Wollaston prism (Eckart et al. 2006a; Meyer et al. 2006a, b; Eckart et al. 2008a; Zamaninasab et al. 2010; Witzel et al. 2012). Multi-wavelength observations have been conducted by different research groups to study the spectral energy distribution (SED) and the variable emission process of Sgr A* from the radio to the X-ray domain (Baganoff et al. 2001; Porquet et al. 2003; Genzel et al. 2003; Eckart et al. 2004, 2006a, 2006b, 2006c, 2008a, 2008b, 2008c; Meyer et al. 2006a, b, 2007; Yusef-Zadeh et al. 2006b, a, 2007, 2008; Dodds-Eden et al. 2009; Sabha et al. 2010; Eckart et al. 2012). Observations at and wavelengths using the Hubble Space Telescope (HST) (Yusef-Zadeh et al. 2009) indicate that the activity of Sgr A* is above the noise level more than 40% of the time. The highly polarized NIR flux density excursions have usually X-ray counterparts which suggests a synchrotron-self-Compton (SSC) or inverse Compton emission as the responsible radiation mechanism (Eckart et al. 2004, 2006a, 2006c; Yuan et al. 2004; Liu et al. 2006; Eckart et al. 2012). Several relativistic models that successfully describe the observations presume the variability to be related to the emission from single or multiple spots close to the last stable orbit of the black hole (Meyer et al. 2006a, b, 2007; Zamaninasab et al. 2008).
Based on relativistic models, Zamaninasab et al. (2010) predict and explore a correlation between the modulations of the observed flux density light curves and changes in polarimetric data. This information should in principle allow us to constrain the spin of the black hole (assuming that the gravitational field is indeed described by the Kerr metric). However, the question of whether timescales comparable to the orbital period near the inner edge of the accretion flow (in particular, near the radius of the innermost stable orbit) play a role in the variability, was (and still remains) impossible to decide on the basis of available data. Although the geometrical effects of strong gravitational fields act on photons independently of their energy, the intrinsic emissivity of accretion discs and the influence of magnetic field are energy dependent. Therefore, the variability amplitudes of both the polarization degree and the polarization angle are expected to be energy dependent as well. These dependencies suffer from some degeneracy. These degeneracies and the interdependencies of the observables require both time-resolved observations (e.g. Zamaninasab et al. 2010) and a statistical analysis as presented here.
Witzel et al. (2012) show that the time variable NIR emission from Sgr A* can be understood as a consequence of a single continuous power-law process with a break time scale between 500 and 700 minutes. This continuous process shows extreme flux density excursions that typically last for about 100 minutes. In the following we will refer to these excursions as flares and to the fact that they occur as flaring activity. On the base of multi-wavelength observations in 2009, Eckart et al. (2012) show that the flaring activity can be modeled as a signal from a synchrotron/synchrotron-self-Compton component.
Several authors have studied the statistical properties of flaring activity of Sgr A* instead of concentrating on investigating the individual flares. Do et al. (2009) do not find quasiperiodic oscillations (QSOs), which can be related to the orbital time of the matter in the inner part of an accretion disk, against the pure red noise while probing 7 total intensity NIR light curves taken with Keck telescope. The authors also conclude that Sgr A* is continuously variable. The red power-law distribution of the variable emission at NIR can be described by fluctuations in the accretion disk (Chan et al. 2009). However, the correlation between flux density modulations and changes in the degree of polarization, the delayed sub-mm emission, and the spectral energy distribution show that the emission is coming from a compact flaring region with a size close to the Schwarzschild radius. This compact region can be a jet with blobs of ejected material (Markoff et al. 2001) or a radiating hot spot(s) falling into the black hole (see e.g. Genzel et al. 2003; Dovčiak et al. 2004, 2008; Eckart et al. 2006b; Gillessen et al. 2006; Meyer et al. 2006a; Zamaninasab et al. 2010).
The statistics of NIR -band total intensity variability of Sgr A* observed from 2004 to 2009 with the VLT, has been investigated by Dodds-Eden et al. (2011). The authors interpret the time variability of Sgr A* as a two state process, a quiescent state for low fluxes (below 5 mJy) which has a log-normal distribution and a flaring state for high fluxes (above 5 mJy) that has a power-law distribution. From their analysis they claim that the physical processes responsible for the low and high flux densities from Sgr A* are different. However, their conclusions for the low flux densities are based on data at or below the detection limit, and therefore is biased by the measurements uncertainties and source crowding. On the other hand, Witzel et al. (2012) show, for their slightly larger dataset taken between 2003 and early 2010, that the variability of Sgr A* is well described by a single power-law distribution, and conclude that there is no evidence for a second intrinsic state based on the distribution of flux densities. Meyer et al. (2014) come to a similar result modeling the data by a rigorous two state regime switching time series that additionally included the information on the timing properties of Sgr A*. These results unambiguously show that in the range of reliably measurable fluxes the variability process can be described as a continuous, single state red-noise process with a characteristic timescale of several hours, without any characteristic flux density.
The analysis of the intrinsic polarization degree and polarization angle of the emission from Sgr A* and their changes during the flaring activity is another important aspect of the time variability. In this paper we analyze the most comprehensive sample of NIR polarimetric light curves of Sgr A*. In Sect. 2 we provide details about the observations and data reduction. In Sect. 3, we present the statistical analysis of polarized flux densities, a comparison with total flux densities and their distribution as provided by Witzel et al. (2012). In Sect. 4 we summarize the results and discuss their implications.
2 Observations and data reduction
All observations for this paper have been carried out with the adaptive optics (AO) module NAOS and NIR camera CONICA (together NACO; Lenzen et al. 2003; Rousset et al. 2003) at the UT4 (Yepun) at the Very Large Telescope (VLT) of the European Southern Observatory (ESO) on Paranal, Chile. We collected all -band (2.2 m) observational data of the central cluster of the Galactic Center (GC) in 13 mas pixel scale polarimetry with the camera S13 from mid-2004 to mid-2012 that have flare events. In all the selected observations the infrared wavefront sensor of NAOS was used for locking the AO loop on the NIR supergiant IRS7 with mag, located north from Sgr A*. NACO is equipped with a Wollaston prism combined with a half-wave retarder plate that provide simultaneous measurements of two orthogonal directions of the electric field vector and a rapid change between different angles of the electric field vector.
In the following we present a short summary of the reduction steps. For 2004 to 2009 we used the reduced datasets as presented in Witzel et al. (2012). The 27 May 2011 and 17 May 2012 data have not been published before and we applied an observational strategy and data reduction steps similar to Witzel et al. (2012) to these datasets. The AO correction for the 27 May 2011 and 17 May 2012 nights, was most of the time stable and in good seeing condition. We had Sgr A* and a sufficient number of flux secondary density calibrators in the innermost arcsecond. The observing dates, integration times, sampling rate and mean flux densities of the data sets used for our analysis are presented in Table 1.
| Date | Start | Stop | Length | Number of | Maximum flux | Average | Integration |
|---|---|---|---|---|---|---|---|
| frames | density | sampling rate | time | ||||
| (UT time) | (UT time) | (min) | (mJy) | (min) | (sec) | ||
| 13.06.2004 | 07:54:22.95 | 09:15:08.79 | 80.76 | 70 | 3.17 | 1.17 | 20 |
| 30.07.2005 | 02:07:36.13 | 06:21:40:41 | 254.07 | 187 | 8.94 | 1.36 | 30 |
| 01.06.2006 | 06:39:49.16 | 10:44:27.63 | 378.41 | 244 | 14.5 | 1.55 | 30 |
| 15.05.2007 | 05:29:55.42 | 08:31:48.45 | 181.88 | 116 | 16.7 | 1.58 | 40 |
| 17.05.2007 | 04:24:14.84 | 09:34:40.15 | 292.42 | 192 | 9.78 | 1.53 | 40 |
| 25.05.2008 | 06:05:20.32 | 10:35:38.65 | 270.31 | 250 | 10.25 | 1.085 | 40 |
| 27.05.2008 | 04:52:04.92 | 08:29:38.07 | 217.55 | 184 | 4.32 | 1.18 | 40 |
| 30.05.2008 | 08:24:33.51 | 09:45:25.69 | 80.87 | 80 | 12.39 | 1.023 | 40 |
| 01.06.2008 | 06:04:51.56 | 10:10:26.78 | 245.59 | 240 | 7.08 | 1.027 | 40 |
| 03.06.2008 | 08:37:23.56 | 09:58:58.85 | 81.59 | 80 | 10.02 | 1.032 | 40 |
| 18.05.2009 | 04:37:55.08 | 10:19:54.10 | 341.98 | 286 | 12.53 | 1.19 | 40 |
| 27.05.2011 | 04:49:39.82 | 10:27:25.65 | 337.77 | 334 | 7.55 | 1.2 | 45 |
| 17.05.2012 | 04:49:20.72 | 09:52:57.08 | 303.62 | 256 | 6.64 | 1.2 | 45 |
All the exposures were sky subtracted, flat fielded and bad pixel corrected. We used lamp flat fields, instead of sky flat fields to avoid polarimetric effects produced by the sky. Since the exposures were dithered, all the polarization channels (0°, 45°, 90°, 135°) of the individual data set were aligned with using a cross-correlation method with sub-pixel accuracy (Devillard 1999). The Point Spread Functions (PSFs) were extracted from the images with the IDL routine Starfinder (Diolaiti et al. 2000) using isolated stars close to Sgr A*. We used the Lucy-Richardson algorithm to deconvolve the images.
Image restoration was done by convolving the deconvolved images with a Gaussian beam of a FWHM of about 60 mas corresponding to the diffraction limit at .
2.1 Flux density calibration
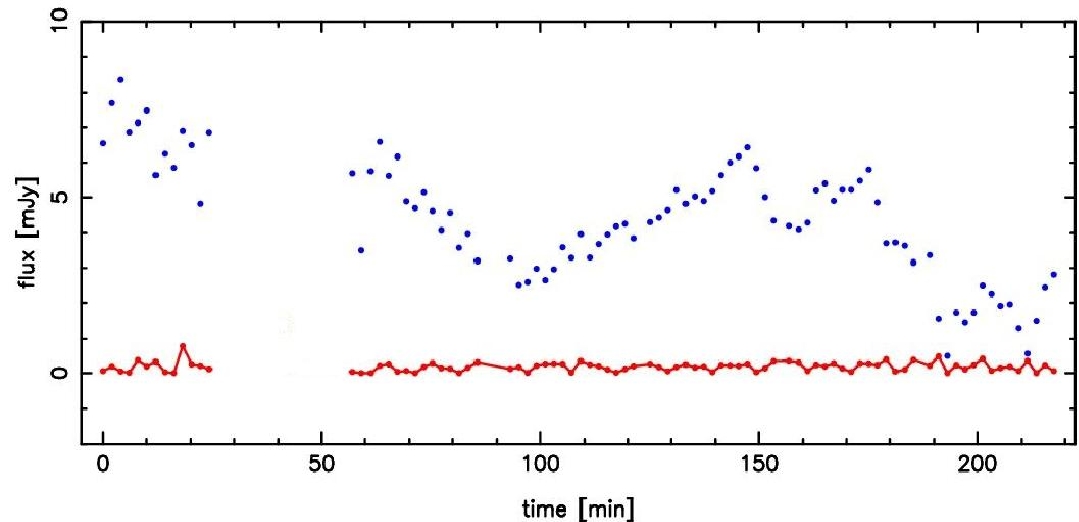
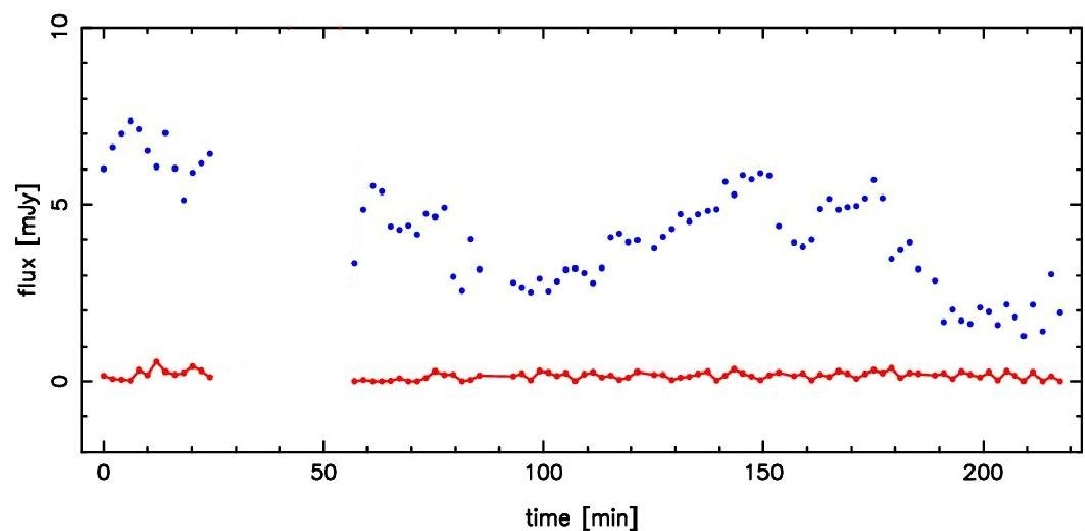
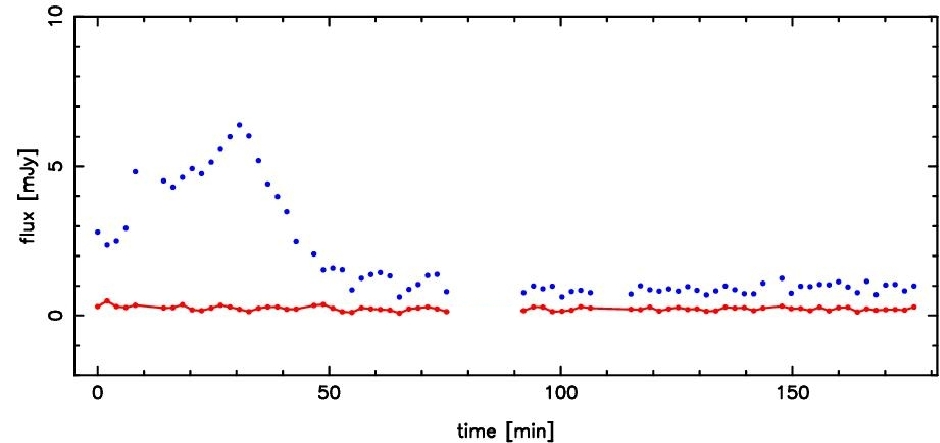
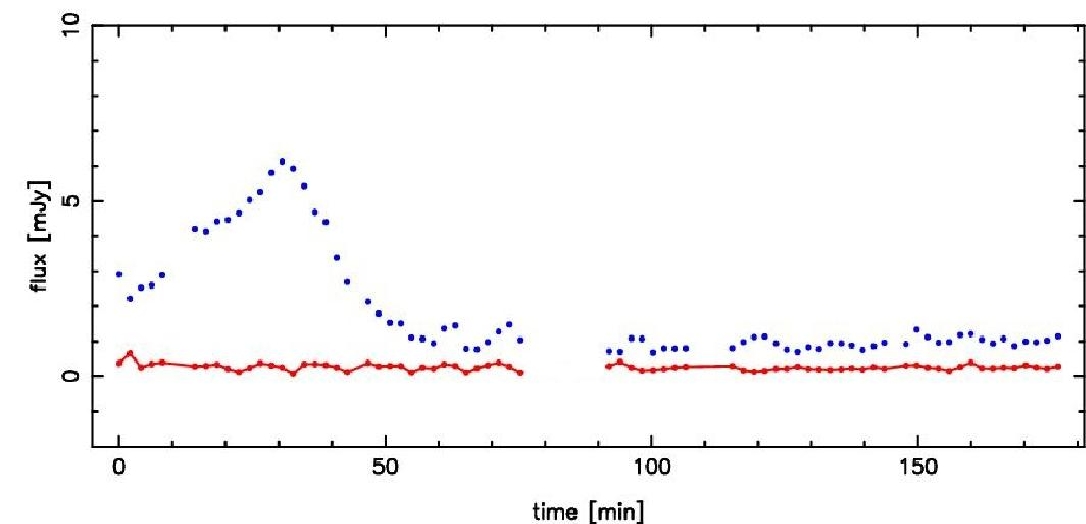
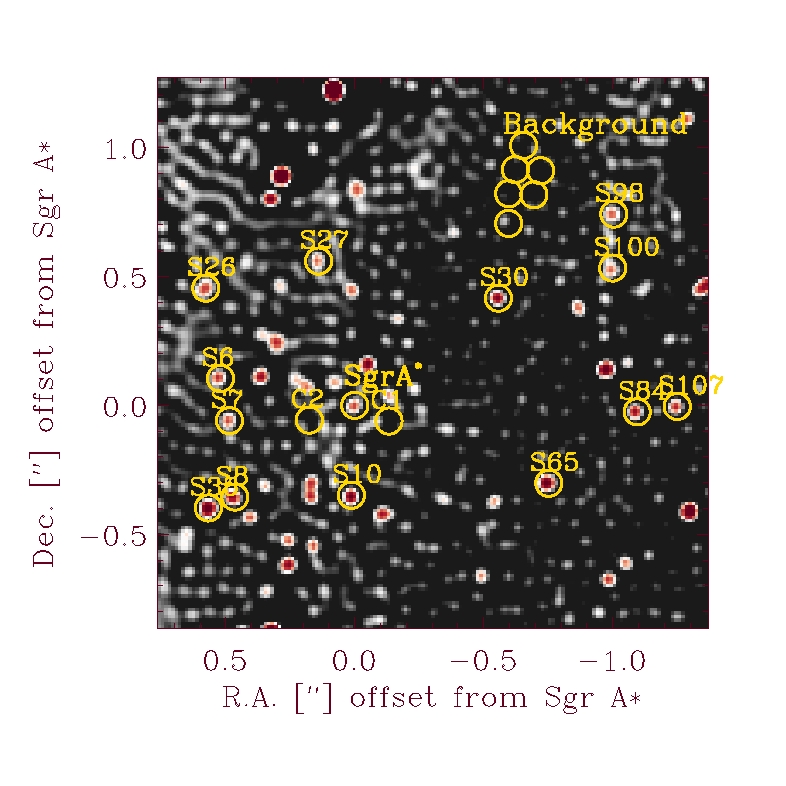
We measured the flux densities of Sgr A* and other compact sources in the field by aperture photometry using circular apertures of 40 mas radius. The flux density calibration was carried out using the known -band flux densities of 13 S-stars (Schödel et al. 2010). Furthermore, 6 comparison stars and 8 background apertures placed at positions where no individual sources are detected. For more details about the positions of the apertures and the list of calibrators see Figure 2 of this paper and Table 1 in Witzel et al. (2012). To get the total flux densities we added up the photon counts in each aperture and then added the resultant values of two orthogonal polarimetry channels. These values were corrected for the background contribution. We calculated the flux densities of the calibrators close to Sgr A* and also at the position of Sgr A* and then corrected them for extinction using , derived for the inner arcsecond by Schödel et al. (2010). Applying aperture photometry on all frames, results in the light curves obtained for Sgr A* in two orthogonal channels for 27 May 2011 and 17 May 2012 data, as shown in Fig.1.
The gaps in the measurements are due to AO reconfiguration or sky measurements. For 27 May 2012 data the flux density of Sgr A* varied between about 5 and 10 mJy over the entire observing run. For 17 May 2012 data, over the first 50 minutes, the flux density of Sgr A* increased to about 7 mJy and then decreased again.
Fig.2 shows a -band deconvolved image of the Galactic Center on 17 May 2012. The image is taken with the ordinary beam of the Wollaston prism. The positions of Sgr A*, calibration stars and comparison apertures for background estimates are shown. For comparison see also Fig.1 from 30 September 2004 by Witzel et al. (2012). Source identification has been done using the nomenclature by Gillessen et al. (2009).
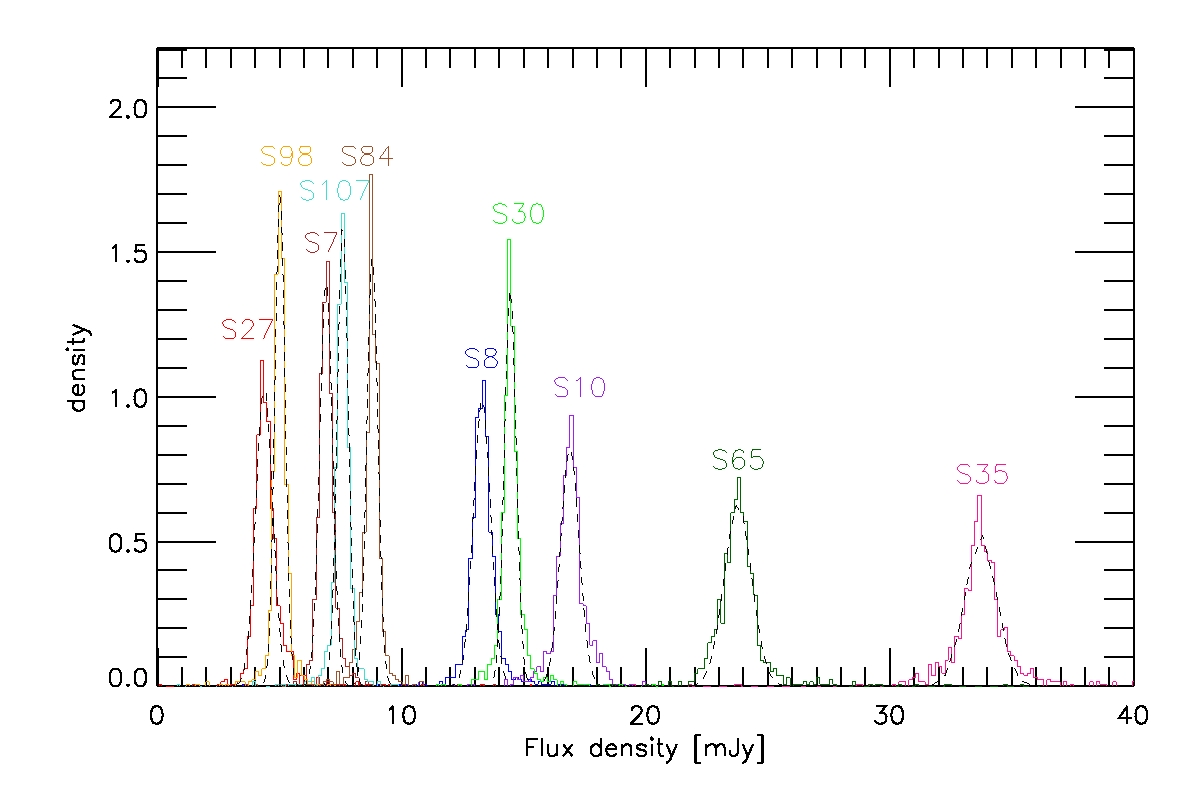
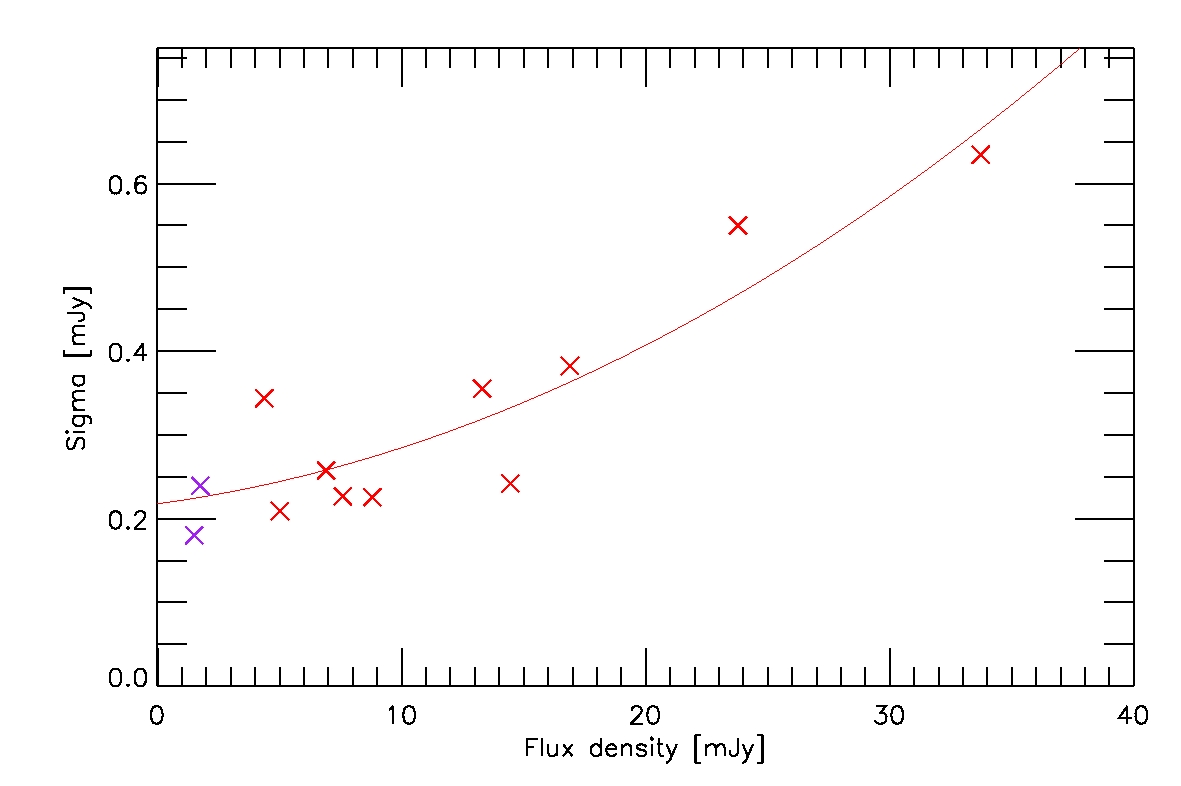
The flux density of Sgr A* was calculated from the flux densities measured in the four different polarization channels and corrected for possible background contributions. The top panel of Fig.3 shows the measured flux density distributions of different calibration stars close to Sgr A* fitted by Gaussian functions. The scatter of the flux densities around the mean value originates from the observational uncertainties and can be estimated from these fits. The standard deviations of the Gaussians fitted to the distributions are presented as a function of the mean flux density in the bottom panel of Fig.3. The function that best describes the dependency of values with the flux densities up to 33 mJy is a second degree polynomial that tends to be flatter at small flux density values. The measured flux densities and scatter of the two background apertures (C1 and C2 in Fig.2) have been added to the plot and included the fit. The uncertainties up to 10 mJy total flux are 0.25 mJy and are mostly introduced by a combination of a variation in the AO performance, imperfectly subtracted PSF seeing halos of surrounding, brighter stars and differential tilt jitter. Within the uncertainties and for a total flux density value below 10 mJy this relation is in good agreement with that found by Witzel et al. (2012) using a larger sample of total flux density measurements shown in their Fig.7. However, our data shows 20% to 25% narrower flux density distributions at higher flux values around 30 mJy. This is due to the fact that polarization data tend to be observationally biased towards higher Strehl values compared to AO imaging in standard ’observer mode’, i.e. without selection of preferred atmospheric conditions. The result shown in Fig.3 also implies that statements on the source intrinsic total or polarized flux density of Sgr A* can only be made with certainty if the total flux density is significantly larger than the limit of 0.25 mJy.
2.2 Polarimetry
Using non-normalized analog-to-digital converter (ADC) values from the detector (see details in Witzel et al. 2011)
to obtain normalized stokes parameters we can derive the polarization degree and angle:
| (1) |
| (2) |
| (3) |
| (4) |
| (5) |
Where , , and are the four polarimetric channels flux densities with , and , being pairs of orthogonally polarized channels. The variable represents the total flux density and and are the Stokes parameters. No information on the circular polarization in Stokes is available with NACO, hence the circular polarization is assigned to zero (see Witzel et al. 2011) for a detailed discussion). The quantity is the degree of polarization and is the polarization angle which is measured from the North to the East and samples a range between 0∘ and 180∘. We compute the polarized flux density as the product of the degree of polarization and the total flux density. Uncertainties for F, Q, U and the obtained p and were determined from the flux density uncertainties. Since NACO is a Nasmyth focus camera-system, instrumental effects can influence our results and a careful calibration is needed. Witzel et al. (2011) used the Stokes/Mueller formalism to describe the instrumental polarization. Their analytical model applies Mueller matrices to the measured Stokes parameters to get the intrinsic Stokes parameters. We used their model to diminish the systematical uncertainties of polarization angles and degrees caused by instrumental polarization to about and respectively. Foreground polarization has been obtained for the stars in the innermost arcsecond to Sgr A* (see e.g. Buchholz et al. 2013), but its value is of course not known for the exact line of sight towards Sgr A* itself. With the current instrumentation it is not possible to clearly disentangle line of sight effects from the foreground polarization produced by the stars close to Sgr A*.
Since the Galactic center region is very crowded (Sabha et al. 2012), confusion with stellar sources can happen in determining the flux density of Sgr A*. To eliminate this confusion in order to be able to compare the polarized flux densities of different years without offsets, we subtract the minimum flux density of the four polarization channels from the flux densities of the corresponding channels for each data set and then obtain the polarization degrees and polarized flux densities of our data sample. Here we assume that the polarized flux density contributions of confusing stars are on the same level as the foreground polarization. Therefore, subtracting the minimum of all four channels in each epoch is conservative. Moreover, subtraction of the faint stellar contribution was needed to compare the polarized flux density distribution with the total flux density distribution in Witzel et al. (2011). The mentioned change in the flux densities did not significantly affect the value of polarization angle.
3 Data analysis
In Fig.4 we show the light curves that represent all flaring activities observed in NIR -band by NACO in polarization mode. Typical strong flux density excursions last for about 100 minutes. The changes in total flux density, polarization degree and polarization angle are more apparent when bright flare states occur. Although the flare events are different in terms of the maximum flux density, it is interesting to investigate if there are preferred values or ranges of values for the polarization degree and angle that are independent of the flare flux density.
The flux density uncertainties for our statistical analysis are determined via the relation shown in Fig.3 and we use the results of our analysis presented in the following for determining the uncertainties of the polarization degree and angle.


3.1 Expected statistical behaviour of polarization measurements
In order to adequately present and interpret the data we need to know what the expected statistical behavior of polarization measurements is. The polarization statistics has been studied by several authors, e.g. Serkowski (1958, 1962); Vinokur (1965); Simmons & Stewart (1985); Naghizadeh-Khouei & Clarke (1993); Clarke (2010). From Eq. 4 it is clear that the polarization degree is a positive quantity, that takes values between zero and one (or equivalently ). The uncertainties in and , which in our case are the result of observational noise in the polarization channels, biases the value of . This leads to an overestimation of at low signal-to-noise () measurements. In general, polarimetric observations require a higher compared to photometric measurements. To first order the of the total intensity is related to that of the polarized intensity like , where the degree of polarization is usually smaller than one. As a result, weak polarization signal can be detected in case of having high (Trippe 2014).
The polarization degree distribution does not follow a Gaussian distribution in the presence of random noise except for large . In Sect. 2.1, we showed that total intensity measurements of stars around Sgr A* are, in very good approximation, Gaussian distributed; this means that the noise in the polarization channels must have the same distribution. Hence, and follow Cauchy distributions that, at medium , can already be approximated by normal distributions around the intrinsic values and . In this case, and assuming that and are independent variables with associated variances equal to , the polarization-degree distribution for a particular value of the intrinsic polarization degree can be described by a Rice distribution
| (6) |
where is the zero-order Bessel function of the imaginary argument (Serkowski 1958; Vinokur 1965) . Simmons & Stewart (1985) studied the bias on the observed value of for different defined as (see their Fig. 1). The most probable observed value of is the peak of the distribution, which is always larger than for low , and approaches the intrinsic value with increasing . At low , the polarization-angle distribution is multimodal with a spread that covers the whole range of possible values of . At medium and under the same assumptions as previously, the probability distribution for a particular intrinsic polarization angle is symmetric around its most probable value, and depends on the . It can be expressed as
| (7) |
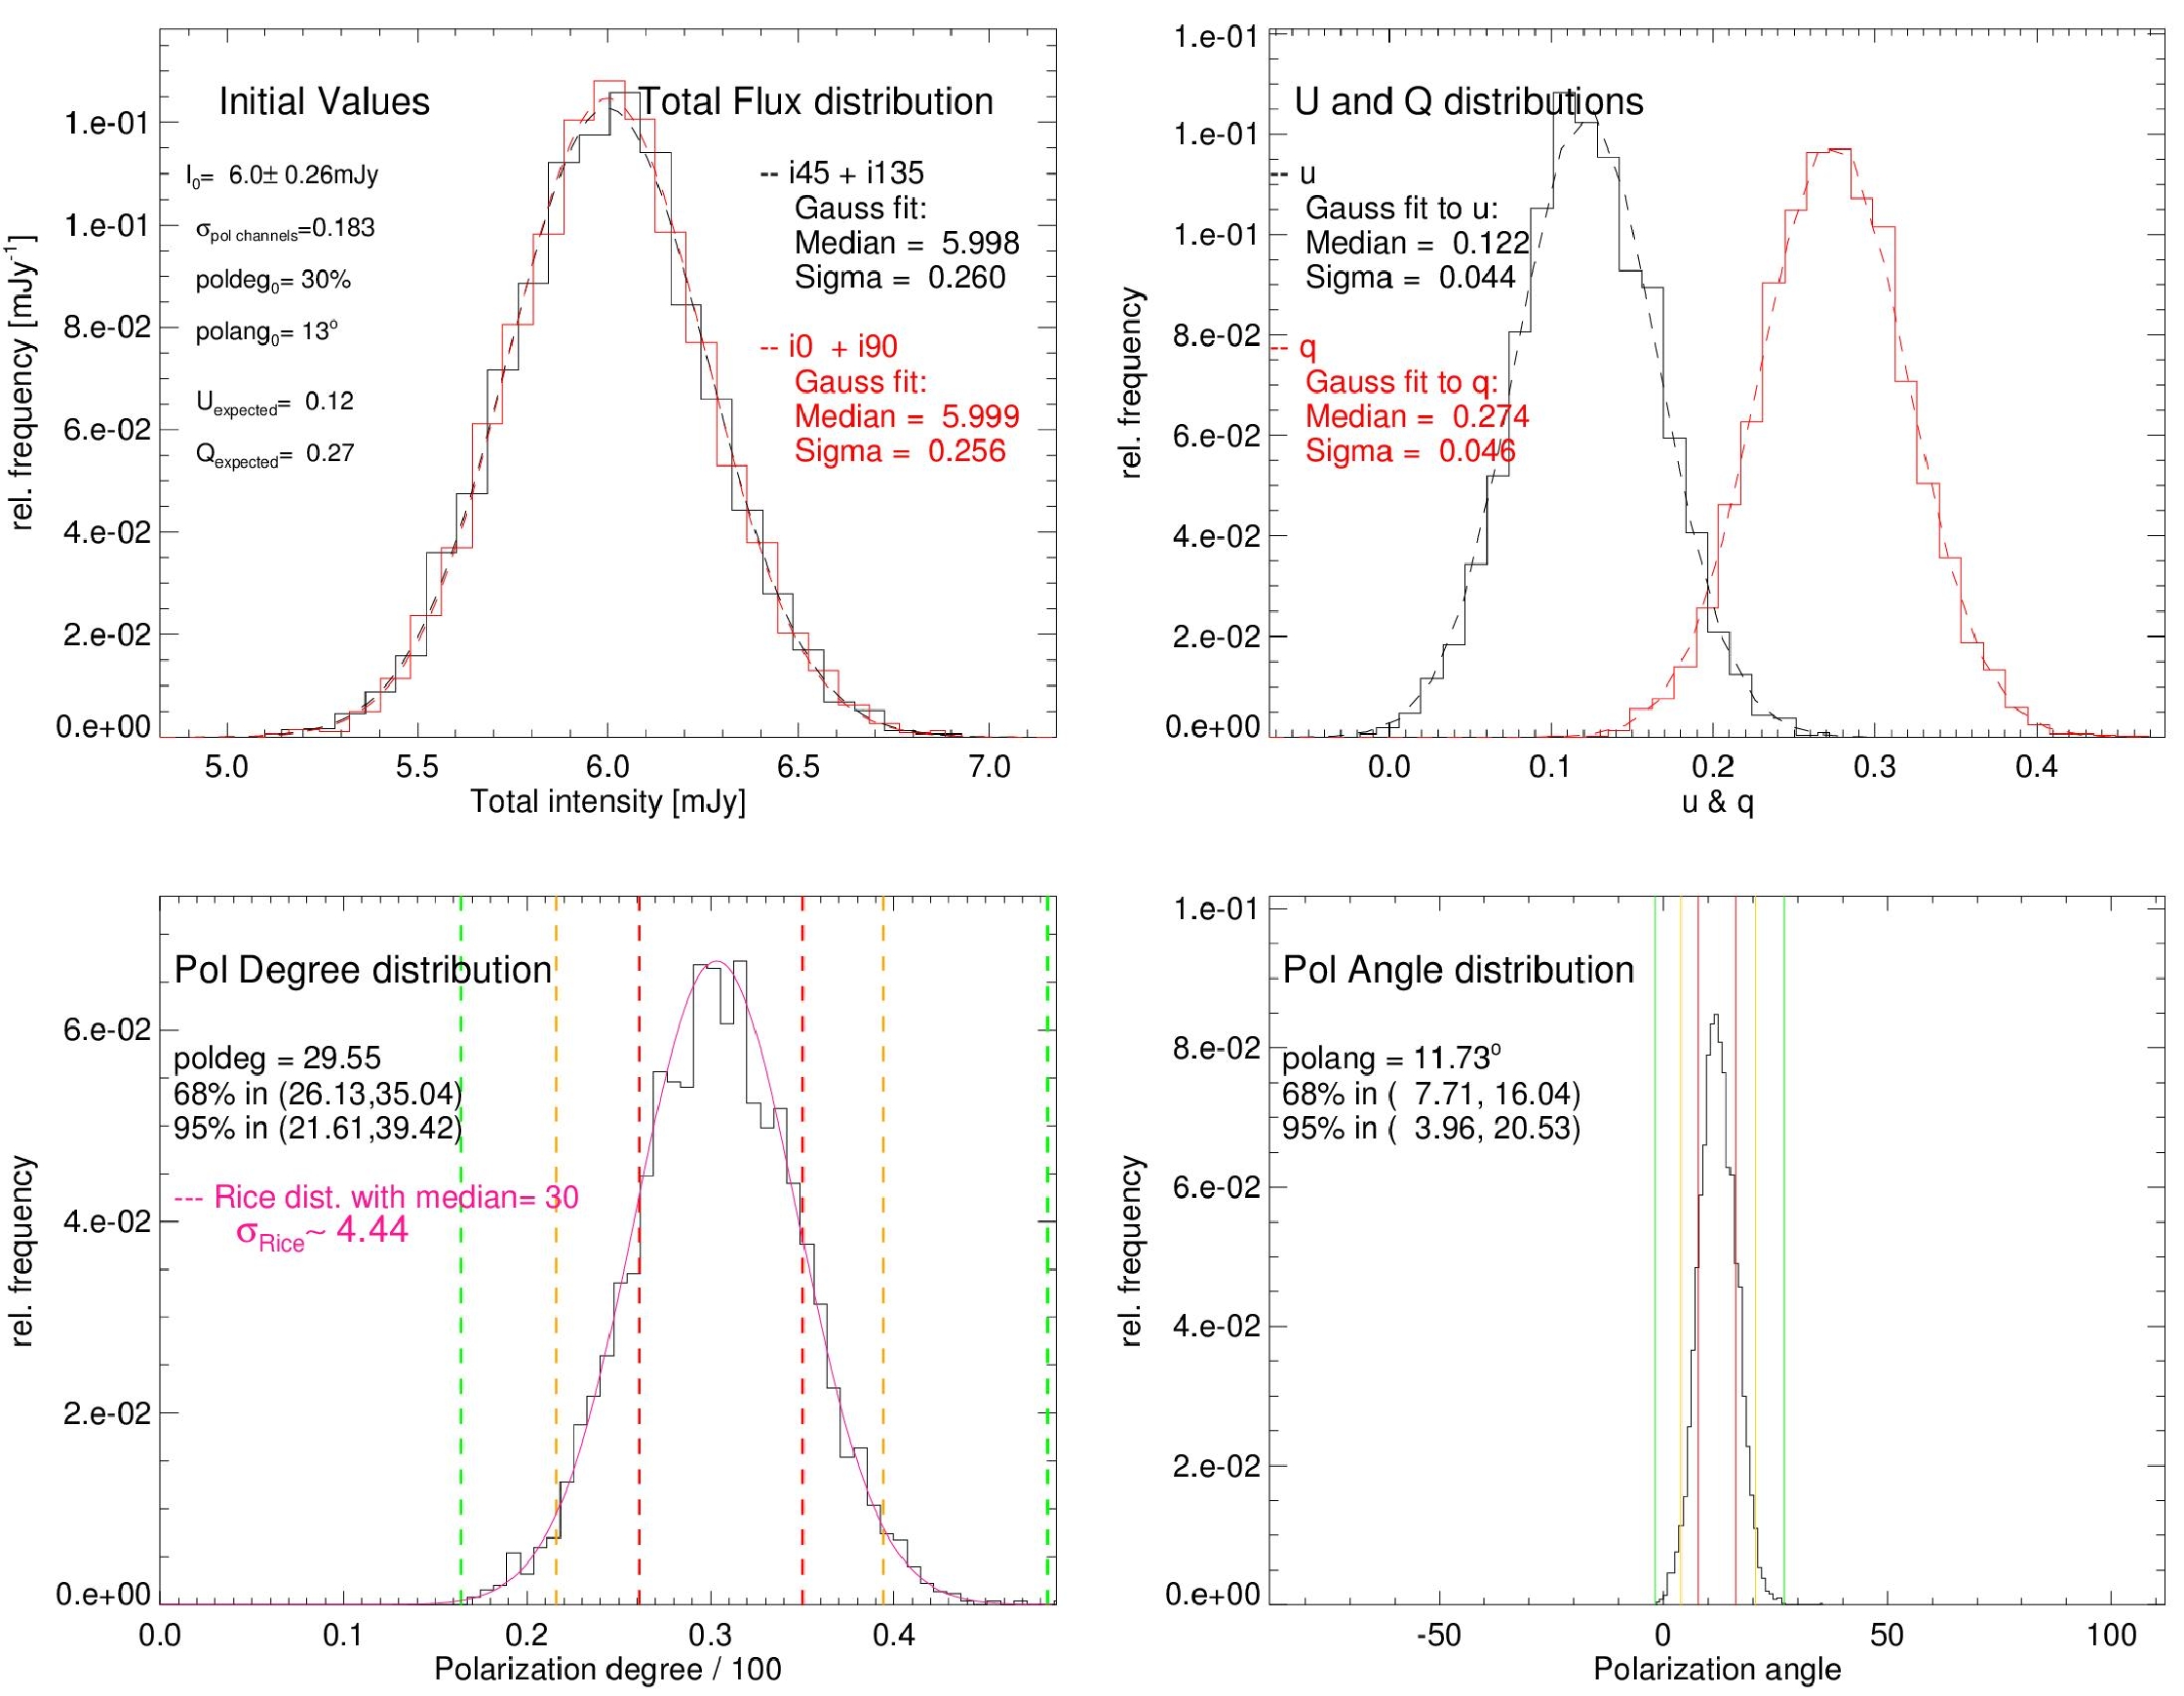
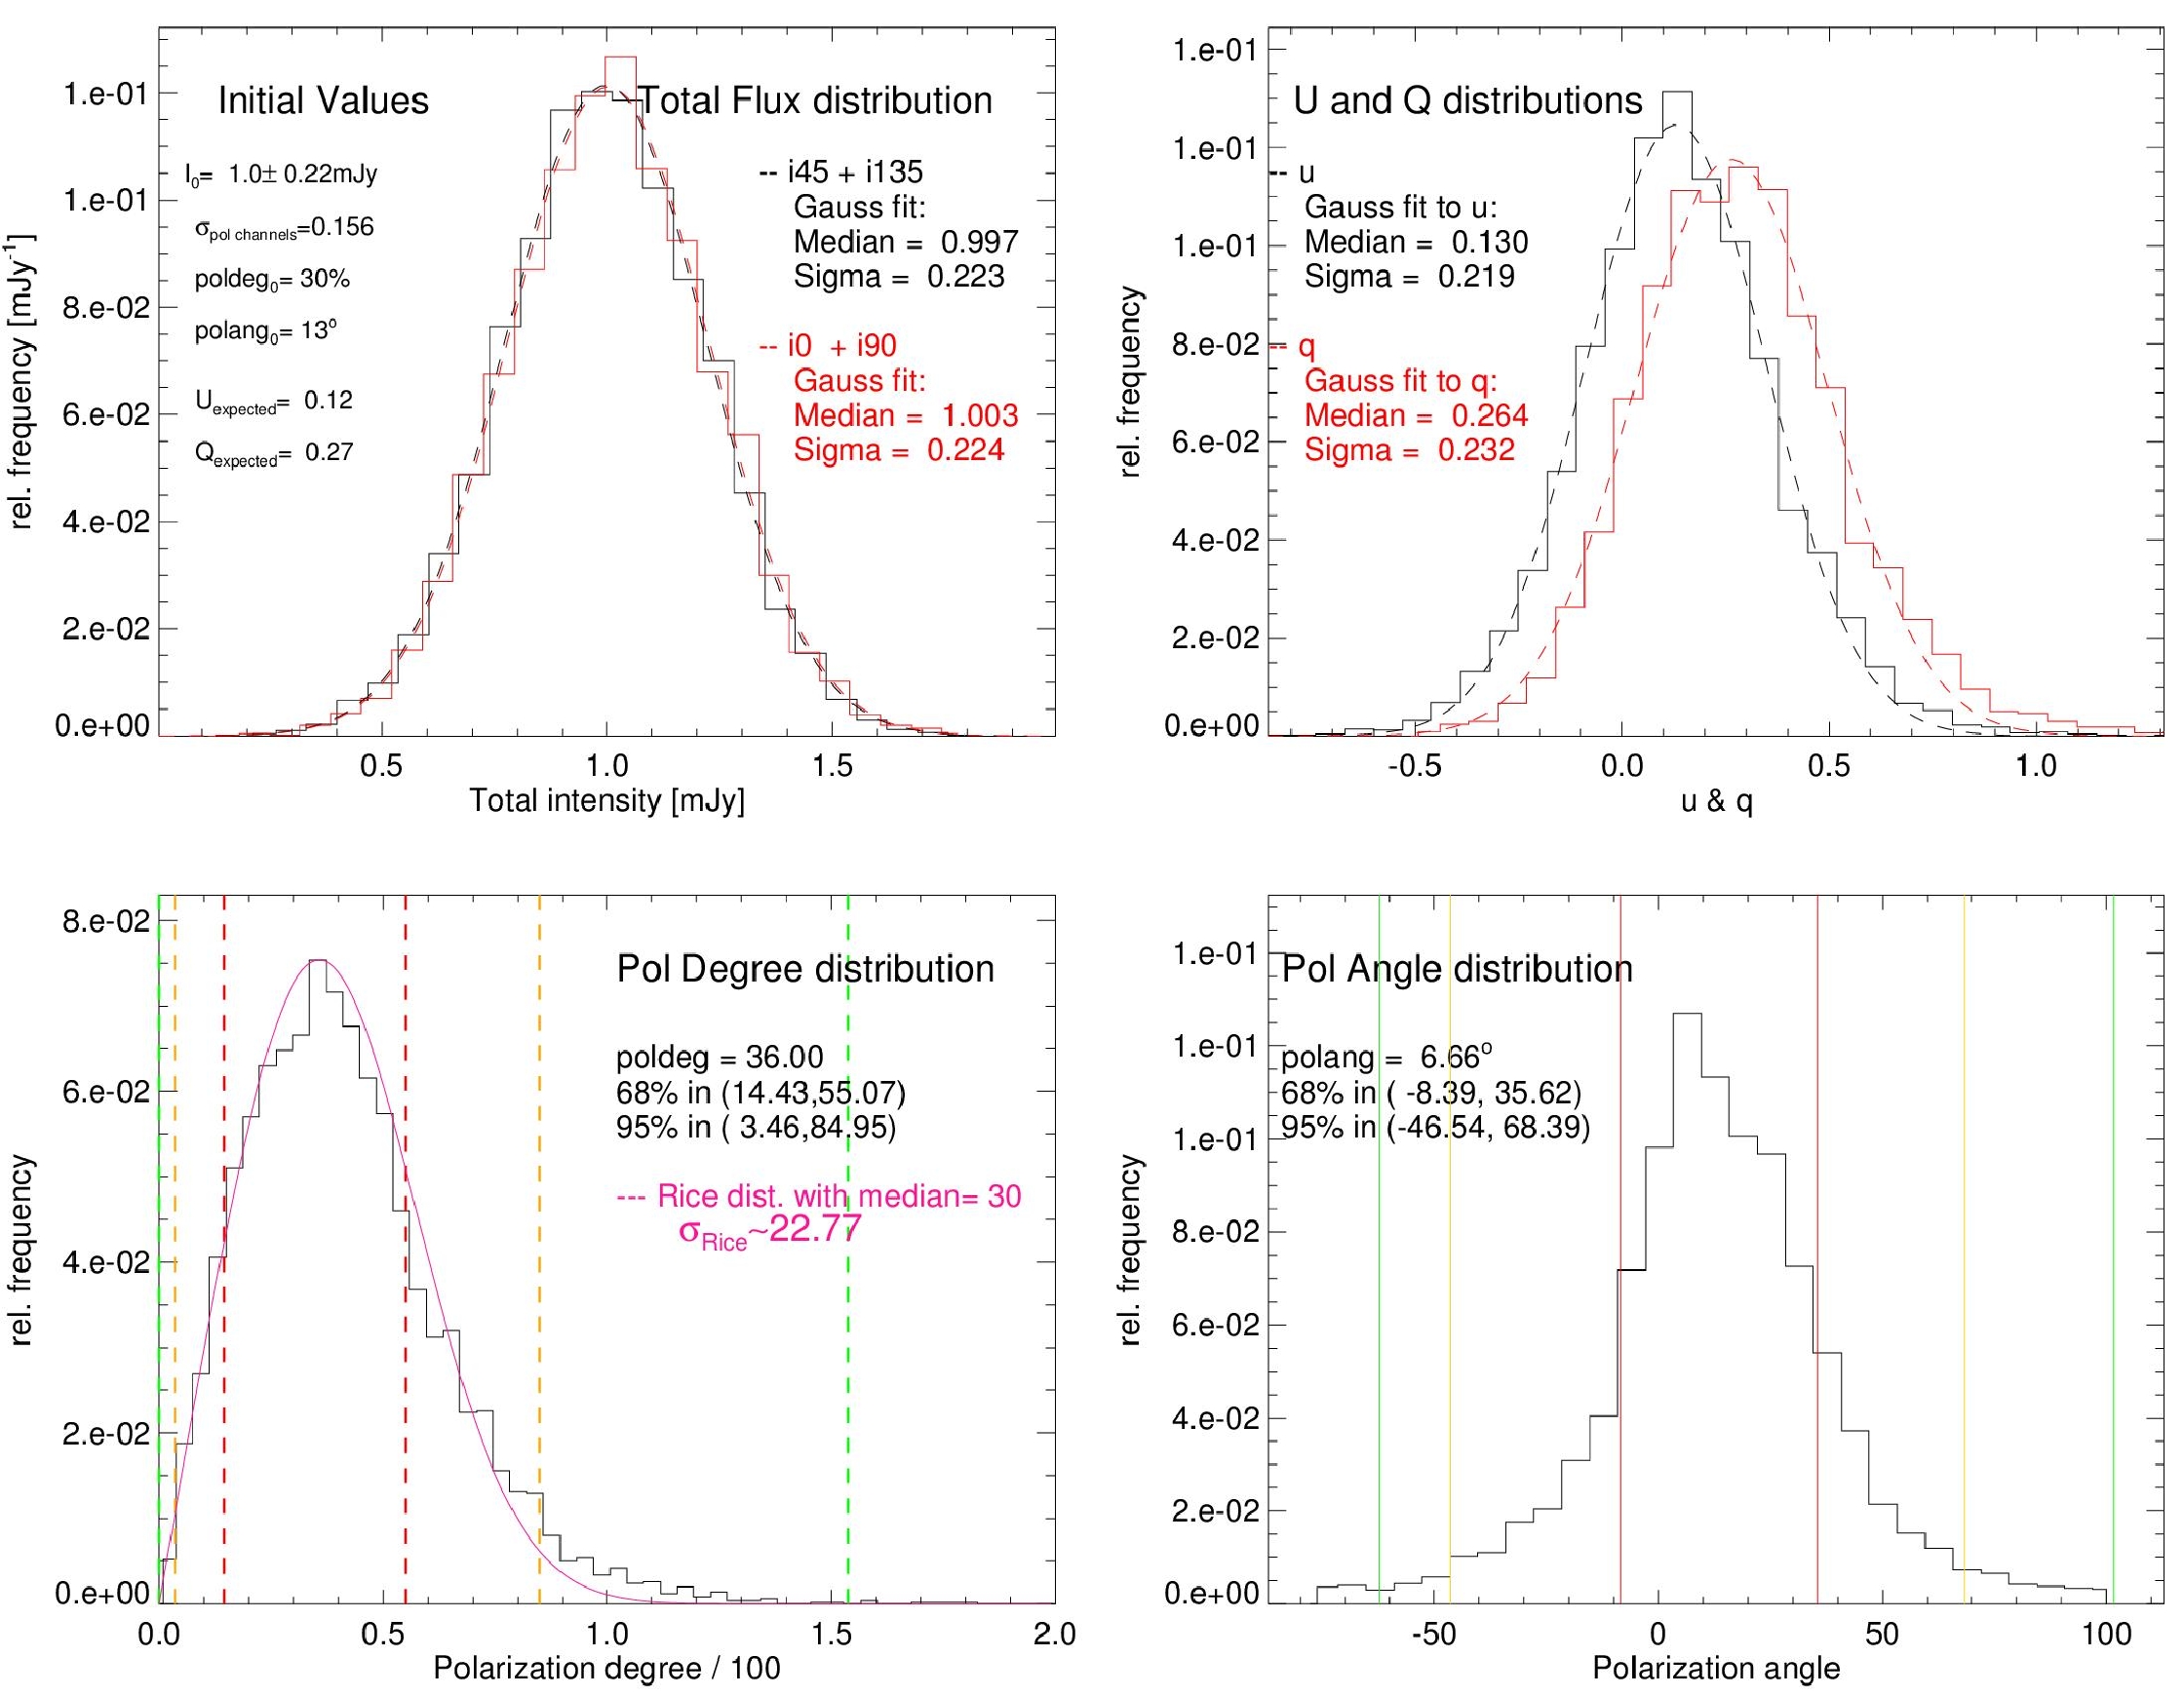
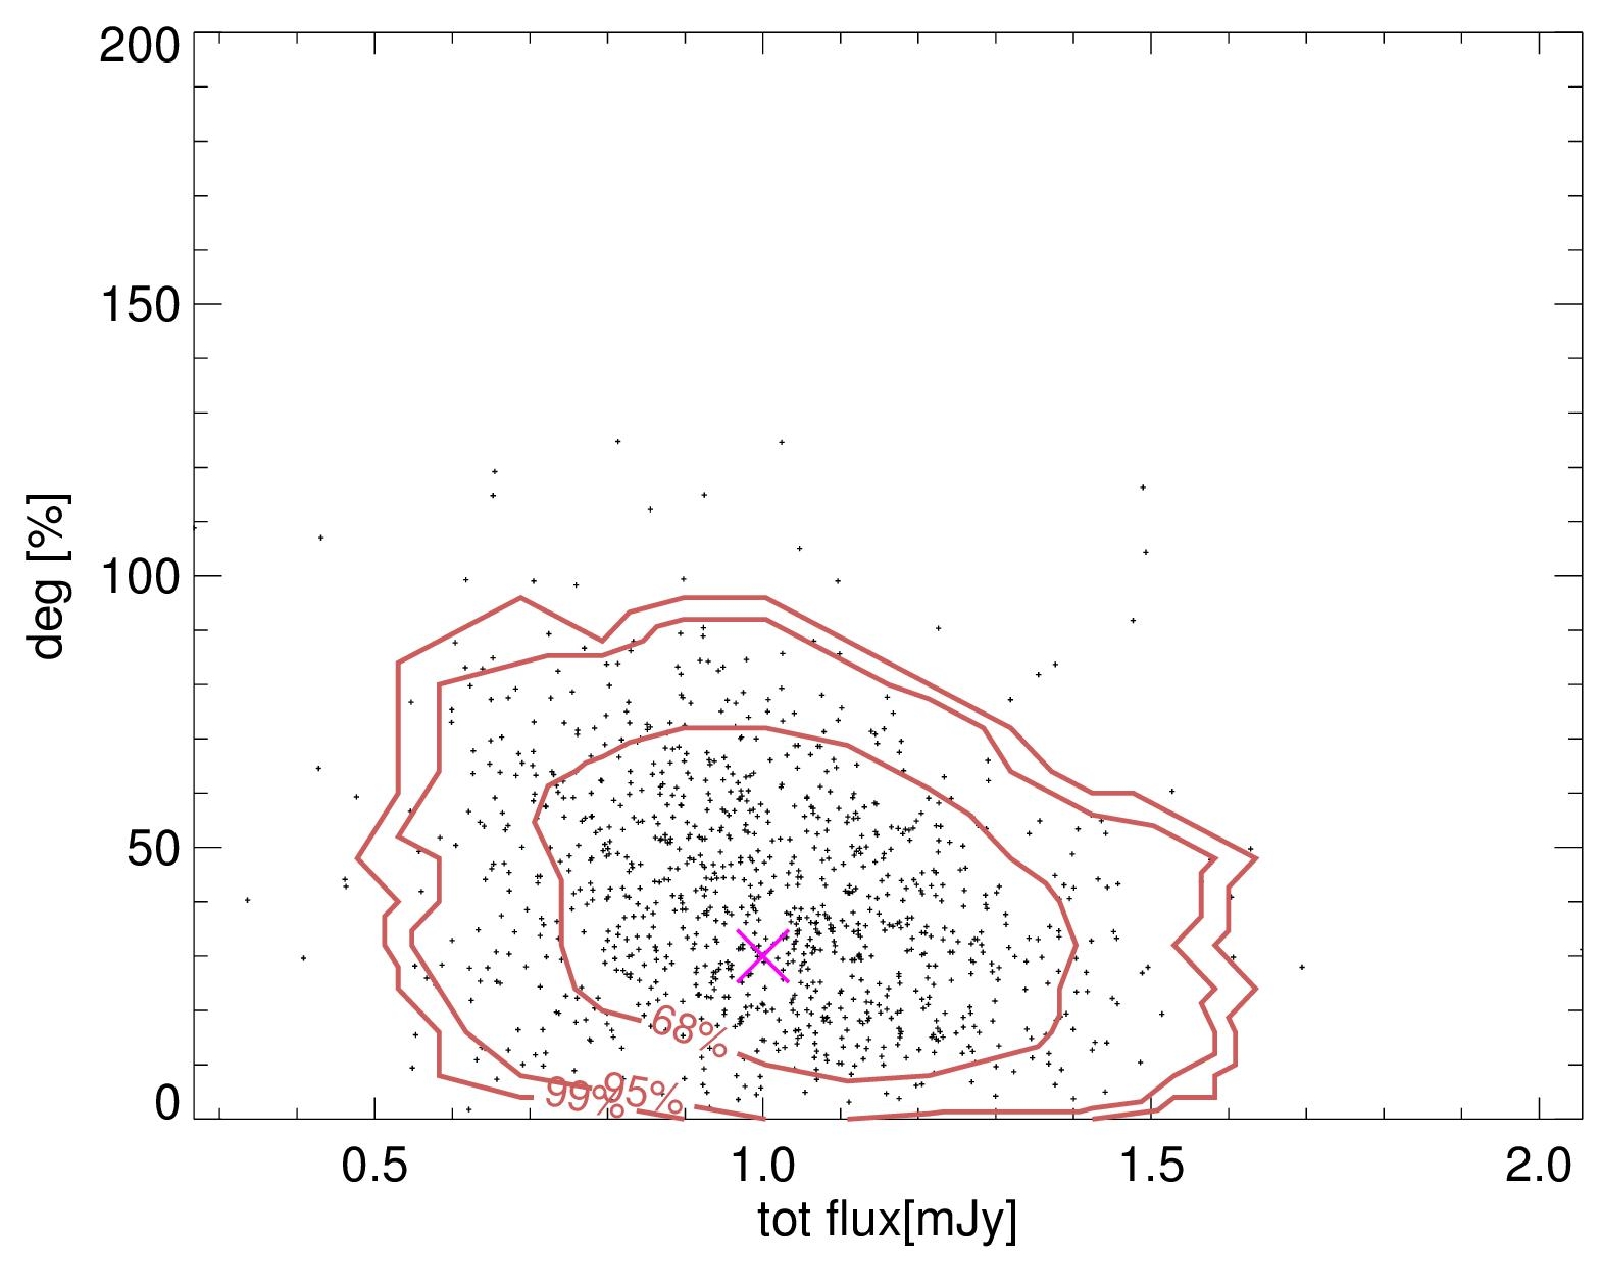
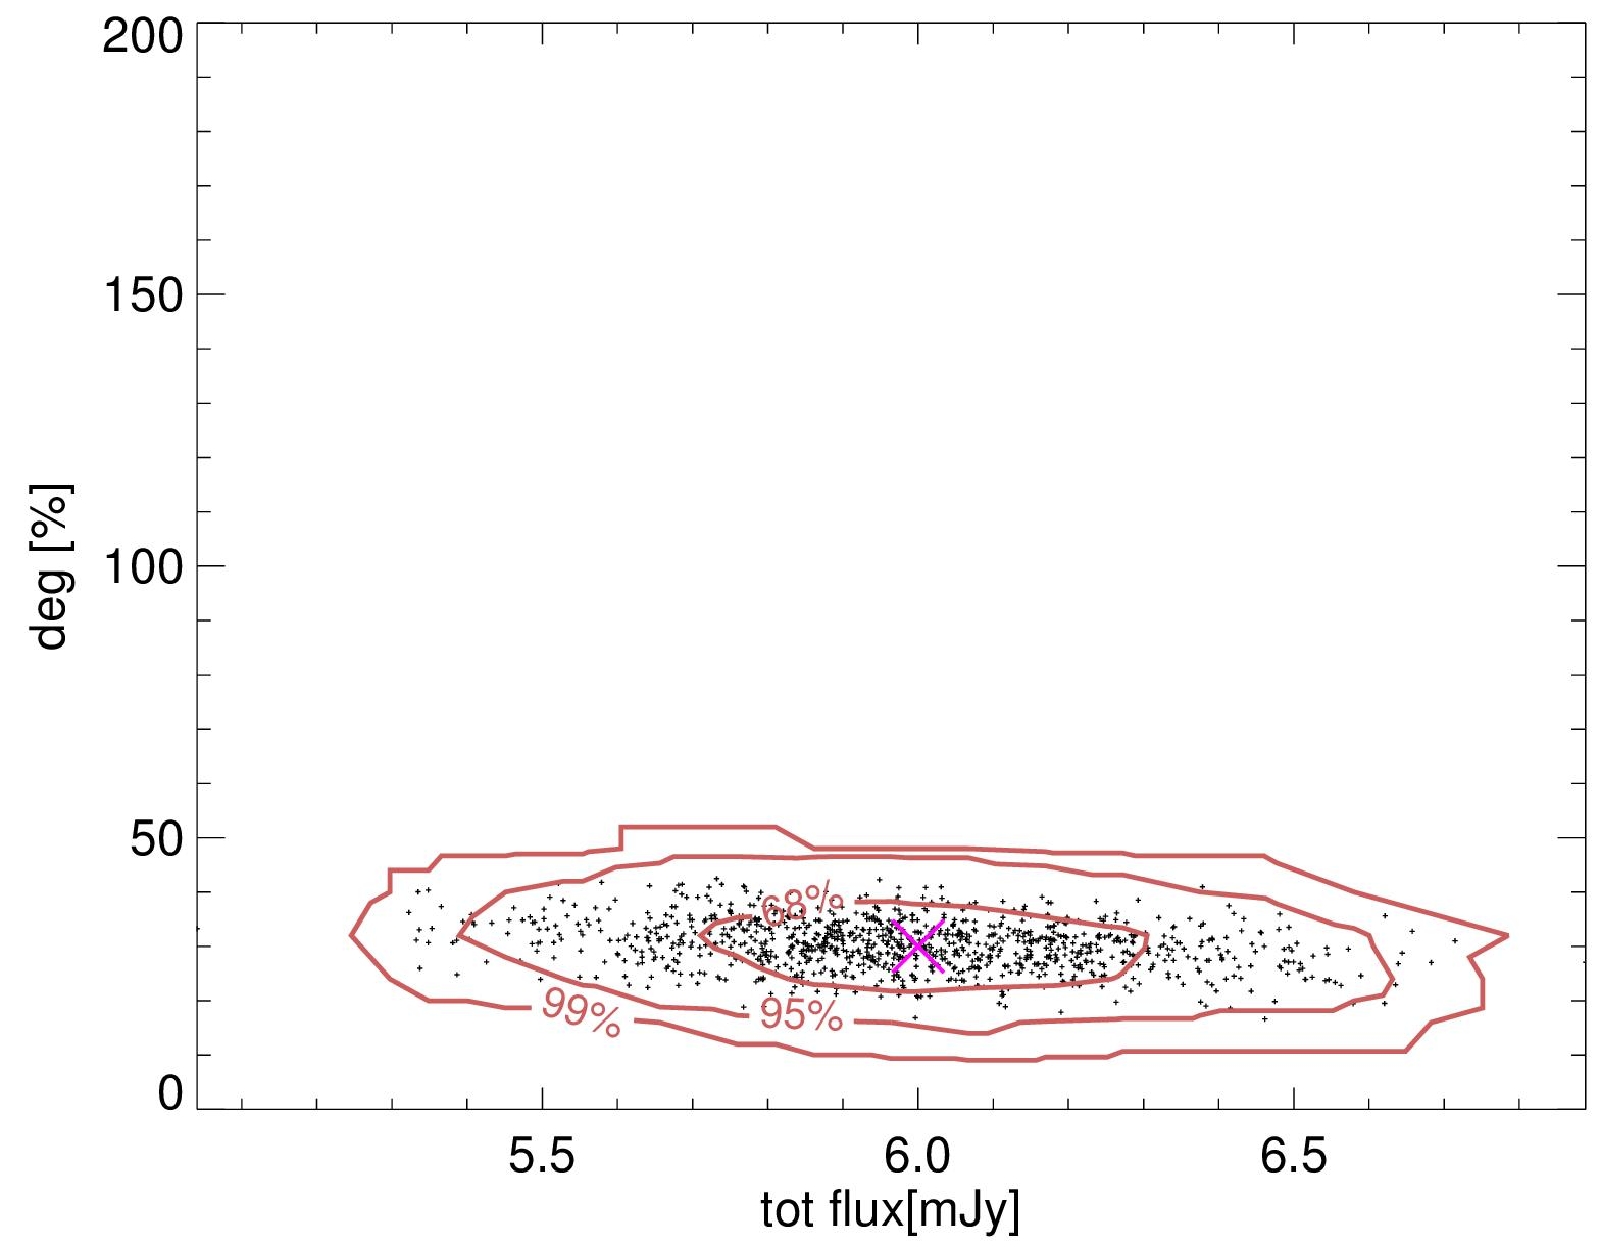
with , and “” the Gaussian error function (Vinokur 1965; Naghizadeh-Khouei & Clarke 1993). When is high, the distribution tends toward a Gaussian distribution with standard deviation (radians), where the dispersion in the polarization degree is (Serkowski 1958, 1962). Simmons & Stewart (1985) and Stewart (1991) have proposed several methods to remove the bias in the observed measurements for a source with a constant polarization state. However, whether this condition is fulfilled in the case of Sgr A* is unknown. Furthermore, there are scenarios that predict variability of its intrinsic polarization degree and angle. Therefore, without any apriori assumptions on the polarization properties of Sgr A*, it is necessary to follow the propagation of the uncertainties from the observables, measured quantities i.e. flux densities in the polarization channels, to the calculated polarization properties and . We performed Monte Carlo simulations of the measured quantities and the observational noise, and used them to statistically analyze the calculated polarization degree and angle distributions and their uncertainties. The initial parameters of the simulation are the total flux density and its uncertainty , and the intrinsic polarization degree and angle . For each set of these parameters, the corresponding polarization-channel fluxes , and can be calculated from Eqs. (1)-(5). In order to associate an uncertainty with the flux measured in each polarization channel , we considered the relation between the total flux densities and their uncertainties presented in Sect. 2.1. Given that the distributions of are in a very good approximation Gaussian, and that the noise in each par of orthogonal polarization channels is about the same, then the standard deviation of the Gaussian function that describes the distribution of each can be expressed as , i.e. . For each set , we draw from the distributions, tetrads of polarization-channel fluxes and use them to calculate , , and , as it is done with real data. From the simulations it is possible to establish the most probable observed values of and , as well as the ranges in which certain percentages of the values are contained. We consider intrinsic total flux densities ranging from , that is the photometry detection limit (Witzel et al. 2012), to , that is approximately the maximum value in our data set. The initial values for polarization degree (the amplitude of the intrinsic polarization, ) are set to a range from 5% to 70%, while is fixed to a preferred polarization angle of , based on the following data analysis. Figures 5 and 6 show the resulting distributions of , , and for two different initial total flux values, one with medium and the other with high ratio, as an example. The distributions in the plots correspond to the values that an observer would measure for a source whose intrinsic total flux, polarization degree and polarization angle are the initial values given at beginning of the simulation. We use the limits of the intervals containing 68%, 95 % and 99% of all values as our effective 1, 2 and 3 error intervals. This gives us asymmetric errors for in the form . From these two examples it is clear that the most probable value of is larger than its true value , but becomes closer to for higher ratios.
Moreover, we have fitted a Rice function to the distribution and obtained the value of Rice distribution. Table 2 presents the simulated polarization degree values for different initial flux and polarization degree values. In the case of polarization angle, we have considered the confidence intervals and obtained values only if the (S/N) ratio is larger than 4.5, since for the lower (S/N) ratios, the distribution has a non-Gaussian shape. Table 2 presents the simulated polarization degree values for different initial flux and polarization degree values.
Fig.7 represents the relation between the simulated values of the total flux and the polarization degree. The contours shown in the figure correspond to 1, 2 and 3 values that enclose 68%, 95%, and 99% of points in the distribution, i.e. if the observer could measure these quantities more than 1000 times then, the central contour would enclose the 68% of measured values that are closest to the intrinsic value.
The following results of the expected statistical properties of our polarization data will be used for interpretation in the upcoming section:
From Fig.5 and Table 2 one can see that for our NIR data for strong flare fluxes the recovered degree of polarization is Gaussian distributed around a very well central value close to the intrinsic degree with a 5% uncertainty. Hence, if the intrinsic polarization degree is centered around a fixed expectation value the statistical properties of bright flare samples will be very similar to those of the total flux density measurements as presented by Witzel et al. (2012).
One can see from Fig.5 and Table 2 that for weak intrinsic fluxes the recovered degree of polarization is not any longer Gaussian distributed and especially for moderate or weaker intrinsic polarization degrees the intrinsic value is not well recovered and the uncertainties are very large, such that unrealistic polarization degrees of above 100% can be obtained. Only for intrinsically strongly polarized weak flares the intrinsic polarization degrees are statistically recovered but the un-symmetric uncertainties remain very large. Therefore, the total statistical behavior of observed polarization data can be thought of as being composed of the properties of subsamples of different polarization degree and flare fluxes.
| F’[mJy] | |||||||||
|---|---|---|---|---|---|---|---|---|---|
| p’[%] | 0.8 | 1 | 1.3 | 1.5 | 2 | 3 | 4 | 6 | 10 |
| 5 | |||||||||
| 10 | |||||||||
| 20 | |||||||||
| 30 | |||||||||
| 40 | |||||||||
| 50 | |||||||||
| 60 | |||||||||
| 70 |
| F’[mJy] | |||||||||
|---|---|---|---|---|---|---|---|---|---|
| p’[%] | 0.8 | 1 | 1.3 | 1.5 | 2 | 3 | 4 | 6 | 10 |
| 5 | |||||||||
| 10 | |||||||||
| 20 | |||||||||
| 30 | |||||||||
| 40 | |||||||||
| 50 | |||||||||
| 60 | |||||||||
| 70 |


3.2 Polarization degree and polarization angle
In Fig.8 we show the distribution of -band polarization degrees of Sgr A* (left) as well as the distribution of their uncertainties (right) obtained following the results of our statistical analysis presented in Section 3.1. In these figures we only plot the data points for which - based on our simulations - both the upper and lower uncertainty of the recovered polarization degree are smaller than half of the actual recovered value. In the following we will refer to these values as being significant measurements i.e. successful retrievals of the intrinsic polarization degree (and angle; see below). The distribution of polarization degrees has a peak close to 20. It does not have the shape of a Gaussian and is strongly influenced by systematic effects with uncertainties ranging from 10% to 50 (see section 3.1).
Fig.9 shows the distribution of significant -band polarization angles of Sgr A* (left) and their uncertainties (right) as determined for the corresponding flare fluxes following the statistical analysis presented in Section 3.1. For table entries with significant polarization degrees the corresponding uncertainties in the recovered polarization angle are below 20o i.e. below about 1/3 of a radian. The distribution of polarization angles shows a peak at 13o. The overall width of the distribution is of the order of 30o, hence, the preferred polarization angle that we can derive from the distribution is 13o 15o. In Fig.13 (right) we show for all data with significant polarization degrees the angle as a function of total flux density. The same plot for the entire data set is shown in Fig.17. The distribution of polarization angle and degree for the entire data set are shown in Fig.15.
The data shown on the left side of Figs.8 and 9 are consistent in the sense that the uncertainty of =15o in polarization angle is reflected in the width of the distribution of uncertainties derived from our simulations Fig.8 (right). This implies that the uncertainty in angle is dominated by the measurement error and the physical variabilities of the angle is probably much smaller. The measurement error is the combined uncertainty of recording the data and retrieving the polarization information out of it. An upper limit for the uncertainties in polarization angles (Fig.9, right) is =20o. This value also implies a corresponding expected relative uncertainty of the polarization degree of about tan(15o)=0.36 (i.e. 36%, for explanation see sketch in Fig.18). This is in good agreement with the approximate center value of 0.3 (i.e. 30%) found for the slightly skewed distribution of relative uncertainties of the polarization degree (Fig.8, right) for the entire set of significant data as judged from the simulations. Since the uncertainty in angle only accounts for the lower portion of the distribution of relative uncertainties in polarization degree, this implies that the polarization degree is indeed dominated by intrinsic fluctuations of that quantity. Under the assumption that the measurement and intrinsic uncertainty add quadratically, the intrinsic variability of the relative 2 m NIR polarization degree for SgrA* is of the order of about 30%.
In order to investigate if the distribution of polarization angles of Sgr A* is affected by the strength of the flare and the position of this source in the sky, we plotted for all data with significant polarization degrees the average of flux densities versus the polarization angles binned in 15o intervals (Fig.10, right) and the average elevation of Sgr A* in the sky for each polarization measurement (Fig.10, left). The corresponding plots for all data are shown in Fig.14. The region in which a significant correction due to instrumental polarization needs to be applied is located at about 0.5 hours with respect to the meridian (see Fig.9 in Witzel et al. 2011). This corresponds to an elevation of higher than about 80o. The distribution of data in Fig.10 (left) indicates that most of the measurements were done at elevations below 75o, hence the correction for instrumental polarization is very small. The distribution of data in Fig.10 (right) indicates for polarization angles close to the preferred angle of 13o the corresponding mean flux density is within about 1 from the mean flux density values of all 15o intervals. Hence, the flux density values that correspond to polarization angles around the preferred value are not exceptionally high or low. In summary we can exclude that the preferred polarization angle of about 13o is related to flux density excursions of particular brightness or to a particular location in the sky and instrumental orientation. Therefore, we conclude that the preferred polarization angle is a source intrinsic property.
3.3 Polarized flux density distribution
We produce the histogram of polarized flux density distribution of Sgr A* in its linear form (Fig.16, left) for the entire data and double logarithmic representation for the entire data (see Fig.16, right) as well as for the fraction of the data which is significant, based on our simulation, showed in Fig.11. The distribution is normalized by the total number of points and bin size. We use the logarithmic histogram in order to better display the distribution of values (Fig.11). In the following we present two different approaches to formally describe and physically explain the measured polarized flux density distribution shown in Fig. 11.
3.4 The polarized flux density distribution for bright flare fluxes
In Fig.11 we show the histogram of polarized flux density. Our simulations have shown that only for bright flare fluxes the polarization degree can be recovered with a small uncertainty. Therefore, the properties of the polarized flux density distribution (i.e. the product of the polarization degree and the total flux density) can be investigated best for high polarized flare fluxes. A powerlaw fit to the data at high flux densities is shown as a dot-dashed blue line. For high flare fluxes the slope is fitted to a value of 4.000.15 which is very close to the value of 4.210.05 obtained for the total flux densities by Witzel et al. (2012). The behavior was predicted by the simulations (see Fig.5 and Table 2). Recovering this exponent for the polarized flare flux density distribution indicates that the intrinsic polarization degree is centered around a fixed expectation value (see section 3.1) and has not been strongly variable over the time interval from 2004 to 2012.
| obs.date | degree angle | degree angle | degree angle |
| Eckart+04 | Zamaninasab+10 | This work | |
| 13 June 2004 | 20 - | 20 - | 10-30 - |
| 30 July 2005 | 12-25 - | 12-25 | 5-20 - |
| 15 May 2007 | - | 2020 - | 5-20 - |
| 17 May 2007 | - | 2010 - | 5-20 - |


3.5 A heuristic analytic explanation of the polarized flux density distribution
While the behavior of the entire sample of flares with significant polarized fluxes and polarization degrees is predicted by the simulations (see Figs. 5-7, and Tables 2 and 3. in section 3.1), the heuristic model we present here helps us to understand the fact that the relative frequency density of measured polarized flux densities is much broader in comparison to the relative frequency density of total flux density measurements as presented by Witzel et al. (2012) which was found to be consistent with a single-state emission process.
In the following we call the relative frequency density of measured polarized flux densities as shown in Fig.11. Keeping in mind the limited number of polarized flares that are available for our study this can be compared to the distribution shown for the total fluxes for a large sample of light curves by Witzel et al. (2012) (see Fig.3 therein). We now assume that for each randomly picked subset of -band flux densities, total flux density distribution has a similar shape. We assume that for all flux densities all polarization degrees are possible. This assumption is not fully justified and we comment on this later. First, we pick values that belong to total flux densities that can be attributed to a polarization degree bin of width from -/2 to +/2 the polarized flux densities would be . We obtain from the distribution shown in Fig.8 (left) the weights for individual polarization states. We can express the polarized flux density distribution as a product distribution that is a probability distribution constructed as the distribution of the product of (assumed to be) independent random variables and that have known distributions.
Using the weights for each polarization state the corresponding polarized flux density distribution can be written as
| (8) |
The polarized flux density distribution can then be written as a product distribution by summing over all bins including all polarization degrees :
| (9) |
In Fig.12 we show the result of this modeling approach. In this figure we plot the measured (as in Fig.11) and modeled relative number frequency of polarized flux density and show the combined contribution from different polarization states. The steep drop towards higher polarized flux densities is due to the deficiency of bright flares with high polarization states. Of course this region is also affected by the fact that the brightest flares tend to be statistically under-sampled. In this region our initial assumption that for all flux densities all polarization degrees are possible is not fulfilled. For fluxes above 5 mJy measured polarization degrees are below 30%. Therefore we overestimate the number of flare events with high polarized fluxes in this domain. Except this deficit, however, the model closely describes the measured data which implies that the broader distribution as formally analyzed in section 3.3 can indeed be explained by combination of an intrinsic relative frequency total flux density histogram applied to the individual polarization states.
3.6 Relation between total flux density and polarization degree
Considering all the observed total flux densities for different epochs and their calculated polarization degrees, we plot the -band polarization degrees versus total flux densities in Fig.13 (left). In this figure we consider the data that result in significant measurements of polarization degrees i.e. we excluded data that correspond to positions shown in non bold face in Table 1. The same plot for the entire data set is shown in Fig.17. In both plots there is a clear trend that lower total flux densities have apparently higher polarization degrees, Polarization degrees are lower for higher flux densities for which the simulations show that the polarization data can be recovered very well.
In order to analyze if this trend is due to small-number statistics, we perform a bootstrap test. By minimizing the least square we fit a line to our significant data points (see bold face positions in Table 2) and find a slope of -21.7%((F/[mJy]))-1 and an intercept on the polarization degree axis of 34.3%. The uncertainties are obtained by bootstrapping for times (Wall & Jenkins 2012). We find the Pearson’s correlation coefficient value, which measures how linearly dependent the parameters are, to be -0.43 for our anti-correlated data. The correlation coefficient for the original data could have been obtained by chance. Therefore, for measuring the strength of its value and its significance, we shuffle our data times and calculate the correlation coefficient each time for the resulted uncorrelated data sets. Then we calculate the mean and standard deviation () for the distribution of correlation coefficient values and check if the probability of the correlation coefficient of the original data was by chance or not. With a mean value of -10-5 the correlation coefficient distribution is almost zero and the standard deviation is 0.042. Therefore, we find that the Pearson’s correlation coefficient for our data has a 10 offset from the mean value of 0.0 that one finds for uncorrelated data sets. The resulting correlation is represented by the dashed line in Fig.13 (left). The simulations (see section 3.1) show that this apparent correlation is most likely due to the asymmetrically distributed uncertainties that dominate the measurements at low flux density levels.
The apparent correlation is already implied by the results of the simulations (see Figs.5,6 and Table 2). Table 2 exhibits a negative correlation between polarization degree and total flux density for intrinsic polarization degrees and total flux densities and it encloses the dashed line shown in Fig.13 (left).


4 Summary and conclusions
We have analyzed the near-infrared polarization light curves obtained with NACO at the ESO VLT for Sgr A* at the center of the Milky Way. Both the steep spectral index (Bremer et al. 2011, and references there in) and the strong variability in the NIR demonstrate that we are most likely dealing with optically thin synchrotron radiation (Eckart et al. 2012). Therefore, all properties we can derive based on the observation of variable polarized NIR radiation can directly be interpreted as source intrinsic properties.
For the entire data set the variation in polarization degree (mostly in the range of 10%-50% i.e. a factor of 5) is less pronounced than the variation in flare flux density (mostly in the range of 1 mJy to 15mJy i.e. a factor of 15). However, simulations of the resulting observed poalrization parameters given the measured flux (and its error) in orthogonal polarized channels show that, at low flux densities a significant part of the variation in polarization degree is due to measurement uncertainties. The simulations presented in Section 3.1 also show the uncertainty in recovering the intrinsic degree of polarization for flux levels above 5 mJy is only of the order of 5%. At this flux level, this value is considerably smaller than the measured variation in polarization degree at high fluxes of up to 30%. This implies an intrinsic variation of the polarization state of Sgr A* during flare events.
We show that there is a preferred polarization angle of 13o15o and that the polarized flux distribution is coupled to the total flux distribution analysed in Witzel et al. (2012). The simulations presented in section 3.1 show that the uncertainty in the polarization angle even at high flux levels (e.g. 5 mJy) is dominated by the statistical uncertainty (10o to 15o) in recovering a value that is assumed to be constant. Therefore, we can conclude that the intrinsic uncertainties on that quantity is smaller that the currently measured one and probably of the order of less than about 10o.
The fact that for high fluxes the power-law slope of 4 of the number density of the polarized flux density is very close to the slope in number density distribution of the total flux densities found by Witzel et al. (2012) also clearly indicates that there is a preferred value or range of intrinsic degrees of polarization. The variation of this range must have been small over the past years (2004-2012) else the slope in the number density of the polarized flux density would have been affected. Combined with the result from comparing the distributions of polarization degrees and their relative uncertainties this is a clear indication of intrinsic variability in the degree of polarization. Consistent with this we derived in section 3.2 for the entire set of significant polarization degrees its intrinsic relative variability must be of the order of 30%.
Therefore, the entire distribution of polarized flux density as described formally in Section 3.3 can be thought of as being composed of the contributions of populations of flare events with varying flux densities but a rather constant polarization angle and intrinsic polarization degrees that vary over a narrow range between about 10% and 30%. A preferred range in polarization degree and a well defined preferred polarization angle observed over a time span of 8 years (2004-2012) supports the assumption of a rather stable geometry for the Sgr A* system, i.e. a rather stable disk and/or jet/wind orientation.
In addition, a comparison of the observed data to the simulations presented in section 3.1 shows that the observed anti-correlation between polarization degree and total flux density is most likely dominated by an observational effect due to asymmetrically distributed uncertainties in the determination of the polarization degree for small flare fluxes (close to our acceptance flux and below). This means that, with the current instrumentation, it is impossible to know whether the polarization state of Sgr A* is intrinsically variable at flux densities below 2 mJy. The observed apparent anti-correlation between polarization degree and total flux density means that the brighter flux density excursions are systematically less polarized compared to the lower flux densities. Such a behavior may be expected based on the findings by Zamaninasab et al. (2010) that the polarized flares in comparison with the randomly polarized red noise show a signature of radiating matter orbiting around the supermassive black hole. The formation of partial Einstein rings and mild relativistic boosting during the approach of an orbiting source component will lead to a bright geometrically depolarized emission during a flare event. Polarization variations by increasing or decreasing of the flux densities have been reported in other publications (see e.g. Eckart et al. 2006b; Meyer et al. 2006a; Trippe et al. 2007).
It is also instructive to ensure that the results presented in this work are consistent with those of previous publications despite of different ways of extracting the polarization information. Table 4 presents a comparison of polarization angle and degree between this work and former NIR polarization studies of Sgr A*. Despite the strong source variability and different methods in deriving the observables (see Witzel et al. 2011, for details) the agreement is satisfactory and as expected from the findings in Section 3.5 and shown in Fig.13. The polarization angles of earlier analysis are also close to or approximately centered around a preferred value.
The preferred NIR polarization angle may also be linked to polarization properties in the radio cm- to mm-domain and to the orientation of the Sgr A* system. In the radio cm-regime linear polarization of Sgr A* is very small, however, the source shows a fractional circular polarization of around 0.4% (Bower et al. 1999b, a). The circular polarization decreases towards short mm-wavelengths (Bower et al. 2003), where Macquart et al. (2006) report variable linear polarization from Sgr A* of a few percent in the mm-domain. The polarization degree and angle in the sub-mm are likely linked to the magnetic field structure or the general orientation of the source. As in particular the NIR flare emission very likely originates from optically thin synchrotron radiation (Eckart et al. 2012) one may expect a link between the preferred NIR polarization angle and the NIR/radio structure of Sgr A*. At millimeter wavelengths interstellar scattering is small and allows insight into the intrinsic source structure of Sgr A*. Bower et al. (2014) report an intrinsic major axis position angle of the structure of 95o 10o (3 ). This angle of the radio structure is within the uncertainties orthogonal to the preferred infrared polarization angle. It is currently unclear how the intrinsic angle of Sgr A* can with certainty be related to external structures. This is particularly true if one takes into account the over 3 to 4 orders of magnitude in linear distance the position angle changes.
In a range of position angles between 120o and 130o Eckart et al. (2006b, c) report an elongated NIR feature, an elongated X-ray feature (see also Morris et al. 2004) and a more extended elongated structure called LF, XF and EF in Figure.9 by Eckart et al. (2006b). These features may be associated with a jet phenomenon. In this case the preferred NIR polarization angle may be associated with the jet components close to or at the foot point of the jet as for jet components the polarization may be along or perpendicular to the jet direction.
It is also possible that the NIR emission originates in hot spots on an accretion disk in a sunspot like geometry in which the E-vector is mainly perpendicular to the equatorial plane. Such a magneto-hydrodynamical model for the formation of episodic fast outflow is presented by Yuan et al. (2009). Acceleration of coronal plasma due to reconnection may then drive a jet or wind perpendicular to the intrinsic radio structure of the disk along the position angle of the NIR polarization. The mini-cavity that may be due to the interaction of a nuclear wind from Sgr A* is located at a position angle of about 193o (i.e. 13o+180o). The cometary tails of sources X3 and X7 reported by Mužić et al. (2010) also present additional observational support for the presence of a fast wind from Sgr A* under that position angle.
Further progress in investigating in particular the faint polarization states of Sgr A* in the NIR will require a higher angular resolution in order to better discriminate Sgr A* against background contamination. It is also of interest to use the well defined NIR polarization properties of Sgr A* to better determine the apparent stability of the underlying geometrical structure of the system and potentially use variations in this stability to trace interactions of the super-massive black hole at the center of the Milky Way with its immediate environment.
Acknowledgements.
B.Sh. and N.S are members of the Bonn Cologne Graduate School (BCGS) for Physics and Astronomy supported by the Deutsche Forschungsgemeinschaft and acknowledge support from BCGS. B.Sh. gladly thanks E. Clausen-Brown, S. Trippe and M. Oshagh for fruitful discussions. We received funding from the European Union Seventh Framework Programme (FP7/2007-2013) under grant agreement No.312789. This work was also supported in part by the Max Planck Society and the University of Cologne through the International Max Planck Research School (IMPRS) for Astronomy and Astrophysics. Part of this work was supported by the German Deutsche Forschungsgemeinschaft, DFG, via grant SFB 956 and fruitful discussions with members of the European Union funded COST Action MP0905: Black Holes in a violent Universe and the COST Action MP1104: Polarization as a tool to study the Solar System and beyond.References
- Baganoff et al. (2001) Baganoff, F. K., Bautz, M. W., Brandt, W. N., et al. 2001, Nature, 413, 45
- Bower et al. (1999a) Bower, G. C., Backer, D. C., Zhao, J.-H., Goss, M., & Falcke, H. 1999a, ApJ, 521, 582
- Bower et al. (1999b) Bower, G. C., Falcke, H., & Backer, D. C. 1999b, ApJ, 523, L29
- Bower et al. (2014) Bower, G. C., Markoff, S., Brunthaler, A., et al. 2014, ApJ, 790, 1
- Bower et al. (2003) Bower, G. C., Wright, M. C. H., Falcke, H., & Backer, D. C. 2003, ApJ, 588, 331
- Bremer et al. (2011) Bremer, M., Witzel, G., Eckart, A., et al. 2011, A&A, 532, A26
- Buchholz et al. (2013) Buchholz, R. M., Witzel, G., Schödel, R., & Eckart, A. 2013, A&A, 557, A82
- Chan et al. (2009) Chan, C.-k., Liu, S., Fryer, C. L., et al. 2009, ApJ, 701, 521
- Clarke (2010) Clarke, D. 2010, Stellar Polarimetry
- Devillard (1999) Devillard, N. 1999, in Astronomical Society of the Pacific Conference Series, Vol. 172, Astronomical Data Analysis Software and Systems VIII, ed. D. M. Mehringer, R. L. Plante, & D. A. Roberts, 333
- Diolaiti et al. (2000) Diolaiti, E., Bendinelli, O., Bonaccini, D., et al. 2000, A&AS, 147, 335
- Do et al. (2009) Do, T., Ghez, A. M., Morris, M. R., et al. 2009, ApJ, 691, 1021
- Dodds-Eden et al. (2011) Dodds-Eden, K., Gillessen, S., Fritz, T. K., et al. 2011, ApJ, 728, 37
- Dodds-Eden et al. (2009) Dodds-Eden, K., Porquet, D., Trap, G., et al. 2009, ApJ, 698, 676
- Dovčiak et al. (2008) Dovčiak, M., Karas, V., Matt, G., & Goosmann, R. W. 2008, MNRAS, 384, 361
- Dovčiak et al. (2004) Dovčiak, M., Karas, V., & Yaqoob, T. 2004, ApJS, 153, 205
- Eckart et al. (2004) Eckart, A., Baganoff, F. K., Morris, M., et al. 2004, A&A, 427, 1
- Eckart et al. (2006a) Eckart, A., Baganoff, F. K., Schödel, R., et al. 2006a, A&A, 450, 535
- Eckart et al. (2008a) Eckart, A., Baganoff, F. K., Zamaninasab, M., et al. 2008a, A&A, 479, 625
- Eckart et al. (2012) Eckart, A., García-Marín, M., Vogel, S. N., et al. 2012, Journal of Physics Conference Series, 372, 012022
- Eckart & Genzel (1996) Eckart, A. & Genzel, R. 1996, Nature, 383, 415
- Eckart & Genzel (1997) Eckart, A. & Genzel, R. 1997, MNRAS, 284, 576
- Eckart et al. (2002) Eckart, A., Genzel, R., Ott, T., & Schödel, R. 2002, MNRAS, 331, 917
- Eckart et al. (2008b) Eckart, A., Schödel, R., García-Marín, M., et al. 2008b, A&A, 492, 337
- Eckart et al. (2008c) Eckart, A., Schödel, R., García-Marín, M., et al. 2008c, A&A, 492, 337
- Eckart et al. (2006b) Eckart, A., Schödel, R., Meyer, L., et al. 2006b, A&A, 455, 1
- Eckart et al. (2006c) Eckart, A., Schodel, R., Meyer, L., et al. 2006c, Journal of Physics Conference Series, 54, 391
- Eisenhauer et al. (2003) Eisenhauer, F., Schödel, R., Genzel, R., et al. 2003, ApJ, 597, L121
- Genzel et al. (2003) Genzel, R., Schödel, R., Ott, T., et al. 2003, Nature, 425, 934
- Ghez et al. (2005) Ghez, A. M., Hornstein, S. D., Lu, J. R., et al. 2005, ApJ, 635, 1087
- Ghez et al. (1998) Ghez, A. M., Klein, B. L., Morris, M., & Becklin, E. E. 1998, ApJ, 509, 678
- Ghez et al. (2000) Ghez, A. M., Morris, M., Becklin, E. E., Tanner, A., & Kremenek, T. 2000, Nature, 407, 349
- Ghez et al. (2008) Ghez, A. M., Salim, S., Weinberg, N. N., et al. 2008, ApJ, 689, 1044
- Gillessen et al. (2006) Gillessen, S., Eisenhauer, F., Quataert, E., et al. 2006, ApJ, 640, L163
- Gillessen et al. (2009) Gillessen, S., Eisenhauer, F., Trippe, S., et al. 2009, ApJ, 692, 1075
- Lenzen et al. (2003) Lenzen, R., Hartung, M., Brandner, W., et al. 2003, in Society of Photo-Optical Instrumentation Engineers (SPIE) Conference Series, Vol. 4841, Instrument Design and Performance for Optical/Infrared Ground-based Telescopes, ed. M. Iye & A. F. M. Moorwood, 944–952
- Liu et al. (2006) Liu, S., Petrosian, V., Melia, F., & Fryer, C. L. 2006, ApJ, 648, 1020
- Macquart et al. (2006) Macquart, J.-P., Bower, G. C., Wright, M. C. H., Backer, D. C., & Falcke, H. 2006, ApJ, 646, L111
- Markoff et al. (2001) Markoff, S., Falcke, H., Yuan, F., & Biermann, P. L. 2001, A&A, 379, L13
- Meyer et al. (2006a) Meyer, L., Eckart, A., Schödel, R., et al. 2006a, A&A, 460, 15
- Meyer et al. (2007) Meyer, L., Schödel, R., Eckart, A., et al. 2007, A&A, 473, 707
- Meyer et al. (2006b) Meyer, L., Schödel, R., Eckart, A., et al. 2006b, A&A, 458, L25
- Meyer et al. (2014) Meyer, L., Witzel, G., Longstaff, F. A., & Ghez, A. M. 2014, ApJ, 791, 24
- Morris et al. (2004) Morris, M., Howard, C., Muno, M., et al. 2004, in The Dense Interstellar Medium in Galaxies, ed. S. Pfalzner, C. Kramer, C. Staubmeier, & A. Heithausen, 281
- Mužić et al. (2010) Mužić, K., Eckart, A., Schödel, R., et al. 2010, A&A, 521, A13
- Naghizadeh-Khouei & Clarke (1993) Naghizadeh-Khouei, J. & Clarke, D. 1993, A&A, 274, 968
- Porquet et al. (2003) Porquet, D., Predehl, P., Aschenbach, B., et al. 2003, A&A, 407, L17
- Rousset et al. (2003) Rousset, G., Lacombe, F., Puget, P., et al. 2003, in Society of Photo-Optical Instrumentation Engineers (SPIE) Conference Series, Vol. 4839, Adaptive Optical System Technologies II, ed. P. L. Wizinowich & D. Bonaccini, 140–149
- Sabha et al. (2012) Sabha, N., Eckart, A., Merritt, D., et al. 2012, A&A, 545, A70
- Sabha et al. (2010) Sabha, N., Witzel, G., Eckart, A., et al. 2010, A&A, 512, A2
- Schödel et al. (2010) Schödel, R., Najarro, F., Muzic, K., & Eckart, A. 2010, A&A, 511, A18
- Schödel et al. (2002) Schödel, R., Ott, T., Genzel, R., et al. 2002, Nature, 419, 694
- Serkowski (1958) Serkowski, K. 1958, Acta Astron., 8, 135
- Serkowski (1962) Serkowski, K. 1962, 289
- Simmons & Stewart (1985) Simmons, J. F. L. & Stewart, B. G. 1985, A&A, 142, 100
- Stewart (1991) Stewart, B. G. 1991, A&A, 246, 280
- Trippe (2014) Trippe, S. 2014, Journal of Korean Astronomical Society, 47, 15
- Trippe et al. (2007) Trippe, S., Paumard, T., Ott, T., et al. 2007, MNRAS, 375, 764
- Vinokur (1965) Vinokur, M. 1965, Annales d’Astrophysique, 28, 412
- Wall & Jenkins (2012) Wall, J. V. & Jenkins, C. R. 2012, Practical Statistics for Astronomers
- Witzel et al. (2012) Witzel, G., Eckart, A., Bremer, M., et al. 2012, ApJS, 203, 18
- Witzel et al. (2011) Witzel, G., Eckart, A., Buchholz, R. M., et al. 2011, A&A, 525, A130
- Yuan et al. (2009) Yuan, F., Lin, J., Wu, K., & Ho, L. C. 2009, MNRAS, 395, 2183
- Yuan et al. (2004) Yuan, F., Quataert, E., & Narayan, R. 2004, ApJ, 606, 894
- Yusef-Zadeh et al. (2006a) Yusef-Zadeh, F., Bushouse, H., Dowell, C. D., et al. 2006a, ApJ, 644, 198
- Yusef-Zadeh et al. (2009) Yusef-Zadeh, F., Bushouse, H., Wardle, M., et al. 2009, ApJ, 706, 348
- Yusef-Zadeh et al. (2006b) Yusef-Zadeh, F., Roberts, D., Wardle, M., Heinke, C. O., & Bower, G. C. 2006b, ApJ, 650, 189
- Yusef-Zadeh et al. (2007) Yusef-Zadeh, F., Wardle, M., Cotton, W. D., Heinke, C. O., & Roberts, D. A. 2007, ApJ, 668, L47
- Yusef-Zadeh et al. (2008) Yusef-Zadeh, F., Wardle, M., Heinke, C., et al. 2008, ApJ, 682, 361
- Zamaninasab et al. (2008) Zamaninasab, M., Eckart, A., Meyer, L., et al. 2008, Journal of Physics Conference Series, 131, 012008
- Zamaninasab et al. (2010) Zamaninasab, M., Eckart, A., Witzel, G., et al. 2010, A&A, 510, A3+
Appendix A
Here we provide additional plots similar to the ones shown throughout the main body of the text, showing the principal results from the analysis of Sgr A* observations taken in the polarization mode (NACO), but using the entire data set without limitation to the only significant values.


