Positron acceleration by plasma wake fields driven by a hollow electron beam
Abstract
A scheme of wake field generation for positron acceleration using hollow or donut shaped electron driver beams is studied. An annular shaped, electron free region forms around a hollow driver beam creating a favorable region (longitudinal field is accelerating and transverse field is focusing and radially linear) for positron acceleration. Accelerating gradients of the order of 10 GV/m are produced by a hollow electron beam driver with FACET like parameters. The peak accelerating field increases linearly with the total charge in the beam driver while the axial size of the favorable region ( one plasma wavelength) remains approximately fixed. The radial size drops with the total charge but remains large enough for the placement of a witness positron beam. We simulate an efficient acceleration of a 23 GeV positron beam to 35.4 GeV with a maximum energy spread of 0.4% and very small emittance over a plasma length of 140 cm.
pacs:
The plasma based particle acceleration schemes, first proposed in 1979 tajima1979 , have already achieved acceleration gradients ( tens of GeV/m) much larger than those ( tens of MeV/m) in conventional radio frequency accelerators. In plasma based particle acceleration schemes, a high intensity laser or an ultra-relativistic charged particle beam propagates through a plasma generating electromagnetic fields in its wake, known as wake fields. In the so called blowout regime of Plasma Wake Field Acceleration (PWFA) chen1985 ; rosenzweig1991 ; lu2006 , all the plasma electrons are expelled from the path of a short (approximately one plasma wavelength long) and dense (beam density plasma density) electron beam driver forming an electron free region known as a bubble or ion channel. The expelled electrons then fall back to the beam propagation axis behind the driver. The blowout regime offers a nearly radially uniform high acceleration gradient for efficient acceleration of electrons. The electron acceleration to high energies (energy doubling of 43 GeV electrons in an 85 cm long plasma) has been demonstrated in PWFA experiments blumenfeld2007 . Plasma-based acceleration of positrons, on the other hand, has been less explored and is essential for successful operation of an electron-positron collider.
Current positron acceleration schemes generate wake fields in plasma either by an electron lotov2007 or by a positron beam driver lee2001 . When the wake fields are driven by an electron beam driver in the bubble regime, the favorable region for positron acceleration (transverse field focusing and longitudinal field accelerating) forms between the first and second bubble. The favorable region has a narrow extent between the two bubbles. The accelerating electric field varies rapidly with axial coordinate leading to large energy spread in the accelerated positron beam (witness beam). Furthermore, the transverse focusing field causes an increase in the emittance of the witness beam. In the case of a positron driver, the plasma electrons are attracted towards rather than blown out of the driver beam path and do not cross the axis in a narrow region as they do in case of electron beam driver lee2001 . As a result the accelerating fields are smaller than those driven by electron beams. The focusing fields are nonlinear in the transverse coordinate and vary along the axis of the beam leading to the emittance growth of the witness beam. The accelerating gradients can be improved if the positron beam driver propagates through a hollow plasma channel lee2001 . For an appropriate hollow plasma channel radius, plasma electrons can cross the axis in a narrow region increasing the wake field amplitude. Recently, self injection of hollow electron bunch in the wake fields driven by a Laguerre-Gaussian laser pulse and positron acceleration was observed in simulations vleira2014 .
In this Letter, we present a scheme of wake field generation for positron acceleration using hollow or donut shaped electron drive beams (the beam density is maximum at an off axis location). The hollow electron beam pushes the plasma electrons towards its axis setting up the wake fields for positron acceleration in the hollow region. The accelerating field for positrons increases with the total charge in the beam driver while the axial size of the favorable region ( one plasma wavelength) remains approximately unchanged. This is in contrast to the case of solid beam driver in which the size of the favorable region diminishes with increasing charge in the beam.
We calculate wake fields driven by the propagation of a hollow electron beam in a uniform plasma in an azimuthally symmetric () cylindrical geometry using the quasi-static code WAKE mora1997 . The quasi-static approximation exploits the disparity of driver and plasma evolution time scales. The time scale of evolution of the ultra-relativistic electron beam (relativistic factor ) is the betatron period which is much larger than the plasma time scale , where is the plasma wavelength. In the code WAKE, the response of the kinetic, warm and relativistic plasma is calculated on a fast time scale assuming a fixed beam driver. The driver is then evolved over longer time scales jain2014 .
We employ a moving computational domain which changes its axial position as the beam driver propagates along the axis. The axial coordinate () in the moving computational domain can be written as . The initial number density of the hollow or donut shaped electron beam driver is expressed as,
| (1) |
The peak number density () of the hollow beam is located at an off axis location and falls off within distances (radially) and (axially). The beam is completely hollow in the limit . Otherwise there is a small but finite density in the core of the beam. In the limit , the beam density has peak at the axis and corresponds to a solid beam. In our simulations we take for hollow beams and for solid beams. And thus, we measure in terms of , i.e., we vary instead of .
We first study wake field generation by the non-evolving electron driver. In the simulations, the plasma density is uniform cm-3 (typical plasma density in FACET hogan2010 ) giving m. The beam is axially centered at . The value of m is fixed for all the results presented here for non-evolving driver. We vary the values of , and the total charge contained in the driver. The beam driver with an initial energy 23 GeV is modeled using simulation particles. The plasma is modeled using 9 particles per cell. The simulation domain size along is with a grid resolution of . The simulation domain size and grid resolution in radial direction depends on the the values of and .

Plasma electrons follow different trajectories, shown in top panels of Fig. 1, in response to the hollow () and solid () electron beam drivers both of which have m and nC. In both cases, plasma electrons are expelled from the beam. But since the bulk of the hollow beam is centered off axis, the plasma electrons are expelled both towards and away from the axis. This is in contrast with the case of a solid beam in which plasma electrons are expelled only away from the axis. The plasma electrons move towards the axis through the hollow region and experience a force of repulsion due to other plasma electrons moving towards the axis. For this reason, the radial deflection of plasma trajectories in the hollow region is small until they intersect the back of the bubble. At the back of the driver, plasma electrons are pulled back (towards their original radial position) by the annular shaped electron free region.
The resulting structures of the wake fields are shown in the middle and bottom panels of Fig. 1. The longitudinal electric field is structurally the same for solid and hollow beam drivers. However, the structure of the transverse field changes for hollow beams. As the value of becomes finite, the transverse field in the hollow region of the beam (below the horizontal dashed lines in Fig. 1) changes its direction from radially outward (for ) to radially inward, and thus, becomes focusing for positrons. The reason for this change in the case of a hollow beam is the formation of an annular shaped electron free region which has positive charge density due to background ions. Since the net charge density below and above the electron free region is negative due to excess plasma electrons, the radial electric field points radially inward and outward near the bottom and top boundaries of the electron free region, respectively.
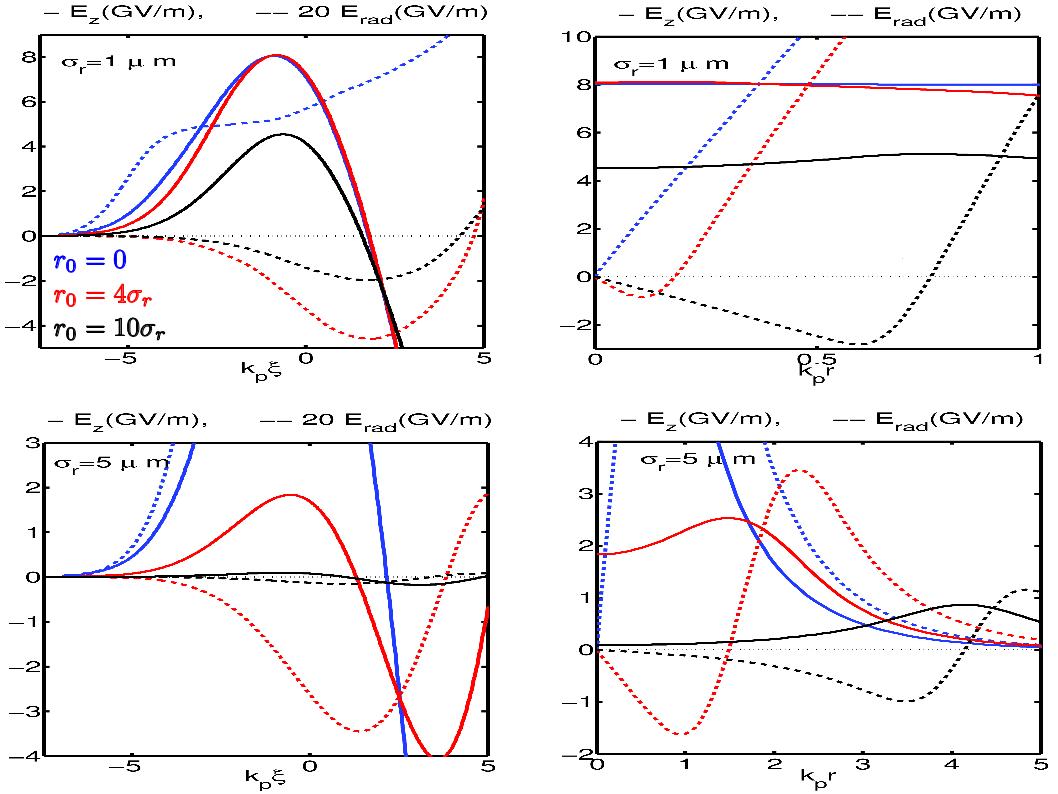
The longitudinal electric field is positive in part of the region where the transverse force is focusing for positrons. The axial line-outs of along the axis () and of just above the axis, Fig. 2, show that the axial size of the favorable region for positron acceleration (positive and negative ) is of the order of a plasma wavelength both for m and m. The axial size is slightly smaller for m. It depends very weakly on the value of . For m, in the favorable region is almost the same for the solid beam and the hollow beam with however, it drops for . For m, has values much smaller than those for m and its drop with is also faster. The logarithmic-variation of the maximum value of in the favorable region with for a given , (Fig. 3a) and with for a given (Fig. 3c) can be reasonably approximated as linear. This indicates exponential dependence of on and .
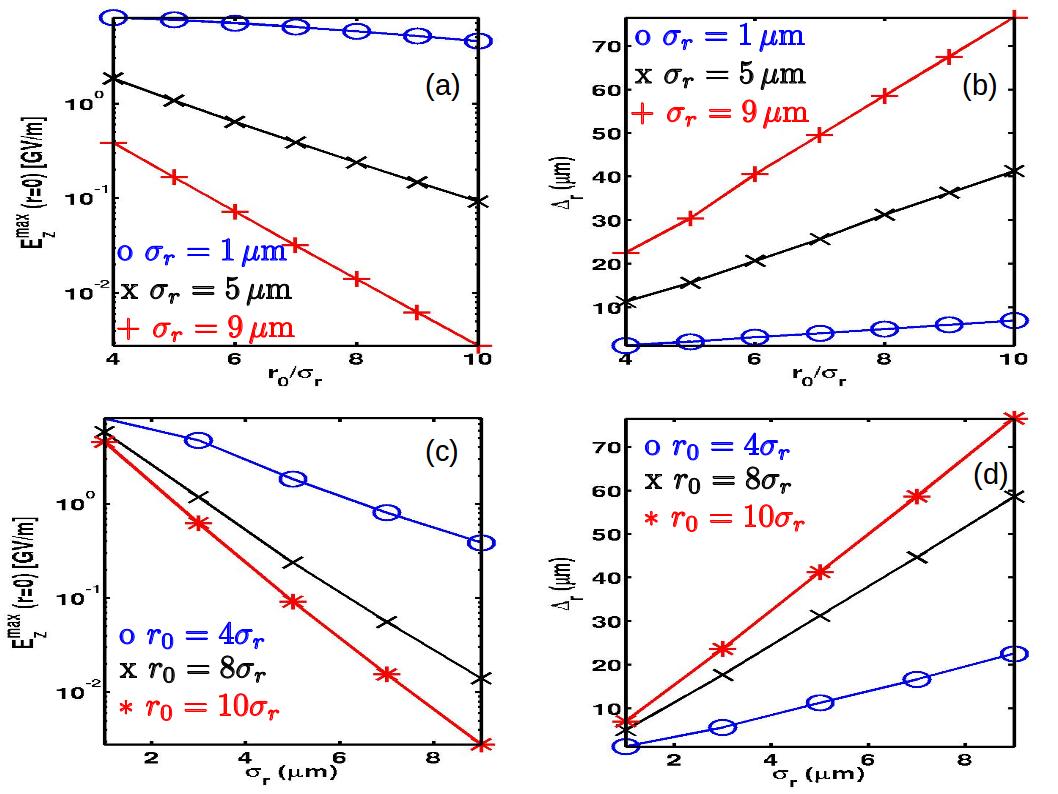
It is required for the emittance preservation of the witness beam that the focusing field be linear in the radial direction and uniform in the axial direction. Although the transverse field in the favorable region (below the dashed horizontal line in Fig. 1) is negative (focusing for positrons) until , its radial variation can be approximated as linear only before it reaches its negative peak as can be seen in radial line-outs of in Fig. 2. For m, becomes slightly nonlinear even before its negative peak (curves are concave towards origin). We define approximately the radial size of the linearly varying focusing field as the radial distance at which . Figs. 3b and 3d show that increases linearly with both of (for fixed ) and (for fixed ). The rate of increase with depends on and that with on . In the axial direction, the focusing field is not uniform but varies very slowly compared with that driven by a solid electron beam driver or by a positron beam driver.
Another desirable feature in plasma wake field acceleration is the axial and radial uniformity of the accelerating wake field. Fig. 1 and radial line-outs in Fig. 2 show that is highly uniform in the radial direction for m. The radial uniformity of is degraded for larger values of m. Although the magnitude of in the favorable region varies with , the variation is not as rapid as near the electric field spike resulting from a solid beam driver. The radial uniformity and relatively slow variation with of are ideal for positron acceleration with low energy spread.
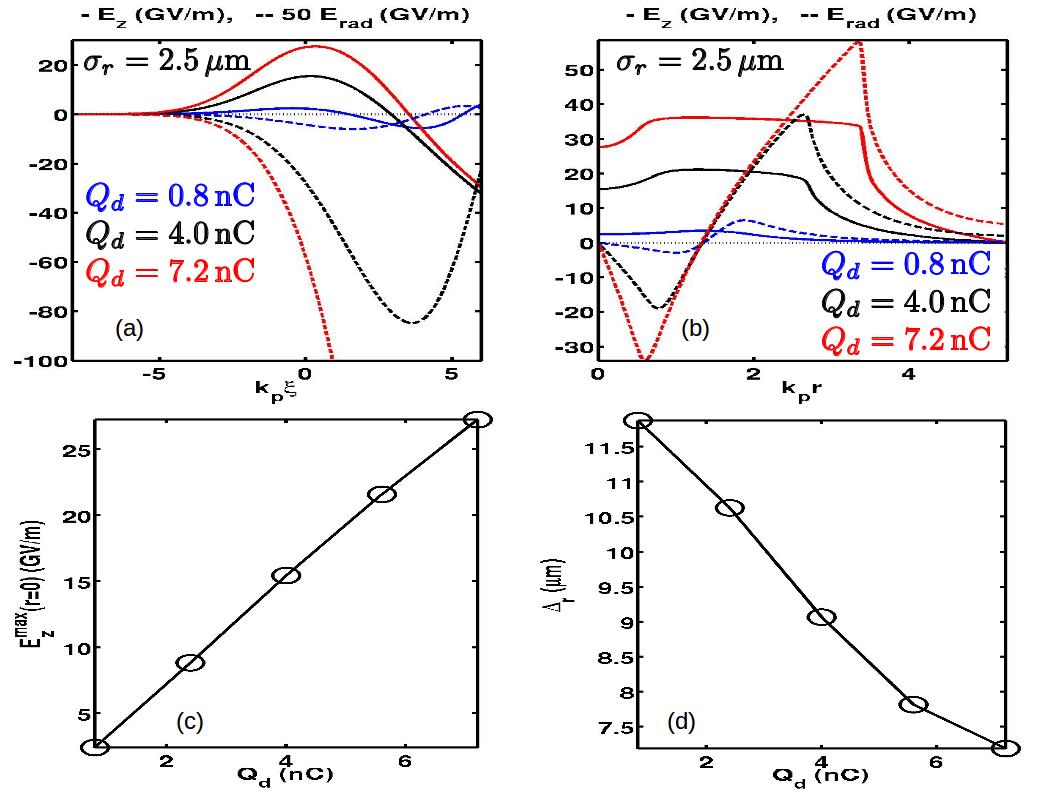
The axial and radial line-outs of wake fields in Figs. 4a and b show that the accelerating electric field increases with the total charge contained in the hollow beam driver. The maximum of the on-axis scales linearly with (Fig. 4c). The axial size of the favorable region for positron acceleration increases only by a small length. This is unlike the favorable region for positron acceleration in the back of the solid beam driver. In the latter case, the axial size of the favorable region shrinks with the energy content of the driven plasma wave and thus increasing the charge in the beam does not improve the efficiency. The focusing field driven by the hollow beam driver varies faster with for larger values of . However, this variation of the focusing field is still slower than that in the back of the solid beam driver. The radial extent (over which the focusing field is linearly varying with radius) decreases with but remains of the order of for up to =7.2 nC (Fig. 4d). The radial uniformity of is degraded for high values of charge in the beam.
Now, we show by simulations that a witness beam of positrons can be efficiently accelerated in the wake fields generated by a hollow electron beam driver. For this purpose we place a positron beam with a density profile given by,
| (2) |
on the axis of an evolving hollow electron beam driver whose initial density profile is given by Eq. (1). The background plasma has a uniform density, cm-3 giving m, and is modeled using 9 simulation particles per cell. The parameters for electron beam driver are , m , m , and total charge nC corresponding to . The witness bunch parameters are m , m and total charge in witness bunch pC corresponding to . The electrons in the driver and positrons in the witness beam have an initial energy of 23 GeV and are modeled using 1.25 and 6.25 simulation particles, respectively. The simulation domain size along is approximately m with a grid resolution m while along is 119 m with a grid resolution of m . The driver and witness beams are propagated in the uniform plasma in steps of m for a total distance of 140 cm.
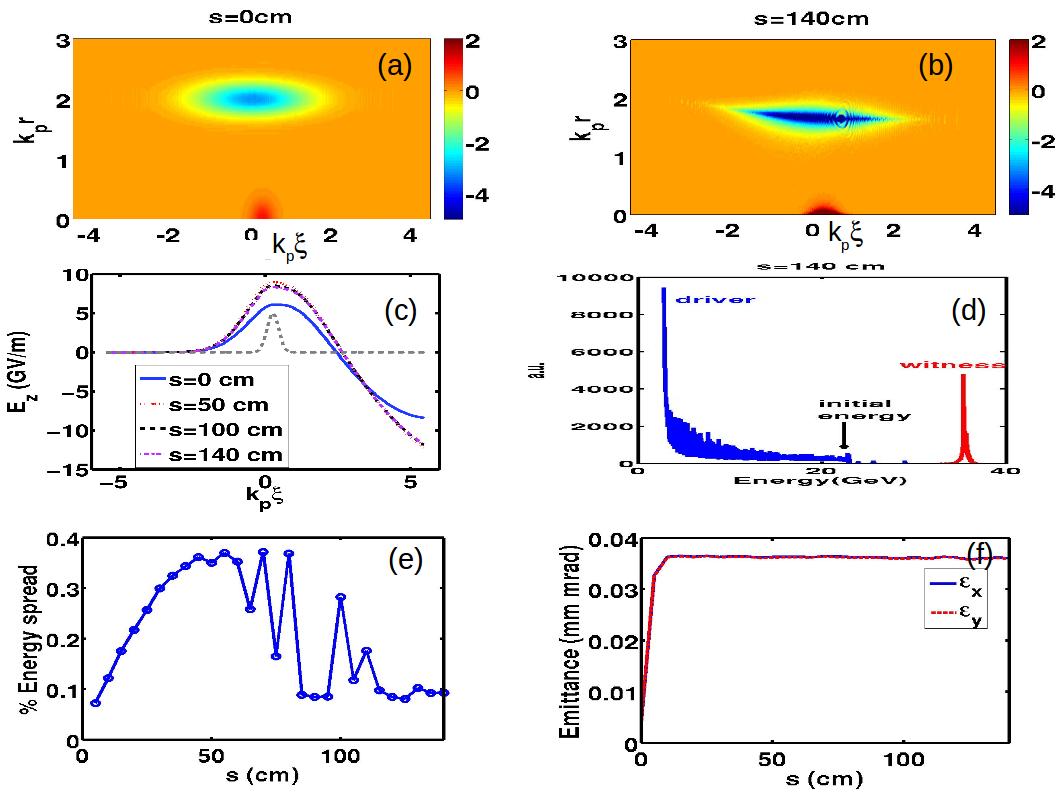
Figs. 5a and 5b shows charge densities of the driver and witness beams before the beams begin to propagate (propagation distance, ) and after they have propagated a distance of 140 cm. During the propagation, the electron beam driver shifts radially inward and reduces its radial spread, thereby reducing the effective values of and , respectively. This can be seen by comparing Figs. 5a and 5b. As a result, the longitudinal electric field also increases in and around the axial extent of the witness beam. However, as shown in Fig. 5c, saturates at slightly larger values by cm. The energy gain of the witness beam after propagating 140 cm is 12.4 GeV in Fig. 5d. The estimate of work done by the electric field can be obtained from GeV, where is the maximum value of on the axis. This estimate is very close to the energy gained by the witness beam.
The axial position of the witness beam was chosen to produce and sit in a uniform region of . This uniform region becomes slightly nonuniform due to beam evolution. However it does not significantly affect the energy spread of the accelerated witness beam as can be seen in Fig. 5e. The percentage energy spread of the witness beam defined as first increases and then decreases with the propagation distance. Here is the full width at half maximum of the energy spectrum of the witness beam and is the energy corresponding to the peak of the energy spectrum, Fig. 5d. The maximum value of the percentage energy spread remains under 0.4. In Fig. 5f, the normalized RMS emittance of the witness beam, and (defined as where and are the position and momentum of a witness particle, and similar definition for ), does not increase much and remains close to its initial value during the beam’s propagation.
Accelerating gradients for positrons in excess of 5 GV/m have been earlier reported kimura2011 ; wang2008 . For appropriate beam parameters (, and ), wake fields generated in a plasma by a hollow electron beam driver can offer radially uniform higher accelerating gradient and linear focusing field for positron acceleration. The typical radial and axial sizes of the available positron beams in experiments are approximately 10 m and m, respectively hogan2010 . For cm-3, the radial and axial sizes of the favorable region are approximately m and m respectively, which are sufficiently large for the placement of a positron witness beam of available sizes. The most attractive feature of this scheme is the linear scaling of the longitudinal electric field with the charge in the driver beam without compromising the size of the favorable region.
Acknowledgements.
This work was supported by the US DoE grant number DESC0007970.References
- (1) T. Tajima and J. M. Dawson, Phys. Rev. Lett. 43, 267 (1979)
- (2) P. Chen, J. M. Dawson, R. W. Huff, and T. Katsouleas, Phys. Rev. Lett. 54, 693 (1985)
- (3) J. B. Rosenzweig, B. Breizman, T. Katsouleas, and J. J. Su, Phys. Rev. A 44, R6189 (1991)
- (4) W. Lu, C. Huang, M. Zhou, W. B. Mori, and T. Katsouleas, Phys. Rev. Lett. 96, 165002 (2006)
- (5) I. Blumenfeld, C. E. Clayton, F.-J. Decker, M. J. Hogan, C. Huang, R. Ischebeck, R. Iverson, C. Joshi, T. Katsouleas, N. Kirby, W. Lu, K. A. Marsh, W. B. Mori, P. Muggli, E. Oz, R. H. Siemann, D. Walz, and M. Zhou, Nature 445, 741 (2007)
- (6) K. V. Lotov, Phys. Plasmas 14, 023101 (2007)
- (7) S. Lee, T. Katsouleas, R. G. Hemker, E. S. Dodd, and W. B. Mori, Phys. Rev. E 64, 045501 (2001)
- (8) J. Vieira and J. T. Mendonca, Phys. Rev. Lett. 112, 215001 (2014)
- (9) P. Mora and T. M. Antonsen, Phys. Plasmas 4, 217 (1997)
- (10) N. Jain, J. Palastro, and T. M. A. Jr., To be published(2014)
- (11) M. J. Hogan, T. O. Raubenheimer, A. Seryi, P. Muggli, T. Katsouleas, C. Huang, W. Lu, W. An, K. A. Marsh, W. B. Mori, C. E. Clayton, and C. Joshi, New J. Phys. 12, 055030 (2010)
- (12) W. D. Kimura, H. M. Milchberg, P. Muggli, X. Li, and W. B. Mori, Phys. Rev. Lett. 61, 90 (2011)
- (13) X. Wang, R. Ischebeck, P.Muggli, T. Katsouleas, C. Joshi, W. B. Mori, and M. J. Hogan, Phys. Rev. Lett. 101, 124801 (2008)