Two-stage crystallization of charged colloids at low supersaturations
Abstract
We report simulations on the homogeneous liquid-fcc nucleation of charged colloids for both low and high contact energy values. As a precursor for crystal formation, we observe increased local order at the position where the crystal will form, but no correlations with the local density. Thus, the nucleation is driven by order fluctuations rather than density fluctuations. Our results also show that the transition involves two stages in both cases, first a transition liquid bcc, followed by a bcc hcp/fcc transition. Both transitions have to overcome free energy barriers, so that a spherical bcc-like cluster is formed first, in which the final fcc structure is nucleated mainly at the surface of the crystallite. This means that the bcc-fcc phase transition is a heterogeneous nucleation, even though we start from a homogeneous bulk liquid.
The height of the bcc hcp/fcc free energy barrier strongly depends on the contact energies of the colloids. For low contact energy this barrier is low, so that the bcc hcp/fcc transition happens spontaneously. For the higher contact energy, the second barrier is too high to be crossed spontaneously by the colloidal system. However, it was possible to ratchet the system over the second barrier and to transform the bcc nuclei into the stable hcp/fcc phase. The transitions are dominated by the first liquid-bcc transition and can be described by Classical Nucleation Theory using an effective surface tension.
I Introduction
The crystallization of charged macromolecules plays an important role in many fields, such as biology, soft matter physics or materials science. For example, the crystallization of proteins is required for structure determination by scattering McPherson (2004); Vekilov (2010); Kayitmazer et al. (2013). The arguably most prototypic model system consists of colloidal particles, which can be well described as charged spheres. Systems of charged colloidal particles have been used not only to model protein crystallization, but also collective properties of other systems, e.g. DNA self-assembly Stradner et al. (2004).
Experiments on colloidal systems are comparatively easy to carry out, due to their well characterized properties and the fact that they can be investigated by conventional microscopy or scattering methods Palberg (1999); Brunner et al. (2002). Colloids, just as the smaller proteins, are charged due to dissociation, which becomes noticable under deionized conditions. Various studies under such conditions have been performed, e.g. concerning nucleation rates for different densities Schöpe and Palberg (2001, 2002); Wette and Schöpe (2007). The interaction of charged colloids can be well represented by a screened Coulomb or Yukawa potential Brunner et al. (2002). The phase diagram for these interactions is known Hynninen and Dijkstra (2003) and exhibits two stable solid phases, namely bcc and fcc crystals.
Computer simulations using such a Yukawa interaction have been used to study the dynamics of the crystallization process and its onset, nucleation. It has been reported that the nucleation of Yukawa particles is a two-stage process, comprising the establishment of an fcc-like core inside a previously grown bcc-like structure Auer and Frenkel (2002). Another important question is for the precursors of nucleation. It is not yet known, whether initial clusters with a higher density are being formed first, or whether there is an increase in structural ordering which triggers the onset of crystal growth Schilling et al. (2010); Russo and Tanaka (2012); Tan et al. (2014); Granasy and Toth (2014).
To investigate this, nucleation experiments and simulations at low supersaturations are necessary, where the attachment rate of growth units is slow and the nucleation process can be studied directly in great detail. The problem is that according to Classical Nucleation Theory (CNT), the free energy as a function of cluster radius is
| (1) |
with supersaturation , surface tension and number density . This free energy exhibits a single maximum, which gives raise to a free energy barrier
| (2) |
at a critical cluster size of . A cluster smaller than this size is more likely to dissolve rather than to grow into a crystal domain. At low supersaturation , the critical cluster and the free energy barrier are rather large, so that it takes a long waiting time until a critical cluster can be observed, which makes the process difficult to access in experiments and simulations.
CNT only assumes the existence of an initial and a final state. However, intermediate states can exist on the crystallization pathway. According to Ostwald, the phase which is closest in free energy is nucleated first, which doesn’t have to be the truly stable phase Ostwald (1897). In addition, Stranski and Totomanow found that the phase with the lowest free energy barrier is nucleated first Stranski and Totomanow (1933), and according to Alexander and McTague, the nucleation of a bcc-like phase is favored in a liquid Alexander and McTague (1978).
In this work, we report simulations of nucleation in the Yukawa model for colloids at low supersaturations using Forward Flux Sampling (FFS) simulations. This allows us to directly investigate the homogeneous nucleation, which is triggered only by spontaneous fluctuations of the homogeneous bulk liquid. In the following section, we introduce our model and simulation details. Subsequently, we report results on nucleation pathways, precursors, and the free energy landscape compared to CNT. We conclude with a discussion of our findings.
II Background
II.1 Colloid model and simulation details
We perform Molecular Dynamics (MD) simulations using the software package ESPResSo Limbach et al. (2006). Our system consists of point particles in a 3D simulation box with periodic boundary conditions in the isothermal-isobaric ensemble, realized by a Langevin thermostat and a barostat Kolb and Dünweg (1999). The particles interact via a screened Coulomb or Yukawa potential, which mimics the electrostatic interaction of weakly charged colloidal particles Auer and Frenkel (2002). The excluded volume is modeled by a Weeks-Chandler-Andersen (WCA) potential Weeks et al. (1971). This results in a full interaction with
| (3) | |||||
| (4) |
where is the particle diameter, is the contact energy value of the Yukawa potential, is the contact value of the WCA potential and is the inverse screening length. In this work, we set and , which determines our energy and length scales. We also fix , but consider two different contact energy values and . The pressure was fixed at and , respectively, which corresponds to two points in the stable fcc region of the phase diagram for this system Azhar et al. (2000); Hynninen and Dijkstra (2003) with a comparable, small distance to the liquid-fcc coexistence line. We start our simulation in a metastable liquid and drive it towards crystallization using forward flux sampling (FFS) as described below. Table 1 summarizes the properties of our system in the initial liquid and final solid phases.
II.2 Order parameter
To characterize the progress of crystallization we define the size of the largest solid cluster as the order parameter. We consider configurations with as liquid and systems with as solid, where the latter value means that approximately of all particles are in the largest cluster. Two particles are considered to belong to the same cluster, if they are in a solid-like environment and spatially closer than , which is the location of the first minimum of the radial distribution function.
To detect particles in a solid-like environment, we use the per-particle local bond order parameter Steinhardt et al. (1983); Lechner and Dellago (2008), defined via
| (5) | |||||
| (6) | |||||
| (7) |
is a complex vector based on the spherical harmonics of order , is the number of nearest neighbors of particle and is the distance between colloids and . is the number of neighbors of the second shell.
In this work, we label a particle as solid if . In addition, we label a particle as being in a fcc-like environment if , and define a corresponding size of the largest fcc-like cluster. Note that the measured dimensions of the crystal cluster depend sensitively on these thresholds. Our values are chosen according to the separating domains of the structures. See refs. Steinhardt et al. (1983); Lechner and Dellago (2008) for further details.
II.3 Forward Flux Sampling
Due to the low supersaturation at the phase points studied, crystallization is a rare event, which cannot be studied by conventional brute-force simulations. We therefore use the Forward Flux Sampling (FFS) Allen et al. (2006, 2009) technique, which is based on partitioning the transition from the initial state (liquid) to the final state (solid) into multiple stages. The transition is characterized in terms of the order parameter , with if the system is in , if in , and for the transition region. The partitioning is performed via a set of interfaces at discrete positions . This means that the overall transition is split up into the calculation of smaller trajectory fragments for each stage, which are much more likely to occur.
The transition rate from state to state is then calculated by
| (8) |
where is the so-called escape flux for leaving , and the overall probability to reach coming from by crossing the interfaces with their respective transitions probabilities .
We use the direct FFS (DFFS) algorithm to calculate and . is calculated by starting an initial MD simulation run from a random phase point in and counting the number of crossings in positive -direction during a simulation time . In addition, a system configuration snapshot is stored on each crossing.
In the next step, previously stored configurations on the last interface are drawn at random and trial runs are launched starting from these points, with the possibility to either fall back to (‘failure’) or to reach the next interface (‘success’). This results in the transition probabilities , with the number of overall trials and the number of successful trials .
In our simulations, we only specify the border of the states and . The interface set is determined automatically and optimized during simulation using the exploring scout placement method from Kratzer et al. (2013), with target transition probability and exploratory runs per interface. For the implementation and parallelization we use the Flexible Rare Event Sampling Harness System (FRESHS) Kratzer et al. (2014).
With FFS, not only transition rates can be calculated, but also the physical pathways can be investigated by backtracking the successful runs. In addition, the free energy profile
| (9) |
along the reaction coordinate can be obtained by splitting up the calculation of the stationary distribution into a forward and a backward contribution Valeriani et al. (2007),
| (10) |
which in our case means that for sampling the backward contribution , we dissolve the crystallite cluster again in a reverse simulation.
III Results
III.1 Nucleation Pathways
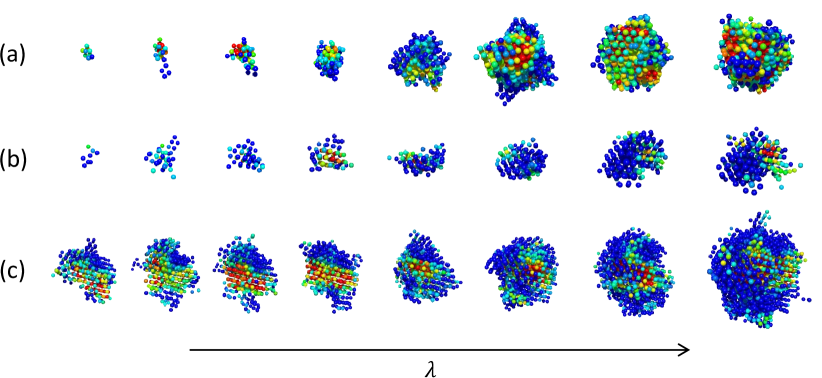
Fig. 1(a+b) show exemplary nucleation paths obtained from FFS, driving along the largest solid cluster size . A summary of the simulation details is given in Appendix A. As it can be seen, the nucleating clusters are almost spherical for both employed contact energies of the interaction potential. This is expected from CNT at these low supersaturations implying comparatively large surface tensions.
For a low contact energy of the colloids, , we indeed observe a transition to a solid phase with a strong fcc-like signature as expected from the phase diagram. This cannot be seen immediately from Fig. 1(a), because the fcc-like kernel is covered by bcc or hcp-like surface layer.
(a)
 (b)
(b)
 (c)
(c)
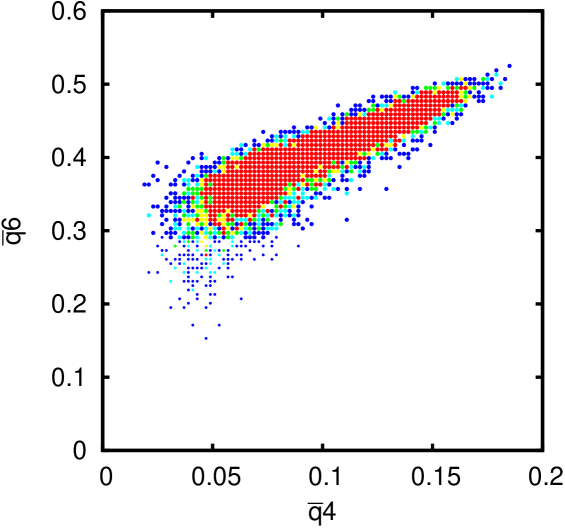
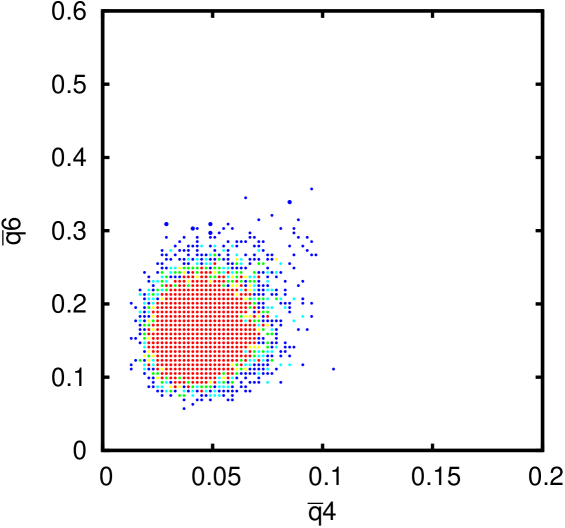
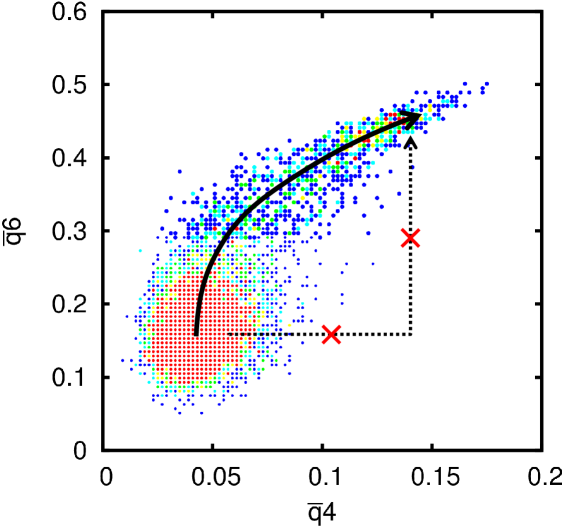
Fig. 2 shows a selection of -panels of the transition for . At , the system is mainly in the liquid state, with only a few particles being solid-like. During nucleation of solid particles () also the order parameter increases, indicating a strong tendency to a hcp/fcc-like structure. In the final state, where the main fraction of particles reside in the solid cluster, also most particles are characterized as fcc-like. The observed pathway is therefore:
We do not observe a direct transition to the hcp/fcc-like state without crossing the bcc-like domain at lower values, which is indicated by the crossed-out arrow in Fig. 2(b). The overall transition proceeds spontaneously with a mixture of bcc-like, hcp-like and fcc-like particles. This can also be seen in the real-space nucleation trace in Fig. 1(a), where the last snapshot corresponds to Fig. 2(b). There is no retardation or stay in an intermediate stage, only a crossing of the bcc-like domain (as indicated by the parentheses in the above scheme sequence).
At high contact energy , none of the pathways generated by driving along reached the thermodynamically stable fcc structure. The solid clusters rather grow spontaneously into bcc crystals, as shown exemplarily in Fig. 1(b).
In order to investigate the transition to the thermodynamically stable fcc phase, we used our FFS simulations to explicitly drive the system towards a larger cluster of fcc-like particles. To this aim, we used a different order parameter, namely the largest cluster of particles with fcc-like environment, as detected by . If started again from the bulk liquid, FFS is not able to drive cluster growth, indicating that is not a good reaction coordinate for this nucleation. While FFS does not require the order parameter to be a reaction coordinate Allen et al. (2009), it becomes very ineffective if the order parameter is not correlated with the actual reaction coordinate. What we therefore observe is that fourfold symmetry alone does not allow for stable solid clusters, which we will confirm later. The transition of a bulk bcc phase to a bulk fcc phase also involves a large energy barrier and thus is also extremely unlikely to happen. Hence, we can conclude that there exist no transitions of the form
| liquid | ||||
| bcc |
However, it is possible to grow the stable fcc phase from configurations containing critical bcc-like clusters. Such a small bcc-like cluster can transform into an fcc-cluster, which then continues to grow. We obtain these starting configurations from the second to last automatically placed FFS interface, because we chose the target transition probability to . This means that no additional interface is placed beyond a committor value of Bolhuis et al. (2002), which corresponds to the committor value at the critical cluster size. For example, the trace in Fig. 1(c) was obtained by starting from the rightmost configuration shown in Fig. 1(b). Effectively, this corresponds to an order parameter that is the largest solid cluster in the beginning, and, after a certain size, turns over into an order parameter that corresponds to the largest cluster of fourfold symmetry. Since for this to work the solid cluster needs to be stable, and we can start at earliest from a critical bcc cluster.
Fig. 3 summarizes the transitions for . The first row shows the most likely spontaneous transition when the system crystallizes into a bcc crystal. This corresponds to the real-space trace in Fig. 1(b). Only a few colloids have higher values, which is much less than for the case. Hence, the spontaneous transition reads
The second row in Fig. 3 shows the case where we drove the system to a higher number of fcc-like particles starting from critical bcc-clusters, that is, the transition
| bcc-critical |
Note that in this case the system initially gains sixfold symmetry faster than fourfold symmetry, despite our driving along . This shows that our order parameter is still not a good reaction coordinate, however in this case good enough so that FFS can enforce the fcc transition. What we observe is that the bcc cluster grows slightly above the critical size before transforming into fcc, so that the overall transition is much less smooth than for . The overall transition can thus be characterized as
III.2 Two-stage nucleation
This behavior can be explained naturally if nucleation in Yukawa systems is a two-stage process with two free energy barriers, one for the first transition to the bcc-like structure and another one for the second transition to the hcp/fcc-like structure.
The height of the bcc-fcc free energy barrier is dependent on the contact value . In the first case of , the energy barrier for the transition bcchcp/fcc can be overcome spontaneously and is therefore hidden during the nucleation process. In contrast, for , the system is more likely to nucleate a bcc-like critical cluster, and performs a second transition to the stable fcc phase only at a later stage. This indicates a higher barrier than in the previous case, which in simulations can only be overcome by using rare event sampling again.
The fact that we observe the latter transition only starting from critical bcc clusters can be understood from the scenario. Fig. 4 shows a representative snapshot of a slice through the cluster during nucleation.
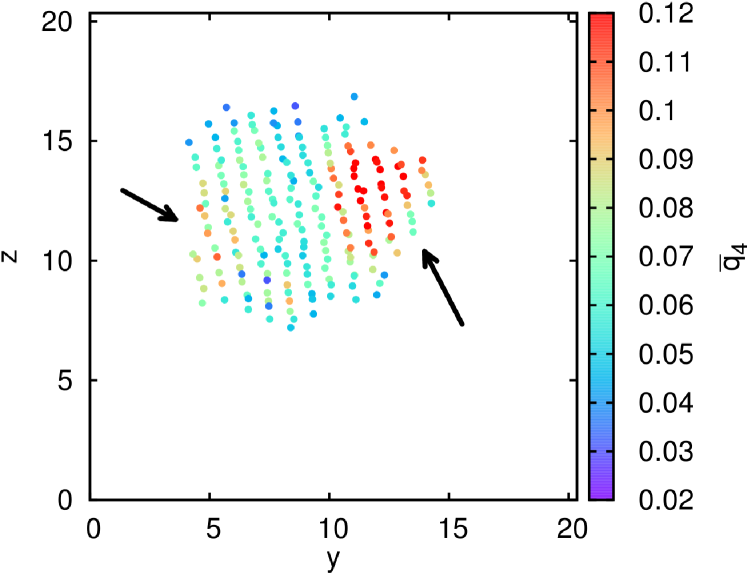
We observe that the main fluctuations occur at the surface. Thus, the fcc structure is preferentially grown from these fluctuations at the liquid-bcc interface of the growing bcc cluster. This can be explained by assuming a free energy barrier between bcc and fcc. The corresponding nucleation event is facilitated by the presence of the liquid-bcc surface. In other words, the fcc phase is heterogeneously nucleated from the bcc phase, even though we start from a homogeneous bulk liquid.
III.3 Precursors
The investigation of precursors is possible by backtracking the successful transition pathways to the border of state , namely to the snapshots on from which the critical clusters are nucleated.
Note that the snapshot on is the result of the initial MD simulation run for the escape flux calculation and was sampled without driving the system with an order parameter. We ensured that the crystal cluster on is the one from which the critical cluster is nucleated by monitoring the center of mass of the crystal cluster during the nucleation process. There are no discontinuities in the center of mass offsets relative to the box in our traces, which means that we grew only one largest cluster in the system and that there are no other clusters with a competing size.
Fig. 5 shows slices through the 3D system at the early stage (first row) and at the stage of the critical cluster (second row).
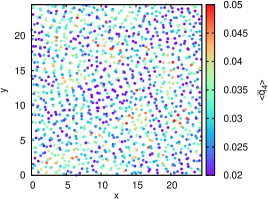
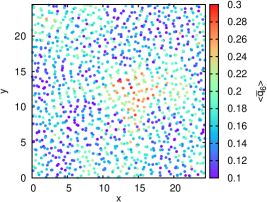
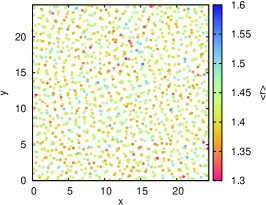
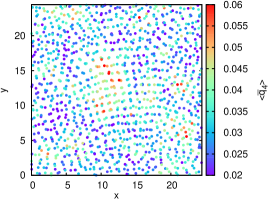
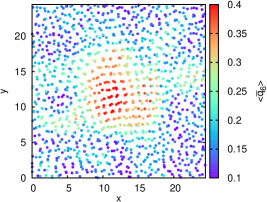
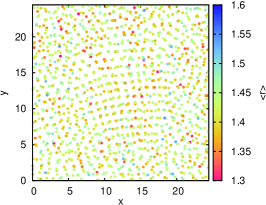
The panels show the and values for all particles as well as the averaged neighbor distances of the particles, which corresponds to a density map. For better visibility, we transformed the overall system snapshots according to the center of mass of the critical cluster for both stages.
We find that there are no correlations with the location of the critical cluster at the early stage for the parameter and with the density, the values are distributed randomly over the whole domain. This a posteriori explains why nucleation cannot be driven by the order parameter from the bulk liquid.
In contrast, the order parameter shows already elevated values at the corresponding position where the critical cluster will nucleate. Thus, the distribution is the quantity of the system which shows a distinct indication at this early stage where the critical cluster will form and can be seen as a precursor in this case. As the border is from the initial brute-force simulation run, this can not be an artifact from the FFS simulation being driven by the , and therefore demonstrates retrospectively that this was a good choice for an order parameter.
III.4 Comparison to CNT
For comparing to classical nucleation theory, we calculated the free energy difference by computing the stationary distributions according to Eq. (10) in a forward and a backward FFS simulation run. In addition, the brute-force sampling of the order parameter distribution in state was fitted by a least-square fit to the profile as described in ref. Valeriani et al. (2007). Note, that for we only report the free energy landscape for the liquid bcc transition. As shown, the second transition to the hcp/fcc-like state occurs much later, and that will not change the energy landscape before the critical cluster size.
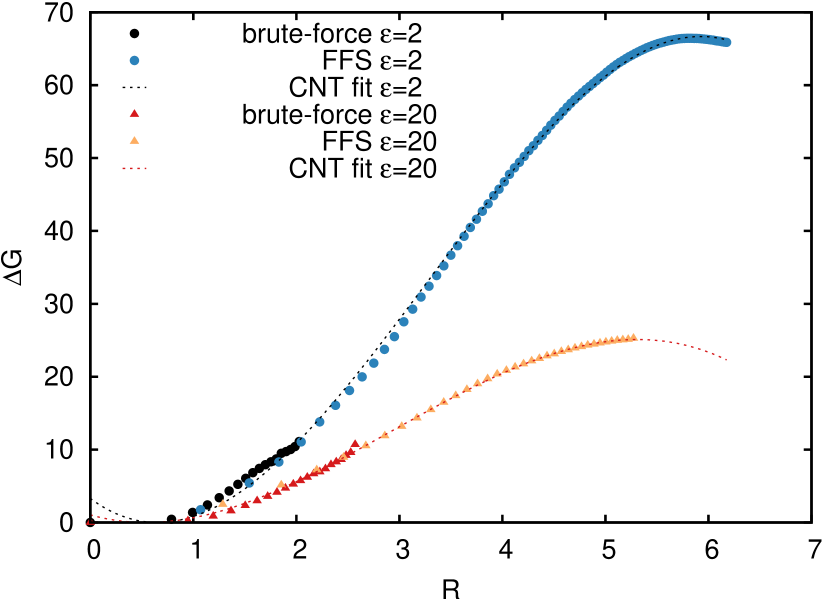
Fig. 6 shows the profile for and , which we obtain using an effective radius and assuming spherical cluster growth. Note that the simulations have been performed with a threshold for the identification of solid particles. This threshold influences the cluster size because the profile decays smoothly at the border of the cluster. Therefore, we introduce a shift in the cluster size , which in our case is and for the contact energies and , respectively, i. e. less than a particle diameter. This shows that the common choice of is indeed suitable to describe solid nucleation.
Table 2 summarizes the fitting results.
For we obtain an effective critical cluster size of , a chemical potential difference of and a surface tension of , and for we obtain , , and . These values are comparable to previous work using the umbrella sampling technique Auer and Frenkel (2002).
The last interface positions and , which were placed automatically in the FFS simulations, coincide with the critical cluster size . This confirms that the interface placement in FFS simulations of ref. Kratzer et al. (2013) can be used to estimate the location of the top of the barrier by setting a desired transition probability of , which corresponds to the committor value at Bolhuis et al. (2002).
IV Discussion
We have presented simulation results on the liquid-fcc nucleation of charged colloids at two phase points with different contact energies.
The formation of a crystal cluster is indicated by precursor clusters with local sixfold symmetry at an early stage. There are no correlations with the local density or fourfold symmetry in our simulations. The nucleation is therefore initiated by spontaneous local ordering into a bcc-like structure as predicted by Alexander and McTague Alexander and McTague (1978), rather than density fluctuations, as previously discussed Russo and Tanaka (2012); Tan et al. (2014).
Our main observation is that the liquid-fcc nucleation of the colloids is a two-stage process passing through an intermediate bcc-like phase. Thus, there are two energy barriers towards the thermodynamically stable fcc-phase, which are dependent on the contact energy value. For a low contact energy, the second energy barrier can be overcome spontaneously and the transition can be treated as a direct liquid hcp/fcc-like transition, with only a weakly metastable bcc-like phase in between. In contrast, for a high contact energy, the system crystallizes with high probability into a bcc-like state. Starting from this phase, the second transformation to hcp/fcc occurs. The second bcc-fcc transformation does not occur in a bulk bcc-like phase, but rather in a post-critical bcc-like cluster. This transformation again resembles a nucleation event, but this time of a cluster of fourfold local symmetry in a bcc crystallite. The transformation is greatly facilitated by the presence of the liquid-bcc surface, and thus, this second transformation is a heterogeneous nucleation, although we started from a homogeneous liquid. We quantified this process to occur with a transition rate of with respect to the surface of the critical-bcc cluster.
Despite of the fact that we observe a heterogeneous nucleation of the fcc phase from inside a bcc cluster, the free energy landscape is well-described by CNT. This is due to the fact that the crystallites are surprisingly spherical, and that the initial nucleation of the bcc crystallite is the rate limiting factor.
Acknowledgments
A.A. and K.K. would like to thank the German Research Foundation (DFG) for financial support of the project within the Cluster of Excellence in Simulation Technology (EXC 310/1) at the University of Stuttgart. Computational resources were provided by the HLRS Stuttgart.
Appendix A FFS details
Simulation 1: ,
| 0 | 1 | 2 | 3 | 4 | 5 | 6 | |
| 5 | 21 | 44 | 69 | 92 | 116 | 145 | |
| – | 0.002 | 0.002 | 0.004 | 0.016 | 0.011 | 0.009 | |
| 7 | 8 | 9 | 10 | 11 | 12 | 13 | |
| 172 | 204 | 239 | 274 | 313 | 352 | 392 | |
| 0.021 | 0.017 | 0.021 | 0.026 | 0.037 | 0.058 | 0.068 | |
| 14 | 15 | 16 | 17 | 18 | 19 | 20 | |
| 444 | 491 | 538 | 584 | 644 | 693 | 752 | |
| 0.051 | 0.119 | 0.143 | 0.213 | 0.202 | 0.375 | 0.401 | |
| 21 | 22 | 23 | 24 | ||||
| 806 | 865 | 1004 | 7300 | ||||
| 0.519 | 0.675 | 0.634 | 0.901 |
Simulation 2: ,
| 0 | 1 | 2 | 3 | 4 | 5 | 6 | |
| 5 | 24 | 51 | 73 | 101 | 128 | 157 | |
| – | 0.006 | 0.013 | 0.063 | 0.052 | 0.087 | 0.129 | |
| 7 | 8 | 9 | 10 | 11 | 12 | ||
| 190 | 222 | 272 | 318 | 363 | 7300 | ||
| 0.206 | 0.291 | 0.225 | 0.421 | 0.559 | 0.562 |
Simulation 3: ,
| 0 | 1 | 2 | 3 | 4 | 5 | |
| 15 | 84 | 132 | 154 | 334 | 934 | |
| – | 0.006 | 0.178 | 0.694 | 0.741 | 0.599 | |
| 6 | 7 | 8 | 9 | 10 | 11 | |
| 1383 | 1852 | 2230 | 2805 | 3434 | 5200 | |
| 0.813 | 0.952 | 1.000 | 0.971 | 0.980 | 1.000 |
Nucleation rates
References
- McPherson (2004) A. McPherson, Methods 34, 254 (2004).
- Vekilov (2010) P. G. Vekilov, Soft Matter 6, 5254 (2010).
- Kayitmazer et al. (2013) A. B. Kayitmazer, D. Seeman, B. B. Minsky, P. L. Dubin, and Y. Xu, Soft Matter 9, 2553 (2013).
- Stradner et al. (2004) A. Stradner, H. Sedgwick, F. Cardinaux, W. C. Poon, S. U. Egelhaaf, and P. Schurtenberger, Nature 432, 492 (2004).
- Palberg (1999) T. Palberg, Journal of Physics: Condensed Matter 11, R323 (1999).
- Brunner et al. (2002) M. Brunner, C. Bechinger, W. Strepp, V. Lobaskin, and H. H. von Grünberg, EPL (Europhysics Letters) 58, 926 (2002).
- Schöpe and Palberg (2001) H.-J. Schöpe and T. Palberg, in Trends in Colloid and Interface Science XV (Springer, 2001), pp. 82–86.
- Schöpe and Palberg (2002) H. J. Schöpe and T. Palberg, Journal of Physics: Condensed Matter 14, 11573 (2002).
- Wette and Schöpe (2007) P. Wette and H. J. Schöpe, Physical Review E 75, 051405 (2007).
- Hynninen and Dijkstra (2003) A.-P. Hynninen and M. Dijkstra, Phys. Rev. E 68, 021407 (2003).
- Auer and Frenkel (2002) S. Auer and D. Frenkel, Journal of Physics: Condensed Matter 14, 7667 (2002).
- Schilling et al. (2010) T. Schilling, H. Schöpe, M. Oettel, G. Opletal, and I. Snook, Physical Review Letters 105, 025701 (2010).
- Russo and Tanaka (2012) J. Russo and H. Tanaka, Scientific Reports 2 (2012).
- Tan et al. (2014) P. Tan, N. Xu, and L. Xu, Nature Physics 10, 73 (2014).
- Granasy and Toth (2014) L. Granasy and G. I. Toth, Nature Physics 10, 12 (2014).
- Ostwald (1897) Ostwald, Z. Phys. Chem. 22, 289 (1897).
- Stranski and Totomanow (1933) I. Stranski and D. Totomanow, Z. Phys. Chem 163, 399 (1933).
- Alexander and McTague (1978) S. Alexander and J. McTague, Physical Review Letters 41, 702 (1978).
- Limbach et al. (2006) H.-J. Limbach, A. Arnold, B. A. Mann, and C. Holm, Comput. Phys. Commun. 174 9, 704 (2006).
- Kolb and Dünweg (1999) A. Kolb and B. Dünweg, Journal of Chemical Physics 111, 4453 (1999).
- Weeks et al. (1971) J. D. Weeks, D. Chandler, and H. C. Andersen, J. Chem. Phys. 54, 5237 (1971).
- Azhar et al. (2000) F. E. Azhar, M. Baus, J.-P. Ryckaert, and E. J. Meijer, J. Chem. Phys. 112, 5121 (2000).
- Steinhardt et al. (1983) P. J. Steinhardt, D. R. Nelson, and M. Ronchetti, Phys. Rev. B 28, 784 (1983).
- Lechner and Dellago (2008) W. Lechner and C. Dellago, J. Chem. Phys. 129, 114707 (2008).
- Allen et al. (2006) R. J. Allen, D. Frenkel, and P. R. ten Wolde, J. Chem. Phys. 124, 024102 (2006).
- Allen et al. (2009) R. J. Allen, C. Valeriani, and P. R. ten Wolde, Journal of Physics: Condensed Matter 21, 463102 (2009).
- Kratzer et al. (2013) K. Kratzer, A. Arnold, and R. J. Allen, J. Chem. Phys. 138, 164112 (2013).
- Kratzer et al. (2014) K. Kratzer, J. T. Berryman, A. Taudt, J. Zeman, and A. Arnold, Computer Physics Communications 185, 1875 (2014).
- Valeriani et al. (2007) C. Valeriani, R. J. Allen, M. J. Morelli, D. Frenkel, and P. R. ten Wolde, J. Chem. Phys. 127, 114109 (2007).
- Bolhuis et al. (2002) P. G. Bolhuis, D. Chandler, C. Dellago, and P. L. Geissler, Annual Review of Physical Chemistry 53, 291 (2002).