Is Compton cooling sufficient to explain evolution of observed QUASI PERIODIC OSCILLATIONS in Outburst sources?
Abstract
In outburst sources, quasi-periodic oscillation (QPO) frequency is known to evolve in a certain way: in the rising phase, it monotonically goes up till a soft intermediate state is achieved. In the propagating oscillatory shock model, oscillation of the Compton cloud is thought to cause QPOs. Thus, in order to increase QPO frequency, Compton cloud must collapse steadily in the rising phase. In decline phases, exactly opposite should be true. We investigate cause of this evolution of the Compton cloud. The same viscosity parameter which increases the Keplerian disk rate, also moves the inner edge of the Keplerian component, thereby reducing the size of the Compton cloud and reducing the cooling time scale. We show that cooling of the Compton cloud by inverse Comptonization is enough for it to collapse sufficiently so as to explain the QPO evolution. In the Two Component Advective Flow (TCAF) configuration of Chakrabarti-Titarchuk, centrifugal force induced shock represents boundary of the Compton cloud. We take the rising phase of 2010 outburst of Galactic black hole candidate H 1743-322 and find an estimation of variation of parameter of the sub-Keplerian flow to be monotonically rising from to , well within the range suggested by magneto-rotational instability. We also estimate the inward velocity of the Compton cloud to be a few meters/second which is comparable to what is found in several earlier studies of our group by empirically fitting the shock locations with the time of observations.
Subject headings:
accretion, accretion disks — hydrodynamics — radiation dynamics — shock waves — stars: black holes — stars:individual (H 1743-322)1. Introduction
Study of temporal variability including signatures of quasi-periodic oscillations (QPOs) is an important aspect of astrophysics of black holes. Several models in the literature attempt to explain origin of low frequency QPOs. They include perturbation inside a Keplerian disk (Trudolyubov et al., 1999), global disk oscillation (Titarchuk & Osherovich, 2000), oscillation of wrapped disk (Shirakawa & Lai, 2002), accretion ejection instability at the inner radius of a Keplerian disk (Rodriguez et al., 2000). Titarchuk et al. (1998), envisages a bounded region surrounding compact objects which is called the transition layer (TL) and identifies low frequency QPOs as that associated with the viscous magneto-acoustic resonance oscillation of the bounded TL. Chakrabarti and his collaborators (Molteni et al., 1996; Chakrabarti et al., 2004) showed that the oscillations of centrifugal pressure supported accretion shocks (Chakrabarti, 1990a) could cause observed low frequency QPOs. According to the two-component advective flow (TCAF) model (Chakrabarti & Titarchuk, 1995) the post-shock region itself is the Compton cloud. Because the shock is formed due to centrifugal force, where energy is dissipated and angular momentum is redistributed, post-shock region is also known as the CENtrifugal pressure supported BOundary Layer (CENBOL) of the black hole. This TCAF solution has been proven to be of stable configuration (Giri & Chakrabarti, 2013) and Monte-Carlo simulations of spectral and timing properties through a time dependent radiative hydrodynamic code showed the formation of QPOs very similar to what is observed (Garain et al., 2014). The Compton cloud becomes smaller because of higher viscosity as well as higher cooling. Higher viscosity causes the Keplerian disk on the equatorial plane to move in. This causes the Compton cloud to cool down. This picture is clear from the two component model of Chakrabarti & Titarchuk (1995) and the outburst source picture given in Ebisawa et al. (1996) based on it. To our knowledge, except TCAF, no other model is found to be capable of explaining continuous and simultaneous variation of spectral properties and timing properties (see, Debnath et al., 2008, 2010, 2013, 2014a; Nandi et al., 2012).
There are mainly two reasons behind oscillation of shock wave in an accretion flow: i) Resonance Oscillation: when cooling time scale of the flow is comparable to the infall time scale (Molteni et al., 1996), this type of oscillation occurs. Such cases can be identified by the fact that when accretion of the Keplerian disk is steadily increased, QPOs may occur in a range of the accretion rates, and the frequency should go up with accretion rate. Not all the QPOs may be of this type. Some sources (for example, 2010 GX 339-4 outburst), show signatures of sporadic QPOs during rising soft-intermediate states (where QPO frequencies of in 6 Hz were observed for around 26 days; Nandi et al. (2012)), although rise in the accretion rates. In these cases the shock strength has to change in order that the resonance condition holds good. ii) Non-Steady Solution: in this case, the flow has two saddle type sonic points, but Rankine-Hugoniot conditions which were used to study standing shocks in Chakrabarti (1989) are not satisfied. Examples of these oscillations are given in Ryu et al. (1997) where no explicit cooling was used. Such type of QPOs are possible at all accretion rates, outside the regime of type (i) QPOs mentioned above. QPO frequencies depend on viscosity (higher viscosity will remove angular momentum, bring shocks closer to the black hole, and produce higher frequency QPOs), but not explicitly on accretion rate. In any case, observed QPO frequency is inversely proportional to the infall time () in the post-shock region. So, when low frequency (e.g., mHz to few Hz) QPOs are observed, generally during very early phase of an outburst or very late phase of an outburst of transient black hole candidates (BHCs), shocks are located very far away from black holes and size of the CENBOL is large. As a result, amount of cooling by photons from Keplerian disk (Shakura & Sunyaev, 1973) is high (Chakrabarti & Titarchuk, 1995; Mondal & Chakrabarti, 2013, hereafter Paper-I) and CENBOL pressure drops, moving the shock closer towards black hole (Molteni et al., 1996; Das et al., 2010; Mondal et al., 2014b, Paper-I) until pressure (including centrifugal) is strong enough to balance the inward pull. Lower shock location increases the QPO frequency. Different BHCs show different oscillation frequencies during their evolution (both in rising and declining) phases. Using Propagating Oscillatory Shock (POS) model by Chakrabarti and his collaborators (Chakrabarti et al., 2005, 2008, 2009; Debnath et al., 2010, 2013; Nandi et al., 2012) one can satisfactorily explain origin and day-wise evolution of QPO frequencies during rising and declining phases of outbursting BHCs. During rising phase shock moves towards black holes increasing QPO frequencies monotonically with time and opposite scenario is observed during declining phase, mainly in hard and hard-intermediate spectral states of the outbursts (see, Debnath et al., 2013).
Recently Debnath et al. (2014a) showed that observed QPO frequencies can be predicted from detailed spectral analysis using Two Component Advective Flow (TCAF) model as a local additive table model in XSPEC. Mondal et al. (2014a) and Debnath et al. (2014b) also showed physical reason behind spectral state transitions from spectral model fitted parameters of TCAF model for two different Galactic BHCs H 1743-322, and GX 339-4 during their outbursts. Basically, the same shock location is obtained by fitting the spectra produces QPOs through oscillations. So spectral properties are interlinked with timing properties as far as TCAF solution is concerned.
In this Paper, our goal is to explain origin of observed QPO evolution from pure analytical point of view using Compton cooling. Biggest uncertainly being that of viscosity parameter, we would like to have an idea of how viscosity usually vary with distance in a known source. We consider a transient BHC H 1743-322 during its 2010 outburst. We hope that in future, this behavior could be used to better predict QPO evolutions.
In August 2010, H 1743-322 was found to be active in X-rays (Yamaoka et al., 2010) with a characteristics of temporal and spectral evolutions (Debnath et al., 2013) similar to those observed in other transient BHCs (see for a review, Remillard & McClintock, 2006). Detailed source description is already in literature (Debnath et al., 2013; Mondal et al., 2014a, and references therein).
The paper is organized in the following way: in the next Section, we discuss governing equations of modified Rankine-Hugoniot (R-H) shock conditions in presence of Compton cooling. In §3, observed QPO evolution and what this tells us about viscosity variation in the disk as a function of radial distance. We also present phase space diagram of the flow in progressive days. Finally, in §4, we briefly discuss our results and make our concluding remarks.
2. Shock condition and shock constant
We assume the accreting flow to be thin, axisymmetric and rotating around vertical axis. To avoid integrating in a direction transverse to flow motion, we consider that the flow is in hydrostatic equilibrium in vertical direction as in Chakrabarti (1989). In TCAF, CENBOL is basically the post-shock region of a low angular momentum, sub-Keplerian flow. It is comparatively hotter, puffed up, and much like an ion supported torus (Rees et al., 1982). Due to inverse Compton cooling effect of intercepted low energy photons from a Keplerian disk, energy of CENBOL decreases and is radiated away. Energy equation at the shock is modified by,
where, is the energy loss due to Comptonization. Baryon number conservation equation at the shock is,
Since the gas is puffed up, R-H conditions (Landau & Lifshitz, 1959) have to be modified, so that only vertically integrated pressure and density parameters are important. This modification was first carried out in (Chakrabarti, 1989), where pressure balance condition was modified using vertically integrated values:
Here, and are pressure and density, integrated in the vertical direction (Matsumoto et al., 1984). In our solution, we use the Eq. (8a) of Paper-I as an invariant quantity at the shock, which is given by:
where, , and are the Mach number, radial velocity and adiabatic index of flow respectively, . Here, is adiabatic sound speed. We follow the same mathematical procedure and methodology as in Paper-I, to find shock location for a given cooling rate. In the standard theory of thin accretion flows around black holes (Shakura & Sunyaev, 1973) viscosity plays a major role. Giri & Chakrabarti (2013) showed formation of Keplerian disk for super-critical parameter (Chakrabarti, 1990b). Inflow angular momentum is transported outward by viscosity and allow it to fall into the black holes. As the shock moves closer, the angular momentum must be adjusted by viscosity so that the shock formation is theoretically allowed. For our viscosity calculation, we use the relation (Chakrabarti, 1990b):
where, , is the viscous stress, being Shakura & Sunyaev (1973) viscosity parameter. Angular momentum variation from Eq. (3) can be written as
where, is the change in angular momentum due to viscous transport.
2.1. Methodology of calculation
We analyze archival data of observational IDs of RXTE/PCA instrument (only PCU2, all layers) starting from 2010 August 9 (Modified Julian Day, i.e., MJD = 55417.2) to 2010 August 16 (MJD = 55424.1), selected from rising phase of 2010 outburst of H 1743-322. We carry out data analysis using FTOOLS software package HeaSoft version HEADAS 6.14 and XSPEC version 12.8. For generation of source and background ‘.pha’ files and spectral fitting (in keV energy range) using combined disk blackbody and power-law models, we use same method as described in Debnath et al. (2013). After achieving best fit based on reduced chi-square value (), we integrate only power-law component of the spectrum. This can be written as:
where, and are the lower and the upper limits of energy. For interstellar photo-electric absorption correction, we follow the prescription of Morrison & McCammon (1983). To calculate cooling time of the Compton cloud (CENBOL) from observed spectrum, we consider distance correction in following way: we multiply the integrated spectrum by the model normalization value () of , where ‘’ is source distance in kpc unit and ‘’ is the disk inclination angle. In case of H 1743-322, we use source distance = kpc, and (Steiner et al., 2012). We keep hydrogen column density (NH) frozen at 1.6 1022 atoms cm-2 for absorption model wabs and assume a % systematic error for all observations (Mondal et al., 2014a).
3. Results
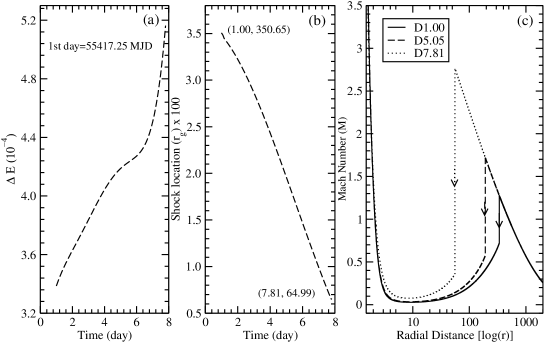
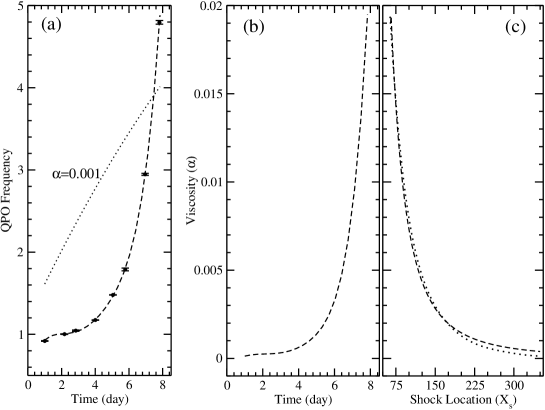
In this Paper, we study origin and evolution of QPOs in outbursting BHC H 1743-322, from a purely analytical point of view. In Chakrabarti & Titarchuk (1995) and Das & Chakrabarti (2004), it was shown that matter from the companion is heated up due to compression and puffed up due to centrifugal barrier to form CENBOL. Low energy photons from a Shakura & Sunyaev (1973) disk with an accretion rate of are intercepted by CENBOL and are emitted as high energy photons after inverse Comptonization. In Fig. 1a, we show that the rate of cooling of the CENBOL in progressive days during the rising phase of the outburst. As day progresses, amount of cooling increases and shock moves towards the black hole (MSC96), which is shown in Fig. 1b. On first observed day of the outburst (MJD = 55417.2), location of the shock ( in Schwarzschild radius ) was at and at the end of our observation (MJD = 55424.1), it reaches at . In Fig. 1c, we show Mach number variation of the flow in day (solid curve, shock was at ), day (dashed curve, shock was at ) and day (dotted curve, shock was at ) of the outburst. We calculate the velocity of movement of the shock to be , which roughly matches with the final velocity of shock wave calculated from the POS model fit of the QPO frequency evolution (see, Debnath et al., 2013). In Fig. 2a, we show variation of observed QPO frequencies with time. If viscosity parameter were constant throughout the outburst then the variations of theoretically calculated QPO frequencies would be different. Dotted curve drawn for a viscosity parameter () shows that QPO frequency increases at almost constant rate. The dashed curve of Fig. 2a is for the effect of non-linear variation of the viscosity, which is shown in Fig. 2b. As the day progresses, viscosity adjusts in such a way that the angular momentum can produce a shock at a suitable place satisfying R-H conditions. Chakrabarti & Molteni (1995) and Giri & Chakrabarti (2012), with their extensive numerical simulations showed that angular momentum distribution depends on viscosity parameter. In our solution, at the beginning of the outburst during the hard state, from MJD=55417.2 to MJD=55420.2 (Debnath et al. 2013; MDC14), varies from - to -. During the hard-intermediate state, from MJD=55421.3 to MJD=55424.1 (Debnath et al., 2013; Mondal et al., 2014a), varies rapidly from - to -. Our calculation is for sub-Keplerian component only. In Fig. 2c, we show the variation of with shock location. Dashed curve shows variation from our analytical solution, whereas dotted curve is a fitted polynomial, which gives a general trend and could be used in other systems. We see that , where, (=, with asymptotic standard error ) and (=, with asymptotic standard error ) are constants for this BHC. It is to be noted that this viscosity parameter is computed for the sub-Keplerian flow component only.
4. Discussions and Concluding Remarks
QPOs in black hole candidates are very stable features. They are seen day after day, though the frequency may be drifted slowly as the object goes from hard to soft state in the rising phase. This is generally observed in most of the outbursting BHCs (Nandi et al., 2012; Debnath et al., 2013, and references therein). Propagatory oscillating shock solution can explain such frequency drifts very well (Chakrabarti et al., 2008; Debnath et al., 2013). These phenomenological model is found to be justified when we actually compute shock drifts from radiated energy loss from a self-consistent transonic solution. We find that in order to have Rankine-Hugoniot conditions satisfied on each day, viscosity parameter must be evolving too. If the outer boundary condition is kept fixed, increase in viscosity parameter causes shock to drift outward (Chakrabarti & Molteni, 1995; Giri & Chakrabarti, 2012), but if the inner boundary condition is kept fixed, the shock moves inward (Chakrabarti, 1990a; Das & Chakrabarti, 2004). We find support of the latter phenomenon in an outbursting source where matter supply is changing and viscosity enhancement steadily brought the shock closer to the black hole. Cooling is found to rise day by day and so is . Such a movement of the shock increases QPO frequency as is observed. Our result establishes consistency in theoretical understanding of the observed data: as cooling increases, observed QPO frequency increases due to drifting of the shock towards black hole in a way that the cooling time scale roughly matches with the infall time scale. This process brings the object towards the softer states as is observed. Shock locations were found to be located at the right place (i.e., R-H conditions are satisfied), only if viscosity is not strictly constant, but gradually rises from to from the first day to seventh day. It is to be noted that there are alternative models (Titarchuk & Fiorito, 2004; Titarchuk et al., 1998) where the corona is supposed to oscillate at its eigen frequency and the viscosity required in this case is around . This appears to be too high as compared to what we find in the present paper. The discrepancy could be due to the fact the latter models rely on oscillations of a Keplerian disk with high angular momentum and they require higher viscosity to reduce it drastically. In our case, on the contrary, the oscillating CENBOL is highly sub-Keplerian to begin with. Therefore, a little viscosity is enough the transport requisite angular momentum. This range of we require is in the same ball park as obtained from numerical simulations (Balbus & Hawley, 1991; Arlt & Rüiger, 2001; Masada & Sano, 2009) of magnetorotational instability (MRI).
Acknowledgments
S. Mondal acknowledges the support of CSIR-NET scholarship.
References
- Arlt & Rüiger (2001) Arlt, R. & Rüdiger, G., 2001, A & A, 374, 1035
- Balbus & Hawley (1991) Balbus, S. A. & Hawley, J. F., 1991, ApJ, 376, 214
- Chakrabarti (1989) Chakrabarti, S. K., 1989, MNRAS, 340, 7
- Chakrabarti (1990a) Chakrabarti, S.K., 1990a, “Theory of Transonic Astrophysical Flows”, World Scientific (Singapore)
- Chakrabarti (1990b) Chakrabarti, S. K., 1990b, MNRAS, 243, 610
- Chakrabarti & Titarchuk (1995) Chakrabarti, S.K. & Titarchuk, L.G., 1995, ApJ, 455, 623
- Chakrabarti & Molteni (1995) Chakrabarti, S. K. & Molteni, D.G. 1995, MNRAS, 272, 80
- Chakrabarti et al. (2004) Chakrabarti, S. K., Acharyya, K. & Molteni, D., 2004, Astron. Astrophys., 421, 1
- Chakrabarti et al. (2005) Chakrabarti, S.K., Nandi, A., Debnath, D., Sarkar, R., & Datta, B. G., 2005, IJP, 79(8), 841 (astro-ph/0508024)
- Chakrabarti et al. (2008) Chakrabarti, S.K., Debnath, D., Nandi, A. & Pal, P.S., 2008, AA, 489, L41
- Chakrabarti et al. (2009) Chakrabarti, S.K., Dutta, B.G. & Pal, P.S., 2009, MNRAS, 394, 1463
- Das & Chakrabarti (2004) Das, S. & Chakrabarti, S. K. 2004, IJMPD, 13, 1955
- Das et al. (2010) Das, S., Chakrabarti, S.K., & Mondal, S., 2010, MNRAS, 401, 2053
- Debnath et al. (2008) Debnath, D., Chakrabarti, S. K., & Nandi, A., et al., 2008, BASI, 36, 151
- Debnath et al. (2010) Debnath, D., Chakrabarti, S. K., & Nandi, A., 2010, AA, 520, 98
- Debnath et al. (2013) Debnath, D., Chakrabarti, S. K., & Nandi, A., 2013, AdSpR, 52, 2143
- Debnath et al. (2014a) Debnath, D., Chakrabarti, S. K., & Mondal, S., 2014a, MNRAS Letters, 440, 121
- Debnath et al. (2014b) Debnath, D., Mondal, S., & Chakrabarti, S. K., 2014b, MNRAS (submitted)
- Ebisawa et al. (1996) Ebisawa, K., Titarchuk, L., & Chakrabarti, S. K., 1996, PASJ, 48, 59
- Garain et al. (2014) Garain, S., Ghosh, H. & Chakrabarti, S. K., 2014, MNRAS, 437, 1329
- Giri & Chakrabarti (2012) Giri, K., & Chakrabarti, S. K., 2012, MNRAS, 421, 666
- Giri & Chakrabarti (2013) Giri, K., & Chakrabarti, S. K., 2013, MNRAS, 430, 2836
- Landau & Lifshitz (1959) Landau, L. D. & Lifshitz, E. M., 1959, Fluid mechanics, Pergamon press, Oxford
- Masada & Sano (2009) Masada, Y. & Sano, T. 2009, IAU Symposium No. 259, 121
- Matsumoto et al. (1984) Matsumoto, R., Kato, S., Fukue, J. & Okazaki, A.T., 1984, PASJ, 36, 71
- Mondal & Chakrabarti (2013) Mondal, S., & Chakrabarti, S. K., 2013, MNRAS, 431, 2716 (Paper-I)
- Mondal et al. (2014a) Mondal, S., Debnath, D. & Chakrabarti, S. K., 2014a, ApJ, 786, 4
- Mondal et al. (2014b) Mondal, S., Chakrabarti, S. K. & Debnath, D., 2014b, Ap&SS, 353, 223
- Molteni et al. (1996) Molteni, D., Sponholz, H. & Chakrabarti, S.K., 1996, ApJ, 457, 805
- Morrison & McCammon (1983) Morrison, R & McCammon, D, 1983, ApJ, 270, 119
- Nandi et al. (2012) Nandi, A., Debnath, D., & Mandal, S., et. al., 2012, AA, 542, 56
- Remillard & McClintock (2006) Remillard, R. A. & McClintock, J. E., 2006, ARA&A, 44, 49
- Rees et al. (1982) Rees M., Begelman M., Blandford R. & Phinney E., 1982, Nature, 295, 17
- Rodriguez et al. (2000) Rodriguez, J., Varnire, P., Tagger, M. & Durouchoux, Ph., 2000, A&A, 387, 487
- Ryu et al. (1997) Ryu, D., Chakrabarti, S. K. & Molteni, D., 1997, ApJ, 474, 378
- Shakura & Sunyaev (1973) Shakura, N. I. & Sunyaev, R. A., 1973, A&A, 24, 337
- Shirakawa & Lai (2002) Shirakawa, A. & Lai, D., 2002, ApJ, 564, 361
- Steiner et al. (2012) Steiner, J. F., McClintock, J. E., & Reid, M. J., 2012, ApJ, 745, L7
- Titarchuk et al. (1998) Titarchuk, L., Lapidus, I & Muslimov, A., 1998, ApJ, 499, 315
- Titarchuk & Osherovich (2000) Titarchuk, L & Osherovich, V., 2000, ApJ, 542, 111
- Titarchuk & Fiorito (2004) Titarchuk, L & Fiorito, R., 2004, ApJ, 612, 988
- Trudolyubov et al. (1999) Trudolyubov, S., Churazov, E., & Gilfanov, M., 1999, A&A, 351, L15
- Yamaoka et al. (2010) Yamaoka, K., Negoro, H., & Sugizaki, M., et al., 2010, ATel, 2378, 1