Box/Peanut and Bar structures in edge-on and face-on SDSS nearby galaxies I. Catalogue
Abstract
We investigate Box/Peanut and bar structures in image data of edge-on and face-on nearby galaxies taken from SDSS (Sloan Digital Sky Survey) to present catalogues containing the surface brightness parameters and the morphology classification. About 1700 edge-on galaxies and 2600 face-on galaxies are selected from SDSS DR7 in g, r and i-band. The images of each galaxy are fitted with the model of 2-dimensional surface brightness of Sérsic bulge and exponential disk. After removing some irregular data, Box/Peanut, bar and other structures are easily distinguished by eye using residual (observed minus model) images. We find 292 Box/Peanut structures in the 1329 edge-on samples and 630 bar structures in 1890 face-on samples in i-band, after removing some irregular data. Then the fraction of Box/Peanut galaxies is about 22 percent against the edge-on samples, and that of bar is about 33 percent (about 50 percent if 629 elliptical galaxies are removed) against the face-on samples. Furthermore the strengths of the Box/Peanut and bar are evaluated as “Strong”, “Standard” and “Weak”. We find that the strength increases slightly with increasing (Bulge-to-Total flux ratio), and that the fraction of Box/Peanut is generally about a half of that of bar irrespective of the strength and the . Our result supports the idea that the Box/Peanut is bar seen edge-on.
keywords:
Galaxies:classification, fundamental parameters, statistics1 Introduction
A Box/Peanut (hereafter B/P) structure of disk galaxy, also called boxy bulge, is known as a galactic morphology with 2-dimensionally axial symmetric and vertically extended shape like a box or peanut around the galactic center (Jarvis, 1986; Lütticke et al., 2000a; Patsis et al., 2002b; Buta et al., 2007). It is seen only in edge-on disk galaxies. Since the surface brightness of B/P part is generally fainter than those of bulge and disk, it is not conspicuous except for some famous galaxies (e.g., NGC 128 (Burbidge & Burbidge, 1959), NGC 2654 and NGC 4469 (deVaucouleurs et al., 1976)).
Previously several authors have discussed the origin and dynamics of B/P. The theoretical studies are classified roughly as the following three ideas. Hypothesis 1: The B/P is a bar; the B/P is the side-on view of the bar having a vertical shape of “figure of infinity” (Combes & Sanders, 1981; Bureau & Freeman, 1999; Lütticke et al., 2000a, b; Athanassoula & Misiriotis, 2002; Patsis et al., 2002b; Chung & Bureau, 2004; Williams et al., 2011). Hypothesis 2: The B/P is a remnant of infalling satellite galaxy to the host galaxy. When the satellite falls on the host at an oblique angle, the tidal force makes the orbits of satellite stars be the “figure of infinity” around the host galaxy and then is seen as B/P, while it yields a polar-ring galaxy when the satellite falls at nearly a right angle (Whitmore & Bell, 1988; Lütticke et al., 2004). Hypothesis 3: The B/P is a cross sectional view of cylindrically extended disk formed from vertical orbit resonance of disk stars. The vertical resonance of disk stars is generally thought to be associated with the perturbation by bar, but it occur not only in barred galaxies but also in normal spiral galaxies (Patsis et al., 2002a).
Here is a question whether the B/P feature is major or rare in the universe. It is important to estimate the fraction (abundance ratio) of the galaxies having B/P structure against all edge-on spiral galaxies from observational study, because the expected fraction is significantly different between these hypotheses. The first hypothesis leads the fraction of B/P galaxies against all disk galaxies (hereafter B/P fraction) to be somewhat lower than that of barred galaxies, because the B/P structure would not be detected when we look the bar from end-on, i.e., the end-on view of “figure of infinity” would not be such a B/P shape but be a round or elliptical shape as a normal bulge. Therefore the B/P fraction is thought to be roughly about a half of barred galaxies; roughly 20 to 30 percent against all edge-on spiral galaxies in this idea, because the bar (including strong bars (SB) and weak bars (SAB)) fraction in the present universe is about 40 to 50 percent in optical bands observation (e.g., 43 percent by deVaucouleurs et al. (1991), percent by Marinova & Jogee (2007), 48-52 percent by Barazza et al. (2008)). The second hypothesis leads to only a few percent of the B/P fraction, because such case as the elongated shape of satellite galaxy orbiting around the host galaxy is seen like the B/P is thought to be rare, as Lütticke et al. (2004) have already pointed out. In the third hypothesis, the cylindrical disk would always look like the B/P when it is seen edge-on. In this idea the B/P feature is not concerned with the view angle (side-on or end-on). Thus the B/P fraction would be relatively high, about the same as that of bar, i.e., about 40 to 50 percent. If spiral galaxies (normal and barred) have commonly the the vertical resonance orbits of disk stars, the B/P fraction would be significantly higher than that of bar.
The B/P fraction has not been well established from observation, because of the difficulty of extracting the B/P from a large number of data. Since the B/P is generally not obvious and lies on the bright region of galaxy, it is necessary to carry out an image processing to enhance the B/P feature. The previous observational studies in 1980s to 2000s have claimed that various B/P fractions; 1.2 percent (Jarvis, 1986) to 45 percent (Dettmar & Barteldrees, 1988; Lütticke et al., 2000a). Such various values would be caused by the difficulty of finding the B/P structure and the quality of data and the difference of the difinition of B/P. Jarvis (1986) has found 30 B/P galaxies by eye estimation from the ESO/SERC J sky servey south (declination -18 degree) photographic plates and has reported that the B/P fraction is 1.2 percent against all disk galaxies, however the “all” disk galaxies include those of various inclination. Shaw (1987) has found 23 B/P galaxies by eye estimation from 117 edge-on galaxies of RC2 (therefore the B/P fraction is about 20 percent) using the ESO/SERC J or POSS R-band survey plates using isophote contour maps. Lütticke et al. (2000a) has reported that 330 B/P galaxies by eye estimation taken from 734 edge-on disk galaxies (therefore the B/P fraction is 45 percent) of RC3 using mainly isophote contour maps of DSS (Digitized Sky Survey) and partly CCD images obtained from various telescopes. However, their sample data contain a large number of late-type (Sc-Sd) galaxies (111 B/Ps in 249 Sc-Sd galaxies), of which bulges are generally ambiguous in the DSS images. Many of these late-type B/Ps are “type 3” in the paper, i.e., “bulge is close to box-shaped, not elliptical”, and thus the B/P fraction may be somewhat overestimated.
We define the B/P feature in this paper as follows: an apparent surface brightness feature of a disk galaxy seen like a box or a peanut other than an elliptical bulge component and a disk component, projected on the celestial sphere, distributing near the galactic center and on the vertical direction of the galaxy. Hence the B/P feature in this difinition can be detected as a residual of surface brightness when those of bulge and disk are subtracted from the galaxy image, if exists.
It is important to research the B/P fraction using recent large survey digital data of which quality is relatively high and homogeneous, such as SDSS. Furthermore, it is also important to analyze both edge-on and face-on galaxies with a same process to extract the B/P or bar structures when we consider the relationship between B/P and bar.
We use sample data of nearby galaxies taken from SDSS DR7 (Abazajian et al., 2007) to research the B/P fraction for edge-on galaxies and that of bar for face-on galaxies in this paper. The SDSS image data of nearby galaxies has high quality of deep, homogeneity and resolution enough to research the B/P or bar in nearby galaxies. We carry out image processing to extract the B/P or bar other than bulge and disk. First, we perform model fitting for each observed image. The model is composed with Sérsic law bulge and exponential law disk. Then we subtract the model surface brightness from the image to make the residual images. The B/P, bar, or other faint structures are obvious in the residual images and these morphology are classified by eye. We present the catalogues of edge-on and face-on galaxies containing the results of model fitting (decomposition parameters of bulge and disk) and the morphology. Finally we investigate statistically the relation between B/P and bar and consider which hypothesis is valid for the result.
The colors and magnitudes, which are clue to investigate the stellar population and evolution, are also obtained for the sample data. The detail will be presented in the next paper II for the future. We focus on the fraction of B/P and bar in this paper.
This paper consists of the following section: Section 2 describes the data selection, Section 3 describes the model fitting and image processing, Section 4 shows the result, Section 5 is the discussion, and Section 6 is the conclusion.
2 Data
2.1 Retrieving Data
The main aim of this study is to estimate the B/P or bar fraction of galaxies using a large number of image data observed in optical wavelength band. It is necessary to use data taken from a large area survey to obtain the unbiased statistics as much as possible. It is desirable to use more than several hundred samples to research statistically. Moreover, to analyze the structures of galaxies, it is necessary to use the images having enough resolution, limit magnitude and homogeneous quality. To fulfill these requirements, we use the images of nearby galaxies (redshift is nearly zero; generally smaller than 0.1) in three optical bands (g, r and i-band) taken from SDSS DR7 data archive (http://www.sdss.org/dr7/). SDSS DR7 consists of imaging and spectroscopy data in optical five bands (u, g, r, i and z) covering 8,400 square degrees and containing 930,000 galaxies, of which photometric and spectroscopic data are automatically evaluated and tabulated in database. The data quality is usually well; the pixel size is 0.396 arcsec/pixel, the FWHM (Full Width Half Maximum) of PSF (Point Spread Function) is about 1.2 to 1.5 arcsec, and the zero point magnitude is about 24 to 25 for g, r and i-band. The images of u and z-band are not used in this paper because of the large amount of dust absorption in the galaxy in u-band and the relatively low signal-to-noise ratio (S/N) in z-band. The images of nearby galaxies have enough large size; the petrosian radii for many of our samples are about several ten arcsec. These values are enough to research the B/Ps or bars for nearby galaxies.
The SDSS catalogue data and image data are available from the above web site. The photometry data such as magnitude, size, position angle, classification (star, galaxy, quasar and so on) are available. we can easily retrieve the image data of edge-on galaxies and face-on galaxies using a suitable search condition. The edge-on samples are chosen using the following search condition in the galaxy category:
and and and and .
The values of condition (meaning that the r-band total magnitude for the object is brighter than 17 magnitude) and (the petrosian radius of r-band is larger than 10 arcsec) are chosen to obtain bright and large size nearby galaxies. These values are empirically decided, i.e., the fainter or smaller galaxies cannot be well analyzed in the following image processing (see Section 3.7). The condition of is added to obtain data having photometric error lower than 0.1 magnitude. In addition is the condition to select the data of which redshift confidence is enough high. The and are the sizes of isophotal minor axis and major axis of r-band, respectively. Thus the represents the axial ratio of the galaxy. We define “edge-on” as the axial ratio is lower than 0.25 in this paper. We cannot know the intrinsic thickness of the galaxy and the apparent inclination beforehand. The 0.25 of axial ratio may be somewhat loose to select only edge-on galaxies, because the spiral structure is occasionally appeared for some galaxies, which indicates that the galaxies are not entirely edge-on but slightly inclined. However, if we set the axial ratio to smaller value (for example, 0.2), some galaxies having large size of B/P are rejected. Note that our edge-on samples include slightly inclined galaxies.
On the other hand, the face-on samples are chosen using the search condition as follows:
and and and and .
The search condition is the same as for edge-on galaxies except for the axial ratio; larger than 0.8. In addition, only one-tenth data are extracted randomly, because the number of face-on samples is significantly larger than that of edge-on samples.
The numbers of sample data using above condition are 1716 for edge-on galaxies and 2689 for face-on galaxies.
3 Data Processing and Analysis
3.1 Reduction
We retrieve “fpC” FITS files from SDSS archive using the search condition as mentioned above section. The fpC data are rectangular images divided according to numbers of stripes and runs in SDSS. They are already well reduced, that is, flat fielding has been done to them. The data reduction that we must carry out before model fitting is as follows: 1. Subtracting bias level of 1000 ADU from the fpC images. 2. Cutting roughly these images around each target galaxy. 3. Rotating each image so that the major axis of galaxy is along to x-direction using the value of position angle taken from SDSS database. 4. Shifting the rotated images so that each galactic center is located at the center of image; , where the galactic center is regarded as the most luminous pixel around the central (bulge) region. 5. Estimating the S/N value at each pixel for each image. Field data (PSF FWHM, air mass, zero-point, and so on) for each FITS file are also obtained from SDSS catalogue. 6. Cutting off the margins of each image (upper, lower, right and left side) so that the resulting image has the S/N higher than 3.0.
3.2 Model of Surface Brightness
In general, it is not easy to make a model for the B/P itself because of the faint flux compared to bulge and disk. Since the main aim in this paper is the number counting of samples having B/P, it is not necessary to make the B/P model. As Peng et al. (2002) and other authors have already pointed out, various structures like as spiral arms, bar, nuclear, dust lane and so on other than bulge and disk are easily revealed in the residual image; the observed image minus the fitted model image. Therefore, instead of modeling B/P structure, we find by eye whether B/P (or bar) exists on residual images other than bulge and disk or not. To obtain the residual images for each galaxy, we make a surface brightness model of bulge and disk. We assume that the galaxy consists of bulge and disk, which are two main components of galaxy. Then we subtract the model from the observed one to yield the residual image.
Our model and decomposition method follows Byun & Freeman (1995). The surface brightness of galaxy is assumed to be composed with Sérsic law bulge (Sérsic, 1968) and exponential law disk (Freeman, 1970). We use the following 2-dimensional model of surface brightness:
| (1) |
| (2) |
| (3) |
| (4) |
where is a pixel coordinates from a galactic center, and are an effective intensity (flux) of Sérsic law in ADU/pixel unit and an effective radius in pixel unit for bulge, respectively, and is Sérsic law index. Moreover and are a central intensity and a scale length for disk, respectively. and are the axial ratios for bulge and disk, respectively. The model surface brightness of a galaxy is simply the sum of those of bulge and disk. We obtain sky values as the mode of the fpC image and add the values to the for each target galaxy. Finally we convolve the value with Gaussian kernel PSF; the FWHM values for each image are taken from SDSS archive.
The seven constant values (bulge , bulge , bulge , bulge Sérsic index , disk , disk and disk ) for each galaxy must be obtained from the model fitting. When , the profile is called as de Vaucouleurs law, which represents the surface brightness distribution of typical elliptical galaxies, while , it is the same as the exponential law.
Several authors (e.g., Pohlen et al. (2007)) have been presented three-dimensional disk models. Moreover a decomposition of disk into a thin disk and a thick disk may be suitable for some galaxies. However, the elaborate model needs generally more parameters to represent the structure of galaxy than simple model. The parameters used in the three-dimensional and thin/thick disk model are often sensitive to various local structures or asymmetry of the surface brightness. Hence a process of smoothing the image before the model fitting are needed to reduce the influence in Pohlen et al. (2007), however such a process may introduce an additional error for detecting B/P or bar. Furthermore considerably high S/N image are needed to fit with the elaborate model, however our sample data do not often have such a high quality. We consider that the fitting with the three-dimentional model or the decomposition of thin/thick disks are valid only for ideal cases of nearly symmetry edge-on galaxies and having high S/N image. On the other hand, the two-dimentional disk model used in this paper is flexible to represent the disk surface brightness projected on the celestial sphere, regardless for edge-on or face-on. The main theme is to count B/P or bar structures using an uniform method, hence the two-dimentional model is sufficient for the purpose.
3.3 Fitting Method
We use a simple fitting program developed originally to decompose the 2-dimensional surface brightness into bulge and disk for each galaxy. Although several excellent softwares of model fitting, cf. “galfit” package (Peng et al., 2002) of IRAF, have been open to the public, we use the original fitting program because of the simplicity (only seven parameters for two components of bulge and disk) and the ease of customization for our aim of analyzing thousand data.
Our fitting program is based on the algorithm of Levenberg-Marquardt method taken from “Numerical Recipes in C” (Press et al., 1988) and modified it to 2-dimensional version (see also Yoshino & Ichikawa (2008)).
Prior to the model fitting, the values of flux in the observed galactic image are read from the FITS file to a text format file in ADU unit for each pixel: . The parameter values of model surface brightness for each galaxy are calculated from a least square fitting, as minimizing totally (chi-square)), which is the sum of square of difference between the observed values and those of model. The is defined as follows:
| (5) |
where the weight is set to the noise level of each pixel; . The “gain” value is also taken from SDSS archive.
The is firstly calculated using initial values of parameters and then the gradient of in the parameter space is calculated. The resulting parameter values are obtained as the solution of the matrix of partial differential equations of against each parameter. Then the process is repeated, substituting the resulting parameter values for the previous values. The fitting is terminated when the becomes a minimum value. The reduced , which is defined as / degree of freedom, is thought to be an index of success of fitting. In general, it is expected to be about 1 when the model is well fitted with the observation.
Dust lane, foreground stars, neighborhood galaxies and so on often overlap on the target galaxy. It is preferable to mask such regions if we would be like to obtain the pure surface brightness of the galaxy. However, the area and the criterion to be masked should be flexible according to various cases. It is not easy to apply automatically a simple and flexible masking method to various cases in a large number of data. Thus the regions of dust lane, foreground stars or neighborhood galaxies are not masked in this paper.
3.4 Sérsic Law Index of Bulge
The Sérsic law index of bulge in equation (1) defines the sharpness of bulge profile on galactic center, and it is generally thought to be about 1/4 to 1. In general, fine resolution and small size PSF are needed to define the bulge index from the model fitting. However, many of apparent sizes of bulges in our sample galaxies are somewhat small and thus the bulge profiles are affected considerably by a PSF of seeing. After our first trial, we found that it is difficult to obtain simultaneously the seven parameters including the bulge index from the model fitting, i.e., the fitting iteration are not converged within several ten times iteration of our fitting program and tend to become unreasonable values.
However, if the index is fixed to an appropriate value beforehand, the other six parameters tend to converge to suitable values by only a few times iteration. Therefore the index is set to any of the following four constant values; 1.0, 0.75, 0.5 and 0.25. They are chosen as typical values to represent the bulge surface brightness. Then the other six parameters are obtained in the fitting. Then we find that the best model with the minimum .
The value of is decided for i-band data, in which the seeing is usually better and the dust absorption is smaller rather than other band data, i.e., we firstly analyze the i-band data to decide the index , and then we analyze g- and r-band data applying the value.
3.5 Inputting Initial Values
It is necessary to input initial values to the parameters in equation (1) and (2) when the fitting program starts. When the initial values are appropriate (i.e., close to the final solution), the probability of the success of fitting will be high. Otherwise, the parameters may not converge or become unreasonable values (extremely large, extremely small, infinity or lower than zero). Thus we prepare initially forty template models having suitable values of parameters as described below. We expect that any of these models will resemble to the target galaxy and thus it will fit successfully. We apply sequentially these templates for each sample galaxy in the fitting script to search a best set of parameter values.
Assuming , the other initial parameter values are randomly
selected in the following range:
Bulge effective intensity : 5 to 50 ADU/pixel (corresponding
to of 21.7 to 23.8 in i-band),
Bulge effective radius : 2 to 10 arcsec,
Bulge axial ratio : 0.3 to 1.0,
Disk central intensity : 10 to 100 ADU/pixel (corresponding
to of 20.9 to 23.2 in i-band),
Disk scale length : 5 to 30 arcsec,
Disk axial ratio : 0.1 to 0.3,
where the and are the SDSS asinh magnitudes
corresponding to the and , respectively. The
transformation method is described in the Section 3.6.
The initial models assuming the other Sérsic index values (, 0.5 and 0.75) and other bands are also made. To match the real observation, these values are slightly varied as the index (i.e., the value is set to lower for the lower ) and bands.
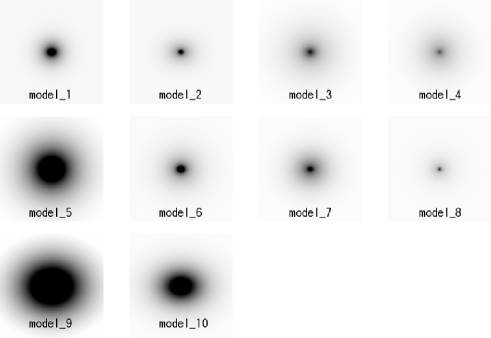
We also make the initial template models of face-on galaxies. The initial models for face-on galaxies are equal to those for edge-on galaxies except for the disk axial ratio (b/a), which is set to be 0.7 to 1.0 instead of the 0.1 to 0.3 for edge-on.
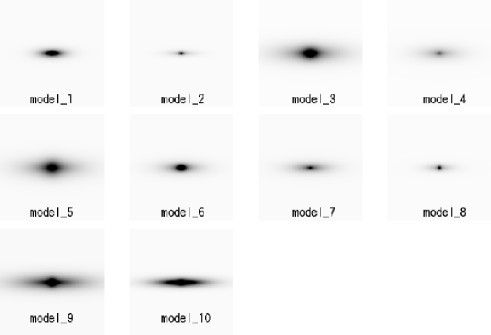
Fig.1 shows the ten initial models for edge-on. In addition Fig.2 shows those for face-on. Finally we prepare 40 initial models (10 models for each bulge index , 0.5, 0.75 and 1.0) for edge-on, and also 40 models for face-on. In fact, the bulge models of or 0.75 are well fitted rather than those of or 0.5 in many cases of our samples.
We empirically find that the Levenberg-Marquardt method is considerably flexible for the input initial values, especially for apparently bright and large size galaxies. However, the fitting for faint or small size galaxy is not successfully finished when the initial model galaxy is considerably different from the target galaxy. We do not carry out more trials than the above forty initial models for such a faint or small galaxy because we cannot waste the machine running time. However the 40 models are generally suitable to obtain the fitting results in many cases.
3.6 Transformation from Flux to Magnitude
The value of effective intensity (flux) of bulge surface brightness in ADU/pixel unit is transformed to the corresponding magnitudes in unit using the following algorithms of “SDSS asinh magnitude system”:
| (6) |
| (7) |
where is a count rate (count/second), is the pixel scale 0.396 (arcsec/pixel), is the exposure time 53.9 (seconds), is the zero point magnitude, is the extinction coeffient, is the degree of airmass, is a asinh softening coefficients taken from SDSS archive. The of disk central intensity in unit is also calculated from the instead of the above .
The integrated flux for bulge is also calculated from the model surface brightness of bulge;
| (8) |
where the integration is for all pixels of the image, is the bulge surface brightness model of equation 1. Using disk instead of bulge , we also obtain the disk integrated flux .
Using the equation of (6) and (7), we can obtain the integrated bulge magnitude and that of disk . We add the suffix to them to distinguish the observed band. Then, , and mean the bulge magnitude for g, r and i-band, respectively, and , and mean those of disk. The galactic total (whole) flux is obtained from the simple sum of and , and the magnitude , and are also obtained in the same way.
We also calculate a bulge-to-total flux ratio , which is a useful index to evaluate Hubble type of the galaxy, is easily obtained as the ratio of integrated flux of both component, i.e., . , and are those of g, r and i-band, respectively.
The values of brightness in this paper are not corrected by the absorption of Our Galaxy, because the absorption is negligible for the SDSS samples, which are located in the region far from the galactic plane of Our Galaxy.
3.7 Error Estimation Using Model Galaxy Images
Error of fitting parameter is the difference between a true value and a value obtained by the fitting. In general, the error is caused by the background noise, optical limit, pixel resolution and PSF in the image. Here we make and analyze various artificial galaxy images to estimate the error. We regard the standard deviation of scattering between the input values and the output values for the models as the typical error. The images are made by various parameter values which are generated randomly within the range of 4 to 200 ADU/pixel for bulge , 0.5 to 5.0 arcsec for bulge , 0.3 to 1.0 for bulge , 10 to 500 ADU/pixel for disk , 3.0 to 30.0 arcsec for disk , and 0.1 to 0.3 for disk .
To mimic the observed images, typical noise level and FWHM (1.2-1.5 arcsec) of PSF are added to the images and then the fitting program is applied to those images. We make one thousand models for each four Sérsic index of bulge model and each band. Then the images are analyzed using the same procedures as those for real galaxies.
The resulting values of parameters obtained from our fitting procedure are compared with the initial values. The scattering between the input and the output for the one thousand models is thought to be the error occurred in a probability.
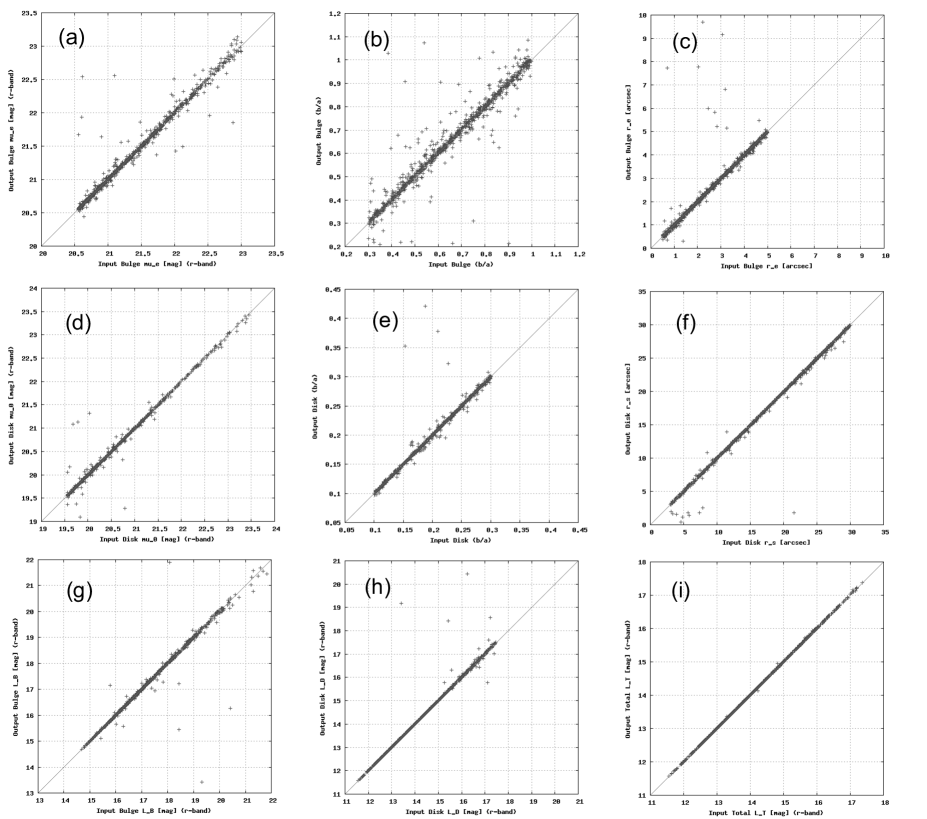
Fig.21 in Appendix shows the comparison of input and output parameters for the models of Sérsic bulge and r-band. Other cases of bulge models and bands are also investigated and the results are similar to the Fig.21. We empirically find that the scattering for extremely faint galaxies having and are significantly large. We consider that these data are unreliable and thus they are removed in the Fig.21. (However the data having either or are relatively well reproduced and thus they are included.) After removing such extremely faint models, the standard deviations for bulge and disk are about 0.13 and 0.13 , respectively, and those of bulge and disk are about 1.3 arcsec and 0.8 arcsec, respectively. Those for the integrated flux in magnitude unit , and are about 0.31 mag, 0.27 mag and 0.005 mag, respectively. There are some outlier data in the figures. They are mainly caused by the confusing bulge (assumed ) with disk because both profiles are exponential. When other values (0.25, 0.5 and 0.75) are assumed, the outlier data are reduced. If the outlier data are excluded, the standard deviations are rather small than the values described above. In addition we find that the scattering of bulge axial ratio (Fig.21(b)) is somewhat larger than that of disk (Fig.21(e)). The reason is that the small structure of bulge are influenced by the noise and PSF rather than disk.
Overall the errors of model fitting are small within the above ranges. For caveat, however, the error would be caused by various factors other than the image quality (resolution, noise and PSF): contamination of foreground stars, neighborhood galaxies, errors of pointing (the position angle of the major axis or the location of the galactic center) or inappropriate initial template model, and so on. The error due to the contamination or the image processing is large when the galaxy is faint. Hence we use conservatively the condition rather than in this paper. Note that the total errors would be larger than the above values. In practice the results (the obtained parameters and the residual images) are confirmed by eye for each real sample after the fitting as described in the following Section 3.9.
3.8 Elliptical Galaxies
The sample data include elliptical galaxies, because the morphology is not considered in the selection condition in Section 2. Since the fraction of B/P or barred galaxies against all disk galaxies is the main subject in this paper, the elliptical galaxies should be excluded from our samples. In fact, our edge-on samples would contain rarely elliptical galaxies, because such extremely elongated elliptical galaxies as axial ratio lower than 0.25 are very rare. On the other hand, the face-on samples contain considerably the ellipticals. We therefore should remove the elliptical galaxies from the face-on samples.
Elliptical galaxies are generally thought to have a simple profile of de Vaucouleurs law. However, we find that they could be often also fitted with our model of Sérsic law bulge plus exponential disk. Thus, instead of using model fitting to distinguish ellipticals from spirals, we identify them by eye on the residual images described in Section 3.10. In practice we can identify elliptical galaxies as having an apparently no spiral, no patchy cloud in outer region, but having a concentrated core and/or inner disk-like ring in the galactic center.
3.9 Data Selection
After the model fitting, we check the resulting parameter values, the profiles of observed and fitted model, and the residual images by eye. Most of data are considered to be well fitted to the models, however some data are not well fitted (i.e., the resulting parameters do not converge to reasonable values). These failure of fitting are caused by the following reasons; irregular shape of galaxy (e.g., merger, irregular galaxy, dusty galaxy, extremely diffuse galaxy and so on), some extra components superposed on the target galaxy (bright foreground stars or neighbor galaxies), or the failure of image processing (mainly error of the centering due to contamination by bright neighbor sources near the galactic center). The fraction of failure data is about 1/5 against all sample data.
Reduced (hereafter ) is one useful index to verify the fitting result. Fig.3 shows the frequency of the resulting s for edge-on galaxies. Fig.4 is that of face-on. These figures indicate that the reduced s are roughly 1 to 3 and that most of our data are well fitted with model.
However, there are some data having . To exclude these wrong data, it would be appropriate to set an upper limit for the , but the upper limit is ambiguous and arbitrary. In some cases bright foreground stars let the be large but the galaxy itself seems to be relatively well fitted to the model. Moreover, since the B/P or bar is the proper extra components other than bulge and disk, some right data may be excluded if we set strictly the upper limit of . We therefore empirically set the limit, checking all sample data by eye on the residual/original images.
As the result, we find that the limit can be set to relatively loose. That is to say, the fitting result is regarded as usable in many cases to find the structures other than bulge and disk even if the is about 3 to 10. However, if it is larger than 10, the residual images are not useful to discover the structures and thus the result is not reliable. Therefore we exclude the data of which is higher than 10 in this paper. In addition, we exclude the data having parameter values of obviously strange; or are larger than 5 or smaller than 0.02; these values of axial ratios are thought to be not natural. Such unreasonable values of parameters would imply that the fitting falls into a local minimum of and that an another better model may exist. Due to limited time to analyze, we do not examine extra other initial models, however.
We finally select 1253, 1312 and 1329 in g, r and i-band for the edge-on data and 2042, 2020 and 1890 in g, r and i-band for the face-on data, respectively.


3.10 Residual Images and Visual Classification
The residual images for each galaxy are produced by the following process. First, the values of model surface brightness are produced using the result of fitting. Second, the numeric data of in text format file are transformed to the images in FITS format. Third, we subtract the model image from the observed image (i.e., subtraction of flux values in ADU unit for each pixel) to produce the residual image using IRAF (version 2.14)111IRAF is distributed by the National Optical Astronomy Observatories, which are operated by the Association of Universities for Research in Astronomy, Inc., under cooperative agreement with the National Science Foundation..
Finally both the residual and the original images are displayed side by side using SAOimage DS9 (version 5.2) (Joye & Mandel, 2003) with option “-scale mode 90” to be inspected by eyes.
The B/P, bar, spiral arms, rings, satellites, merger remnant and other structures in the galaxy appear clearly in the residual image rather than in the original image for each galaxy if they exist, as we have expected. Since we focus on the structures of B/P (edge-on) and bar (face-on) in this paper, they are classified to sub-class; strong, standard and weak. We mark them as follows:
-
•
Box/Peanut:
-
–
bx+: Strong Box/Peanut. B/P structure is strong and seen clearly like as X-shape on both side of vertical direction.
-
–
bx: Standard Box/Peanut. The boxy shape is obvious but the X-shape is not clear.
-
–
bx-: Weak Box/Peanut. The boxy shape is not obvious, but a rectangular structure exists along vertical direction other than the bulge and disk. The X-shape is not seen.
-
–
-
•
Bar:
-
–
br+: Strong bar. Bar structure, overlying on galactic center, is equal to or greater than spiral arms.
-
–
br: Standard bar. Bar is obvious but is not outstanding compared with spiral arms.
-
–
br-: Weak bar. Bar is not obvious and generally small, but exists certainly other than the bulge, disk or spiral.
-
–
The other features are also roughly classified. Since we focus on the B/P and bar, the other features are simplified as long as possible. We classify the other features as “nm” (normal), “el” (elliptical), “ir” (irregular), “ov” (oval), “rg” (ring) and “mg” (merger), and they are not divided into the sub-classes in detail like as traditional Hubble-de Vaucouleurs classification (e.g., RSAB(rs)bc). In practice, such a elaborated visual classification is appropriate not for edge-on galaxies but for face-on galaxies. Instead of the elaborated classification, we can infer simply early type or late type for each galaxy using the value; the larger value indicates earlier type.
-
•
nm: Normal disk galaxy (both edge-on and face-on). No B/P or bar structure is distinguished. In general, dust lane or spiral arms are seen.
-
•
el: Elliptical galaxy (only for face-on). The surface brightness is significantly smooth. A bright core and/or an inner small disk like as Saturn ring exists generally in the residual image. A diffuse ring or shell structure exists occasionally on far from the galactic center. Spiral arms or bar are not found.
-
•
ir: Irregular galaxy; including Magellanic type, starburst galaxy and significantly disturbed spiral galaxy.
-
•
ov: Oval structure; spheroidal or elliptical component around the galactic center, having a smooth surface brightness like as elliptical galaxy. The oval resembles a normal bright bulge but the structure exists other than bulge in the residual image. It also seems to be an intermediate type between bar and bulge.
-
•
rg: Ring structure; including outer ring, inner ring and “pseudo ring” (Buta et al., 2007). In many cases the ring is combined with oval (or bar) and bright companion galaxies.
-
•
mg: Merger. Companion galaxies are conspicuous and are seemingly merging into the host galaxy in the image. We do not investigate whether a real gravitational interaction between the host and the companion exists or not.
When multiple features exist for a galaxy, they are written side-by-side. For example, “br-rg” shows that the galaxy has “weak bar” and “ring”. Note that the galaxy marked like as “bx” or “br” has also generally normal bulge, disk and spiral arms. Namely “nm” represents that the galaxy has no special features other than bulge, disk, spiral arms and dust lane.
We evaluate individually the morphology of galaxy against each band. In fact, some structure are recognized in g-band but are not recognized in i-band, and vice versa. The difference of the quality of image between the bands would give a fluctuation of judgment. Therefore the classification for a galaxy would vary from g-band to i-band in this paper. Our classification is not united among the three bands, because the difference of structures from bluer band to redder band is also interesting data to research. We discuss the difference in detail in the following section.
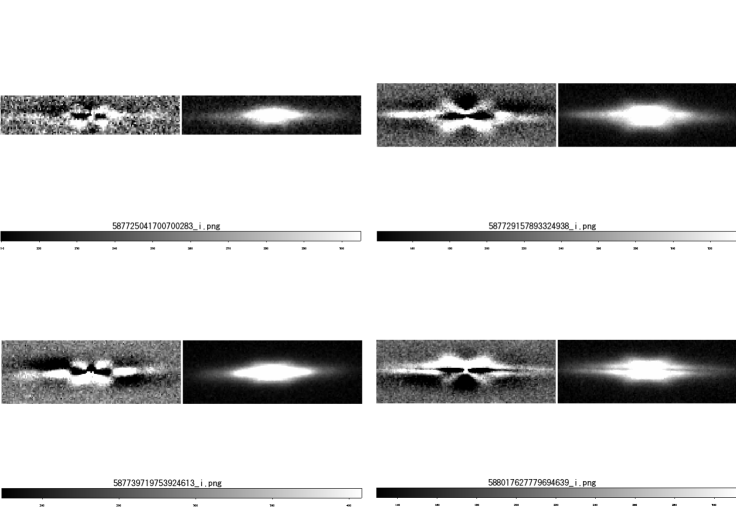
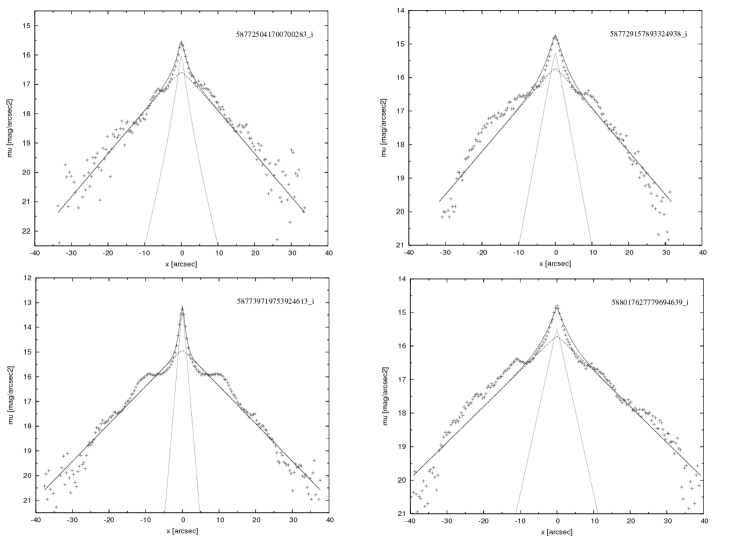
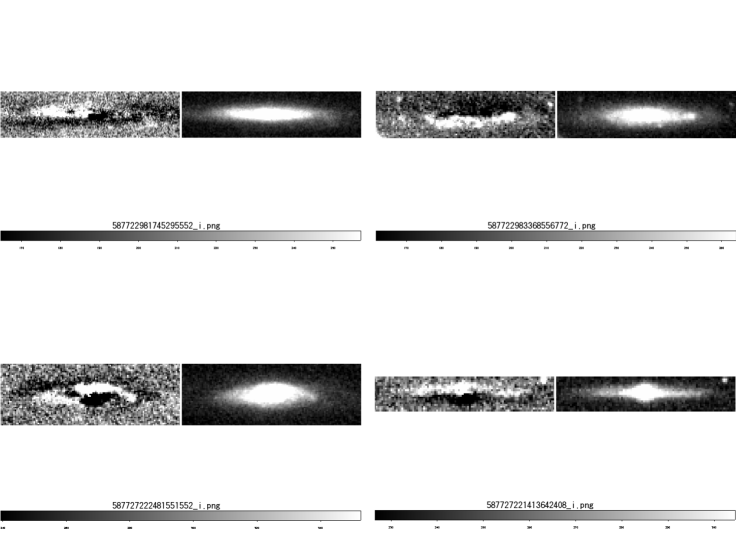
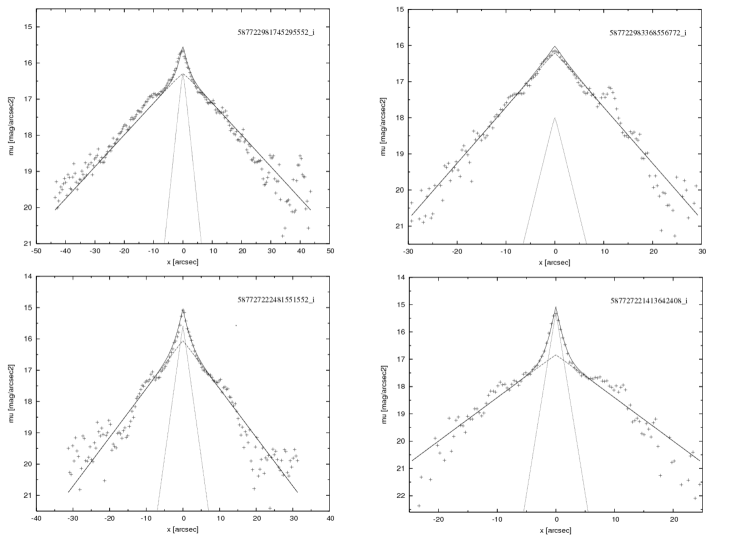
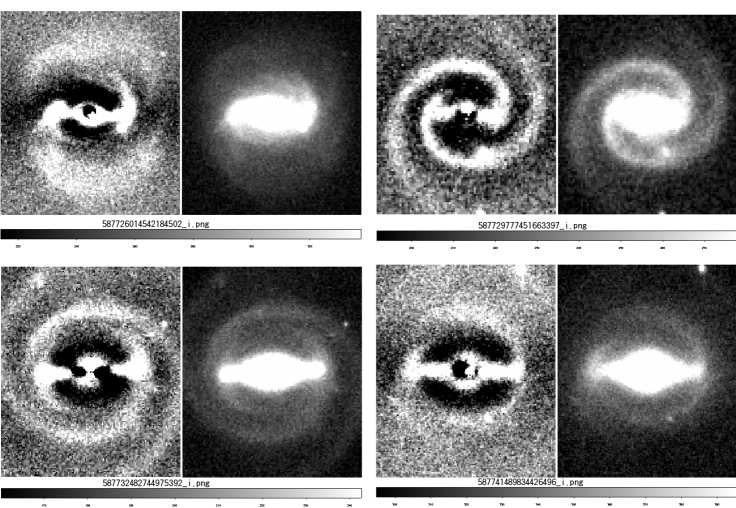
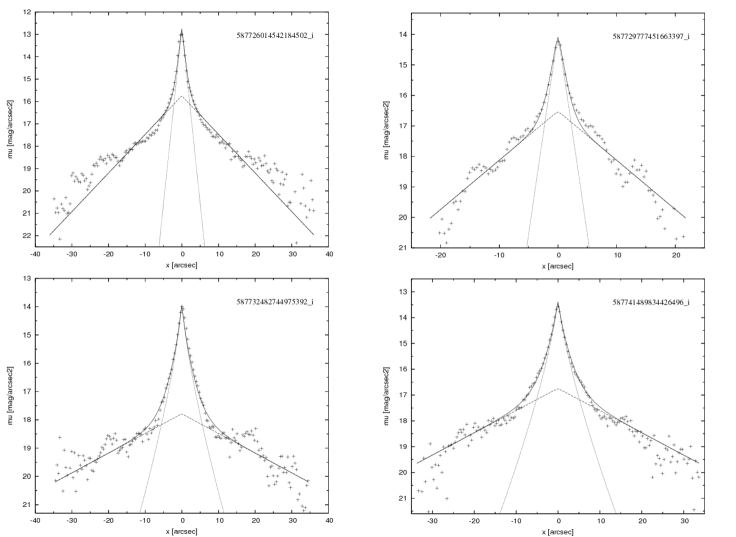
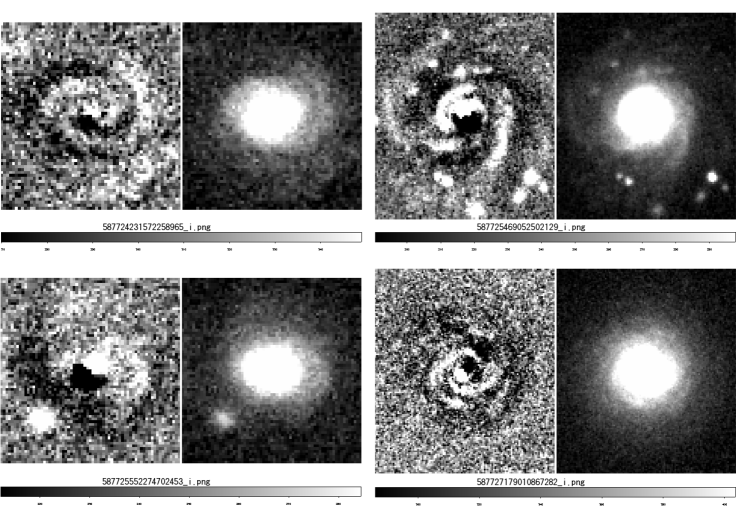
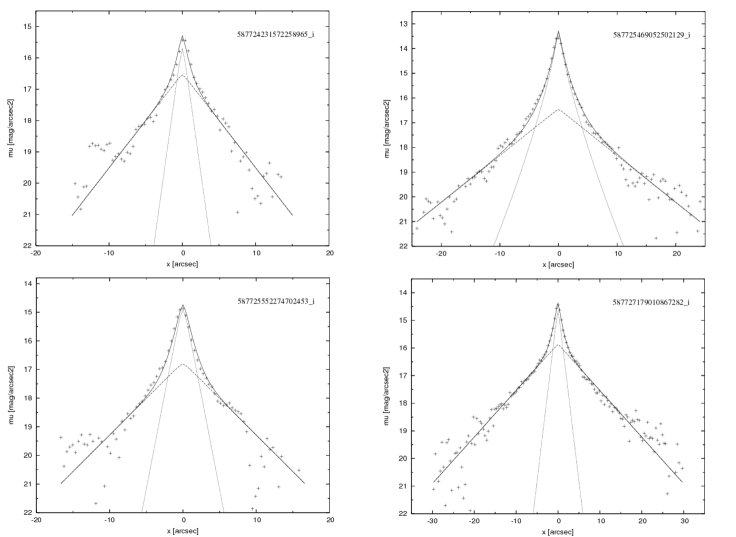
Fig.5 shows the residual (left panel) and original (right panel) images in i-band for four “bx+” sample galaxies. Fig.6 illustrates the corresponding profiles of observed and models (bulge, disk and total) along the major axis for each object of Fig.5. The residual images of each object in Fig.5 clearly show the B/P features compared to the original images, as we have expected. The profiles in Fig.6 indicate that the model fitting are generally successful. Fig.7 and Fig.8 are those for four samples of typical “nm” (normal) disk galaxies of edge-on. Fig.9 and Fig.10 are those for typical “br+” (Strong bar) galaxies. Fig.11 and Fig.12 are those for typical “nm” galaxies of face-on.
We often find a pair of shoulders on the both sides of profiles for the edge-on samples in both of Fig.6 and Fig.8. They locate roughly in the end of bulge irrespective of the morphology (B/P or normal). The shoulders of profiles are also found in the face-on galaxies in Fig.10 and Fig.12. However, they are somewhat weaker than those of edge-on galaxies. Since the flux density generally increases with the inclination of galaxy, it is natural that the shoulders of profiles in the edge-on galaxies are more obvious than those in the face-on galaxies. In addition the B/Ps locate generally rather close to the bulge region than the shoulders in the Fig.6. The lower-left object (SDSS-i-eon-0138) in Fig.7 is slightly inclined and the spiral arms are clearly distinguished. The corresponding profile of the lower-left of Fig.8 also shows the shoulders. Compared to the profiles with the residual images, the shoulders would coincide with the spiral arms or the end of bar (bar-arm connection) rather than the B/P or the bar main body. Note that the shoulders of profile has been often regarded as the B/P or bar by previous researchers. Our result shows that the residual images are useful tool to identify the B/Ps or bars from spiral arms compared to the original images or the one dimensional profiles.
For caveat, there exist the error of the center and that of the rotation of the galaxy image caused by our reduction processing. The center is redefined as the brightest pixel around the bulge region, instead of the center taken from SDSS database. On the other hand, the value of position angle used in the processing is directly quoted from SDSS, i.e., it is not measured with our own way. The brightest point is often slightly shifted from the center by SDSS (within a few pixels) because of a dust lane or the other bump of brightness. Then the major axis of the galaxy is parallel to x-axis (y-direction shift) in the upper-right of Fig.5. In addition, the shift of center or the other errors in the reduction would cause an error of rotation angle (within a few degrees). Lower-left of Fig.5 is the conspicuous case; the major axis of the galaxy is not consistent with x-direction. It is desirable to correct the rotation angle according the amount of shift of center, but the correction is very slight in most cases. Note that we have not carried out the correction of position angle to simplify the processing. However, the model fitting is generally successful and the B/P, bar or other structures are well detected within the error of shift of a few pixels and that of rotation of a few degrees. Thus we conclude that the influence by the errors on our result is slight and negligible.
4 Results
4.1 Catalogues of Surface Brightness Parameters and Morphology
We tabulate the results of fitting and morphology classification in Table 2 and Table 2 for edge-on and face-on samples, respectively. Column (1) in the Table 2 is an identifier. An example of the identifier is “SDSS-i-eon-0001”, meaning “SDSS data, i-band, edge-on, and the serial number 0001”. That of table 2 is “SDSS-i-fon-0001”, meaning “SDSS data, i-band, face-on, and the serial number 0001”.
The objects are ordered by the “objID” of SDSS DR7. The objID and redshift are quoted from SDSS catalogue and they are shown in column (2) and (3). Columns (4) to (15) are the parameter values of surface brightness fitting. The fluxes are represented in asinh magnitudes unit. The effective radius of bulge and the scale length of disk are represented in arcsec unit. The morphology (bx, br, nm, el and so on.) by our eye estimation is given in column (16).
The larger indicates the earlier type. Here we define the galaxies of as “Sd” type, those of as “Sc”, those of as “Sbc”, those of as “Sb”, as “Sab”, as “Sa/E” (Sa or earlier type galaxies). The classification is valid only for this paper but are useful to consider roughly the relation between the fraction and traditional Hubble type. The Hubble type transformed by the is given in column (17) of the tables.
We should note that there are some biases in this study. The Hubble type in this paper may be later than that of other studies because of the following reason: The central peak of bulge is influenced by the size of galaxy and the resolution. The central bulge profile tends to be mild and to be seemingly high Sersic (i.e., almost pure exponential) in case of low resolution (e.g., Lackner & Gunn (2012)). The seemingly exponential bulge leads the bulge flux to small (thus is small) and then the Hubble type tends to be later. In addition, there is a selection effect for edge-on samples, i.e., Sa-S0s (generally having large bulge) having axial ratio larger than 0.25 are not included in our edge-on samples. Moreover, the elliptical galaxies (32-33 percent of face-on samples) selected by eye, which are excluded in the following figures, may be partly the most early type disk galaxies. These facts on observation and/or analysis cause the low fraction of Sa or earlier galaxies in this paper compared to other studies.
We give the another galaxy name taken from “PGC” galaxies catalogue (Paturel et al., 2003) for each our SDSS object. The matching is performed using “VizieR Service” (http://vizier.u-strasbg.fr/viz-bin/VizieR) with the search condition that the corresponding object exists within 5 arcsec radius. Column (18) and (19) are the PGC number and the distances from the position of SDSS object to that of PGC in arcsec unit. The distance is generally smaller than 3 arcsec. The nearest PGC object for each our SDSS object is selected when more than one objects are found in the PGC catalogue within 5 arcsec radius. About 84-85 percent for edge-on data and about 87 percent for face-on data are matched with the PGC object.
We also present Table 4 and Table 4 containing only B/P or barred galaxies. They are extracted from Table 2 and 2, respectively. Table 4 is “The catalogue of edge-on Box/Peanut galaxies selected from SDSS”, and Table 4 is “The catalogue of face-on Barred galaxies selected from SDSS”.
The catalogues of edge-on galaxies includes 1253, 1312 and 1329 objects for g, r and i-band, respectively, and those of face-on galaxies includes 2042, 2020 and 1890 objects for g, r and i-band, respectively. In addition, the catalogues of B/P galaxies includes 228, 283 and 292 objects for g, r and i-band, respectively, and those of barred galaxies includes 732, 644 and 630 barred galaxies for g, r and i-band, respectively.
Since these tables are significantly large, only the results of 10 samples for i-band are shown for each table in this paper. The whole tables will be archived on electronic text format in CDS (http://cds.u-strasbg.fr/). The electronic version include the following additional columns: the serial number for B/P or bar, the object number using recommended SDSS format like as “SDSS JHHMMSS.SS+DDMMSS.S”, the coordinate of RA (right ascension) and DEC (declination) in epoch J2000.0 taken from SDSS DR7.
4.2 Fraction of B/P and bar
The fractions of the galaxies having B/P structure (including bx+, bx and bx-) against all edge-on sample galaxies are 228/1253 (18 percent), 283/1312 (21 percent) and 292/1329 (22 percent) in g, r and i-band, respectively. That is to say, the fraction is slightly large in i-band and small in g-band. The difference would be due to that some B/Ps embedded deeply in main component (bulge and disk) are easily found in i-band, of which light absorption by dust is reduced rather than bluer bands.
On the other hand, the fractions of the galaxies having bar (including br+, br and br-) against all face-on sample galaxies are 732/2042 (36 percent), 644/2020 (32 percent) and 630/1890 (33 percent) in g, r and i-band, respectively. However, the above data contain elliptical galaxies. The numbers of elliptical galaxies are 671, 640 and 629 in g, r and i-band, respectively. After removing them, the bar fractions are 732/1371 (53 percent), 644/1380 (47 percent) and 630/1261 (50 percent) in g, r and i-band, respectively.
The dispersion of bar fractions between the three bands would be mainly caused by the difference of S/N and the contamination of “oval” feature. It is relatively easy to distinguish the oval from other features for r-band image, of which the S/N is higher than other bands. If the S/N is low, however, the oval is sometimes not well identified by eye and tends to be classified as bar or bulge. The fractions of ovals are not negligible; 104/1371 (8 percent), 174/1380 (13 percent) and 115/1261 (9 percent) in g, r and i-band data, respectively. Consequently the bar fractions are not uniform in the three bands and that of r-band is somewhat lower than those of other bands.
4.3 Comparison with model magnitudes of SDSS catalogue
We compare the resulting model magnitudes (i.e., , and ) of this study with those of SDSS catalogue to verify the result of fitting. The method of model fitting adopted by SDSS project is similar to that of this paper. Fig.13 shows the comparison of total magnitudes of “modelMag” taken from SDSS catalogue with the resulting model magnitudes obtained from this study for the edge-on samples. Fig.14 is that for the face-on samples.
We find that our results are generally consistent with those of SDSS, though some scattering and shift are present. First, there is a trend that the scattering increases with decreasing the brightness (larger magnitude) in the figure. The scattering would be mainly caused by the background noise. Second, we find a slight systematic difference; the magnitudes of this study are slightly brighter than the SDSS values around the bright end (lower-left) of both figures, while they are somewhat darker around the faint end (upper-right). The systematic error is probably caused by the difference of galaxy model and the truncated radius. The model is composed of Sérsic bulge and exponential disk in this paper, while it is a pure de Vaucouleurs law for early type galaxies or a pure exponential law for late type galaxies in SDSS. Therefore, bulge luminosities for most of spiral galaxies are not included in the modelMag of SDSS, but are correctly included in our model. Moreover the aperture used in the photometry is different; all pixels of the rectangular area truncated at about along the major and minor axes are used to integrate the flux in this paper, while that of SDSS is a circular aperture and is truncated at 3 times of the effective radius for pure exponential profile (or at 7 times of it for pure de Vaucouleurs profile). Moreover the model fitting weighted by its flux in our analysis would also cause the difference. The weighting is suitable to fit to major bright components, but faint extended disks would tend to be underestimated. Thus the total magnitudes for faint galaxies would be somewhat darker than those of SDSS.
The standard deviations of model magnitudes between SDSS and our result are 0.22 mag, 0.20 mag and 0.23 mag for the edge-on samples in g, r and i-band, respectively. Those for the face-on samples are 0.23 mag, 0.20 mag and 0.22 mag in g, r and i-band, respectively. Overall, the results of model fitting of this study are thought to be generally consistent with those of SDSS.


5 Discussion
5.1 Comparison between the B/P Fraction and the Bar Fraction
As described in Section 4.2, the B/P fractions obtained from our analysis are about 18, 21, and 22 percent for each g, r and i-band samples, respectively. On the other hand, those of bar (after removing elliptical galaxies) are about 54, 47 and 50 percent for each g, r and i-band samples, respectively. Then the bar-to-B/P ratio is about 3.0, 2.2 and 2.3 for g, r and i-band, respectively. That is to say, the B/P fraction is roughly smaller than 1/2 of that of bar. To consider the relationship between B/P and bar, we should explore the reason.
One explanation is that the bar of edge-on view do not always look like to be B/P, as mentioned in Section 1; the end-on view of “figure of infinity” of bar would seem to be a normal round or elliptical shape as a bulge. Thus the B/P fraction in edge-on data becomes somewhat lower than that of bar in face-on data. Moreover, note that our edge-on samples include the slightly inclined galaxies. The B/Ps could not appear in these inclined data, even if they exist. Thus the contamination of inclined galaxies lets the B/P fraction be lower compared with the proper value. Therefore it would become somewhat less than the expected value. Consequently we conclude that at least our result is consistent with the hypothesis 1 in Section 1; the B/P is side-on view of bar.
5.2 Trend between fraction, strength and band
We investigate correlations between the fraction, strength and the observed band for both B/P and bar. Firstly we research the trend between the frequency of B/P strength against all edge-on samples and the observed bands. The results are following:
Fraction of Weak B/P (F(bx-)): 166/1253 (13.2 percent), 189/1312 (14.4 percent) and 155/1329 (11.7 percent) for g, r and i-band, respectively.
Fraction of Standard B/P (F(bx)): 54/1253 (4.3 percent), 82/1312 (6.3 percent) and 118/1329 (8.9 percent) for g, r and i-band, respectively.
Fraction of Strong B/P (F(bx+)): 8/1253 (0.6 percent), 12/1312 (0.9 percent) and 19/1329 (1.4 percent) for g, r and i-band, respectively.
The result is illustrated in Fig.15. Two trends are found in the figure: one is that the fraction decreases with increasing the strength, the other is that the fraction tends to increase slightly with the redder band. The reason of the trend would be mainly an absorption by dust. That is to say, the B/P structure is detected obviously in the longer wavelength band, in which the dust absorption is small. The B/P fraction in i-band is thought to be close to the true value.
The other reason may be the star population, i.e., the stars of B/P may be constructed with mainly old redder stars and thus the B/P structure is obvious in the redder band.
On the other hand, the fractions of the bar against all face-on samples (excluding ellipticals) are following:
Fraction of Weak bar (F(br-)): 352/1371 (25.7 percent), 296/1380 (21.4 percent) and 293/1261 (23.2 percent) for g, r and i-band, respectively.
Fraction of Standard bar (F(br)): 341/1371 (24.9 percent), 311/1380 (22.5 percent) and 292/1261 (23.2 percent) for g, r and i-band, respectively.
Fraction of Strong bar (F(br+)): 39/1371 (2.8 percent), 37/1380 (2.7 percent) and 45/1261 (3.6 percent) for g, r and i-band, respectively.
The result is illustrated in Fig.16. We find that the fraction decreases with increasing the strength, however only between F(br) and F(br+). Moreover the difference of the bar fraction among the bands is almost negligible. The reason would be that bars of face-on galaxies would be seldom hidden by the dust.
Note that the “Weak” include “apparently unclear” in addition to “intrinsically weak”. In fact, the average and the standard deviation of total (apparent) magnitudes in i-band are 15.220.75 for “Weak B/Ps”, that is 14.700.91 for “Standard B/Ps” and that is 14.330.63 for “Strong B/Ps”. Moreover, those of bars are 15.250.80, 14.960.89 and 13.960.72 for “Weak bar”, “Standard bar” and “Strong bar”, respectively. That is to say, the strength decreases with increasing the magnitude of galaxy. These data show that the weaker structures are partially due to the lack of S/N of images. Thus the F(bx+), F(bx), F(br+), and F(br) obtained from our analysis should be somewhat underestimated rather than those intrinsic values, while the F(bx-) and F(br-) should be somewhat overestimated.
To reduce the effect of dust absorption and S/N, We compare between the fractions of B/Ps and those of bars in i-band. The results are following: F(br+)/F(bx+) = 2.4, F(br)/F(bx) = 2.4, and F(br-)/F(bx-) = 1.9. The fact indicates that the bar-to-B/P abundance ratio for i-band data is almost constant irrespective to the strength; roughly 2 to 2.5. The fact is consistent with the idea that B/P is bar. That is to say, a strong B/P is thought to be a side-on view of strong bar, a standard B/P to be that of standard bar, and a weak B/P to be that of weak bar.


5.3 The B/P Fraction and the Bar Fraction against (Hubble Type)
We investigate the F(bx) or the F(br) versus the values (Hubble Type). Fig.17 shows the comparison between the values and the fractions of B/Ps, bars, all edge-on and all face-on (excluding ellipticals) galaxies in i-band.
We find the following trends in the figure:
1. The fractions decrease generally with increasing the for each B/P, bar, all edge-on, and all face-on.
2. The peaks lie on the type “Sc” for each B/P, bar, all edge-on. That for all face-on galaxies lies on the type “Sd”, however the difference of fractions between the two bins is small.
3. The B/P fractions are roughly about a half of the bar fractions through the .
We also investigate the relation, dividing the fractions into “Strong”, “Standard” and “Weak”. Fig.18 shows F(bx+) and F(br+) versus the . Fig.19 shows that of F(bx) and F(br), and Fig.20 shows that of F(bx-) and that of F(br-).
4. Almost the same trends (peak and gradient) exist both for F(bx+) and F(br+), both for F(bx) and F(br), and both for F(bx-) and F(br-). The averages and standard deviations of for F(bx+) and F(br+) are and , respectively. Those for F(bx) and F(br) are and , and those for F(bx-) and F(br-) are and , respectively.
5. The B/P fractions are usually roughly half of those of bars, irrespective of the strength or the .
We therefore conclude that the B/Ps have the same trend of fraction as that of bars over the Hubble type, irrespective of the strength, and that the abundance of B/Ps in the sample galaxies is roughly a half of bars. We also conclude that the strength increases slightly with increasing for both of B/P and bar. We find that both of “Strong B/Ps” and “Strong bars” lie mainly in “Sb-Sbc”, both of “Standard B/Ps” and “Standard bars” lie mainly in “Sbc-Sc” (in addition both have double peaks in the Fig.19), and both of “Weak B/Ps” and “Weak bars” lie mainly in “Sc-Sd”. That is to say, both B/P and bar tend to be strong with the earlier type galaxies, within the range from mid type (Sb-Sbc) to late type (Sc-Sd). These results also support the idea that B/P is bar seen side-on.
These trends imply the evolution of disk galaxy from later type to earlier type (e.g., Kormendy & Kennicutt (2004), Melvin et al. (2014), Sellwood (2014)). That is to say, weak features including B/P or bar may have formed firstly in Sc-Sd galaxy and then have grown up via secular evolution of bulge, bar and spiral or some accretion events of materials. Then the structures may become strong through the evolution from Sc-Sd to Sb. If violent events like major merger happen, these features may disappear and the galaxy may become an earlier type (S0-Sa or elliptical) galaxy. The evolution would be affected with the environment and thus the various type galaxies would exist in the present universe.


5.4 Comparison with Previous Studies
Previous observational studies in 1980s to 2000s have reported various values of the B/P fraction; 1.2 percent (Jarvis, 1986), over 13 percent (de Souza & dos Anjos, 1987), 20 percent (Shaw, 1987), and 45 percent (Dettmar & Barteldrees, 1988; Lütticke et al., 2000a). The variety is caused by differences in sample selection, sample size, analysis, and criteria to identify B/P structures, as Lütticke et al. (2000a) have pointed out.
Our resulting B/P fractions against nearby edge-on galaxies are about 18, 21 and 22 percent for each g, r and i-band, respectively. They are roughly intermediate between the previous papers. Our result is consistent with Shaw (1987), of which B/P fraction is 20 () percent. However, our result is seemingly inconsistent with the previous report of significantly low fraction of 1.2 percent in Jarvis (1986) and significantly high fraction of and percent in Dettmar & Barteldrees (1988) and Lütticke et al. (2000a), respectively. The low fraction of 1.2 percent reported by Jarvis (1986) is the value against the “all” disk galaxies of various inclination. Therefore the fraction should rise when only edge-on galaxies are selected. On the other hand, the high fraction of B/P reported by Dettmar & Barteldrees (1988) and Lütticke et al. (2000a) would be due to including a very weak B/P feature.
Here we compare directly bx+, bx and bx- in this study with type 1, type 2 and type 3 in Lütticke et al. (2000a), respectively. The fractions of bx+, bx and bx- in this study are 1.5, 8.8 and 12.5 percent (i-band), respectively, while those of type 1, type 2 and type 3 in Lütticke et al. (2000a) are 4.1, 15.7 and 25.2 percent (using images of B, V and R-band), respectively. Therefore the fractions for each class of our result are roughly 1/2 of those of corresponding three classes of Lütticke et al. (2000a). However, the criterion of B/P is somewhat strict in this study compared to that of Lütticke et al. (2000a); the bx- has not X-shape but boxy shape on the residual images, while the type 3 is defined as “close to box-shaped, not elliptical” on contour images of galaxies. It is possible that bx- should be corresponded not with type 3 but with type 2, and that bx would be corresponded partly with type 1 and partly with type 2. In fact, the total percentage of type 1 and type 2 is 19.8 percent, which is very close to our result of total 22 percent for bx+, bx and bx-. In addition, Shaw (1987) has pointed out that the B/P fraction is about 20 percent neglecting very weak structure. Consequently we conclude that the B/P fraction in this study is consistent with that of Shaw (1987) and that of type 1 plus type 2 of Lütticke et al. (2000a).
Our resulting bar fractions are about 54, 47 and 50 percent for each g, r and i-band, respectively. Previously many authors have reported that the fraction of barred galaxies is about 40 to 50 percent among all spiral galaxies in optical bands. For example, the fraction of barred galaxies (classified as “SB” and “SAB”) in RC3 (deVaucouleurs et al., 1991) is about 43 percent over all spiral galaxies (classified as “S”). Recently Marinova & Jogee (2007) have reported that the fraction at is about percent in optical and percent in NIR (near-infrared) band based on 180 sample spirals observation. Moreover Barazza et al. (2008) have reported that it is about 48-52 percent at from 3600 SDSS disk-dominated galaxies. Many authors (e.g., Eskridge et al. (2000); Marinova & Jogee (2007)) have reported that the bar fraction is considerably high in NIR band: about 60-70 percent. The reason of high bar fraction in NIR is generally recognized that the faint bar obscured by dust is unveiled in NIR band observation.
Our result for bar fraction is nearly consistent with or slightly larger than those of the above studies in optical bands. Since we use residual images to identify the bars, some faint bars are easily found and thus it would give slightly larger fraction than those of the previous studies.
As for the trend of B/P fraction versus Hubble type, Lütticke et al. (2000a) have already found that the peak of B/P fraction (all of type 1, type 2 and type 3) exists at Sb/Sbc and that of type 1 exist at Sa/Sab (see Fig.2 in Lütticke et al. (2000a)). On the other hand, the peak of B/P fraction (all of bx+, bx and bx-) in this paper exists at Sc in Fig.17 and that of strong B/P (bx+) exist at Sb-Sbc in Fig.18. The Hubble type transformed from the model in this paper tends to be systematically later, as described in Section 4.1. However the tendency that the peak of stronger B/P shifts to earlier type is commonly seen in Fig.18-21 of this paper and Fig.2 of Lütticke et al. (2000a). Hence we also conclude that the trend of B/P fraction against Hubble type in this paper is generally consistent with that of Lütticke et al. (2000a).
Many authors (e.g., Lackner & Gunn (2012); de Souza et al. (2004); Simard et al. (2011)) have presented the results of two-dimensional bulge-disk decomposition. Since various models are used in these papers, we compare the results with that of this study as a trend, instead of comparing directly the obtained values of model parameters.
For the model magnitude of total (bulge plus disk) or that of disk component, they are roughly in good agreement with “modelMag” of SDSS, which assumes only disk component. It indicates that the disk surface brightness is not sensitive to the existence of bulge, other structures or the data quality, especially for disk-dominated late type galaxies.
On the other hand, bulge surface brightness in late type galaxy is generally compact and is sensitive to the data quality. Sersic index of bulge, which is an important parameter to determin the degree of concentration of bulge (effective radius and effective luminosity), has been discussed by many authors. It is somewhat difficult to determin the value of index, because the bulge profile is influenced by the data quality or the other components like as dark lane. Lackner & Gunn (2012), which have presented the result of decomposition for a sample of 71,825 SDSS galaxies, have shown that the Sersic index () of bulge is considerably influenced by the S/N or resolution (see Fig.6 of their paper). That is to say, the index tends to increase (i.e., decreases) with degrading S/N, while it tends to decrease (thus increases) with degrading resolution. Simard et al. (2011) have also reported that the peak of distribution of the index exists at about 0.5 to 1 (thus is 1 to 2) for 52,897 SDSS galaxies of which magnitude is around 16-18 mag in r-band (see Fig.15 of their paper). Our result also shows that the (pure exponential bulge) is generally well fitted, i.e., about 86-87 persent for edge-on data and about 76-78 percent for face-on data have pure exponential bulge.
In addition, de Souza et al. (2004) have reported that the bulge/disk decomposition for 51 bright and large size galaxies, of which model and fitting method are almost the same as this study. The average value of Sersic index in their paper is 3.52 (), while that of the above papers and this study is almost 1. However, the difference would be explained by the difference of Hubble type and the data quality, i.e., most of the samples used in de Souza et al. (2004) are early type galaxies and have relatively high resolution and large size. Overall, our result of decomposition is thought to be approximately consistent with these previous studies, as long as we use such SDSS data with a selection bias.
We also investigate various correlations between the values of surface brightness parameters of bulge and disk, the colors, the absolute magnitudes, the morphology and so on. The detail will be described in the next paper II.
6 Conclusions
We have investigated statistically the nearby galaxies having the Box/Peanut (B/P) and bar features, using the observational data of edge-on and face-on nearby galaxies taken from SDSS (Sloan Digital Sky Survey) DR7 archive. 1716 edge-on galaxies and 2689 face-on galaxies are selected by the following condition: brighter than 17 magnitude in r-band, larger than 5 arcsec of petrosian radius, and with axial ratios smaller than 0.25 for edge-on or larger than 0.8 for face-on. They are fitted with the model of 2-dimensional surface brightness of Sérsic bulge and exponential disk. The following data have been finally selected: 1253, 1312 and 1329 samples in g, r, and i-band in edge-on, and 2042, 2020 and 1890 samples in g, r, and i-band in face-on, respectively. The residual (observed minus model) images have been produced to extract structures other than bulge and disk. The B/P, bar, oval, ring, normal, elliptical, irregular, and merger galaxies in the images are estimated by eye.
The main results are following:
1. The catalogues containing surface brightness parameters and the morphology for both edge-on and face-on galaxies have been presented.
2. We have found 292 B/P structures in the 1329 edge-on galaxies and 630 bar structures in 1890 face-on galaxies in i-band.
3. The B/P fraction is about 22 percent in the edge-on sample galaxies in i-band, and that of bar is about 33 percent in the face-on sample galaxies. After removing 639 elliptical galaxies from the face-on data, that of bar is about 50 percent.
4. The fractions decrease with increasing the strength both for B/P and bar.
5. The B/P fraction is generally roughly a half of those of bars, irrespective to the strength and the .
6. The strengths of B/Ps and bars are slightly correlated with , i.e., the strong structure are found generally in the mid type (Sb-Sbc) galaxies rather than late type (Sc-Sd) galaxies.
We have discussed the difference between the fraction of B/Ps and that of bars. The reason would be due to the viewing angle to the bar and/or the inclination of galaxy. Considering these factors, our result supports the idea that the B/P is bar seen side-on. Moreover we have compared our data with the previous observational studies. The B/P fraction is roughly the medium of those of previous studies, while the bar fraction is almost the same as many of previous studies. Various values of B/P fractions among several studies are thought to be mainly due to the criterion B/P feature.
Acknowledgments
We thank Dr. R. Lütticke (referee of this paper) for careful reading and constructive comments. Moreover we thank Dr. Yagi Yoshifumi for some helpful suggestions.
References
- Abazajian et al. (2007) Abazajian K. N., Adelman-McCarthy J K., Agüeros M. A., Allam S. S., Prieto C. A., An D., et al., 2007, ApJS, 182, 543
- Athanassoula & Misiriotis (2002) Athanassoula E., & Misiriotis A., 2002, MNRAS, 330, 35
- Barazza et al. (2008) Barazza F. D., Jogee S., & Marinova I., 2008, ApJ, 675, 1194
- Burbidge & Burbidge (1959) Burbidge E. M., & Burbidge G. R., 1959, ApJ, 130, 20
- Bureau & Freeman (1999) Bureau M., & Freeman K. C., 1999, AJ, 118, 126
- Buta et al. (2007) Buta R. J., Corwin H. G., & Odewahn S. C., 2007, The de Vaucouleurs Atlas of Galaxies (Cambridge University Press, New York)
- Byun & Freeman (1995) Byun Y. I., & Freeman K. C., 1995, ApJ, 448, 563
- Chung & Bureau (2004) Chung A., & Bureau M., 2004, AJ, 127, 3192
- Combes & Sanders (1981) Combes F., & Sanders R. H., 1981, A&A 96, 164
- de Souza & dos Anjos (1987) de Souza R. E., & dos Anjos S., 1987, A&AS, 70, 465
- de Souza et al. (2004) de Souza R. E., Gadotti D. A., & dos Anjos S., 2004, ApJS, 153, 427
- Dettmar & Barteldrees (1988) Dettmar R.-J., & Barteldrees A., 1988, BAAS, 20, 1085
- deVaucouleurs et al. (1976) de Vaucouleurs G., de Vaucouleurs A., & Corwin H. R., 1976, Second Reference Catalogue of Bright Galaxies (RC2). (University of Texas, Austin)
- deVaucouleurs et al. (1991) de Vaucouleurs G., de Vaucouleurs A., Corwin H. G., Jr., Buta, R. J., Paturel G., & Fouqué P., 1991, Third Reference Catalogue of Bright Galaxies (RC3). (Springer-Verlag Berlin, Heidelberg, New York)
- Eskridge et al. (2000) Eskridge P. B., Frogel J. A., Pogge R. W., Quillen A. C., Davies R L., DePoy D. L., et al. 2000, AJ, 119, 536
- Freeman (1970) Freeman K. C., 1970, ApJ, 160, 811
- Jarvis (1986) Jarvis B. J., 1986, AJ, 91, 65
- Joye & Mandel (2003) Joye W.A., & Mandel E. 2003, ADASS XII ASP Conference Series, 12, 489
- Kormendy & Kennicutt (2004) Kormendy J., & Kennicutt R. C., Jr. 2004, ARA&A, 42, 603
- Lackner & Gunn (2012) Lackner C. N., & Gunn J. E., 2012, MNRAS, 421, 2277
- Lütticke et al. (2000a) Lütticke R., Dettmar R.-J., Pohlen M., 2000, A&AS, 145, 405 (Lütticke et al. 2000a)
- Lütticke et al. (2000b) Lütticke R., Dettmar R.-J., & Pohlen M., 2000, A&AS, 362, 435 (Lütticke et al. 2000b)
- Lütticke et al. (2004) Lütticke R., Dettmar R.-J., & Pohlen M., 2004, A&A, 417, 527
- Marinova & Jogee (2007) Marinova I., & Jogee S., 2007, ApJ, 659, 1176
- Melvin et al. (2014) Melvin T., et al. 2014, MNRAS, 438, 2882
- Patsis et al. (2002a) Patsis P. A., Athanassoula E., Grosbol P., & Skokos Ch., 2002, MNRAS, 335, 1049 (Patsis et al. 2002a)
- Patsis et al. (2002b) Patsis P. A., Skokos Ch., & Athanassoula E., 2002, MNRAS, 337, 578 (Patsis et al. 2002b)
- Paturel et al. (2003) Paturel G., Petit C., Prugniel Ph., Theureau G., Rousseau J., Brouty M., et al., 2003, A&A, 412, 45
- Peng et al. (2002) Peng C. Y., Ho L. C., Impey C. D., & Rix H. -K., 2002, AJ, 124, 266
- Pohlen et al. (2007) Pohlen M., Zaroubi S., Peletier R. F., & Dettmar R.-J. 2007, MNRAS, 378, 594
- Press et al. (1988) Press W. H., Flannery B. P., Teukolsky S. A., & Vetterling W. T., 1988, Numerical Recipes in C (Cambridge University Press, Cambridge)
- Sellwood (2014) Sellwood J. A., 2014, Review of Modern Physics, 86, 1
- Sérsic (1968) Sérsic J. L., 1986, Atlas de galaxieas australes (Cordoba, Argentina; Observatorio Astronomico)
- Shaw (1987) Shaw M. A., 1987, MNRAS, 229, 691
- Simard et al. (2011) Simard L., Mendel T., Patton D. R., Ellison S. L., & McConnachie A. W., 2011, ApJS, 196, 11
- Whitmore & Bell (1988) Whitmore B. C., & Bell M., 1988, ApJ, 324, 741
- Williams et al. (2011) Williams M. J., Zamojsky M. A., Bureau M., Kuntscher H., Merrifield M. R., Tim de Zeeuw P., & Kuijken K., 2011, MNRAS, 414, 2163
- Yoshino & Ichikawa (2008) Yoshino A., & Ichikawa T. 2008, PASJ, 60, 493
Appendix
Here we show the figure of input-output scattering using model galaxy images mentioned in Section 3.7.
Fig.21(a)-(i) indicate the possibility of fitting errors for each parameter, assuming a condition similar to the observation limit and the sample selection for the real SDSS galaxies.
| number | objid | redshift | Sérsic | morph. | H.type | PGC | dist. | |||||||||||
|---|---|---|---|---|---|---|---|---|---|---|---|---|---|---|---|---|---|---|
| (1) | (2) | (3) | (4) | (5) | (6) | (7) | (8) | (9) | (10) | (11) | (12) | (13) | (14) | (15) | (16) | (17) | (18) | (19) |
| SDSS-i-eon-0001 | 587722981744771128 | 0.010819 | 21.16 | 0.65 | 1.43 | 1.00 | 20.06 | 0.27 | 22.11 | 18.15 | 12.87 | 12.86 | 7.65e-03 | 1.18 | nm | Sd | 42747 | 0.6 |
| SDSS-i-eon-0002 | 587722981745295552 | 0.02338 | 21.58 | 0.47 | 2.32 | 1.00 | 19.93 | 0.14 | 12.28 | 17.88 | 14.66 | 14.60 | 4.90e-02 | 1.12 | nm | Sd | 43198 | 1.7 |
| SDSS-i-eon-0003 | 587722982292652134 | 0.052575 | 20.14 | 0.76 | 1.81 | 1.00 | 19.90 | 0.20 | 6.65 | 16.45 | 15.56 | 15.17 | 3.05e-01 | 2.62 | nm | Sab | 1137726 | 1.6 |
| SDSS-i-eon-0004 | 587722982293176496 | 0.055175 | 21.54 | 0.95 | 2.74 | 0.75 | 19.93 | 0.13 | 9.08 | 16.62 | 15.42 | 15.11 | 2.50e-01 | 2.07 | nm | Sb | 91360 | 0.6 |
| SDSS-i-eon-0005 | 587722982296912216 | 0.088005 | 21.12 | 1.01 | 1.06 | 1.00 | 20.27 | 0.18 | 5.27 | 18.28 | 16.61 | 16.40 | 1.76e-01 | 1.51 | nm | Sbc | 1134074 | 1.1 |
| SDSS-i-eon-0006 | 587722982817333398 | 0.110171 | 21.82 | 0.73 | 1.69 | 1.00 | 20.50 | 0.13 | 5.45 | 18.35 | 17.13 | 16.83 | 2.47e-01 | 1.12 | nm | Sb | 1147239 | 1.5 |
| SDSS-i-eon-0007 | 587722983355514897 | 0.072341 | 21.42 | 0.84 | 1.97 | 1.00 | 19.56 | 0.20 | 5.63 | 17.45 | 15.60 | 15.42 | 1.55e-01 | 1.77 | nm | Sbc | 1158721 | 4.4 |
| SDSS-i-eon-0008 | 587722983356629128 | 0.022611 | 23.58 | 0.28 | 12.41 | 1.00 | 20.25 | 0.10 | 9.11 | 17.23 | 15.99 | 15.69 | 2.41e-01 | 1.72 | nm | Sb | - | - |
| SDSS-i-eon-0009 | 587722983368556772 | 0.02845 | 23.41 | 0.77 | 3.13 | 1.00 | 19.96 | 0.20 | 6.94 | 18.77 | 15.59 | 15.53 | 5.10e-02 | 2.44 | nm | Sc | 1159724 | 0.4 |
| SDSS-i-eon-0010 | 587722983376093603 | 0.055354 | 22.15 | 1.05 | 1.64 | 1.00 | 21.04 | 0.13 | 8.08 | 18.37 | 16.84 | 16.60 | 1.96e-01 | 0.65 | bx- | Sbc | 92993 | 0.6 |
| number | objid | redshift | Sérsic | morph. | H.type | PGC | dist. | |||||||||||
|---|---|---|---|---|---|---|---|---|---|---|---|---|---|---|---|---|---|---|
| (1) | (2) | (3) | (4) | (5) | (6) | (7) | (8) | (9) | (10) | (11) | (12) | (13) | (14) | (15) | (16) | (17) | (18) | (19) |
| SDSS-i-fon-0001 | 587722982280724639 | 0.077798 | 19.86 | 0.81 | 1.30 | 1.00 | 20.80 | 0.69 | 5.18 | 16.83 | 15.76 | 15.42 | 2.72e-01 | 1.78 | br-rg | Sb | 1135280 | 0.9 |
| SDSS-i-fon-0002 | 587722982285312179 | 0.093877 | 20.57 | 0.83 | 1.02 | 1.00 | 20.83 | 0.74 | 4.89 | 18.03 | 15.86 | 15.72 | 1.19e-01 | 3.34 | brrg | Sbc | 1137394 | 2.6 |
| SDSS-i-fon-0003 | 587722982292521047 | 0.054942 | 21.03 | 0.73 | 3.29 | 1.00 | 21.97 | 0.87 | 8.32 | 16.11 | 16.02 | 15.31 | 4.80e-01 | 0.60 | ovrg | Sa/E | 1137598 | 1.3 |
| SDSS-i-fon-0004 | 587722982829981942 | 0.053721 | 22.81 | 0.31 | 3.11 | 1.00 | 20.03 | 1.01 | 3.94 | 18.97 | 15.15 | 15.12 | 2.88e-02 | 1.12 | nm | Sd | 51632 | 0.6 |
| SDSS-i-fon-0005 | 587722983355383869 | 0.048184 | 19.42 | 0.87 | 2.05 | 0.75 | 21.27 | 1.01 | 10.32 | 15.17 | 14.50 | 14.03 | 3.51e-01 | 2.40 | ov | Sab | 1155146 | 0.4 |
| SDSS-i-fon-0006 | 587722983363248237 | 0.029861 | 20.96 | 0.55 | 3.54 | 0.75 | 20.99 | 0.94 | 8.67 | 16.04 | 14.63 | 14.37 | 2.14e-01 | 5.75 | brmg | Sb | 49446 | 1.7 |
| SDSS-i-fon-0007 | 587722983892648021 | 0.084617 | 21.19 | 0.47 | 3.10 | 0.75 | 21.03 | 0.82 | 5.05 | 16.73 | 15.92 | 15.50 | 3.21e-01 | 1.49 | br | Sab | 1169724 | 0.1 |
| SDSS-i-fon-0008 | 587722983895990379 | 0.024142 | 21.83 | 0.89 | 1.29 | 1.00 | 20.55 | 0.84 | 6.79 | 18.71 | 14.74 | 14.71 | 2.51e-02 | 7.78 | br- | Sd | 46266 | 0.3 |
| SDSS-i-fon-0009 | 587722983905100085 | 0.037183 | 21.17 | 0.89 | 1.13 | 1.00 | 20.27 | 0.90 | 6.00 | 18.34 | 14.61 | 14.57 | 3.12e-02 | 2.59 | br- | Sd | 52431 | 0.4 |
| SDSS-i-fon-0010 | 587722984432402632 | 0.048132 | 22.10 | 0.42 | 3.05 | 0.75 | 19.55 | 0.85 | 3.48 | 17.81 | 15.08 | 14.99 | 7.47e-02 | 1.39 | br-rg | Sc | 3082174 | 0.7 |
| number | objid | redshift | Sérsic | morph. | H.type | PGC | dist. | |||||||||||
|---|---|---|---|---|---|---|---|---|---|---|---|---|---|---|---|---|---|---|
| (1) | (2) | (3) | (4) | (5) | (6) | (7) | (8) | (9) | (10) | (11) | (12) | (13) | (14) | (15) | (16) | (17) | (18) | (19) |
| SDSS-i-eon-0010 | 587722983376093603 | 0.055354 | 22.15 | 1.05 | 1.64 | 1.00 | 21.04 | 0.13 | 8.08 | 18.37 | 16.84 | 16.60 | 1.96e-01 | 0.65 | bx- | Sbc | 92993 | 0.6 |
| SDSS-i-eon-0014 | 587724198283575324 | 0.021312 | 19.91 | 1.07 | 1.23 | 1.00 | 19.09 | 0.22 | 7.25 | 16.69 | 14.44 | 14.31 | 1.12e-01 | 3.28 | bx+ | Sbc | 7114 | 1.4 |
| SDSS-i-eon-0022 | 587724234257924238 | 0.04169 | 21.26 | 1.08 | 1.41 | 1.00 | 19.29 | 0.22 | 6.35 | 17.74 | 14.94 | 14.86 | 7.09e-02 | 0.87 | bx | Sc | 8373 | 0.8 |
| SDSS-i-eon-0023 | 587724240153149551 | 0.03086 | 20.57 | 1.20 | 1.63 | 1.00 | 19.38 | 0.24 | 6.56 | 16.62 | 14.90 | 14.70 | 1.70e-01 | 1.51 | bx- | Sbc | 10704 | 1.1 |
| SDSS-i-eon-0027 | 587724241232461942 | 0.065683 | 21.37 | 0.99 | 1.27 | 1.00 | 19.78 | 0.14 | 6.62 | 18.18 | 15.88 | 15.76 | 1.08e-01 | 1.39 | bx- | Sbc | - | - |
| SDSS-i-eon-0033 | 587725041700700283 | 0.077376 | 21.80 | 0.87 | 2.60 | 0.75 | 20.09 | 0.15 | 7.32 | 17.10 | 15.84 | 15.54 | 2.40e-01 | 0.92 | bx+ | Sb | 91140 | 1.7 |
| SDSS-i-eon-0035 | 587725469056762056 | 0.039954 | 21.53 | 0.70 | 4.43 | 0.75 | 20.03 | 0.11 | 15.57 | 15.90 | 14.56 | 14.28 | 2.26e-01 | 1.80 | bx | Sb | 23609 | 1.9 |
| SDSS-i-eon-0037 | 587725469599531113 | 0.042004 | 21.58 | 0.92 | 2.23 | 1.00 | 19.88 | 0.12 | 8.80 | 17.26 | 15.58 | 15.37 | 1.75e-01 | 3.11 | bx | Sbc | 2544317 | 1.7 |
| SDSS-i-eon-0043 | 587725505558806667 | 0.028384 | 21.52 | 0.73 | 4.74 | 0.75 | 19.82 | 0.11 | 11.87 | 15.70 | 14.93 | 14.50 | 3.29e-01 | 3.91 | bx- | Sab | 91593 | 3.0 |
| SDSS-i-eon-0045 | 587725551192113224 | 0.011182 | 18.72 | 0.60 | 3.47 | 0.75 | 19.36 | 0.20 | 23.22 | 13.74 | 12.34 | 12.07 | 2.16e-01 | 6.09 | bx | Sb | - | - |
| number | objid | redshift | Sérsic | morph. | H.type | PGC | dist. | |||||||||||
|---|---|---|---|---|---|---|---|---|---|---|---|---|---|---|---|---|---|---|
| (1) | (2) | (3) | (4) | (5) | (6) | (7) | (8) | (9) | (10) | (11) | (12) | (13) | (14) | (15) | (16) | (17) | (18) | (19) |
| SDSS-i-fon-0001 | 587722982280724639 | 0.077798 | 19.86 | 0.81 | 1.30 | 1.00 | 20.80 | 0.69 | 5.18 | 16.83 | 15.76 | 15.42 | 2.72e-01 | 1.78 | br-rg | Sb | 1135280 | 0.9 |
| SDSS-i-fon-0002 | 587722982285312179 | 0.093877 | 20.57 | 0.83 | 1.02 | 1.00 | 20.83 | 0.74 | 4.89 | 18.03 | 15.86 | 15.72 | 1.19e-01 | 3.34 | brrg | Sbc | 1137394 | 2.6 |
| SDSS-i-fon-0006 | 587722983363248237 | 0.029861 | 20.96 | 0.55 | 3.54 | 0.75 | 20.99 | 0.94 | 8.67 | 16.04 | 14.63 | 14.37 | 2.14e-01 | 5.75 | brmg | Sb | 49446 | 1.7 |
| SDSS-i-fon-0007 | 587722983892648021 | 0.084617 | 21.19 | 0.47 | 3.10 | 0.75 | 21.03 | 0.82 | 5.05 | 16.73 | 15.92 | 15.50 | 3.21e-01 | 1.49 | br | Sab | 1169724 | 0.1 |
| SDSS-i-fon-0008 | 587722983895990379 | 0.024142 | 21.83 | 0.89 | 1.29 | 1.00 | 20.55 | 0.84 | 6.79 | 18.71 | 14.74 | 14.71 | 2.51e-02 | 7.78 | br- | Sd | 46266 | 0.3 |
| SDSS-i-fon-0009 | 587722983905100085 | 0.037183 | 21.17 | 0.89 | 1.13 | 1.00 | 20.27 | 0.90 | 6.00 | 18.34 | 14.61 | 14.57 | 3.12e-02 | 2.59 | br- | Sd | 52431 | 0.4 |
| SDSS-i-fon-0010 | 587722984432402632 | 0.048132 | 22.10 | 0.42 | 3.05 | 0.75 | 19.55 | 0.85 | 3.48 | 17.81 | 15.08 | 14.99 | 7.47e-02 | 1.39 | br-rg | Sc | 3082174 | 0.7 |
| SDSS-i-fon-0011 | 587722984436990089 | 0.07035 | 20.61 | 0.86 | 0.88 | 1.00 | 20.38 | 0.81 | 3.82 | 18.34 | 15.76 | 15.66 | 8.47e-02 | 1.21 | brrg | Sc | 1178163 | 0.5 |
| SDSS-i-fon-0013 | 587724198811271209 | 0.139565 | 20.91 | 0.67 | 1.51 | 1.00 | 21.80 | 0.77 | 9.23 | 17.76 | 16.02 | 15.82 | 1.67e-01 | 2.33 | br- | Sbc | - | - |
| SDSS-i-fon-0014 | 587724198822215805 | 0.148972 | 21.41 | 0.82 | 1.09 | 1.00 | 21.71 | 0.86 | 4.47 | 18.73 | 16.92 | 16.73 | 1.58e-01 | 0.92 | br- | Sbc | - | - |