CO gas inside the protoplanetary disk cavity in HD 142527: disk structure from ALMA
Abstract
Inner cavities and annular gaps in circumstellar disks are possible signposts of giant planet formation. The young star HD 142527 (catalog ) hosts a massive protoplanetary disk with a large cavity that extends up to 140 au from the central star, as seen in continuum images at infrared and millimeter wavelengths. Estimates of the survival of gas inside disk cavities are needed to discriminate between clearing scenarios. We present a spatially and spectrally resolved carbon monoxide isotopologue observations of the gas-rich disk HD 142527 (catalog ), in the line of , and , obtained with the Atacama Large Millimeter/submillimeter Array (ALMA). We detect emission coming from inside the dust-depleted cavity in all three isotopologues. Based on our analysis of the gas in the dust cavity, the emission is optically thick, while and emission are both optically thin. The total mass of residual gas inside the cavity is 1.5-2 MJup. We model the gas with an axisymmetric disk model. Our best fit model shows that the cavity radius is much smaller in CO than it is in millimeter continuum and scattered light observations, with a gas cavity that does not extend beyond 105 au (at 3-). The gap wall at its outer edge is diffuse and smooth in the gas distribution, while in dust continuum it is manifestly sharper. The inclination angle, as estimated from the high velocity channel maps, is 280.5 degrees, higher than in previous estimates, assuming a fix central star mass of 2.2 M⊙.
Subject headings:
protoplanetary disks: general stars: individual(HD 142527)1. Introduction
Planets are thought to form within circumstellar material, in so-called protoplanetary disks (e.g. Armitage, 2010). As these planets grow massive, they imprint a series of morphological and dynamical features onto their parent disk. During their formation epoch, one or multiple massive planets could open a gap in a gas-rich protoplanetary disk (Varnière et al., 2006; Zhu et al., 2011). The surface density profile of the gap is determined by the balance between gravity, viscous and pressure torques (Crida et al., 2006). Evidence of these gaps has been observed at various wavelengths in nearby young stars (e.g., Andrews et al., 2011).
The star HD 142527, with spectral type F6IIIe, hosts a protoplanetary disk with a large infrared excess (Malfait et al., 1999; Fukagawa et al., 2006). It is a young gas-rich system, with an estimated age of 2 Myr (Fukagawa et al., 2006). HD 142527 is most likely embedded inside the Lu22 condensation of the Lupus dark cloud, at a distance of 140 pc away, which has a reported (Vilas-Boas et al., 2000). Its disk is almost face-on with an inclination of 20∘, from previous infrared data. The disk exhibits a remarkably large dust-depleted cavity extending out to a radius of 140 au, as seen in IR imaging (Fukagawa et al., 2006), sub-millimeter continuum and CO line emission (Ohashi, 2008; Casassus et al., 2013). The outer disk has a complex non-axisymmetric surface density showing several spiral arms and clumps (Rameau et al., 2012; Avenhaus et al., 2014), signs of dynamical perturbation possibly caused by planetary-mass bodies inside the cavity or gravitational instability (Christiaens et al., 2014).
Recent ALMA observations of HD 142527 have evidenced what could be key stages of the planet formation process: the discovery of gaseous flows inside the dust-depleted cavity, as seen in HCO+ emission by Casassus et al. (2013). Resolved CO observations show a peak in emission in the cavity, in agreement with on-going dynamical clearing by planetary-mass bodies (Bruderer, 2013). Also using ALMA, Fukagawa et al. (2013) found that the isotopologues, 13CO and C18O, are optically thick in the outer disk.
Detection of gas inside a protoplanetary gap provides quantitative information on the total gas mass content and temperature profile, depending on whether the line emission is optically thin or optically thick (Wilson et al., 2009). Direct images and estimates of the survival of the gas inside transition disk cavities are needed to discriminate between scenarios of dust removal, such as grain growth, photo-evaporation and planet-disk interactions. For instance, grain growth is not expected to markedly affect the gas density profile, while photoevaporation removes both dust and gas (Bruderer, 2013). One way of discriminating between a planet-induced gap and a photoevaporation-induced gap can be based on the sharpness of the transition in surface density at the outer edge of the cavity: dynamical clearing would result in a rather sharp transition if the putative planet is massive (Pascucci et al., 2011). Millimeter observations of the rotational gas lines are ideal to quantify the amount of gas inside a dust-depleted cavity. Moreover, by comparing isotopologue emission from specific regions of the disk in protoplanetary systems we can constrain physical properties of the disk, such as its gas density and gas temperature.
Resolved observations of optically-thin emission can directly trace the underlying mass density distribution in the disk cavity. The amount of gas inside a protoplanetary cavity can provide constrains on planet formation and migration scenarios. For example, a planet that is not massive enough to cleanly evacuate the material inside the gap will only decrease the disk surface density. Also, such planet is expected to co-orbit with a corotation zone, which should carry significant amounts of gas (Armitage, 2011). Thus, studying the gas surface density structure of transition disks is of direct importance to distinguish between different clearing and formation scenarios.
In this paper, we analyse ALMA Band-6 (230 GHz) CO line emission and dust continuum observations of HD 142527. The data provide resolved observations of gas inside a dust depleted protoplanetary disk cavity. Our analysis aims to measure the amount of gas in this cavity and provide a more complete picture of the structure of the HD 142527 disk. The interferometric ALMA data reduction and calibration steps are described in Section 2. A detailed description of the CO emission maps, the morphology and kinematics of the observed gas, along with diagnostics of the physical conditions inside the cavity are provided in Section 3. We develop a disk structure model consistent with HD 142527 observations to study the properties of the disk. This model and the radiative transfer calculations are presented in Section 4.1. Data and modelling are combined and interpreted in the context of gas depletion mechanisms in Section 5. Section 6 summarizes the main results of this investigation. A brief description of HD 142527’s spectral energy distribution, as computed for the model presented in Section 4.1, is presented in Appendix A.
2. ALMA data and processsing
The HD 142527 band 6 observations were acquired on 2012 April 12, and June 15, using sixteen and twenty 12m antennas respectively. In both observing sessions the precipitable water vapor in the atmosphere was stable between 1.5 and 2.0 mm with clear sky conditions, resulting in median system temperatures ranging from 70 to 90 K. The ALMA correlator was configured in the Frequency Division Mode (FDM) to provide 125 MHz bandwidth in four different spectral windows at 0.2 km s-1 resolution per channel. Three spectral windows were positioned in order to target the 12CO , 13CO and C18O isotopologues at 230.538, 220.399 and 219.560 GHz, respectively. In both sessions Titan was observed as flux calibrator, while the quasars 3C279 and J1604-446 were observed for bandpass and phase calibration respectively. Observations of the phase calibrator were alternated with the science target every 8 minutes to calibrate the time dependence variations of the complex gains. The total time spent on-source was 82 minutes. However, the concatenated dataset shows spurious spectral line features. Therefore, in this work we only used the June observations which have higher signal-to-noise and better -coverage than the April data.
All the line data were calibrated using the Common Astronomy Software Applications package (CASA111http://casa.nrao.edu/; McMullin et al., 2007) in a standard fashion, which included offline Water Vapor Radiometer (WVR) calibration, system temperature correction, as well as bandpass, phase and amplitude calibrations. The fluxes derived for 3C279 in April and June were 15.9 and 17.5 Jy respectively. For J1604-446, the flux values after bootstrapping to the observations of Titan were 0.56 and 0.6 Jy in April and June. By considering the scatter in the fluxes derived for the bandpass and phase calibrators in the different observing sessions, we estimate the absolute flux calibration to be accurate within 10 .
Imaging of the CO lines was performed using the CLEAN task in CASA (Högbom, 1974). The dataset provides baselines up to 402 meters, which resulted in a synthetic beam size of 0.850.64 at PA degrees. Continuum subtraction in the visibility domain was performed prior to imaging of the CO lines. After CLEANing the images, an RMS noise level of 11 mJy per 0.2 km s-1 channel was reached. In this paper, we also make use of the 345 GHz continuum data described in Casassus et al. (2013).
The central cavity is resolved in the isotopologues data, with approximately four beams covering the gap. An astrometric correction was applied to the data set in order to account for the star’s proper motion of mas yr-1, as measured by Hipparcos (van Leeuwen, 2007). This implied a shift in the images of 0.3 arc-seconds since epoch J2000.
3. Results
| Line | Beam | Noise | Peak | Fluxa | |
|---|---|---|---|---|---|
| =2–1 | GHz | ” | Jy beam-1 | Jy beam-1 | Jy |
| 12CO | 230.538 | 0.850.64 | 0.012 | 0.74 | 17.4 |
| 13CO | 220.399 | 0.850.64 | 0.013 | 0.70 | 11.4 |
| C18O | 219.560 | 0.850.64 | 0.013 | 0.39 | 3.4 |
| Continuum | |||||
| Cont. | 225.393 | 0.940.72 | 0.0003 | 0.27 | 1.09 |
Note. — Line emission and continuum maps properties. Maps were cleaned with CASA and binned to km s-1 spectral resolution. a Total flux integrated over the whole data cube (10”x10” aperture).
3.1. Morphology and Kinematics of the Gas Disk
Molecular gas observations, such as millimeter/submillimeter pure rotational lines of CO, can provide constrains on the amount of gas mass inside transition dust-depleted disk cavities. The dust-depleted cavity in HD 142527 has an apparent size of 2” across (Casassus et al., 2012). Our ALMA Cycle 0 observations have enough sensitivity and resolution to detect and resolve such left-over gas in HD 142527 cavity.
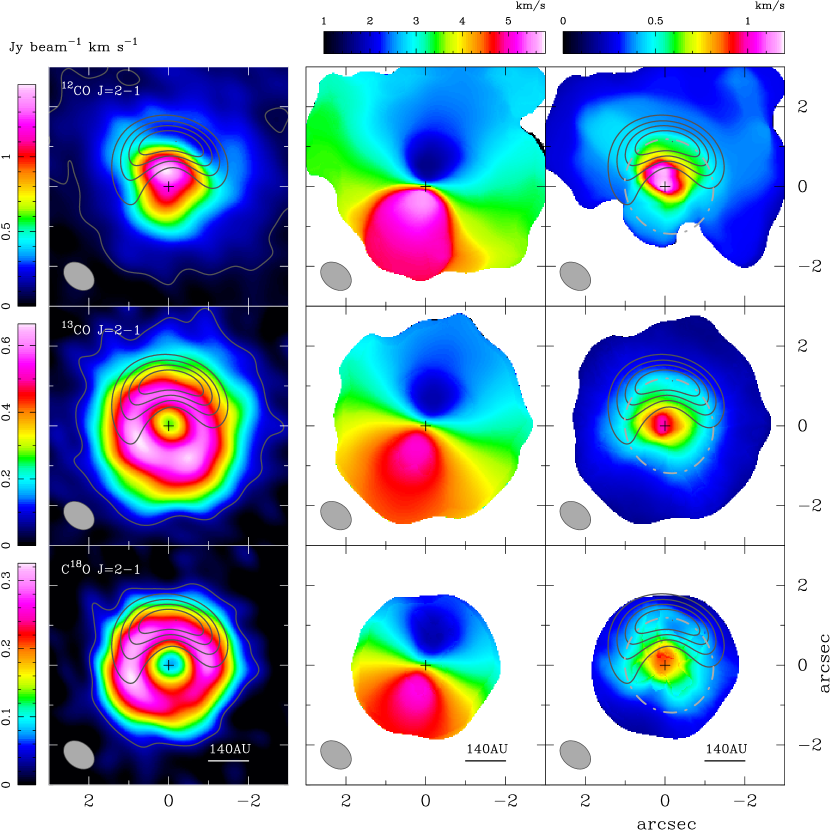
3.1.1 Moment maps
Fig. 1 shows the integrated intensity, velocity centroid, and velocity dispersion for the three isotopologues. All the moment maps velocity information displayed in Fig. 1 were derived by fitting a gaussian profile to the spectral axis in each spatial pixel of the CLEANed data cubes. The maps were then median-filtered with a kernel box of 0.10.1”. We detect extended emission, 5- above the noise level, as far as 5” away from the center, which corresponds to 700 au (see Christiaens et al., 2014, for a discussion of the extended features seen in ).
The integrated emission (Fig. 1, or zeroth-order moment map (Fig. 1, upper left) is smooth, with no counterpart of the cavity seen in the CO isotopologues. In fact, peaks inside the dust-depleted cavity, at a location close to the star but intriguingly shifted to the north by 0.4” (about half a beam). The stellar position, as tabulated in the SIMBAD database, is consistent with the disk’s expected center as given by the center of symmetry in the velocity field (represented with a black cross in Fig. 1). The lack of a decrement in outlining the cavity, as seen in its rarer isotopologues, suggests that the line is most likely optically thick (See Section 3.3).
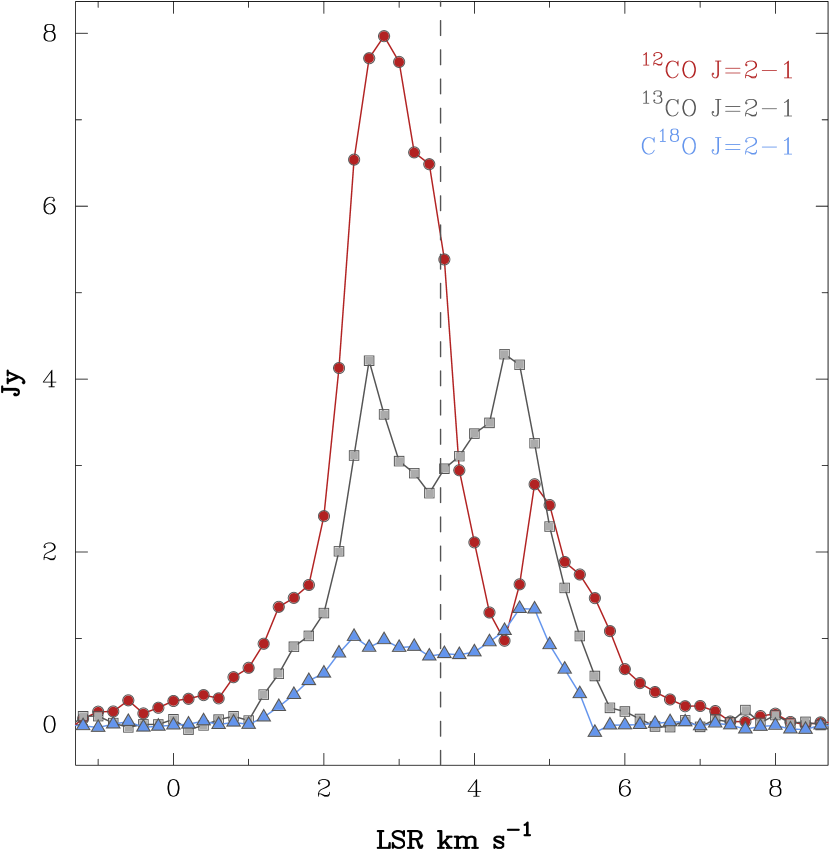
The asymmetric morphology of the emission and its off-centered peak are due to absorption by an intervening cloud, at 4.4 (Casassus et al., 2013b), thus affecting the red part of the line. The foreground cloud can be seen as an absorption feature in the spectrum shown in Fig. 2. We measure the systemic velocity at from the integrated CO spectra, by assuming that the line wings are symmetric (see Fig. 2). The error is given by half the size of a spectral bin.
The HD 142527 dust continuum at 230 GHz, shown as contours in Fig. 1, has a horseshoe-shaped morphology, as previously reported in Casassus et al. (2013) at 345 GHz. The contours delineate the dust-depleted cavity, with a radius of 1” and a contrast of 25 between the north-eastern maximum and the south-western minimum, slightly shallower than the contrast of 30 reported at 345 GHz (Casassus et al., 2013; Fukagawa et al., 2013). The integrated intensity map (Fig. 1) shows a disk cavity and a bright outer disk. The outer disk is at least a factor of 2 brighter than the inner cavity in . This is a lower limit since the gap edge is naturally convoluted with the CLEAN beam, smoothing out the sharpness of the gap wall.
The velocity dispersion map of shows an increment in the width of the emission line profile under the horseshoe-shaped continuum (see dashed ellipse in Fig. 1 upper right). This wider emission line can also be seen in the dispersion map (middle right panel), which is less affected by foreground absorption.
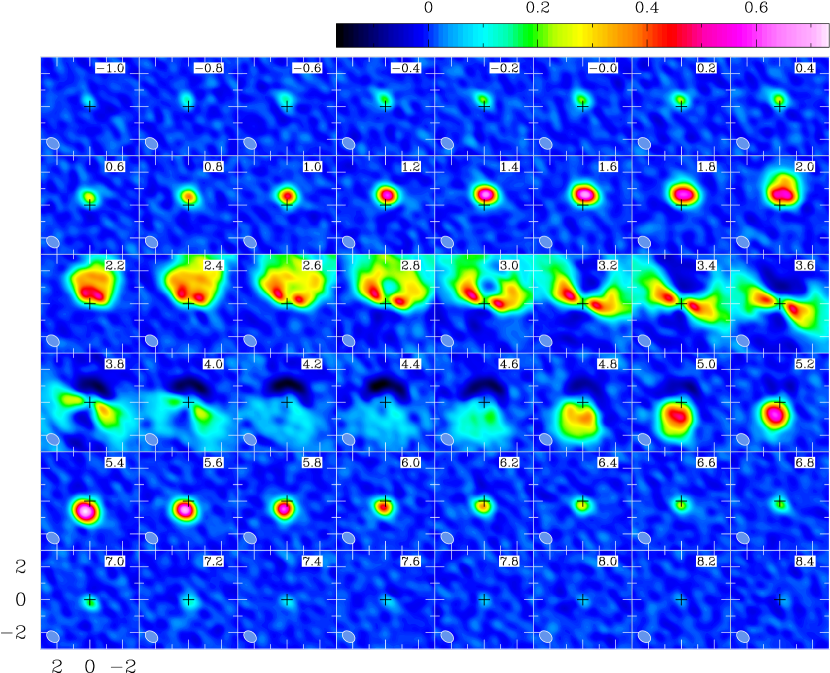
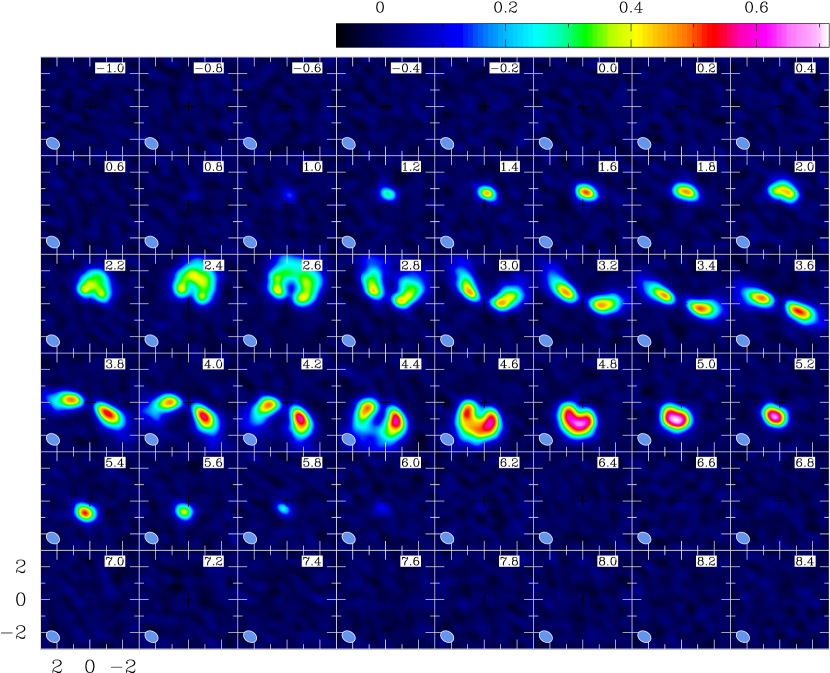
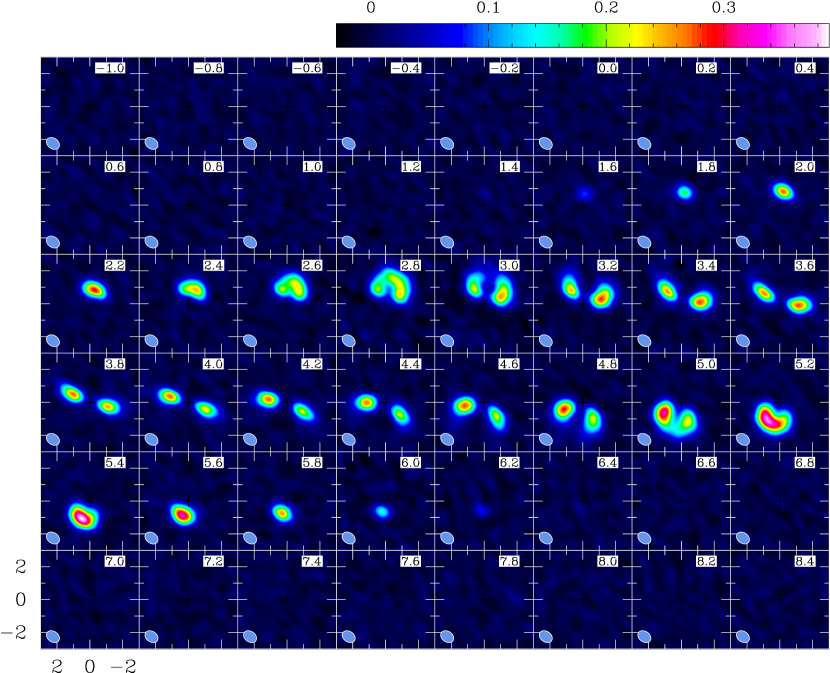
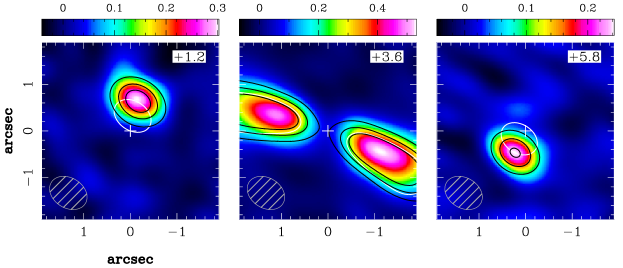
3.1.2 Channel maps
Figures 3, 4 and 5, show channel maps for , and emission from HD 142527. The Keplerian disk can be identified in the channel maps as butterfly-shaped emission. Properties of the maps, rms noise estimates, peak and integrated line intensities for each isotopologue, are listed on Table 1. Data were binned to 0.2 per channel in LSR velocity. Maps were reconstructed with CLEAN using Briggs weighting. The CO lines were detected at 3 level over a broad velocity range. was detected from -0.8 to +7.8 in LSR. was detected between +1.0 and +6.2 , while between +1.0 and +5.4 .
An emission line originating from a disk in Keplerian rotation is expected to show a dipole field pattern on the surface of the disk, when binned in velocity (Horne & Marsh, 1986). The low velocity channels, close to systemic velocity 3.6 , have a Keplerian rotation profile, along a NE to SW position angle. Gas emission coming from inside the 140 au dust-depleted cavity can be identified in the high velocity channel maps. Assuming a Keplerian velocity profile and the system parameters listed in Table 2, the observed emission from channels at velocities km s-1 and km s-1, is radiated by gas material contained in a radius of 140 au (”), thus coming entirely from inside the dust-depleted cavity.
We note that gas emission coming from very near the central star shows signatures of non-Keplerian kinematics. This is evidenced by a change in position angle of the emission in the high velocity channels. For instance, the +0.0 channel map has a PA that is shifted towards the NE, when comparing to the systemic velocity PA (near channel +3.6 ). Moreover, the red counterpart of that high velocity channel, the +7.2 channel, has a PA shifted in the opposite direction, toward SW. If the gas inside the cavity is indeed being accreted onto the star, the infalling material would have a radial velocity component that may explain the non-Keplerian emission at high velocity channels (Rosenfeld et al., 2014).
Another evident feature of the gaseous disk in HD 142527 can be seen in the and channel maps. There is a decrement, meaning lower emission at a certain blue velocity channel when compared to its red counterpart, towards the NE of the disk. Compare, for example, channel +2.4 with +4.8 in both isotopologues, where the red channel is a factor of nearly 2 brighter than the blue (also seen as a slight asymmetry in the integrated line profiles in Fig 2). This decrement is, to a moderate extent, coincident with the horseshoe-shaped continuum. Furthermore, van der Plas et al. (2014) presented HD 142527 imaging of the HCN and CS emission lines and showed that these lines are also suppressed under the horseshoe-shaped continuum emission peak.
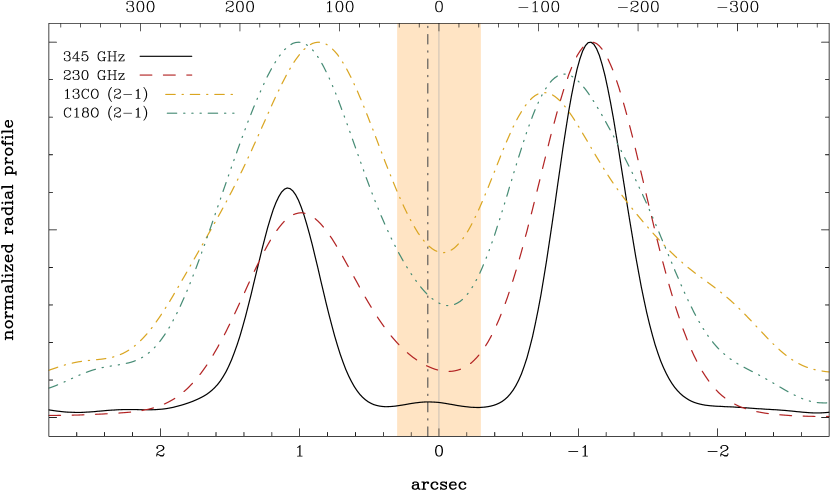
3.2. A cut through the inner and outer disks
Figure 6 shows a cut through the disk (near the major axis, at 2h) in integrated intensity. The profiles correspond to dust continuum at 345 and 230 GHz (black solid and dashed red lines, respectively), and, and isotopologues emission. All the profiles are double-peaked, with the peaks asymmetrical with respect to the center of the disk. The center of the disk is assumed to be the mid point in between the two 345 GHz peaks. The dust emission is 40% weaker in the SE (left peak) than the NW (right peak), in opposition to the line emission which appears 10-15% stronger in the SE. The profile peaks inside the cavity, but it is heavily affected by foreground absorption, hence it is not included in Figure 6.
The 345 GHz (870 m) continuum cut shows an unresolved compact emission near the center of the cavity. The centroid of this emission is shifted from the apparent center of the outer disk as given by the mid point between the bright outer disk peaks (see vertical dot-dash line in Fig. 6). The mid point between the peaks also coincides with the center of rotation of the CO gas. The shift is 0.1” to the East and corresponds to a deprojected distance of 16 au at 140 pc.
We roughly quantify the position and roundness of the disk wall in the continuum and in line emission by fitting a simple gaussian function to each profile. The full-width at half-maximum (FWHM) of the 230 GHz continuum peaks are both about 0.9”, so just resolved by our beam (the cut through the disk is along the beam’s semi-minor axis), with peak centroids at -1.07” and 1”. The 345 GHz continuum (band 7) peak widths are 0.57” and 0.53”, for the West and East peaks, respectively.
The double-peaked morphology in and in Fig. 6 reveals a smaller and shallower gaseous cavity than the dust-depleted cavity traced by the continuum. Interestingly, the line emission presents a more complex profile than the continuum which we accounted for by fitting a gaussian on top of a variable order polynomial function. The FWHM of the peaks in are 1.2” centered at -0.75” and 0.9” away from the disk origin, while is slightly narrower with FWHM of 1.1” centered at -0.9” and 1”, closer to the disk center. The CLEANed beam for the CO isotopologues (shaded region shown in Fig. 6) is only 0.6” across the cut axis, suggesting that the gap profile is indeed resolved by our gas observations. Therefore, the gas outer disk inner wall lies closer to the star, at 90 au. The CO flux density appears more tapered towards the centre than the millimeter dust. And, the outer disk inner wall is significantly broader in gas, 1.2” in , than in millimeter continuum, 0.9” at 230 GHz.
3.3. Optical Thickness of the Lines
We can estimate the optical depths () of each isotopologue from their observed isotopic line ratio (e.g., Lyo et al., 2011). For this, we assume CO gas is distributed as an isothermal slab that is larger than the telescope beam. In this case, the isotopic line ratio can be written as
| (1) |
where sub-indices ’1’ and ’2’ refer to two of the isotopologues, either and , or and , respectively. We also assume that the two selected lines share the same excitation temperature, and that this temperature is high enough to neglect the contribution from the microwave background radiation. In this work, we adopt the to ratio of as measured in the ISM by Stahl et al. (2008). The to ratio is assumed to be the canonical value of for the ISM (Wilson & Rood, 1994).
The emission from channels at high rotational velocities, specifically at velocities km s-1 and km s-1, correspond to gas emitted solely from inside the dust cavity. From these channels, we can estimate the line ratios for the residual gas. In this velocity range, the isotopic line ratio has a value of 2.00.2, which yields optical depths of and . Therefore, we conclude that inside the disk cavity is optically thick, while is mostly optically thin.
3.3.1 Temperature profile from 12CO
The observed 12CO line is optically thick, hence the observed intensity map of the line traces the gas surface temperature rather than the underlying density distribution. The temperature profile for seems to be nearly flat, , well inside the cavity (as measured from the emission in the high velocity channels), while it decreases with radius as over the disk inner wall and outer disk, as estimated from the channel map at systemic velocity. The peak flux density of 1 Jy implies a gas temperature of 43 K for the gas surface, measured at a radius of 80 au.
3.4. Gas Mass Inside the Gap from 13CO
The observed 13CO line is optically thin inside the disk cavity, hence it gives an estimate of the gas mass content. The integrated line intensity of emission, , where is the specific intensity measured at a channel with velocity , and it is directly proportional to the total column density of the gas. The channel width is . Assuming the CO gas is near LTE, the column density at the lower level of the molecule can be expressed by
| (2) |
where is the column density in level 1 expressed in m-2 units, is the line strength given by the Einstein coefficient for spontaneous emission. The units for are Hz. Assuming that all energy levels are populated under LTE, the total population is given by the measured column density for a particular state J (in our case ),
| (3) |
where is the Partition function. Here, is the rotation constant.
Assuming a fiducial CO interstellar abundance of and , the disk gas mass inside the dust cavity as estimated from is given by
| (4) |
where is the molecular mass of hydrogen, , is the solid angle subtended by the cavity in , and pc is the distance to HD 142527. For the CO isotopologues, GHz and for the line strength222The spectral information for the CO molecule was obtained from the Splatalogue database.. For the gas temperature we used K, as calculated from in the previous section.
We measured the integrated line intensity of by summing the peak emission from the selected high velocity channels (see Section 3.1.2), under the approximation that the subtended solid angle is the same for all channels, and that the source is unresolved at these velocities, yielding W m-2. This gives a total column density of m-2. This column corresponds to a total disk gas mass (H2 plus CO) of M⊙. Here, we have considered all the gas inside the dust-depleted cavity of 140 au. The quoted thermal errors are 5- (based on the noise levels in Table 1) and are subject to a further 10% flux calibration systematic uncertainty. The same procedure, if applied to the emission, yields a gas mass of M⊙.
Archival ALMA observations of also show strong emission at channels with velocities km s-1 and km s-1, corroborating our detection of CO gas inside the cavity (see Fukagawa et al., 2013, for a description of this dataset). These observations show that is mostly optically thick over the entire disk. The noise level on each of these channel map is 0.12 mJy beam-1 (Fukagawa et al., 2013). If we assume is optically thin at least inside the cavity, the integrated line intensity amounts to W m-2, which gives a total column of m-2 and a disk mass of M⊙, consistent with the estimate (5- error bars). For this calculation we used the same procedure explained above to estimate the integrated line intensity arising from the cavity gas but with the corresponding constants, GHz and , for the C18O molecule.
We conclude that there is still at least more than one Jupiter mass worth of gas inside the dust-depleted cavity. This gas is available to be accreted by possible forming planets and/or to be accreted onto the star. However, there are considerable uncertainties involved in this analysis, making this result only a crude estimate of the total gas mass. The main sources of uncertainty are the assumed isotopic line ratios and the gas temperature.
4. Physical Structure of the Disk
4.1. Parameterized Model
.
We adopted a simple, azimuthally symmetric parameterized structure for the disk gas density, where the vertical dimension is given by the hydrostatic equilibrium equation, such that,
| (5) |
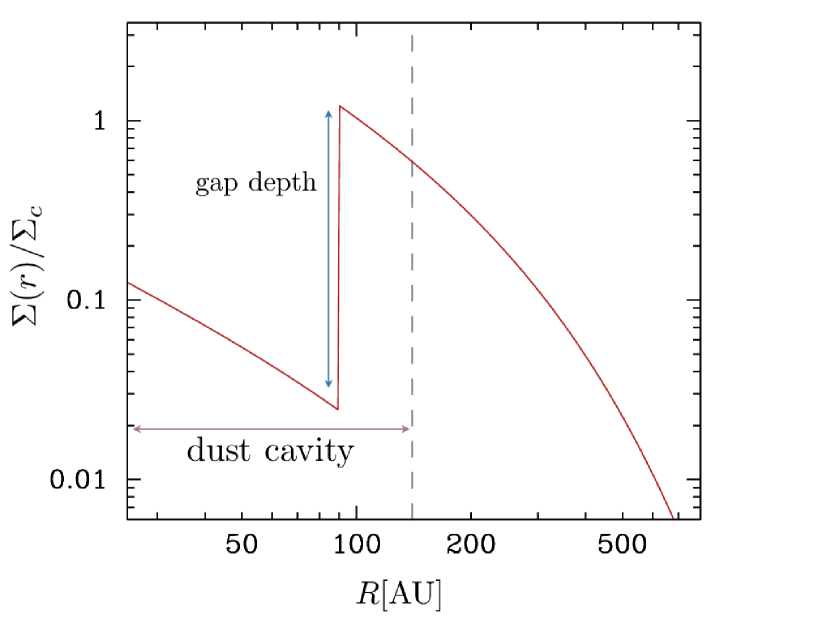
where is the disk scale-height. The inner wall of the outer disk needs to subtends a large solid angle in order to explain the SED, as informed by Verhoeff et al. (2011). Eq. 5 assumes the disk is isothermal in the vertical direction. The global surface density profile is a power law in radius with an exponential tapering at large radii, as described in Lynden-Bell & Pringle (1974) (see also Andrews et al., 2011). The parametric equation reads
| (6) |
where is a characteristic radius and is the surface density at that radius. The model disk structure is then separated into two distinct radial zones: a depleted inner cavity and an outer disk. The parameter is a scaling factor which accounts for the depletion inside the cavity (). is a free parameter inside the cavity, and attains unity in the outer disk. See Fig 7 for a schematic representation of the surface density model. The inner zone of the disk is truncated at 0.3 au, at which the temperature reaches K, sublimating dust particles.
The kinetic temperature of the gas is flat close to the star ( au), with a warm temperature of 50 K. Farther out, we modelled the temperature with a power law, such that:
| (7) |
where the power law slope and scaling factor were informed by the optically thick emission (See Section 3.3.1). The disk is assumed to be vertically isothermal.
For simplicity, we assumed that the gas in the disk follows circular Keplerian rotation, such that
| (8) |
where is the central mass star. Although hints of non-Keplerianity are seen in the channel maps, these have a minor effect in our analysis. The velocity dispersion of the random motions of the gas (Doppler b-parameter) was fixed to 50 m s-1.
The CO column density is given by:
| (9) |
where is the abundance of CO relative to H2. We have assumed the ISM value.
Equations 5–9 fully describe the structure of the disk. The disk is then characterized by six parameters, , , , , , and inclination . The minor axis position angle is 70 degrees as determined from the velocity maps. In order to compare with the Band 6 observations, the synthetic models of line emission were resampled and transformed to visibilities using the exact baseline information from the ALMA measurement set. We also calculate HD 142527’s spectral energy distribution (SED) for our disk structure model. The results show consistency between our model and HD 142527’s bulk properties (see Appendix A). It is important to note that these disk models have degeneracies. The models also assume an axisymmetric structure for the gas, but from HCO+ observations we know there is a filamentary structure inside the cavity.

4.2. Modeling Results
| Parameter | Units | Value | error |
|---|---|---|---|
| deg | 28 | 0.5† | |
| au | 90 | 5 | |
| 0.02 | |||
| M⊙ | |||
| 28.69 | – | ||
| M⊙ | 2.2 | – | |
| – | 0.1 | – | |
| – | 1 | – | |
| au | 200 | – | |
| 3.6 | 0.1 |
Note. — We report 1 error bars. Only parameters that have been optimized bear uncertainties. †Assuming a fixed star mass of 2.2 M⊙.
We predicted the line radiation from the set of model disks using the three-dimensional non-local thermodynamic equilibrium (non-LTE) molecular excitation and radiative transfer code LIME (Brinch & Hogerheijde, 2010). We generated channel maps matching the spectral resolution of the ALMA data cubes. Then, we extracted the -coverage information directly from the ALMA measurement sets to calculate model visibilities that match the exact Fourier sampling used in the observations. Our models were compared to the data in the visibility plane based on statistics. The models were post-processed and CLEANed using the same strategy used to generate our ALMA maps. Finally, the best fit models were contrasted with the data by visual inspection.
Figure 9 shows our best fit model for the structure of HD 142527 transition disk that accounts for the observed emission. is a tracer of the disk density distribution, it is optically thin inside the cavity and the maps have high signal-to-noise ratio. The best fit model also matches the maps. The integrated density distribution of our disk model yields a total (dust plus gas) mass of the disk of 0.1 M⊙, consistent with previous estimates based on millimeter continuum observations (Öberg et al., 2011).
The model parameters that match the observations are listed in Table 2. A tapered disk slope of accounts for the extended size of the source in . Inside the cavity, The parameter was set to , in order to reproduce our observed line fluxes. Higher values make the appear optically thick inside the cavity. We estimate an uncertainty of 0.01 based on the optical thickness of the lines. It is worth mentioning that the slope of the density profile inside the cavity does not have to be necessarily decreasing with radius (see, for example, Tatulli et al., 2011, for HD100546). A flat profile inside the cavity might also be valid, which would imply a shallower gap depth value. These posibilities will be further explored in a future paper.
Our method to estimate the inclination angle differs from previous approaches because it relies on the dynamics of the high velocity gas evidenced by the high velocity channels, whose spatial distribution strongly depends on inclination angle. Previous methods use scattered light and continuum images of the full disk. Continuum images trace the emitting material closer to the mid-plane hence giving an estimate of the inclination of the dust near the midplane. Our approach uses the dynamical model of the gas rotation, giving a good estimate of the gaseous disk’s inclination.
There is a degeneracy between inclination angle, , and the mass of the central star, , when trying to compute the kinematic signatures of the rotating gaseous disk. In order to break this degeneracy, we run a set of test models for a range of values of and . The goodness of each fit was evaluated by calculating the reduced , which is defined as , where is the number of the degrees of freedom. For these observations, the number of degrees of freedom is 107, which corresponds to the number of visibilities in each dataset. The minimum (best fit) is attained at M⊙ and it is equal to 1.001662. On the other hand, the values of (defined as ) for equal to 2 and to 2.6 M⊙ are 210-6 and 510-6, respectively. Similar values were found for inclination angles ranging from 20 to 30 degrees. According to our fit in the visibility plane, the model with a central star mass M⊙ best reproduces our data. After fixing the mass to this value, we estimate the disk’s inclination angle.
Previous models for the disk in HD 142527 assumed a cavity size of 140 au for both gas and dust and a disk inclination of 20 degrees (Verhoeff et al., 2011; Casassus et al., 2013). Although the overall multi-wavelength data are consistent with these parameters, they are unable to explain the observed spatio-kinematic morphologies of the CO emission lines. In order to reproduce the high velocity channel maps (wings of the lines), a significant increase in the projected velocity closer to the central star is needed. With a large disk inclination, degrees, we obtain a good match with the ALMA data, reproducing the morphologies both at systemic velocity and in the high velocity wings. The excellent signal-to-noise in the high velocity channel maps allows us to determine the inclination of the disk with an accuracy of half a degree. Figure 8 shows a plot for a distribution of inclination angles, calculated in the -plane.
After fixing the inclination angle at 28 deg, we varied the cavity radius in order to find a good match. The best fit for the cavity radius in the gas is 90 au. The error was obtained from visual inspection of the plotted models against the data. It is important to note that the inclination angle best characterises the emission coming from inside the cavity. Our estimate of the inclination angle is consistent with the values determined by Fukagawa et al. (2013) from CO observations.
5. Discussion
We have conducted a detailed analysis of the , , and line emission from HD 142527, focusing on the gas inside the dust-depleted cavity.
There are three main scenarios for clearing central cavities in disks; photoevaporation by high-energy photons, lowering of dust opacity due to grain-growth and dynamical clearing by a companion object. Casassus et al. (2013) argued against photoevaporation in this source, based mainly on the high accretion rate and large size of the cavity. Our detection of large amounts of CO gas inside the cavity furthers the argument against photoevaporation as the main clearing mechanism. Moreover, there is evidence of the presence of a small inner disk inside the cavity (van Boekel et al., 2004; Verhoeff et al., 2011), that would hinder the efficiency of photoevaporating winds.
Dust continuum emission at 345 GHz has been detected with ALMA inside the cavity, but at very low levels and at the limit of the dynamic range. The exact morphology of this faint signal is sensitive on the details of image synthesis and self-calibration process. While Casassus et al. (2013) find a filamentary morphology, matched to the gap-crossing filaments seen in HCO+(4-3), Fukagawa et al. (2013) proposes a compact signal stemming from the inner disk only. Whichever the case, the peak signal at 345 GHz is an upper limit to the emission from mm-sized particles inside the cavity. The contrast between the bottom of the gap and the outer disk in surface density of mm-emitting grains is (gap depth of about 0.003%).
Smaller dust particles, m dust emitting in the near and mid-IR, have eluded detection inside the 90 au gas cavity radius (Fukagawa et al., 2006; Casassus et al., 2012; Canovas et al., 2013), although the IR rings are contained in the sub-millimeter ring (see Supplementary information in Casassus et al., 2013). This may imply that all the dust follows a general drop in density inside the 90 au cavity. The polarimetric data provides upper limits on the surface brightness of the polarized intensity emitted from inside the cavity (Canovas et al., 2013).
The current paradigm in giant planet formation holds that planets are manifested indirectly by their imprinted marks on their progenitor disk. Wide gaps will be carved by massive or multiple forming planets (Dodson-Robinson & Salyk, 2011; Zhu et al., 2011). The shape of the outer disk inner wall will depend on the planet mass, disk thickness and viscosity of the disk, and on the temperature structure in the disk wall itself (Crida et al., 2006). The torque of the outermost planet will affect strongly the shape of the inner wall. The tidal radius of a planet, the so-called Hill radius, is defined by
| (10) |
where is the radius of the planet’s orbit, is the mass of the planet, and is the mass of the central star. More massive companions have a large sphere of influence, suggesting that they could carve larger gaps with attenuated or tapered-off walls.
The cavity in HD 142527 has a smaller radius in gas than in dust milimeter continuum. In HCO+(4-3) emission the cavity is even smaller, suggesting that the disk wall is not sharp or vertical but rather tapered off by a large gradient (see Fig. 6). Multiple planets located closer to the star can explain the large size of the cavity (Dodson-Robinson & Salyk, 2011; Zhu et al., 2011). A precise analysis of the gas and dust wall in HD 142527 from ALMA band 6 and band 7 data, based on hydrodynamical models, will be presented in a future publication.
6. Summary
We detected and identified emission from inside the dust-depleted cavity in carbon monoxide isotopologue data of the gas-rich transition disk HD 142527 (catalog ), in the line of , and . The 12CO emission from the inner cavity is optically thick, while and appear to be optically thin, providing probes of the temperature and density fields inside the cavity. The main results of our analysis can be summarized as follows.
-
1.
We determined the gas mass inside the gap from the 13CO and C18O emission. We used two methods: direct measurement of the optically thin lines, and forward modelling using an axysymmetric disk. The total mass of gas surviving inside the cavity is high M⊙.
-
2.
We find that the inner cavity is rather small in CO gas, compared to its size in dust millimeter and infrared scattered light, with a best-fit radius of 90 au.
-
3.
The drop in density inside the cavity can be modeled as a reduction in gas column density of a factor 50 (cavity depth of 0.02), given our model for the outer disk, which gives a total mass of 0.1 M⊙.
-
4.
The gap wall appears diffuse and tapered-off in the gas distribution, while in dust continuum is manifestly sharper.
-
5.
The disk inclination is well constrained by the resolved velocity information of the CO gas and it attains 280.5 degrees, after fixing the central star mass to 2.2 M⊙.
-
6.
The center of the disk appears shifted from a central continuum emission by a deprojected distance of 16 au toward the East, assuming a distance of 140 pc to HD 142517.
References
- Andrews et al. (2009) Andrews, S. M., Wilner, D. J., Hughes, A. M., Qi, C., & Dullemond, C. P. 2009, ApJ, 700, 1502
- Andrews et al. (2011) Andrews, S. M., Wilner, D. J., Espaillat, C., et al. 2011, ApJ, 732, 42
- Armitage (2010) Armitage, P. J. 2010, Astrophysics of Planet Formation, by Philip J. Armitage, pp. 294. ISBN 978-0-521-88745-8 (hardback). Cambridge, UK: Cambridge University Press, 2010., Astrophysics of Planet Formation
- Armitage (2011) Armitage, P. J. 2011, ARA&A, 49, 195
- Ataiee et al. (2013) Ataiee, S., Pinilla, P., Zsom, A., et al. 2013, A&A, 553, L3
- Avenhaus et al. (2014) Avenhaus, H., Quanz, S. P., Schmid, H. M., et al. 2014, ApJ, 781, 87
- Brinch & Hogerheijde (2010) Brinch, C., & Hogerheijde, M. R. 2010, A&A, 523, A25
- Bruderer (2013) Bruderer, S. 2013, A&A, 559, A46
- Canovas et al. (2013) Canovas, H., Ménard, F., Hales, A., et al. 2013, A&A, 556, A123
- Casassus et al. (2005) Casassus, S., Stahl, O., & Wilson, T. L. 2005, A&A, 441, 181
- Casassus et al. (2012) Casassus, S., Perez M., S., Jordán, A., et al. 2012, ApJ, 754, L31
- Casassus et al. (2013) Casassus, S., van der Plas, G., M, S. P., et al. 2013, Nature, 493, 191
- Casassus et al. (2013b) Casassus, S., Hales, A., de Gregorio, I., et al. 2013, A&A, 553, A64
- Cardelli et al. (1989) Cardelli, J. A., Clayton, G. C., & Mathis, J. S. 1989, ApJ, 345, 245
- Christiaens et al. (2014) Christiaens, V., Casassus, S., Perez, S., van der Plas, G., & Ménard, F. 2014, ApJ, 785, L12
- Crida et al. (2006) Crida, A., Morbidelli, A., & Masset, F. 2006, Icarus, 181, 587
- Dodson-Robinson & Salyk (2011) Dodson-Robinson, S. E., & Salyk, C. 2011, ApJ, 738, 131
- Fukagawa et al. (2006) Fukagawa, M., Tamura, M., Itoh, Y., et al. 2006, ApJ, 636, L153
- Fukagawa et al. (2013) Fukagawa, M., Tsukagoshi, T., Momose, M., et al. 2013, PASJ, 65, L14
- Högbom (1974) Högbom, J. A. 1974, A&AS, 15, 417
- Horne & Marsh (1986) Horne, K., & Marsh, T. R. 1986, MNRAS, 218, 761
- Lynden-Bell & Pringle (1974) Lynden-Bell, D., & Pringle, J. E. 1974, MNRAS, 168, 603
- Lyo et al. (2011) Lyo, A.-R., Ohashi, N., Qi, C., Wilner, D. J., & Su, Y.-N. 2011, AJ, 142, 151
- Malfait et al. (1999) Malfait, K., Waelkens, C., Bouwman, J., de Koter, A., & Waters, L. B. F. M. 1999, A&A, 345, 181
- Meeus et al. (2012) Meeus, G., Montesinos, B., Mendigutía, I., et al. 2012, A&A, 544, A78
- McMullin et al. (2007) McMullin, J. P., Waters, B., Schiebel, D., Young, W., & Golap, K. 2007, Astronomical Data Analysis Software and Systems XVI, 376, 127
- Öberg et al. (2011) Öberg, K. I., Qi, C., Fogel, J. K. J., et al. 2011, ApJ, 734, 98
- Ohashi (2008) Ohashi, N. 2008, Ap&SS, 313, 101
- Pascucci et al. (2011) Pascucci, I., Sterzik, M., Alexander, R. D., et al. 2011, ApJ, 736, 13
- Pinte et al. (2006) Pinte, C., Ménard, F., Duchêne, G., & Bastien, P. 2006, A&A, 459, 797
- Pinilla et al. (2012) Pinilla, P., Birnstiel, T., Ricci, L., et al. 2012, A&A, 538, A114
- Quanz et al. (2013) Quanz, S. P., Avenhaus, H., Buenzli, E., et al. 2013, ApJ, 766, L2
- Rameau et al. (2012) Rameau, J., Chauvin, G., Lagrange, A.-M., et al. 2012, A&A, 546, A24
- Rosenfeld et al. (2012) Rosenfeld, K. A., Qi, C., Andrews, S. M., et al. 2012, ApJ, 757, 129
- Rosenfeld et al. (2014) Rosenfeld, K. A., Chiang, E., & Andrews, S. M. 2014, ApJ, 782, 62
- Smith et al. (2009) Smith, R. L., Pontoppidan, K. M., Young, E. D., Morris, M. R., & van Dishoeck, E. F. 2009, ApJ, 701, 163
- Stahl et al. (2008) Stahl, O., Casassus, S., & Wilson, T. 2008, A&A, 477, 865
- Tatulli et al. (2011) Tatulli, E., Benisty, M., Ménard, F., et al. 2011, A&A, 531, A1
- van Boekel et al. (2004) van Boekel, R., Min, M., Leinert, C., et al. 2004, Nature, 432, 479
- van Leeuwen (2007) van Leeuwen, F. 2007, A&A, 474, 653
- van der Marel et al. (2013) van der Marel, N., van Dishoeck, E. F., Bruderer, S., et al. 2013, Science, 340, 1199
- van der Plas et al. (2014) van der Plas, G., Casassus, S., Menard, F., et al. 2014, arXiv:1407.1735
- Varnière et al. (2006) Varnière, P., Blackman, E. G., Frank, A., & Quillen, A. C. 2006, ApJ, 640, 1110
- Verhoeff et al. (2011) Verhoeff, A. P., Min, M., Pantin, E., et al. 2011, A&A, 528, A91
- Vilas-Boas et al. (2000) Vilas-Boas, J. W. S., Myers, P. C., & Fuller, G. A. 2000, ApJ, 532, 1038
- Wilson & Rood (1994) Wilson, T. L., & Rood, R. 1994, ARA&A, 32, 191
- Wilson et al. (2009) Wilson, T. L., Rohlfs, K., Huumlttemeister, S. 2009, Tools of Radio Astronomy, by Thomas L. Wilson; Kristen Rohlfs and Susanne Hüttemeister. ISBN 978-3-540-85121-9. Published by Springer-Verlag, Berlin, Germany, 2009.,
- Zhu et al. (2011) Zhu, Z., Nelson, R. P., Hartmann, L., Espaillat, C., & Calvet, N. 2011, ApJ, 729, 47
Appendix A Spectral energy distribution
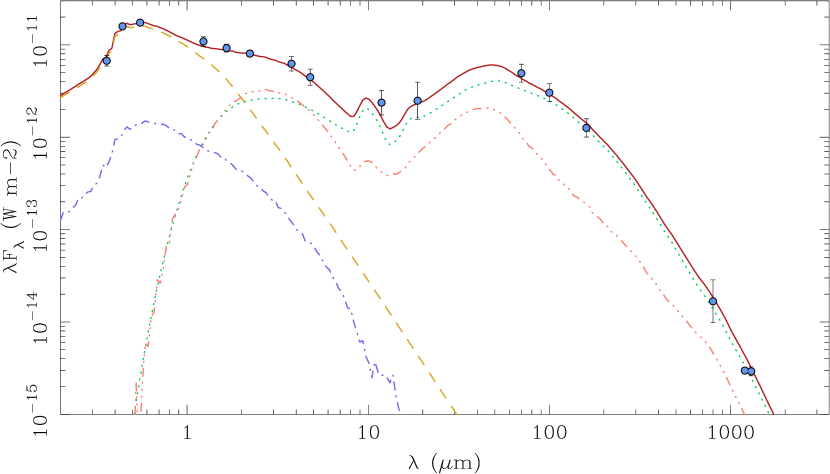
We tested the consistency of our disk structure model by comparing its predicted spectral energy distribution (SED) against observed HD 142527 photometry. We obtained observed continuum fluxes from Verhoeff et al. (2011) (see references there in). The observed SED was dereddened by using a standard extinction curve (Cardelli et al., 1989), for (Verhoeff et al., 2011) and an assumed of .
Synthetic fluxes were calculated using the Monte Carlo radiative transfer code MCFOST (Pinte et al., 2006). We used an MCFOST model consistent with the disk structure described in Section 4.1. Previous attempts to model the HD 142527 SED invoked a puffed-up rim to explain the large excess of emission in the near infrared (Verhoeff et al., 2011). This excess could be explained by the dust emission coming from very near the star that we see at 345 GHz (see Section 3.2).
We distributed dust grains (mainly silicates and amorphous carbons) with sizes between 0.1 and 1000 m across the disk model. We used the Mie theory and assumed a gas-to-dust ratio of 100.
Figure 10 shows the SED calculated from our model. Our model consists of: 1) an inner disk extending from 0.2 to 6 au with 10-9 M⊙ of dust. This dust mass, together with a aspect ratio of 0.18, are enough to reproduce the large near-infrared excess. 2) a dust-depleted gap between 6 and 90 au in radii almost depleted of gas and dust; 3) a second gap extending from 90 to 130 au with enough gas to explain our isotopologues observations, and 4) a large outer disk stretching from 130 to 300 au. The flaring exponent ranges between 1 and 1.18 for each zone. The aspect ratio of all the zones was 0.18 except for the outer disk which covers a larger solid angle, attaining an of 0.23.
It is important to note that the gas model presented in Section 4.1 assumes a constant aspect ratio, since it only aims to reproduce the gas inside the dust-depleted cavity and not the broad spectral features of the entire disk.