Spectral variability of the IR–source IRAS 01005+7910 optical component
Highly–resolution optical spectra of the optical component of the IR–source IRAS 01005+7910 are used to determine the spectral type of its central star, B1.50.3, identify the spectral features, and analyze their profile and radial velocity variations. The systemic velocity km s-1 is determined from the positions of the symmetric and stable profiles of the forbidden [N I], [N II], [O I], [S II], and [Fe II] emission lines. The presence of the [N II] and [S II] forbidden emissions indicates the onset of the ionization of the circumstellar envelope and the fact that the star is very close to undergoing the planetary nebula stage. The broad range of heliocentric radial velocity Vr estimates based on the core lines, which amounts to about 34 km s-1, is partly due to the deformations of the profiles caused by variable emissions. The variations of the Vr in the line wings are smaller, about 23 km s-1, and may be due to pulsations and/or hidden binarity of the star. The deformations of the profiles of complex absorption–emission lines may result from variations of their absorption components caused by the variations of the geometry and kinematics in the wind base. The H lines exhibit P Cyg III type wind profiles. Deviations of the wind from spherical symmetry are shown to be small. The relatively low wind velocity (27–74 km s-1 from different observations) and the strong intensity of the red emission (it exceeds the continuum level by up to a factor of seven) are typical for hypergiants rather than the classical supergiants. IRAS 01005 is an example of spectral mimicry of a low mass post-AGB star masquerading as a massive hypergiant.
Key Words.:
stars: AGB and post-AGB—stars: winds, outflows—stars: individual: IRAS 01005+79101 Introduction
The IR–source IRAS 01005+7910 (hereafter referred to as IRAS 01005) is located high above the Galactic plane at a latitude of . Its optical counterpart is a peculiar B–type supergiant, B = 11, V = 11. The position of the source in the IRAS–color diagram is consistent with it undergoing the stage of a protoplanetary nebula (PPN). According to the chronological sequence of Lewis [Lewis ], the absence of OH and CO emissions [Likkel1989 ; Likkel1991 ; Nyman ; Omont ; Hu94 ] indicates that the object is close to the planetary nebula stage (PN). Klochkova et al. [01005 ] obtained essential results for the central star of IRAS 01005. The above authors determined the fundamental parameters of the supergiant (Teff = 21500 K, surface gravity , metallicity [Fe/H] =, and the abundances of a number of chemical elements) and confirmed its post–AGB status. Another important result of the above study is the discovery of carbon overabundance () in the atmosphere of the central star.
The IR spectrum of the circumstellar envelope of IRAS 01005 exhibits spectral features of the carbon-containing fullerene molecule (C60) [Zhang ; Iglesias ]. IRAS 01005 is the hottest post–AGB star among those whose spectra exhibit the so far unidentified features at 3.3 and 3.4 m [Hrivnak2007 ]. The high Galactic latitude of IRAS 01005 combined with its low metallicity indicates that the star belongs to the old population of the Galaxy.
Several teams studied the photometric variability of IRAS 01005. Hrivnak et al. [Hrivnak2010 ] noted variations of the object on a time scale of less than several days which is too short for PPNe. Arkhipova et al. [Arkhip2013 ] performed long-term photometric monitoring of several hot PPNe including IRAS 01005 and found these objects to exhibit rapid irregular light variations. Based on these observations of the low-amplitude PPN light variations, Arkhipova et al. [Arkhip2013 ] concluded that the parameters of the stellar winds of these stars show variations and/or micropulsations with characteristic periods of several hours.
The optical spectrum of IRAS 01005 has so far not been studied in sufficient detail. Based on low–resolution observations, Hu [Hu ] determined its spectral type to be Sp = B2 Ie and pointed out the P Cyg profile of the H line in the spectrum of IRAS 01005. He found no differences between the spectra of the star taken ten years apart. However, Klochkova et al. [01005 ] identified spectral features in the spectra taken with echelle spectrographs of the 6–m telescope of the Special Astrophysical Observatory and found variations in the spectrum of the central star. The spectrum contains C II, O II, N II, Al III, and Si III absorption lines, the Mg II Å line, and emission features identified with Si II and the forbidden [Fe II] lines. The profiles of the hydrogen Balmer lines, the resonance Na I doublet, the He I and Fe III lines contain both the emission and absorption components. The optical spectrum was found to show substantial variations: the neutral helium lines vary from direct to inverse P Cyg profile on time scales from several days to several months. The lines of the Na I resonance doublet contain five absorption components with the velocities of , , , , and km s-1, and the absorption profile of the line is superimposed onto the high-velocity emission component whose width coincides with that of the emission components of the hydrogen lines. The observed variability of the spectrum provides a stimulus for further investigation of the optical component of the IR source IRAS 01005.
In this paper we report the results of long-term monitoring of IRAS 01005 carried out with the aim to study the variability of the optical spectrum. Note that unlike our previous study [01005 ], here we use only the high-resolution spectroscopic data. Section 2 briefly describes the technique of observations and data reduction and Section 3 presents the main results.
| Data | , | Vr, km s-1 | ||||||||
| Main | Forbid | Absorptions | Em.abs. | Abs.em. | ||||||
| components | emis | Fe III, (He I) | ||||||||
| Na I, (Ca II) | wings | cores | H | H | ||||||
| (1) | (2) | (3) | (4) | (5) | (6) | (7) | (8) | (9) | (10) | |
| 25.01.2002 | 354–500 | 40 | ||||||||
| 04.02.2002 | 460–607 | 60 | ||||||||
| 22.11.2002 | 538–685 | 50 | ||||||||
| 25.11.2002 | 538–685 | 30 | ||||||||
| 27.11.2002 | 452–600 | 35 | ||||||||
| 02.12.2002 | 452–600 | 45 | ||||||||
| 03.12.2002 | 452–600 | 30 | ||||||||
| 19.12.2002 | 452–600 | 50 | ||||||||
| 23.02.2003 | 516–666 | 55 | ||||||||
| 13.04.2003 | 528–676 | 80 | ||||||||
| 15.11.2003 | 352–500 | 100 | ||||||||
| 10.01.2004 | 528–676 | 50 | ||||||||
| 09.03.2004 | 528–676 | 55 | ||||||||
| 28.08.2004 | 528–676 | 55 | ||||||||
| 18.01.2005 | 528–676 | 110 | ||||||||
| 13.11.2005 | 456–601 | 110 | ||||||||
| 15.11.2005 | 528–678 | 120 | ||||||||
| 09.12.2006 | 447–594 | 130 | ||||||||
| 03.11.2008 | 446–593 | 160 | ||||||||
| 05.11.2008 | 446–593 | 160 | ||||||||
| 20.11.2010 | 397–545 | 75 | ||||||||
| 29.05.2013 | 391–680 | 70 | ||||||||
| 21.08.2013 | 391–680 | 80 | ||||||||
2 Observational data and their reduction
In this study we use twenty three high-resolution spectra (R =60 000) taken with the NES echelle spectrograph [nes1 ; nes2 ] of the 6–m telescope of the Special Astrophysical Observatory during the period from 2002 to 2013. It is important for spectral variability studies to use only the spectra taken with the same spectrograph, albeit in different wavelength intervals. Unfortunately, the spectra also differ by their exposure levels (signal-to-noise ratios ). The dates, wavelength intervals, and maximum ratios are listed in the first, second, and third columns of Table 1 respectively. To reduce the spectra, we used the DECH program [gala ], which, in particular, can smooth curves without appreciable loss of resolution and measure radial velocities from paricular features of complex lines, which are typical of our spectra, by superimposing the direct and mirrored images of their profiles.
All the radial velocities mentioned in this paper are heliocentric. The laboratory wavelengths used to determine these velocities are listed in Table LABEL:lines. Most of them are adopted from the NIST database111http://www.nist.gov/pml/data/asd.cfm and were validated by the spectra of the stars 10 Lac (O9 V) and Her (B3 III) with narrow lines taken with the same spectrograph as the one used to observe IRAS 01005. In a number of cases (He I triplets, C II and Mg II doublets, etc.) we use the effective wavelengths. We indicate the number of the multiplet in parentheses both in the text and in Table LABEL:lines.
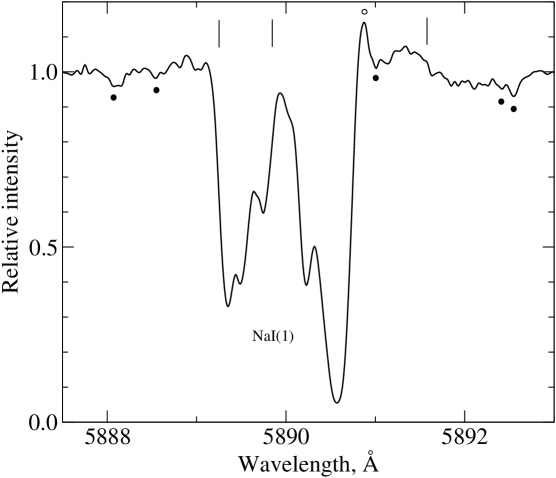
If telluric lines were present in the spectrum we used these to control and correct the inferred radial velocities. We additionally controlled the stability of the radial velocity system by interstellar lines, mostly those of Na I (1). We took into account the distortions due to the blending of these lines by telluric H2O absorptions and Na I emissions, and, in the case of the D2 line, also by the C II (5) triplet. All these distortions vary in time. Figure 1 illustrates their presence in the spectrum of November 13, 2005 and the complex structure of the D2 Na I (1) 5890 Å line profile. The heliocentric radial velocities of its five main components averaged over all our data are equal to , , , , and km s-1. The velocities of the two outermost (the deepest) components are listed in Table 1 (column 4). Judging by these velocities, the systematic errors of the radial velocities listed in other columns of Table 1 do not exceed 1 km s-1.
3 Main results
3.1 Line-profile and radial velocity variations
Klochkova et al. [01005 ] showed that the profiles of most of the lines vary both in time and within the same spectrum, from line to line. The profiles and their presumable formation regions can, to a first approximation, be subdivided into three types:
-
narrow emissions—the tenuous extended envelope;
-
emission-absorption profiles—the transition region from the photosphere to the envelope and, in particular, stellar wind;
-
absorptions—the photosphere.
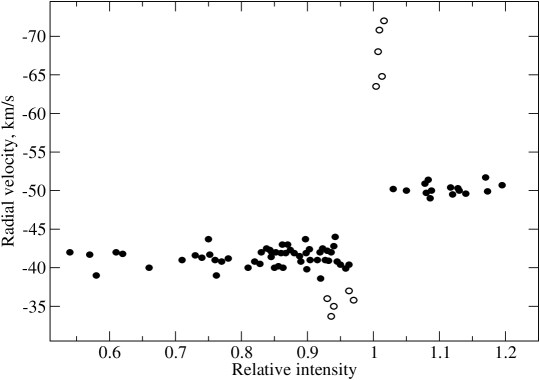
The accuracy of single-line velocity measurements is determined by the noise () and the gradient of residual intensity in the line profile (). As is evident from the example shown in Fig. 2, the profiles in the spectrum of IRAS 01005 vary with time and from line to line. The accuracy of velocities based on individual-line measurements can be estimated from the scatter of the corresponding symbols in Fig. 3, which shows the V dependences in the spectrum taken on May 29, 2013. The average velocity errors for this spectrum, which has the ratio typical of our data and the broadest wavelength coverage, are equal to 0.5 km s-1, about 1 km s-1, and about 3 km s-1 for the forbidden emissions, the absorption cores, and the weak emission components of Fe III lines respectively.
The least complex (symmetric) and stable profiles among the narrow emissions are those of the [N I], [N II], [O I], [S II], and [Fe II] forbidden lines. The presence of forbidden [N II] and [S II] emissions is indicative of the onset of the ionization of the circumstellar envelope and of the closely imminent planetary nebula stage. The average radial velocities (measured on different dates from different sets of these lines) are listed in column 5 of Table 1. Temporal variations of the velocities of forbidden lines are close to those of interstellar absorption features, i.e., to the measurement errors. The velocity appears to have remained constant during our observations. Averaging over the entire dataset yields a value of km s-1. In Fig. 4 we compare the profile of one of the stellar lines, [N I] 5198 Å, with that of the [O I] 5577 Å telluric emission: the former is appreciably broader and has a half-width of about 10 km s-1.
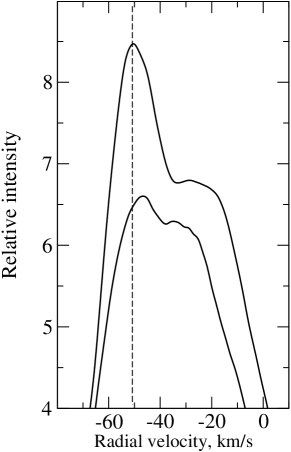
Unlike the radial velocities, the intensities of the forbidden lines exhibit small variations (with a maximum amplitude of residual intensities equal to 5–6%). The reality of these variations is supported by the fact that they occur synchronously in different lines, by their absence over a two–day period, and the fact that relative intensity variations of the lines in the [N I] 5198, 5200 Å, [Fe II] 4814, 5158 Å and other doublets, which are limited only by observational errors, are substantially smaller 2–3%. The part of the spectrum of IRAS 01005 available to us contains several weak O I emissions. Note that the very strong OI (1) 7773 Å triplet is observed in absorption [01005 ]. Its intensity might suggest that weaker lines — members of multiplets (9) (6454–56 ÅÅ) and (10) (6156–58 ÅÅ) — should also have the form of absorptions with the depths of R, however, they cannot be distinguished from noise in our spectra and are possibly filled with emissions. Pure emissions belong to the multiplets (5) 4368 Å, (23) 5958 Å and (22) 6046 Å, and their mean residual intensities are equal to 1.04, 1.05, and 1.11 respectively. We show the profile of the latter line in Fig. 4. The width and mean radial velocity ( km s-1) of the O I emission are close to the corresponding parameters of the forbidden lines. The fact that forbidden lines and O I emissions form in the slowly expanding stellar envelope suggests that the latter should also be responsible for the formation of narrow emission components of the complex profiles of the first members of the Balmer series. During our observations the wind components of these features showed appreciable intensity variations, but maintained a P Cyg III type profile according to Beals with the red emission peak much higher than the blue one. Figure 5 shows examples of the top parts of complex H profiles and the last column of Table 1 lists the radial velocities of the absorption and emission extrema of their wind components based on our entire observed data.
Visual inspection shows that variations of the envelope flux are more pronounced in hydrogen lines than in forbidden O I emissions. Quantitative estimates are hindered by the blending of envelope and wind emissions, however, they can be performed by comparing all the available H profiles. The range of peak intensities of narrow components amounts to about 20% if the intensity variations at the corresponding wavelengths in the wind components are taken into account. Figure 5 shows the upper parts of the H profiles with relatively strong (August 21, 2013) and weak (November 22–25, 2002) envelope components. As is evident from these profiles, the strongest (and hence least deformed by blending) narrow H emissions are more or less as wide as the forbidden emissions and are minimally shifted relative to them. As the component weakens, its peak shifts redward with its radial velocity changing from km s-1 on August 21, 2013 to km s-1 on November 22–25, 2002.
The Si II lines also appear to form, at least partially, in the envelope. This is primarily evidenced by the fact that in the part of the spectrum of IRAS 01005 available to us almost all these lines appear in emission (the only exception is the 4128 and 4131 Å absorption–emission doublet). Furthermore, averaging over the entire radial velocity data for the emission peaks yields a value close to km s-1. However, Si II lines differ from the envelope emissions considered above by the shape and variability of their profiles. The radial velocities of their peaks vary with time from km s-1 to km s-1, and their residual intensities and halfwidths—by 10% and 30% respectively. The time scale of these variations can hardly be determined from our data, however, note that these variations do not exceed the measurement errors at least over two-day time intervals (November 25–27, 2002; November 13–15, 2005; and November 3–5, 2008).
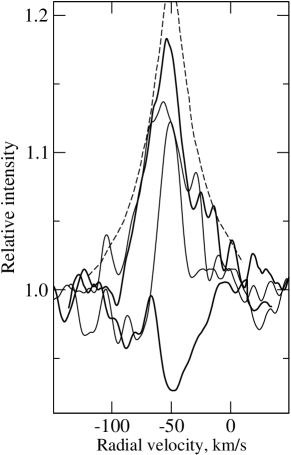
Figure 6 shows examples of Si II line profiles. The dashed line shows the line enveloping of the 17 profiles of the strongest line, Si II 5979 Å, shifted along the Vr axis. It resembles the silhouette of Mount Fuji on Japanese woodblock prints: a sharp peak (), incurved slopes (V20 km s-1 at half maximum), and a broad base (up to km s-1). The profile of the Si II 6347 Å line becomes sharply asymmetric from time to time: one of its slopes “sags,” sometimes even below the continuum level (e.g., the blue slope on April 13, 2003). These profile deformations may be due, as in the case of hydrogen lines, to variations of their absorption (photospheric) components and also to variations of the geometry and kinematics at the wind base. An inspection of columns 6 and 7 of Table 1 shows that the profiles of April 13, 2003 and November 15, 2005 compared in Fig. 6 correspond to almost equal absorption-feature radial velocities.
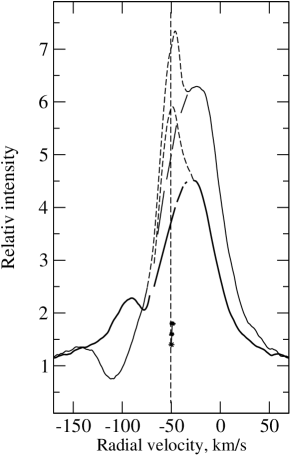
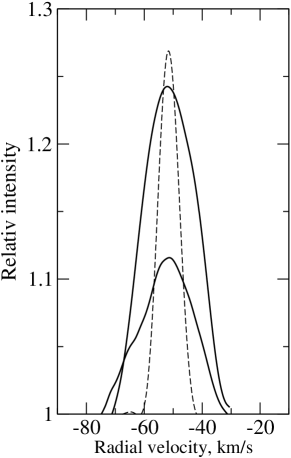
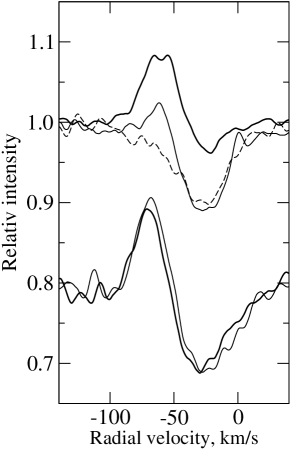
As we pointed out above, the H lines, free from superimposing narrow envelope emissions, have P Cyg III-type, i.e., almost wind-type, profiles. Figure 7 illustrates this fact for two wind intensity levels (the residual intensity of the red H and H emission peaks varies by 50% and 70% over our entire observed data set). The main emission peaks and absorption depressions are located on opposite sides of the vertical line that marks the velocity determined from forbidden emissions ( km s-1). As is evident from the last two columns of Table 1, for H and H this also remains true for all our remaining spectra. Note that both the shifts Vr = (Vr+50.5 km s-1) and their scatter are small: V km s-1 for the H absorption minimum and 18V31 km s-1 for the main emission peak. Such a relatively low wind velocity, as well as the high intensity of the red emission peak (it exceeds the continuum level by up to a factor of seven), are typical of hypergiants rather than classical supergiants. Hence IRAS 01005 represents a case of spectral mimicry of a low mass post–AGB star masquerading as a massive hypergiant.
The deviations of the wind structure from spherical symmetry are small. This is evidenced by the symmetry in the lower parts of the H profiles (1.21.8), the fact that the radial velocities Vr inferred from them are close to km s-1, the inverse correlation between the intensities of the blue and red emission peaks, as well as the inverse correlation between the depth of the absorption minimum and the height of the red emission peak and the direct correlation between the absorption depth and its blueshift. The conclusion about insignificant deviations of the wind from spherical symmetry is consistent with the shape of the circumstellar envelope of IRAS 01005. Siódmiak et al. [Siodmiak ] classified the high-resolution Hubble Space Telescope image of this object as belonging to the SOLE morphological type, which is dominated by the flux of the central star. The circumstellar envelope is irregular and contains several lobes of different size.
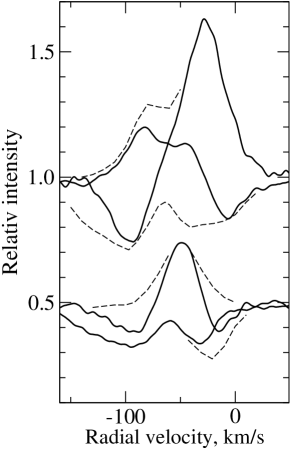
The He I profiles are more diverse. Figure 8 shows pairs of most dissimilar He I 5876 and 5016 Å line profiles. The He I 5876 Å line, which is the strongest in the visible part of the spectrum, forms higher than the other He I lines, and therefore it is not surprising that in 12 out of our 20 spectra its profile reproduces the direct P Cyg profile of the H or H line and follows its intensity variations. This similarity persisted, e.g., from November 22 through December 3, 2002. Another case is illustrated in Fig. 8 by the profile of April 13, 2003, where the shifts of the extrema (i.e., the Vr quantity introduced above) are equal to and km s-1, or, for H, and km s-1. However, such similarity often disappears. In the profile of November 13, 2005, shown in the same figure, the main emission peak is on the blue rather than the red side of the absorption depression with the shift equal to V km s-1 and km s-1 for the former and latter respectively. The corresponding shifts for H are equal to and km s-1. Note that this is not the case of the direct P Cyg profile of the He I 5876 Å line becoming an inverse P Cyg profile, because both the emission and absorption features are located on the same side of the “ km s-1 line.”
The profile of the weaker He I 5016 Å line is less complex and more stable, it contains a single and rather narrow emission component (with an average halfwidth of 18 km s-1). The most variable of its parameters is the residual intensity, which, according to our data, varies by about 30%, whereas the radial velocity oscillates near the “ km s-1 line” from to km s-1.
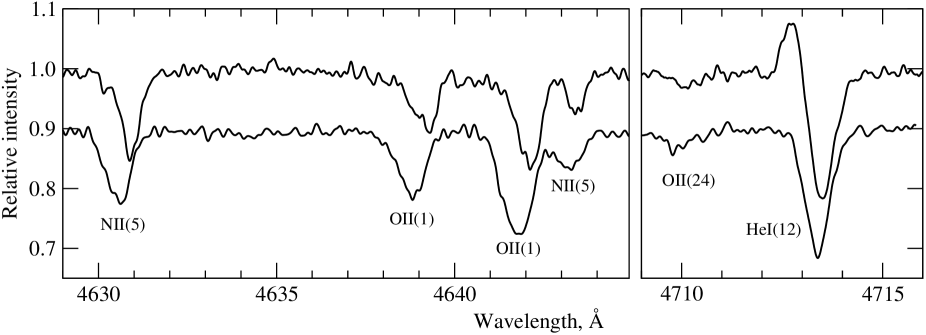
The profiles of even weaker He I lines become increasingly similar to the emission-absorption profiles of the heavier elements: C II, N II, and Fe III (Fig. 9). The latter features have the most typical profiles and we therefore list the velocities of their extrema in column 8 of Table 1 (the similarity of the profiles allowed us to replace the unavailable reliable Fe III lines by He I line measurements in two cases). Interpreting the profiles of the He I 4713 Å and other lines as inverse P Cyg profiles, i.e., as a manifestation of the global contraction of their formation layers, appears to be justified in some cases, however, most of our spectra show only an emission superimposed onto the blue slope of the absorption profile. The upper part of Fig. 9 demonstrates this fact by an example of the profile of the pure absorption O II 4676 Å line of similar intensity.

The lines that form at the wind base and in the transition layer between the wind and the photosphere are also variable in all their parameters. Our data demonstrates conclusively the profile variations at least over a two–day time interval. This is immediately apparent from Fig. 10. Whereas the differences between the He I 5048 Å and N II 5679 Å line profiles appearing over a six-hour time interval (the left-hand fragment of the figure) are still close to the measurement errors, the corresponding variations over a two–day time interval (the right-hand fragment) become significant and quite measurable: thus the equivalent width of the N II 5679 Å line increased from 0.15 to 0.22 Å.
More or less pure photospheric absorptions are usually asymmetric: their cores are redshifted relative to the wings. We therefore measured the radial velocities of these lines not only by their cores but also by the wings of their rofiles, and list the corresponding values in columns 7 and 6 of Table 1 respectively. Each value is a result of averaging over many absorptions of the spectrum based on the corresponding plot of the type shown in Fig. 3. Note that the V dependence zone may have a nonzero slope and therefore the adopted result is equal to the limit of Vr as residual intensity tends to = 1.0.
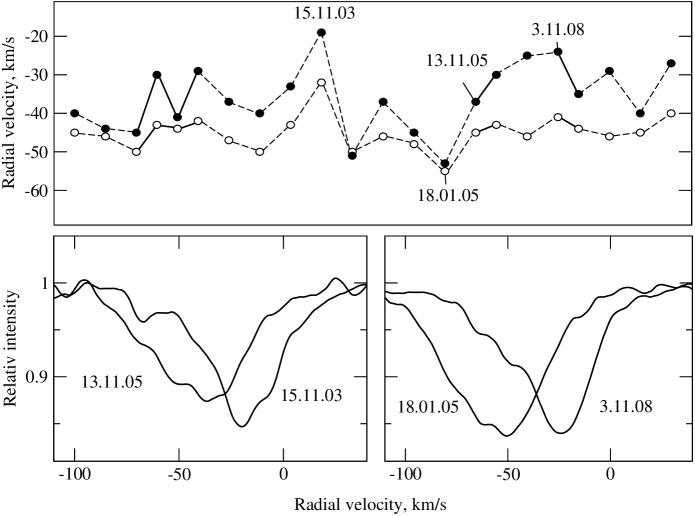
Figure 11 shows graphically the radial velocities from columns 6 and 7 of Table 1. Their temporal variations should be viewed relative to the radial velocity of the star as a whole, i.e., the systemic radial velocity Vsys. It is reasonable to set this velocity equal to the radial velocity of forbidden emissions, i.e., adopt V km s-1. This assumption is supported by the fact that the radial velocity values Vr for the wings, which correspond to the deepest accessible atmospheric layers, are closer to the adopted Vsys than the Vr values for the line cores. More importantly, absorptions with VVsys are least deformed by emission features or are even totally free of them (see the lower panels in Fig. 11, where we compare the profiles of two N II lines at the epochs of large discrepancies between the inferred radial velocity values). According to our data, the spread of Vr estimates for the line cores amounts to 34 km s-1, and can partly be due to the deformations of the profiles by variable emission features. The spread of Vr estimates for the wings is smaller, 23 km s-1, and can be interpreted as a result of pulsations and/or hidden binarity of the star even despite the low accuracy of the corresponding measurements. The hypothesis that the star may be pulsationally unstable is consistent with a similar interpretation of the rapid variability of the photometric parameters of the star [Arkhip2013 ].
3.2 Binarity and pulsations of post-AGB stars
Many of the PPN candidates exhibit light and radial velocity variations on time scales of several hundred days which may be indicative of their binary nature. Conclusive evidence for orbital motions has been obtained for several optically bright stars undergoing the PPN stage. For example, the high-latitude supergiants 89 Her [Ferro ; Waters ], HR 4049, HD 44179, and HD 52961 [Winck95 ] are shown to be binary, and the above authors determined the orbital elements and proposed the corresponding binary models for these systems. The nature of the companions in suspected binary post–AGB stars so far remains unknown because of the lack of their direct manifestations in the continuum or spectral lines: all the known post–AGB binaries are of the SB1 type. A possible companion can be either a very hot object or a low-luminosity main-sequence star. It can also be a white dwarf, like in the case of Ba–stars.
According to theoretical computations of Gautschy [Gautschy ], pulsations are a typical feature of post-AGB stars throughout a wide temperature interval, . Manifestations of atmospheric pulsations were earlier found for a number of stars at the PPN stage. Such is the case of the well-studied semiregular variable CY CMi (the optical component of the IR–source IRAS 07134+1005). The radial velocity variability of this star was first suspected in [Kloch95 ] from a comparison of the published data with those obtained with the 6–m telescope. Somewhat later Lebre et al. [Lebre ] used the Fourier technique to analyze the variability of the H profile in the spectrum of CY CMi and the corresponding radial velocity data, and concluded that the atmosphere of this star has complex pulsation driven dynamics. Barthès et al. [Bart ] acquired an extensive set of quality spectra of CY CMi spanning an eight-year period and concluded that the radial velocity of the star varies with a half-amplitude and main period of 2.7 km s-1 and P = 36 respectively. Photometric variations have the same period and a very small amplitude of .
Klochkova et al. [56126-atlas ; 56126-AZh ] analyzed the kinematics of the atmosphere and envelope of CY CMi by studying spectral features of various intensity, found the kinematic pattern to be variable, and pointed out that the variations of the radial velocities measured from extremely weak absorptions possibly indicate that the star is a binary, but may also be a manifestation of low-amplitude pulsations in circumphotospheric layers. To determine conclusively whether CY CMi is a binary it is important to monitor the Vr variations over several years acquiring one to two spectra every month.
Hrivnak et al. [Hrivnak2013 ] analyzed the pulsations in the atmosphere of V448 Lac and in that of a related post–AGB star V354 Lac (IRAS 22272+5435) based on long-term observations of light, color, and radial-velocity variations. The above authors determined the periods, period ratios, and pulsation amplitudes for these stars and found that the pulsation properties of post–AGB stars are not always consistent with the results of theoretical computations for this evolutionary stage [Fokin ] and differ from the corresponding properties of classical Cepheids. The stars CY CMi, V354 Lac, and V448 Lac, which were found to be pulsationally unstable, are a part of the group of F–type supergiants enriched in carbon and s–process heavy metals synthesized during prior evolution. The basic information about this group of related PPNe can be found in [Hrivnak2010 ; Envelopes ]. Klochkova et al. [05040 ] found evidence for variations of the velocities of the absorption features in the spectrum of a hotter post–AGB star — the A–type supergiant .
3.3 Lines of the Na I doublet and DIBs
The heliocentric radial velocities of the five main components of the Na I D lines (Fig. 1) averaged over our entire dataset are equal to , , , , and km s-1, and hence agree within the quoted errors with the results reported in our previous paper [01005 ] and with those reported in a recent paper [Iglesias ]. The weak component of the Na I D lines whose position corresponds to V km s-1 forms in the stellar atmosphere, whereas the two red components are of interstellar origin and form in the Local arm of the Galaxy. The blue component (V km s-1) may also form in the interstellar medium, in the Perseus arm. This hypothesis is supported by the presence of a similar interstellar component with V km s-1 in the spectra of the B-type stars HD 4841, HD 4694, and Hiltner 62 [00470 ], which are members of the Cas OB7 association. The Galactic latitudes of these stars are close to that of IRAS 01005. This hypothesis leads us to conclude that IRAS 01005 should be a very distant object. The distance to the Cas OB7 association is equal to kpc [Cazzolato ] and can be viewed as a lower estimate for the distance to IRAS 01005.
Note that Klochkova et al. [23304new [ also found a strong interstellar Na I D line component with a close velocity V km s-1 in the spectrum of the faint G-type supergiant identified with the IR–source IRAS 23304+6347, located close to the Galactic plane at a Galactic longitude that differs by about from that of IRAS 01005.
As for the bluemost component of the Na I D lines with the velocity of V, it seems quite logical to conclude that it forms in the expanding circumstellar envelope in the system of the IRAS 01005 source. In this case we derive an expansion velocity of V km s-1, which is typical for PPNe (see [Loup ; Envelopes ]).
The spectra of the B–type stars HD 4841, HD 4694, and Hiltner 62 contain DIBs with velocities ranging from to km s-1 [00470 ]. We also identified four DIBs in the spectra of IRAS 01005 at 5780, 5797, 6195, and 6613 Å. The positions of these features correspond to a radial velocity of V km s-1, which agrees with the velocity inferred from three bands by Iglesias–Groth and Esposito [Iglesias ] and with the measurements made by Luna et al. [Luna ] from the 5780 and 6613 Å bands. The measurements of other DIBs in IRAS 01005 spectrum reported by Luna et al. [Luna ] have large errors. The same is true for the measurements of the positions of the components of the D lines of the Na I doublet by the same authors.
3.4 Spectral type of the IRAS 01005 central star
We derive a spectral type of B1.5 for the star based only on the weak and minimally deformed C II/III, N II/III, O II/III, Si III/IV, and other absorptions, and a direct comparison of the spectrum of IRAS 01005 with those of V1853 Cyg (B1 Iae), 9 Cep (B2.3 Ib), and other early type supergiants from the atlas [Sarkisyan ]. The H I and He I lines yield a luminosity class Ib for IRAS 01005. Klochkova et al. [01005 ] found for IRAS 01005 a similar spectral–type estimate . Note that the spectral types of metal–poor stars with the chemical composition altered during evolution determined by comparing the spectra of these objects with those of Population-I stars may be fraught with systematic errors.
The hot post–AGB supergiants V1853 Cyg [V1853Cyg ], V886 Her [V886Her ], LS III [Sarkar2012 ], and several more stars in the southern sky are related objects for IRAS 01005 [Sarkar2005 ; Mello2012 ]. Gauba and Parthasarathy [Gauba2004 ] report a list of 15 hot post–AGB stars, analyze the specific features of their IR–spectra, and determine the parameters of their circumstellar envelopes. Of special interest among the hot post-AGB stars is the high-latitude Be–star V886 Her (IRAS 18062+2410), which is similar to IRAS 01005 in terms of basic parameters. An analysis of extensive observational data for V886 Her suggests that it is rapidly evolving toward the PN stage [Arkhip1999 ; Partha2000 ; Arkhip2007 ].
4 Conclusions
Based on 23 high-resolution spectra (R = 60 000) of the IR–source IRAS 01005+7910 that we took with the 6–m telescope of the Special Astrophysical Observatory, we determined the spectral type and luminosity class (B1.5 Ib) of the central star, identified numerous spectral features, analyzed the variations of their profiles and radial velocity.
We determined the systemic radial velocity of the star Vsys = km s-1 from the positions of symmetric and stable profiles of forbidden emission features of [N I], [N II], [O I], [S II], and [Fe II]. The presence of forbidden emissions of [N II] and [S II] is indicative of the onset of the ionization of the circumstellar envelope and the approaching planetary nebula stage.
The span of radial-velocity estimates Vr based on the line cores, which amounts to 34 km s-1, is partially due to the profile deformations caused by variable emissions. The span of Vr estimates based on the line wings is smaller, about 23 km s-1, and can be due to pulsations and/or hidden binarity of the star. The deformations of the profiles of absorption-emission lines may be due to the variations of their absorption (photospheric) components with varying geometry and kinematics in the wind base. Our observed data leads us to conclude that variations become quite measurable over a two–day time interval.
The H lines have P Cyg III-type wind profiles. We show that deviations of the wind from spherical symmetry are small. We find the wind velocity to be small (27–74 km s-1 at different observing epochs) and the red emission to have high intensity (exceeding the continuum level by up to a factor of seven) which is typical of hypergiants rather than classical supergiants.
According to our measurements, the heliocentric radial velocities of the five main components of Na I D lines are equal to Vr =, , , , and km s-1 (Fig. 1) and agree with the published data within the errors. The weak component at Vr = km s-1 forms in the stellar atmosphere and the two redder components are of interstellar origin and form in the Local arm. The presence of the Vr = km s-1 component, which appears to form in the interstellar medium of the Perseus arm, allows us to adopt d = 2.5 kpc as a lower estimate for the distance to IRAS 01005. The bluemost component, Vr = km s-1, may form in the circumstellar envelope expanding at a velocity of V22 km s-1, which is typical of PPNe.
Acknowledgments
This work was supported by the Russian Foundation for Basic Research (project No. 14–02–00291 a). The observations with the 6–m telescope were carried out with the financial support of the Ministry of Education and Science of the Russian Federation (contracts No. 16.518.11.7073 and 14.518.11.7070). This research has made use of the SIMBAD database, operated at CDS, Strasbourg, France, and SAO/NASA Astrophysics Data System.
References
- (1) 1. B.W. Lewis, ApJ338, 234 (1989).
- (2) 2. L. Likkel, ApJ344, 350 (1989).
- (3) 3. L. Likkel, T. Forveille, A. Omont, and M. Morris, Astron and Astrophys.246, 153 (1991).
- (4) 4. L.–A. Nyman, R.S. Booth, U. Carlström, et al., Astron and Astrophys. Suppl.93, 121 (1992).
- (5) 5. A. Omont, C. Loup, T. Forveille, et al., Astron and Astrophys.267, 515 (1993).
- (6) 6. J.Y Hu, P. Te Lintel Hekkert, S. Slijkhuis, et al., Astron and Astrophys. Suppl.103, 310 (1994).
- (7) 7. V.G. Klochkova, M.V. Yushkin, A.S. Miroshnichenko, et al., Astron and Astrophys.392, 143 (2002).
- (8) 8. Y. Zhang and S. Kwok, ApJ730, 126 (2011).
- (9) 9. S. Iglesias–Groth and M. Esposito, ApJ776, L2 (2013).
- (10) 10. B.J. Hrivnak, T.R. Geballe, and S. Kwok, ApJ662, 1059 (2007).
- (11) 11. B.J. Hrivnak, W. Lu, R. Maupin, and B.D. Spitzbart, ApJ709, 1042 (2010).
- (12) 12. V.P. Arkhipova, M.A. Burlak, V.F. Esipov, et al., Astron. Let. 39, 619 (2013).
- (13) 13. J. Y. Hu, in: Proc. Torun Workshop on Post-AGB Objects as a Phase of Stellar Evolution, Ed. by R. Szczerba and S. K. Górny (Kluwer Acad. Publ., 2001), p. 317.
- (14) 14. V. Panchuk, V. Klochkova, M. Yushkin, and I. Najdenov, High resolution echelle spectrograph NES for visible and ground-based UV regions. In: The UV Universe: stars from birth to death. in: Proc. IAU General Assembly, Joint Discussion No. 4, Ed. by A. I. Gomez de Castro and M. A. Barstow (Editorial Complutense, Madrid, 2007), p. 179.
- (15) 15. V. Panchuk, V. Klochkova, M. Yushkin, and I. Najdenov, J. Optical Technology, 76, 87 (2009).
- (16) 16. G.A. Galazutdinov, Preprint No. 92 (Special Astrophysical Observatory, Mizhnii Arkhyz, 1992).
- (17) 17. N. Siódmiak, M. Meixner, T. Ueta, et al., ApJ677, 382 (2008).
- (18) 18. A.A. Ferro, PASP96, 641 (1984).
- (19) 19. L.B.F.M. Waters, C. Waelkens, M. Mayor, and N.R. Trams, Astron and Astrophys.269, 242 (1993).
- (20) 20. H. van Winckel, C. Waelkens, and L.B.F.M. Waters, Astron and Astrophys.293, L25 (1995).
- (21) 21. A. Gautschy, MNRAS 265, 340 (1993).
- (22) 22. V.G. Klochkova, MNRAS272, 710 (1995).
- (23) 23. A. Lèbre, N. Mauron, D. Gillet, and D. Barthès, Astron and Astrophys.310, 923 (1996).
- (24) 24. D. Barthès, A. Lèbre, D. Gillet, and N. Mauron, Astron and Astrophys.359, 168 (2000).
- (25) 25. V.G. Klochkova, E.L. Chentsov, N.S. Tavolganskaya, and M.V. Shapovalov, Astrophys. Bull. 62, 105 (2007).
- (26) 26. V.G. Klochkova and E.L. Chentsov, Astron. Rep. 51, 994 (2007).
- (27) 27. B.J. Hrivnak, W. Lu, J. Sperauskas, et al., ApJ766, 116 (2013).
- (28) 28. A.B. Fokin, A. Lèbre, H. Le Coroller, and D. Gillet, Astron and Astrophys.378, 546 (2001).
- (29) 29. V.G. Klochkova, Astrophys. Bull. 69, 279 (2014).
- (30) 30. V.G. Klochkova, E.L. Chentsov, N.S. Tavolzhanskaya, and V.E. Panchuk, Astron. Rep. 51, 642 (2007).
- (31) 31. A.S. Miroshnichenko, E.L. Chentsov, V.G. Klochkova, et al., ApJ700, 209 (2009).
- (32) 32. F. Cazzolato and S. Pineault, AJ125, 2050 (2003).
- (33) 33. V.G. Klochkova, V.E. Panchuk, and N.S. Tavolganskaya, Astron. Let. 41 No.2 (2015) (in press).
- (34) 34. C. Loup, T. Forveille, A. Omont, and J.F. Paul, Astron and Astrophys. Suppl.99, 291 (1993).
- (35) 35. R. Luna, N.L.J. Cox, M.A. Satorre, et. al. Astron and Astrophys.480, 133 (2008).
- (36) 36. E.L. Chentsov and A.N. Sarkisyan, Astrophys. Bull. 62, 257 (2007).
- (37) 37. V.P. Arkhipova, N.P. Ikonnikova, R.I. Noskova, et al., Astron. Let. 27, 719 (2001).
- (38) 38. V.P. Arkhipova, V.G. Klochkova, and G.V. Sokol, Astron. Let. 27, 99 (2001).
- (39) 39. G. Sarkar, D.A. Garcia–Hernández, M. Parthasarathy, et al., MNRAS421, 679 (2012).
- (40) 40. G. Sarkar, M. Parthasarathy, and B.E. Reddy, Astron and Astrophys.431, 1007 (2005).
- (41) 41. D.R.C. Mello, S. Daflon, C.B. Pereira, and I. Hubeny, Astron and Astrophys.543, A11 (2012).
- (42) 42. G. Gauba and M. Parthasarathy, Astron and Astrophys.417, 201 (2004).
- (43) 43. V.P. Arkhipova, N.P. Ikonnikova, R.I. Noskova, et al., Astron. Let. 25, 25 (1999).
- (44) 44. M. Parthasarathy, P. Garcia-Lario, Y. Sivarani, et al., Astron and Astrophys.357, 241 (2000).
- (45) 45. V.P. Arkhipova, V.F. Esipov, N.P. Ikonnikova, et al., Astron. Let. 33, 604 (2007).
| Line | , | r | Vr, |
| (multiplet) | Å | km s-1 | |
| 15.11.03 | |||
| He I (36) | 3530.49 | 0.71: | |
| He I (34) | 3554.43 | 0.68: | |
| He I (31) | 3587.29 | 0.76 | |
| He I (6) | 3613.64 | 0.77 | |
| He I (28) | 3634.25 | 0.74 | |
| H 24 | 3671.48 | 0.94: | |
| H 23 | 3673.76 | 0.88: | |
| H 22 | 3676.36 | 0.87: | |
| H 21 | 3679.35 | 0.83: | |
| H 20 | 3682.81 | 0.81: | |
| H 19 | 3686.83 | 0.79: | |
| H 18 | 3691.56 | 0.73 | |
| H 17 | 3697.15 | 0.72 | |
| H 16 | 3703.86 | 0.64: | |
| He I (25) | 3705.02 | 0.61 | |
| H 15 | 3711.97 | 0.64 | |
| H 14 | 3721.94 | 0.64 | |
| O II (3) | 3727.33 | 0.87: | |
| He I (24) | 3732.87 | 0.81 | |
| H 13 | 3734.37 | 0.65 | |
| H 12 | 3750.15 | 0.63 | |
| He I (65) | 3768.78 | ||
| H 11 | 3770.63 | 0.65 | |
| e 0.72: | |||
| He I (64) | 3784.86 | 0.92 | |
| Si III (5) | 3791.41 | 0.93 | |
| H 10 | 3797.90 | 0.64 | |
| e 0.69: | |||
| He I (63) | 3805.74 | 0.90 | |
| Si III (5) | 3806.54 | 0.90: | |
| He I (22) | 3819.64 | e 1.00 | |
| 0.61 | |||
| He I (62) | 3833.55 | 0.83 | |
| H 9 | 3835.38 | 0.68 | |
| e 0.80: | |||
| He I (61) | 3838.10 | ||
| N II (30) | 3838.37 | ||
| N II (30) | 3842.18 | 0.96: | |
| N II (30) | 3847.41 | 0.98: | |
| Si II (1) | 3856.02 | e 1.13 | |
| Si II (1) | 3862.60 | e 1.10 | |
| He I (20) | 3867.50 | 0.84 | |
| He I (60) | 3871.79 | 0.81 | |
| C II (33) | 3876.2: | 0.90 | |
| O II (12) | 3882.20 | 0.94: | |
| He I (2) | 3888.65 | e 1.01 | |
| 0.66 | |||
| H 8 | 3889.05 | 0.70 | |
| O II (17) | 3911.96 | 0.94: | |
| C II (4) | 3918.98 | 0.84 | |
| O II (17) | 3919.29 | ||
| C II (4) | 3920.69 | 0.76 | |
| He I (58) | 3926.53 | 0.79 | |
| Ca II (1) | 3933.66 | 0.48 | |
| 0.30 | |||
| He I (57) | 3935.91 | 0.95 | |
| O II (6) | 3945.04 | 0.95 | |
| O II (6) | 3954.36 | 0.92 | |
| N II (6) | 3955.85 | 0.93: | |
| He I (5) | 3964.73 | 0.70 | |
| Ca II (1) | 3968.47 | 0.61: | |
| 0.45: | |||
| H | 3970.07 | 0.70: | |
| e 0.83: | |||
| O II (6) | 3973.26 | - | |
| O II (6 | 3982.71 | 0.92: | |
| N II (12) | 3995.00 | 0.80 | |
| He I (55) | 4009.27 | 0.73 | |
| Fe III (45) | 4022.35 | 0.98: | |
| He I (54) | 4023.97 | 0.96 | |
| Fe III (53) | 4025.07 | 0.93 | |
| He I (18) | 4026.23 | e 0.98 | |
| 0.62 | |||
| N II (39) | 4035.08 | 0.97 | |
| N II (39) | 4041.31 | 0.94 | |
| O II (10) | 4069.8: | 0.89 | |
| O II (10) | 4072.16 | 0.90 | |
| C II (36) | 4074.6: | 0.95: | |
| C II (36) | 4075.85 | 0.86 | |
| O II (10) | 4075.87 | ||
| O II (10) | 4078.86 | 0.96 | |
| O II (10) | 4083.91 | ||
| O II (10) | 4085.11 | 0.95: | |
| Si IV (1) | 4088.85 | 0.91 | |
| O II (48) | 4089.29 | ||
| O II (10) | 4092.94 | 0.95 | |
| H | 4101.74 | 0.78 | |
| e 0.98 | |||
| O II (20) | 4103.02 | ||
| O II (20) | 4104.9: | ||
| O II (20) | 4110.50 | 0.96: | |
| O II (21) | 4112.03 | 0.97 | |
| Si IV (1) | 4116.10 | 0.96 | |
| O II (20) | 4119.22 | 0.91 | |
| He I (16) | 4120.82 | 0.77 | |
| Si II (3) | 4128.07 | e 1.01: | |
| 0.88 | |||
| Si II (3) | 4130.89 | e 1.00: | |
| 0.91 | |||
| O II (19) | 4132.80 | 0.96: | |
| He I (53) | 4143.76 | e 1.00 | |
| 0.66 | |||
| O II (19) | 4153.30 | 0.89 | |
| He I (52) | 4168.97 | 0.91 | |
| N II (42) | 4176.16 | 0.97 | |
| O II (36) | 4185.46 | 0.96 | |
| O II (36) | 4189.80 | 0.92 | |
| N II (33) | 4227.74 | 0.96: | |
| CH+ | 4232.55 | 0.96 | |
| N II (48) | 4241.78 | 0.95 | |
| Fe II F21 | 4243.98 | e 1.05 | |
| O II (101) | 4253.8: | 0.91 | |
| C II (6) | 4267.14 | e 1.05 | |
| 0.77 | |||
| O II (67) | 4275.52 | 0.93 | |
| Fe II F21 | 4276.83 | e 1.03: | |
| S III (4) | 4284.89 | 0.97: | |
| Fe II F7 | 4287.40 | e 1.15 | |
| S II (49) | 4294.40 | 0.97: | |
| CH | 4300.32 | 0.96 | |
| O II (54) | 4303.83 | 0.95: | |
| C II (28) | 4313.10 | 0.97: | |
| O II (78) | 4313.43 | ||
| O II (2) | 4317.14 | 0.88 | |
| C II (28) | 4317.26 | ||
| O II (2) | 4319.63 | 0.83 | |
| O II (2) | 4325.76 | 0.97: | |
| C II (28) | 4325.9: | ||
| S III (4) | 4332.71 | 0.97 | |
| O II (2) | 4336.86 | 0.93: | |
| H | 4340.47 | e 1.00 | |
| 0.84 | |||
| e 1.32 | |||
| O II (2) | 4345.56 | 0.86 | |
| O II (16) | 4347.42 | 0.95: | |
| O II (2) | 4349.43 | 0.79 | |
| O II (2) | 4351.26 | 0.92: | |
| Fe II F7 | 4359.74 | e 1.10 | |
| S III (4) | 4361.48 | 0.97: | |
| O II (2) | 4366.89 | 0.89 | |
| O I (5) | 4368.25 | e 1.04 | |
| Fe III (122) | 4372.31 | 0.97: | |
| C II (45) | 4372.4: | ||
| C II (45) | 4374.27 | 0.96: | |
| Fe III (4) | 4382.51 | 0.97: | |
| He I (51) | 4387.93 | e 1.00: | |
| 0.61 | |||
| Fe III (4) | 4395.76 | e 1.03 | |
| 0.94 | |||
| O II (26) | 4395.95 | ||
| C II (40) | 4409.98 | 0.97 | |
| C II (39) | 4411.4: | 0.96: | |
| Fe II F7 | 4413.78 | e 1.07 | |
| O II (5) | 4414.91 | 0.84 | |
| Fe II F6 | 4416.27 | e 1.05 | |
| O II (5) | 4416.98 | 0.89 | |
| Fe III (4) | 4419.60 | e 1.04 | |
| 0.93 | |||
| Fe III (4) | 4430.95 | 0.96: | |
| N II (55) | 4432.74 | 0.97: | |
| He I (50) | 4437.55 | 0.87 | |
| N II (15) | 4447.03 | 0.95 | |
| O II (35) | 4448.21 | 0.98: | |
| Fe II F7 | 4452.11 | e 1.03 | |
| O II (5) | 4452.38 | 0.96 | |
| Fe II F6 | 4457.95 | e 1.03 | |
| He I (14) | 4471.52 | e 1.06 | |
| e 0.74 | |||
| 0.70 | |||
| Fe II F7 | 4474.91 | e 1.02: | |
| Al III (8) | 4479.93 | 0.97: | |
| Mg II (2) | 4481.22 | e 1.04 | |
| 0.76 | |||
| Al III (8) | 4512.56 | 0.98 | |
| Al III (8) | 4529.1: | 0.96: | |
| N II (59) | 4530.41 | 0.98: | |
| Si III (2) | 4552.62 | 0.75 | |
| Si III (2) | 4567.82 | 0.79 | |
| Si III (2) | 4574.76 | 0.88 | |
| O II (15) | 4590.97 | 0.90 | |
| O II (15) | 4596.17 | 0.92: | |
| N II (5) | 4601.48 | 0.94 | |
| O II (93) | 4602.11 | ||
| N II (5) | 4607.15 | 0.95: | |
| O II (93) | 4609.42 | 0.96: | |
| N II (5) | 4613.87 | 0.96: | |
| C II (50) | 4619.23 | 0.97: | |
| N II (5) | 4621.39 | 0.97: | |
| N II (5) | 4630.54 | 0.88 | |
| O II (1) | 4638.85 | 0.89 | |
| O II (1) | 4641.81 | 0.83 | |
| N II (5) | 4643.09 | 0.93 | |
| C III (1) | 4647.42 | 0.94 | |
| O II (1) | 4649.14 | 0.78 | |
| O II (1) | 4650.84 | 0.87 | |
| O II (1) | 4661.64 | 0.87 | |
| O II (1) | 4673.75 | 0.96 | |
| O II (1) | 4676.23 | 0.89 | |
| N II (62) | 4678.14 | 0.98: | |
| Si III (13) | 4683.02 | 0.99: | |
| Si III (13) | 4683.8 | ||
| O II (1) | 4696.36 | 0.98: | |
| O II (25) | 4699.2: | 0.94 | |
| O II (25) | 4705.36 | 0.92: | |
| O II (24) | 4710.01 | 0.97: | |
| He I (12) | 4713.18 | e 1.00: | |
| 0.78 | |||
| Si II | 4716.65 | 0.99: | |
| N II (20) | 4779.72 | 0.99: | |
| N II (20) | 4788.13 | 0.98: | |
| N II (20) | 4803.29 | 0.98: | |
| Ar II (6) | 4806.02 | 0.98: | |
| Si III (9) | 4813.33 | 0.96: | |
| Fe II F20 | 4814.55 | e 1.06 | |
| Si III (9) | 4819.72 | 0.96 | |
| Si III (9) | 4828.97 | 0.97 | |
| H | 4861.33 | 1.23 | |
| e 2.78 | |||
| O II (57) | 4871.52 | 0.98: | |
| Fe II F4 | 4889.63 | e 1.03 | |
| O II (28) | 4890.86 | 0.98: | |
| Fe II F20 | 4905.35 | e 1.01: | |
| O II (28) | 4906.83 | 0.96: | |
| S II (15) | 4917.21 | 0.98: | |
| He I (48) | 4921.93 | 0.63 | |
| S II (7) | 4924.12 | 0.93: | |
| O II (28) | 4924.53 | ||
| S II (7) | 4925.35 | 0.98: | |
| O II (33) | 4941.07 | 0.98 | |
| O II (33) | 4943.00 | 0.97 | |
| N II (24) | 4994.36 | 0.97 | |
| N II (19) | 5001.35: | 0.90 | |
| N II (4) | 5002.70 | 0.97: | |
| N II (19) | 5005.15 | 0.91 | |
| N II (24) | 5007.33 | 0.98 | |
| N II (4) | 5010.62 | 0.96 | |
| S II (15) | 5014.07 | 0.97: | |
| He I (4) | 5015.68 | e 1.14 | |
| 0.76 | |||
| N II (19) | 5025.66 | 0.99: | |
| S II (1) | 5027.22 | 0.98: | |
| S II (7) | 5032.45 | 0.99: | |
| Si II (5) | 5041.03 | e 1.05 | |
| N II (4) | 5045.10 | 0.93 | |
| He I (47) | 5047.74 | 0.83 | |
| Si II (5) | 5055.97 | e 1.12 | |
| Fe III (5) | 5073.90 | 0.96 | |
| Fe III (5) | 5086.72 | e 1.00: | |
| 0.97 | |||
| Fe III (5) | 5127.5: | e 1.04 | |
| 0.94 | |||
| C II (16) | 5133.1: | 0.92 | |
| C II (16) | 5139.17 | 0.98: | |
| C II (16) | 5143.49 | 0.96 | |
| C II (16) | 5145.16 | 0.92 | |
| Ar II (13) | 5145.31 | ||
| C II (16) | 5151.09 | 0.96 | |
| Fe III (5) | 5156.11 | e 1.04 | |
| 0.91 | |||
| Fe II F19 | 5158.78 | e 1.11 | |
| O II (32) | 5160.02 | 0.98: | |
| Fe III (5) | 5193.91 | e 1.01: | |
| 0.98 | |||
| N 1 F1 | 5197.90 | e 1.17 | |
| N 1 F1 | 5200.26 | e 1.09 | |
| O II (32) | 5206.65 | 0.99 | |
| S III | 5219.32 | 0.99: | |
| Fe II F19 | 5261.62 | e 1.04 | |
| Fe II F18 | 5273.35 | e 1.03: | |
| O I (26) | 5299.04 | e 1.04 | |
| Fe II F19 | 5376.47 | e 1.02: | |
| S II (6) | 5428.67 | 0.99: | |
| S II (6) | 5432.82 | 0.98: | |
| S II (6) | 5453.83 | ||
| N II (29) | 5454.22 | 0.92 | |
| 18.01.05 | |||
| N II (29) | 5495.67 | 0.97 | |
| S II (6) | 5606.15 | 0.98: | |
| S II (14) | 5639.97 | 0.93 | |
| S II (11) | 5640.33 | ||
| C II (15) | 5640.55 | ||
| S II (14) | 5647.03 | 0.97: | |
| S II (11) | 5659.99 | 0.99: | |
| C II (15) | 5662.47 | 0.97 | |
| N II (3) | 5666.63 | 0.90 | |
| N II (3) | 5676.02 | 0.90 | |
| N II (3) | 5679.56 | 0.84 | |
| N II (3) | 5686.21 | 0.95 | |
| Al III (2) | 5696.60 | 0.85 | |
| N II (3) | 5710.77 | 0.94: | |
| Al III (2) | 5722.73 | 0.90: | |
| Si III (4) | 5739.73 | 0.84 | |
| DIB | 5780.37 | 0.96 | |
| DIB | 5796.96 | 0.97: | |
| Fe III (114) | 5833.94 | 0.97: | |
| He I (11) | 5875.72 | 0.90 | |
| e 1.10 | |||
| Na I (1) | 5889.95 | 0.32 | |
| 0.39 | |||
| 0.60 | |||
| 0.40 | |||
| 0.05 | |||
| Na I (1) | 5895.92 | 0.49 | |
| 0.57 | |||
| 0.74 | |||
| 0.55 | |||
| 0.06 | |||
| C II (5) | 5891.59 | e 1.07 | |
| 0.96 | |||
| Si II (4) | 5957.56 | e 1.08 | |
| O I (23) | 5958.5: | e 1.05 | |
| Si II (4) | 5978.93 | e 1.18 | |
| Fe III (117) | 6032.59 | e 1.03: | |
| O I (22) | 6046.39: | e 1.12 | |
| Ne I (3) | 6074.34 | 0.98: | |
| C II (24) | 6095.29 | e 1.02: | |
| C II (24) | 6098.51 | e 1.02: | |
| Ne I (1) | 6143.06 | 0.97: | |
| DIB | 6195.96 | 0.96 | |
| O I F1 | 6300.30 | e 1.07: | |
| Si II (2) | 6347.10 | e 1.15 | |
| Si II (2) | 6371.36 | e 1.08 | |
| DIB | 6379.29 | 0.93: | |
| Ne I (1) | 6402.25 | 0.92: | |
| N II F1 | 6548.03 | e 1.13 | |
| H | 6562.81 | 2.06 | |
| e 5.90 | |||
| e 4.48: | |||
| C II (2) | 6578.05 | 0.70 | |
| C II (2) | 6582.88 | 0.70: | |
| N II F1 | 6583.45 | e 1.1: | |
| DIB | 6613.56 | 0.95 | |
| O II (4) | 6641.05 | 0.97 | |
| S II F2 | 6716.47 | 1.03: | |
| O II (4) | 6721.35 | 0.97: | |
| S II F2 | 6730.85 | 1.09 | |