Differences between CO- and calcium triplet-derived velocity dispersions in spiral galaxies: evidence for central star formation?
Abstract
We examine the stellar velocity dispersions () of a sample of 48 galaxies, 35 of which are spirals, from the Palomar nearby galaxy survey. It is known that for ultra-luminous infrared galaxies (ULIRGs) and merger remnants the derived from the near-infrared CO band-heads is smaller than that measured from optical lines, while no discrepancy between these measurements is found for early-type galaxies. No such studies are available for spiral galaxies – the subject of this paper. We used cross-dispersed spectroscopic data obtained with the Gemini Near-Infrared Spectrograph (GNIRS), with spectral coverage from 0.85 to 2.5 m, to obtain measurements from the 2.29 m CO band-heads (), and the 0.85 m calcium triplet (). For the spiral galaxies in the sample, we found that is smaller than , with a mean fractional difference of 14.3 %. The best fit to the data is given by . This “ discrepancy” may be related to the presence of warm dust, as suggested by a slight correlation between the discrepancy and the infrared luminosity. This is consistent with studies that have found no discrepancy in dust-poor early-type galaxies, and a much larger discrepancy in dusty merger remnants and ULIRGs. That is lower than may also indicate the presence of a dynamically cold stellar population component. This would agree with the spatial correspondence between low and young/intermediate-age stellar populations that has been observed in spatially-resolved spectroscopy of a handful of galaxies.
keywords:
galaxies: active – galaxies: stellar populations – infrared: galaxies – galaxies: kinematics1 Introduction
The empirical relationship between the stellar velocity dispersion () of the spheroidal component of galaxies and the mass of the super-massive black hole () at their center (e.g. Ferrarese & Merrit, 2000; Gebhardt et al., 2000) has been extensively used to estimate in active and inactive galaxies. More direct determinations of , through stellar kinematics within the black hole’s sphere of influence, or broad emission line measurements, are only feasible for a limited number of objects, making the relation a very useful alternative. Cosmological simulations suggest that the central super-massive black hole (SMBH) evolves together with the host galaxy and plays a fundamental role in its evolution (Di Matteo, Springel & Hernquist, 2005; Springel, Di Matteo & Hernquist, 2005; Bower et al., 2006; Nemmen et al., 2007), and this co-evolution may be the mechanism that leads to the relation. The intrinsic scatter in the relation (i.e., the range of found for a given ) therefore contains information about the processes of galaxy and black hole evolution (e.g. Gültekin et al., 2009). Besides the relation, stellar velocity dispersion measurements are also relevant for many other astrophysical applications, including the galaxy fundamental plane (e.g. Djorgovski & Davis, 1987; Dressler et al., 1987; Falcón-Barroso, Peletier & Balcells, 2002; Gebhardt et al., 2003; Bernardi et al., 2003; Valluri, Merrit & Emsellem, 2004), the metallicity- relation (e.g. Terlevich et al., 1981; Dressler, 1984a; Bender, Burstein & Faber, 1993), the ratio that is an important criterium to determine the dynamical state of early type galaxies (e.g. Cox et al., 2006; Cappellari et al., 2007; Naab et al., 2013), etc. For all of these reasons, understanding the factors affecting measurements is an important issue.
Measurements of in galaxies have traditionally been done at wavelengths 1 m, often using the “Mg b” line at 0.52 m, or the 0.85 m calcium triplet absorption (e.g. Ho et al., 2009). Measurements based on stellar absorption lines in the infrared (IR), on the other hand, can also probe regions that are obscured by dust at optical wavelengths, or different stellar populations from those revealed in the optical. For these reasons, several recent studies have compared values obtained from the fitting of stellar absorptions in the optical and in the near-IR spectral regions, generally using the CO absorption band heads in the H and K bands (Silge & Gebhardt, 2003; Rothberg & Fischer, 2010; Vanderbeke et al., 2011; Rothberg et al., 2013; Kang et al., 2013).
Silge & Gebhardt (2003) presented stellar velocity dispersions measured from the 2.29m CO band head in a sample composed of 18 lenticular (S0) and 7 elliptical galaxies. The resulting sigma values were compared with literature values derived primarily from fitting the Ca II lines near 4000 A, the Mgb lines near 5175 A, and the 8500Å Ca II triplet (hereafter CaT). The values were found to be up to 30% smaller than , with a median difference of 11%. However, this difference was observed only in the lenticular galaxies; in the elliptical galaxies, the optical and IR measurements were consistent. The authors speculate that the difference may be related to the presence and distribution of dust in the S0 objects: if the dust is mainly located in the stellar disk, optical measurements will be biased towards the less-obscured, dynamically hotter bulge component. 00footnotetext: We use to denote velocity dispersions derived from the 2.29 m CO bands; for those based on the CaT lines; and as a general term to include all measurements based on lines at 1 m.
Vanderbeke et al. (2011) measured in a sample of 19 Fornax cluster members, composed of roughly equal numbers of elliptical and lenticular galaxies. These measurements were compared with from Kuntschner (2000) and found to be consistent, with . The lack of a discernible difference between and in the lenticular galaxies does not agree with the findings of Silge & Gebhardt (2003). It is, however, consistent with a previous study of velocity dispersions in the Fornax cluster by Silva et al. (2008).
Optical and IR velocity dispersions were also compared by Kang et al. (2013). This work used the CO absorption bands around 1.6 m, rather than those near 2.3 m, to derive for 31 galaxies: 19 elliptical, 9 lenticular, and 3 spiral. No significant difference was found between and (based mainly on the CaT). This suggests that both sets of lines probe roughly the same stars, and provides no evidence for a dynamically cold, obscured population.
Rothberg & Fischer (2010) also compared and for a set of galaxies. This time, however, they studied 14 galaxy mergers, accompanied by a control sample of 23 elliptical galaxies. The measurements for the control sample were taken mostly from the literature, and and were found to be similar, in agreement with the studies above. On the other hand, large differences are found for the mergers. In particular, for luminous infrared galaxies (LIRGS, 6 objects in their sample) the derived in the optical is up to twice the value obtained for the near-IR. For the remaining 8 non-LIRG mergers, is slightly larger than . Even larger discrepancies have been found for single nucleus Ultra-Luminous Infrared Galaxies (ULIRGs), for which can be three times larger than (Rothberg et al., 2013). The discrepancies arise because , although conveniently insensitive to dust absorption, probes a luminous, young stellar disk, whereas gives information about an older stellar population that is more representative of the galaxy’s overall dynamical mass. CO-based measurements imply that ULIRGs cannot be the progenitors of giant elliptical galaxies, whereas CaT-based values are consistent with a range of final galaxy masses.
The above studies have compared optical and CO-based measurements for early-type (E and S0) galaxies, and for galaxy mergers and ULIRGs. Little information is available, though, for late-type (spiral) objects, so the range of morphological types in which the large differences between and occur is not yet known. We aim to rectify this situation by measuring and in a sample of 48 nearby galaxies: 35 spirals, 7 lenticulars, and 6 ellipticals. We do this using slit spectroscopy covering simultaneously the CaT and 2.29 m CO spectral regions. In Section 2, we describe the sample and the observational data, and in Section 3 we discuss the methods used to measure the stellar dispersion in the optical and in the near-IR. The results are presented in Section 4, while their implications are discussed in Section 5. The conclusions of the present paper are given in Section 6.
2 Observations and data reduction
The sample of galaxies used in this work comprises 48 objects selected from the Palomar spectroscopic survey of nearby galaxies (Ho, Filippenko & Sargent, 1995, 1997), covering a wide range of luminosity and nuclear activity type. Some properties of the sample are shown in Table 1, while full details of the overall program, sample, observations and data reduction are given in Mason et al. (submitted).
Briefly, the spectroscopic data were obtained in queue mode111Programs GN-2011B-Q-111, GN-2012A-Q-23, GN-2012B-Q-80, GN-2012B-Q-112, GN-2013A-Q-16. with the Gemini Near-Infrared Spectrograph (GNIRS) on the Gemini North telescope. The cross-dispersed mode was used with the 32 l/mm grating, providing simultaneous spectral coverage from approximately 0.85 to 2.5 m. We used the slit, generally oriented along the mean parallactic angle at the time of the observations to minimize differential refraction effects. The data were obtained between October 2011 and May 2013. Due to work done to address an issue with the 32 l/mm grating mount in 2012, the spectral resolution of the spectra obtained with the 03 slit after November 2012 differs from that achieved previously. The spectral resolution before November 2012 is 11.6 Å and 4.4 Å for the K-band CO band heads and the CaT regions, respectively, obtained from the full width at half maximum (FWHM) of the arc lamp calibration spectra. These values correspond to a resolution in velocity dispersion of 65 for both regions. After November 2012, the resulting spectral resolutions are 18.2 Å and 7.4 Å corresponding to 100 and 110 .
The data were reduced using standard procedures222 Described at www.gemini.edu/sciops/instruments/gnirs/data-format-and-reduction/reducing-xd-spectra.. To summarize, the raw frames are first cleaned of any electronic striping and cosmic ray-like features arising from particles in the camera lens coatings. The files are divided by a flat field and sky-subtracted using blank sky exposures made between the on-source observations, then rectified using pinhole images. Wavelength calibration is achieved using argon arc spectra, then a spectrum of each order is extracted, divided by a standard star to cancel telluric absorption lines, and roughly flux-calibrated using the telluric standard star spectrum. The individual orders are then combined to produce the final spectrum. The extraction aperture used for this work was 18 along the 03 slit, corresponding to a few tens to a few hundreds of parsecs at the distances of these galaxies.
3 Methods
In order to obtain the line-of-sight velocity distribution (LOSVD) we have used the penalized Pixel-Fitting (pPXF) method of Cappellari & Emsellem (2004) to fit the CO absorption band heads around 2.3 m in the K-band and the Ca ii8500,8544,8665 (the CaT) stellar absorptions in the Z band. The best fit of the galaxy spectrum is obtained by convolving template stellar spectra with the corresponding LOSVD, assumed to be well represented by Gauss-Hermite series. The pPXF method outputs the radial velocity, velocity dispersion () and higher order Gauss-Hermite moments ( and ), as well as the uncertainties for each parameter. The and moments measure deviations of the line of sight velocity distribution from a Gaussian curve: the parameter measures asymmetric deviations (e.g. wings) and the quantifies the peakiness of the profile, with and indicating narrower and broader profiles than Gaussian, respectively (van der Marel & Franx, 1993; Riffel, 2010).
The dominant source of error in the velocity dispersion is usually related to the choice of stellar template used to fit the galaxy spectrum (e.g. Barth, Ho & Sargent, 2002b; Riffel et al., 2008; Winge, Riffel & Storchi-Bergmann, 2009). This can be minimized by using a large stellar template library, instead of the spectrum of a single star. The pPXF allows the use of several stellar template spectra, and varies the weighting of each one to obtain the best match to the observed spectrum, minimizing issues arising from template mismatches. The set of templates must include stars that closely match the fitted galaxy spectrum (e.g. Silge & Gebhardt, 2003; Emsellem et al., 2004; Riffel et al., 2008). For the fitting of the CO absorptions, we used as template spectra those of the Gemini Near-IR Late-type stellar library (Winge, Riffel & Storchi-Bergmann, 2009), which contains spectra of 60 stars with spectral types ranging from F7 III to M5 III, observed in the K band at a spectral resolution of 3.2 Å (FWHM).
As template spectra for the CaT region, we used selected spectra of stars from the CaT stellar library of Cenarro et. al. (2001) with a spectral resolution of 1.5 Å (FWHM). This library contains spectra of 706 stars with all spectral types and is part of the Medium-resolution Isaac Newton Telescope library (MILES; Sánchez-Blázquez et al., 2006). In this work, we used only the spectra of stars with S/N ratio larger than 50 in the CaT region in order to avoid the selection of noisy spectra by the pPXF code. The final template library contains 190 spectra, including several spectral types. We also tested the NASA InfraRed Telescope Facility (IRTF) stellar spectral library (Cushing, Rayner, & Vacca, 2005; Rayner, Cushing, & Vacca, 2009) that presents spectra of late-type stars ranging from 0.8 to 5.5 m at a spectral resolving power of , similar to the spectral resolution used in this work. The comparison of the kinematic parameters obtained with the IRTF spectral library are similar to the ones obtained with the two libraries mentioned above. However, the standard deviation of the residuals (defined as the difference between the galaxy spectrum and the best fit model) and the uncertainties are much larger using the IRTF library. This may be related to the S/N ratio of the IRTF spectra, and/or their lower spectral resolution compared to the MILES library. We therefore decided to use the Gemini and MILES libraries for this work.
Since the spectral resolution of the template stellar spectra for both spectral regions is better than the resolution of our observations, we degraded the stellar templates to the same resolution as the spectra of the galaxies before running the pPXF to measure the LOSVD. In order to properly fit the continuum emission we allowed pPXF to fit multiplicative Legendre polynomials of order 1 to account for any slope introduced by dust/AGN emission. Since the order of the polynomials included is small, they do not introduce any bias in the derived stellar kinematics.
Although pPXF outputs the errors of the measurements, we also performed 100 iteration of Monte Carlo simulations where random noise was introduced to the galaxy spectrum, keeping constant the signal-to-noise ratio and the standard deviation of the 100 measurements for each galaxy. The errors obtained from the simulations are similar to the uncertainties that pPXF outputs.
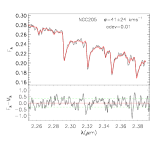
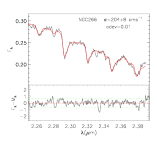
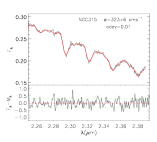
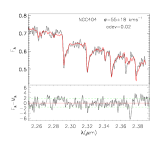
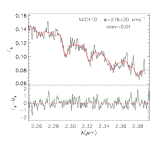
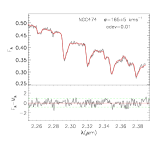
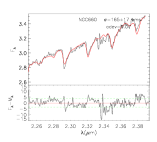
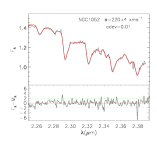
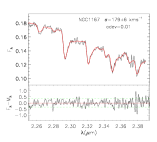
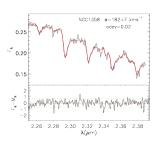
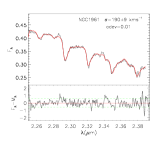
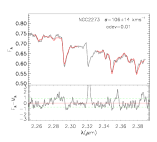
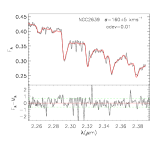
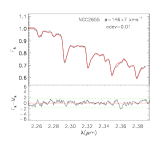
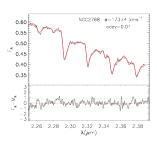
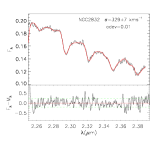
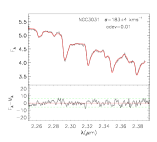
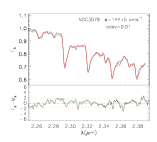
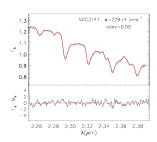
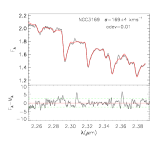
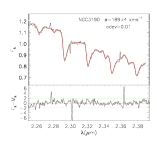
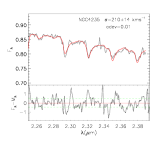
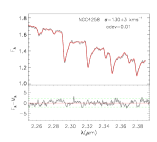
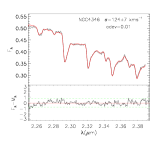
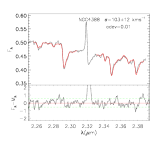
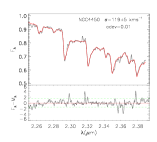
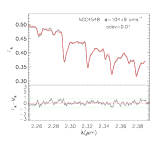
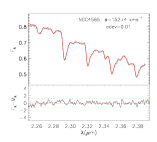
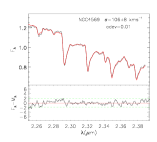
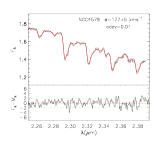
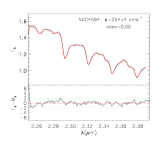
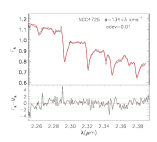
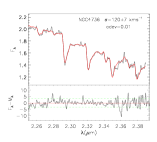
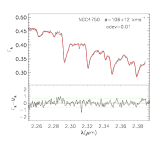
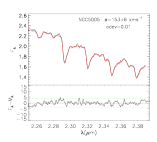
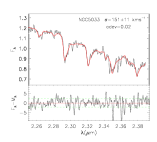
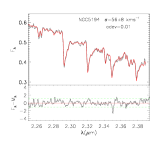
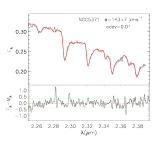
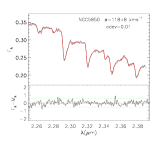
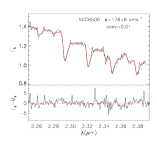
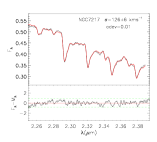
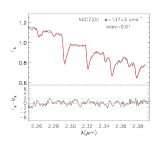
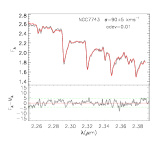
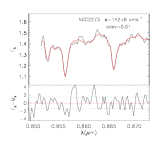
Figure 7 shows the fits of the galaxy spectra at the region of the CO band heads (2.25–2.41 m) for all the galaxies of our sample. The fits reproduce the observed spectra very well for all objects, with the residuals being smaller than 3 times the standard deviation of the continuum emission next to the CO absorptions. Two objects (NGC 2273 and NGC 4388) present strong [Caviii] 2.322 m line emission superimposed on the second 12CO absorption band head, so this band was excluded from the fitted region.
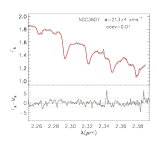
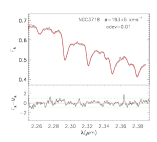
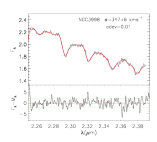
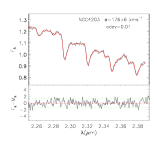
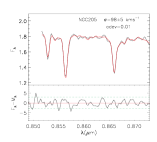
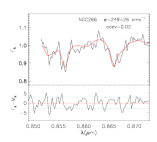
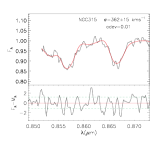
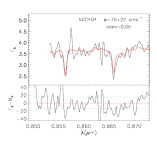
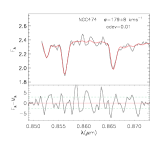
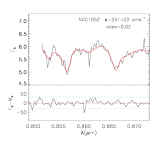
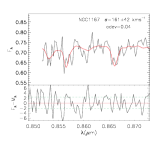
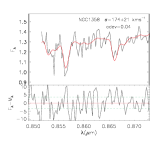
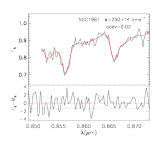
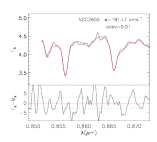
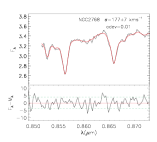
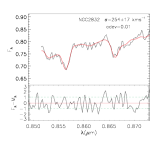
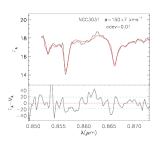
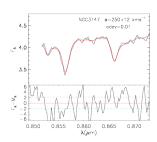
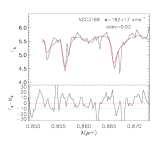
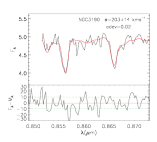
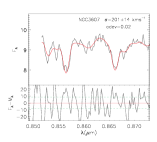
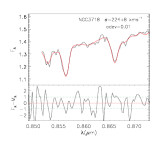
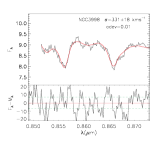
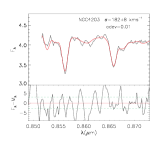
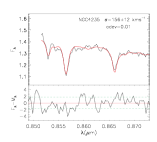
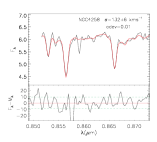
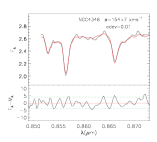
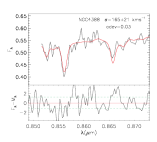
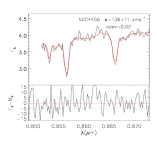
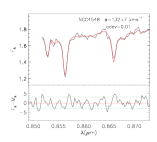
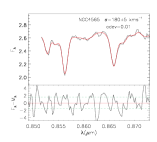
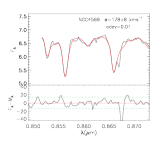
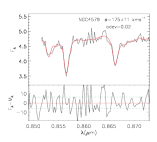
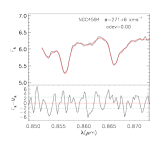
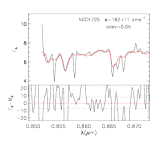
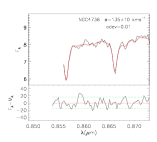
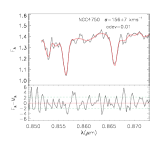
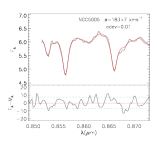
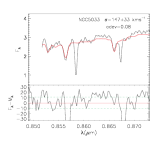
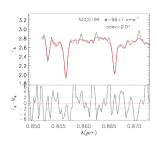
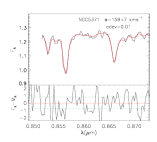
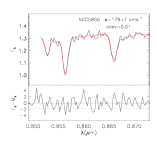
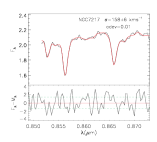
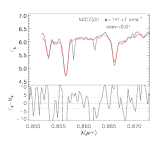
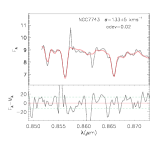
The fits for the CaT spectral region (8480–8730 Å) are shown in Figure 2. They also reproduce the observed spectra well, with the residuals again generally being smaller than 3 times the standard deviation of the continuum emission next to the CaT. However, for some objects the residuals are somewhat larger (e.g. NGC 5194, NGC 5371, NGC 7743, and NGC 7332 – see bottom panels of Fig. 2) due to the lower S/N ratio of those spectra in this region. This results in uncertainties of up to 25 in the resulting velocity dispersions.
For the CO spectral region, we find that is smaller than the spectral resolution of the spectra for 3 objects (NGC 205, NGC 404 and NGC 5194), while for the CaT region only the dwarf elliptical NGC 205 has smaller than the resolution. These values are marked by ∗ in Table 1 and should be considered highly uncertain. In particular, for the galaxies NGC 205 and NGC 404, Ho et al. (2009) measured values lower than our resolution, using higher-resolution data.
4 Results
The major difference and main advantage of the present work, compared to previous studies, is that we measure both and from the same spectra, observed in the same way, with the same aperture and using the same method, while previous studies used their own measurements and compared them with optical values from the literature. Resulting measurements of the stellar velocity dispersion and Gauss-Hermite moments for our sample are shown in Table 1.
| Object | Hubble Type | N. A. | (km/s) | (km/s) | Conf. | ||||
|---|---|---|---|---|---|---|---|---|---|
| NGC 205 | dE5 pec | – | 40.7 35.3∗ | 98.35.3∗ | 0.00 0.15 | 0.00 0.05 | 0.01 0.12 | -0.13 0.03 | b |
| NGC 266 | SB(rs)ab | L1.9 | 204.4 8.2 | 248.5 26.3 | 0.00 0.02 | 0.04 0.07 | 0.07 0.03 | 0.01 0.08 | a |
| NGC 315 | E+: | L1.9 | 322.9 5.5 | 362.0 15.0 | 0.02 0.02 | 0.03 0.04 | -0.08 0.02 | -0.20 0.03 | a |
| NGC 404 | SA(s)0-: | L2 | 55.0 18.4∗ | 74.5 22.5 | -0.02 0.13 | -0.02 0.19 | 0.03 0.20 | -0.03 0.16 | a |
| NGC 410 | E+: | T2 | 276.4 20.0 | – | -0.05 0.05 | – | -0.03 0.06 | – | a |
| NGC 474 | (R’)SA(s)0 | L2: | 164.8 5.4 | 178.7 7.5 | 0.03 0.02 | 0.06 0.04 | 0.06 0.02 | -0.05 0.04 | a |
| NGC 660 | SB(s)a pec | T2/H | 164.717.3 | – | -0.050.06 | – | 0.12 0.07 | – | b |
| NGC 1052 | E4 | L1.9 | 220.3 4.1 | 250.6 22.3 | -0.01 0.01 | -0.07 0.05 | 0.03 0.01 | 0.04 0.06 | a |
| NGC 1167 | SA0- | S2 | 179.0 6.2 | 160.6 41.7 | 0.01 0.02 | 0.03 0.06 | 0.00 0.03 | 0.00 0.21 | a |
| NGC 1358 | SAB(r)0/a | S2 | 182.3 6.8 | 174.3 21.2 | -0.03 0.03 | 0.08 0.10 | -0.03 0.03 | -0.09 0.09 | a |
| NGC 1961 | SAB(rs)c | L2 | 189.9 9.2 | 249.7 13.9 | 0.01 0.02 | 0.03 0.05 | 0.11 0.03 | -0.07 0.04 | b |
| NGC 2273∗∗ | SB(r)a: | S2 | 105.7 14.4 | 142.4 8.3 | -0.11 0.06 | 0.05 0.04 | 0.03 0.09 | 0.02 0.05 | b |
| NGC 2639 | (R)SA(r)a? | S1.9 | 160.4 5.2 | – | 0.02 0.02 | – | -0.04 0.03 | – | a |
| NGC 2655 | SAB(s)0/a | S2 | 145.8 6.5 | 181.1 7.1 | 0.02 0.02 | 0.03 0.03 | 0.08 0.03 | 0.01 0.03 | b |
| NGC 2768 | E6: | L2 | 172.8 3.8 | 177.3 6.7 | 0.01 0.01 | -0.05 0.03 | 0.02 0.02 | 0.04 0.03 | a |
| NGC 2832 | E+2: | L2: | 328.7 7.1 | 254.2 16.9 | 0.06 0.02 | 0.02 0.05 | -0.01 0.02 | -0.03 0.05 | b |
| NGC 3031 | SA(s)ab | S1.5 | 182.5 3.8 | 149.8 7.1 | 0.00 0.01 | 0.04 0.03 | 0.08 0.01 | 0.03 0.04 | a |
| NGC 3079 | SB(s)c spin | S2 | 143.6 4.7 | – | -0.010.02 | – | 0.050.02 | – | a |
| NGC 3147 | SA(rs)bc | S2 | 229.1 4.2 | 250.2 11.7 | 0.00 0.01 | 0.02 0.03 | 0.06 0.01 | 0.03 0.03 | b |
| NGC 3169 | SA(s)a pec | L2 | 169.4 4.0 | 191.6 17.5 | 0.01 0.02 | 0.13 0.04 | 0.01 0.02 | 0.04 0.06 | a |
| NGC 3190 | SA(s)a pec spin | L2 | 189.2 3.9 | 202.9 13.6 | 0.02 0.01 | 0.00 0.06 | 0.06 0.01 | -0.07 0.05 | a |
| NGC 3607 | SA(s)0: | L2 | 213.5 3.6 | 201.0 13.9 | 0.01 0.01 | 0.00 0.07 | 0.06 0.01 | -0.09 0.06 | a |
| NGC 3718 | SB(s)a pec | L1.9 | 192.7 5.1 | 224.0 8.4 | -0.03 0.01 | -0.04 0.03 | 0.08 0.02 | -0.01 0.03 | b |
| NGC 3998 | SA(s)ab | L1.9 | 346.9 5.9 | 331.5 17.7 | 0.02 0.01 | -0.03 0.04 | -0.02 0.02 | 0.03 0.04 | b |
| NGC 4203 | SAB0-: | L1.9 | 176.4 5.9 | 182.2 8.4 | 0.00 0.02 | -0.02 0.04 | 0.03 0.02 | -0.05 0.04 | b |
| NGC 4235 | SA(s)a spin | S1.2 | 209.6 13.5 | 156.4 12.3 | -0.10 0.03 | 0.01 0.05 | 0.120.03 | 0.06 0.05 | b |
| NGC 4258 | SAB(s)b | S1.9 | 129.6 3.2 | 132.4 6.4 | -0.02 0.01 | -0.02 0.04 | 0.02 0.02 | -0.05 0.04 | a |
| NGC 4346 | SA0 spin | L2: | 124.1 7.4 | 154.4 6.5 | 0.00 0.02 | 0.06 0.02 | 0.07 0.04 | 0.00 0.03 | b |
| NGC 4388∗∗ | SA(s)b: spin | S1.9 | 103.3 12.4 | 165.3 20.8 | -0.01 0.05 | 0.01 0.09 | 0.01 0.08 | 0.01 0.09 | b |
| NGC 4450 | SA(s)ab | L1.9 | 118.8 4.6 | 136.4 10.9 | 0.00 0.02 | -0.07 0.05 | 0.08 0.03 | -0.05 0.07 | a |
| NGC 4548 | SB(rs)b | L2 | 104.0 8.8 | 131.6 6.8 | 0.00 0.03 | 0.00 0.04 | 0.04 0.06 | 0.02 0.04 | b |
| NGC 4565 | SA(s)b? spin | S1.9 | 151.6 4.0 | 180.0 5.0 | 0.03 0.01 | -0.01 0.02 | 0.02 0.02 | -0.04 0.02 | b |
| NGC 4569 | SAB(rs)ab | T2 | 106.4 7.6 | 178.27.8 | -0.05 0.03 | 0.080.02 | 0.03 0.05 | 0.050.03 | b |
| NGC 4579 | SAB(rs)b | S1.9/L1.9 | 177.5 5.3 | 174.9 10.8 | 0.05 0.02 | 0.03 0.04 | 0.06 0.02 | 0.01 0.05 | a |
| NGC 4594 | SA(s)a spin | L2 | 253.9 3.6 | 271.4 6.3 | 0.00 0.01 | 0.03 0.02 | 0.06 0.01 | -0.01 0.02 | b |
| NGC 4725 | SAB(r)ab pec | S2: | 133.5 3.3 | 162.4 11.3 | -0.05 0.02 | 0.27 0.08 | -0.02 0.02 | -0.27 0.07 | a |
| NGC 4736 | (R)SA(r)ab | L2 | 120.2 6.9 | 135.4 10.0 | 0.13 0.04 | 0.01 0.05 | -0.05 0.04 | 0.01 0.06 | b |
| NGC 4750 | (R)SA(rs)ab | L1.9 | 105.9 11.5 | 155.9 7.3 | -0.01 0.03 | -0.05 0.04 | 0.08 0.07 | -0.08 0.04 | b |
| NGC 5005 | SAB(rs)bc | L1.9 | 153.3 6.4 | 183.1 7.5 | -0.01 0.02 | -0.01 0.02 | 0.08 0.03 | 0.06 0.03 | b |
| NGC 5033 | SA(s)c | S1.5 | 151.0 10.7 | 147.0 32.7 | -0.12 0.04 | 0.04 0.16 | 0.15 0.05 | -0.01 0.22 | a |
| NGC 5194 | SA(s)bc pec | S2 | 56.3 8.0∗ | 91.8 7.0 | -0.02 0.0 | -0.04 0.05 | 0.03 0.09 | -0.01 0.05 | a |
| NGC 5371 | SAB(rs)bc | L2 | 142.8 6.6 | 159.3 6.8 | -0.01 0.02 | 0.01 0.03 | 0.04 0.03 | -0.03 0.04 | b |
| NGC 5850 | SB(r)b | L2 | 118.0 8.5 | 179.3 7.2 | 0.05 0.03 | 0.02 0.03 | 0.07 0.05 | -0.05 0.03 | b |
| NGC 6500 | SAab: | L2 | 177.5 5.6 | – | 0.00 0.02 | – | 0.04 0.02 | – | a |
| NGC 7217 | (R)SA(r)ab | L2 | 125.8 5.9 | 157.6 5.6 | -0.01 0.02 | 0.04 0.02 | 0.03 0.03 | 0.00 0.03 | b |
| NGC 7331 | SA(s)b | T2 | 137.3 3.2 | 141.3 6.6 | 0.03 0.01 | -0.03 0.04 | 0.01 0.02 | -0.05 0.04 | a |
| NGC 7743 | (R)SB(s)0+ | S2 | 90.2 4.8 | 133.4 4.8 | 0.04 0.02 | -0.13 0.04 | 0.05 0.04 | -0.20 0.03 | a |
| ∗ The measured is smaller than the instrumental . | |||||||||
| ∗∗ The second CO band was excluded from the fitting due to contamination by the [Caviii] 2.322m emission. | |||||||||
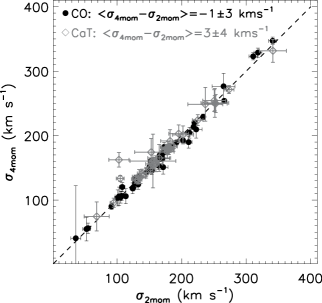
In Figure 1 we show vs , excluding objects for which good fits could not be obtained for one of the spectral regions (marked by dashes in the Table 1). We find that tends to be higher than , with an average difference of (for all morphological types). The error in this value was obtained using Monte Carlo simulations and the bootstrap technique (e.g. Beers, Flynn & Gebhardt, 1990) as follows. First, 10000 Monte Carlo iterations were run to determine the effect to the uncertainties in to the mean sigma difference (). At each run, ramdom values for and constrained to be within their measured uncertainties were generated and then the was calculated. The standard deviation of the 10000 simulations of () represents the effects of the uncertainties in to the . Then, to evaluate the completeness of the sample and its effect to the mean difference, we run a bootstrap with 10000 realizations in which for each iteration the is calculated for a sample selected randomly amoung the galaxies of our sample. The standard deviation of the simulated () represents the intrinsic scatter of our sample. Finally, the uncertainty is obtained by the sum of and in quadrature, as . This value is similar to the standard error. If we exclude also the 3 objects with values smaller than the instrumental broadening, we find .
We also performed a Kolmogorov-Smirnov test to determine if and differ significantly. We found a statistic significance for our sample, where ranges from 0 to 1 and small values mean that the two data sets are significantly different. The value of obtained for our sample indicates that there is a reasonable probability (80 %) that and present discrepant values.
The comparisons of higher order Gauss-Hermite moments and obtained from the fitting of the CaT with those of the CO band heads show an average differences of and is . For both the and parameters there is no correlation between the values found from the fitting of the CaT and the ones from the CO band heads. The values found for and are small for most of the objects in our sample, indicating that the LOSVD of the stars for the nucleus of these galaxies is reasonably well reproduced by a Gaussian velocity distribution.

5 Analysis of the results
To understand the observed difference between and in the galaxies, we performed several tests to identify possible systematic effects in the data or introduced by the fitting procedure.
As discussed in Sec. 3, we were very careful in the estimation of the instrumental broadening, taking into account the facts that (i) our observations present distinct spectral resolutions depending on the date of the observations, and (ii) the spectral resolution for observations performed after November 2012 differs between the CaT and CO regions (§2). The uncertainty (rms) in the FWHM of the arc lamp lines is smaller than 10 for both spectral regions and in order to “correct” the offset from the one-to-one relation observed in in Fig. 1 the FWHM in the CaT region would have to be underestimated by more than 30 . Thus, uncertainties in the instrumental broadening cannot account for the observed differences in CaT- and CO-based values in our sample.
As noted in §3, template mismatch could also introduce systematic uncertainties in the measurements (e.g. Silge & Gebhardt, 2003; Riffel et al., 2008). Usually fewer than 10 template spectra are needed by pPXF to successfully reproduce the CO absorption band heads and the CaT. Although the libraries used here are large and contain spectra of stars with several spectral types, the fits to both spectral regions are dominated by giant and super-giant stars, with a slightly larger contribution from super-giants in the K band. These are the spectral types that are expected to dominate the emission in the near-IR, suggesting that pPXF is selecting the appropriate stars with which to fit the spectra. For most galaxies M-stars are the dominant contributor to the fits in the K-band, while K-stars dominate in the region of the CaT. The difference between the intrinsic widths of the absorption lines in these stars is , which is negligible compared to the overall difference between and in the sample. In Appendix B we show the stellar templates used to fit the spectrum of each galaxy. Additionally, there is no difference in the values of the fits between early and late-type galaxies, suggesting that there is no bias in the choice of template for each type of galaxy.
As several galaxies of our sample have a Seyfert nucleus, hot dust emission may play an important role in the K-band continuum. The CO band-heads can be “diluted” by this emission, which might introduce an uncertainty in the measurements of (e.g. Ivanov et al., 2000; Riffel, Rodríguez-Ardila & Pastoriza, 2006; Kotilainen et al., 2012). To test whether the pPXF accounts correctly for variations of the continuum shape, we have simulated contributions of Planck functions with temperatures ranging from 700 to 2000 K to the continuum emission at the K-band. No significant difference in was found when including dust emission ranging from 1% to 70% of the total K-band emission. Furthermore, for the objects in which we could measure the from the H-band CO lines (where the contribution from AGN-heated dust is smaller; Origlia, Moorwood & Oliva, 1993), it agrees to within 10% with that measured from the K-band and no systematic difference is found between H and K band measurements. Thus, we conclude that the hot dust emission plays a negligible role in the measurements.
In galaxies with low values of , the fitting of higher order Gauss-Hermite moments can introduce uncertainties in the measurements (see the bias parameter of the pPXF program; Cappellari & Emsellem, 2004). To test this, we fitted the spectra of the galaxies assuming that the LOSVD is well described by a Gaussian, by fitting only the first 2 moments. In Fig. 2 we present the comparison of values obtained from the fitting of 4 moments with those obtained from the fitting of 2 moments. This figure shows that the resulting for both the CO and CaT spectral regions are very similar to those obtained when allowing the pPXF to include the and parameters, suggesting that the inclusion of these parameters does not affect significantly the measurements for our sample.
Finally, we compare our measurements with the optical values of Ho et al. (2009) for the same galaxies. Ho et al. (2009) used two spectral ranges to measure : a blue region, from 4200 to 5000 Å that includes several Fe lines, and a red region, covering the range 6450–6550 Å where Ca+Fe lines are present. They found that both values are in good agreement. In Fig. 3 we show our vs. the values presented in Ho et al. (2009). This comparison shows that 50% of the objects have differences smaller than 10% and for about 90% of the objects the differences are smaller than 25%, indicating that our measurements are in agreement with those from Ho et al. (2009). Differences between the measurements may be due to the larger aperture (2″ 4″) used by Ho et al. (2009), as well as differences in the S/N ratio of the spectra and the exact measurement procedures used.

We therefore conclude that our measurements are robust, and that the observed difference between and is not due to measurement error.
6 Discussion
We have found a systematic offset between and in the galaxies in our sample, which are primarily spirals. In order to further investigate the -discrepancy in late-type galaxies and compare the results with the available studies of other galaxy types, we compiled values for the and for optical measurements (most of them obtained from the CaT region) from the literature for distinct classes of objects. Table 2 presents the resulting and values for elliptical, lenticular and spiral galaxies and merger remnants. Since there is good agreement between the values obtained from CaT and those from the fitting of other optical lines (e.g. Barth, Ho & Sargent, 2002a, b) and as not all the optical values from the literature were obtained from the CaT region, we will use the nomenclature “optical” velocity dispersion () to refer to measurements of obtained from the CaT or other optical lines.
| Object | () | () | Ref. | Object | () | () | Ref. |
| ELLIPTICAL GALAXIES | LENTICULAR GALAXIES | ||||||
| NGC 221 | 718 | 754 | [1] | NGC 1023 | 15211 | 20510 | [1] |
| 702 | 753 | [2] | 2175 | 20510 | [2] | ||
| 608 | 692 | [4] | NGC 1161 | 27419 | 29717 | [1] | |
| NGC 315 | 32159 | 31016 | [1] | NGC 1375 | 644 | 5610 | [3] |
| 32459 | 35116 | [4] | NGC 1380 | 19017 | 21911 | [3] | |
| NGC 821 | 19517 | 20910 | [1] | NGC 1380A | 609 | 559 | [3] |
| 2085 | 20910 | [2] | NGC 1381 | 1556 | 1538 | [3] | |
| 18817 | 19720 | [4] | NGC 1400 | 21212 | 26426 | [1] | |
| NGC 1052 | 21120 | 1964 | [4] | NGC 2110 | 22449 | 22025 | [1] |
| NGC 1316 | 21220 | 2439 | [4] | NGC 2293 | 25544 | 25413 | [1] |
| NGC 1336 | 1198 | 965 | [3] | NGC 2380 | 16431 | 1899 | [1] |
| NGC 1339 | 1829 | 1588 | [3] | NGC 2681 | 829 | 11122 | [1] |
| NGC 1344 | 15820 | 1667 | [4] | NGC 2768 | 23551 | 19828 | [1] |
| NGC 1351 | 1537 | 1578 | [3] | NGC 2787 | 1538 | 21012 | [1] |
| NGC 1373 | 805 | 754 | [3] | 1863 | 1899 | [2] | |
| NGC 1374 | 20710 | 1859 | [3] | NGC 3115 | 27212 | 23011 | [2] |
| 18120 | 1808 | [4] | NGC 3245 | 2067 | 20510 | [2] | |
| NGC 1379 | 1307 | 1307 | [3] | NGC 3384 | 1513 | 1437 | [2] |
| 12620 | 1275 | [4] | NGC 3998 | 20516 | 29715 | [1] | |
| NGC 1399 | 40633 | 37519 | [3] | NGC 4150 | 11318 | 13210 | [1] |
| 33620 | 32515 | [4] | NGC 4342 | 2245 | 22511 | [2] | |
| NGC 1404 | 24722 | 26013 | [3] | NGC 4564 | 1757 | 1628 | [2] |
| 20420 | 23010 | [4] | NGC 4596 | 1393 | 1366 | [2] | |
| NGC 1407 | 29740 | 28313 | [4] | NGC 5195 | 956 | 17530 | [1] |
| 30640 | 28540 | [1] | NGC 5866 | 18614 | 1397 | [1] | |
| NGC 1419 | 1255 | 1176 | [3] | NGC 6548 | 22547 | 30723 | [1] |
| 11620 | 1106 | [4] | NGC 6703 | 14642 | 1869 | [1] | |
| NGC 1427 | 15518 | 1759 | [3] | NGC 7332 | 14813 | 13010 | [1] |
| 17420 | 1728 | [4] | NGC 7457 | 632 | 673 | [2] | |
| NGC 2778 | 1614 | 1758 | [2] | NGC 7743 | 6612 | 8320 | [1] |
| NGC 2974 | 27219 | 26213 | [1] | IC 1963 | 496 | 5810 | [3] |
| 26219 | 25512 | [4] | ESO 358-G06 | 5525 | 5811 | [3] | |
| NGC 3377 | 14420 | 1457 | [1] | ESO 358-G59 | 7020 | 549 | [3] |
| 1474 | 1457 | [2] | SPIRAL GALAXIES | ||||
| 13420 | 1354 | [4] | NGC 1068 | 1293 | 1517 | [2] | |
| NGC 3379 | 23520 | 1852 | [4] | NGC 3031 | 1573 | 1437 | [2] |
| NGC 3607 | 2108 | 22911 | [2] | NGC 4258 | 1112 | 11510 | [2] |
| NGC 3608 | 1874 | 1829 | [2] | MERGER REMNANTS/ULIRGS | |||
| NGC 4261 | 2866 | 31515 | [2] | NGC 1614 | 1333 | 2193 | [4] |
| NGC 4291 | 2487 | 24212 | [2] | NGC 2418 | 2457 | 2823 | [4] |
| NGC 4365 | 26220 | 2403 | [4] | NGC 2623 | 1524 | 1743 | [4] |
| NGC 4374 | 2908 | 29614 | [2] | NGC 2914 | 1796 | 1782 | [4] |
| NGC 4459 | 1646 | 1678 | [2] | NGC 3256 | 11120 | 2394 | [4] |
| NGC 4472 | 29120 | 2693 | [4] | NGC 4194 | 9825 | 1032 | [4] |
| NGC 4473 | 1863 | 1909 | [2] | NGC 5018 | 2437 | 2222 | [4] |
| NGC 4486 | 31020 | 36137 | [4] | NGC 7252 | 11919 | 1603 | [4] |
| 33111 | 37518 | [2] | Arp 193 | 1435 | 2294 | [4] | |
| NGC 4649 | 32711 | 38519 | [2] | IC 5298 | 15028 | 1874 | [4] |
| NGC 4697 | 1724 | 1778 | [2] | AM 0612-373 | 2409 | 2869 | [4] |
| NGC 4742 | 1043 | 905 | [2] | AM 1419-263 | 2626 | 2583 | [4] |
| NGC 5128 | 19013 | 1456 | [4] | AM 2038-382 | 2074 | 2565 | [4] |
| NGC 5812 | 2306 | 2482 | [4] | AM 2055-425 | 13715 | 2077 | [4] |
| NGC 5845 | 2374 | 23411 | [2] | IRAS 02021-2103 | 14321 | 2098 | [5] |
| NGC 6251 | 2908 | 29014 | [2] | IRAS 05189-2524 | 13116 | 2657 | [5] |
| NGC 7052 | 32713 | 26613 | [2] | IRAS 12540-5708 | 11710 | 3469 | [5] |
| NGC 7619 | 24647 | 29615 | [1] | IRAS 17208-0014 | 22315 | 2615 | [5] |
| 24647 | 29611 | [4] | IRAS 23365-3604 | 14315 | 2216 | [5] | |
| NGC 7743 | 6612 | 8320 | [1] | ||||
| NGC 7626 | 31320 | 26510 | [4] | ||||
| IC 2006 | 12510 | 1367 | [3] | ||||
| [1] - Silge & Gebhardt (2003); [2] - Kang et al. (2013); [3] - Vanderbeke et al. (2011) | |||||||
| [4] - Rothberg & Fischer (2010), [5] - Rothberg et al. (2013) | |||||||


.
In order to investigate the relation between discrepancy and morphological classification, we plotted in Figure 4 vs. for distinct classes of objects. The largest difference is observed for the merger remnants and ULIRGs, for which no correlation is found between and and the mean difference is . Elliptical galaxies follow the one-to-one relation and no discrepancy between optical and near-IR measurements is found. The mean difference is . For lenticulars, the mean difference is and it can be seen from the figure that most points are distributed around the one-to-one relation. The best linear fit for lenticular galaxies is given by
| (1) |
shown as a dashed line in the bottom-left panel of Fig. 4.
For spiral galaxies we found a mean difference of . Excluding NGC 5194, which presents a sigma value smaller than the spectral resolution of the data, we find the same relation, with . Most objects have smaller than 200 and for these objects is clearly smaller than .
The best linear equation for spiral galaxies is
| (2) |
where we excluded from the fit the galaxy NGC 5194 (identified in Fig. 4). The main cause of uncertainty in Eq. 2 is the small range of probed by the observations. Further observations are needed to cover the high region (220 ), and higher spectral resolution observations of objects with 100 , in order to improve the calibration of the equation above.
We therefore observe that and become both more similar and more correlated in early-type galaxies compared with spirals and ULIRGs/merger remnants.
6.1 What is the origin of the sigma discrepancy for late-type galaxies?
As discussed above and in §1, the discrepancy between the stellar velocity dispersion obtained from optical bands and that obtained from the near-IR CO absorption band heads is larger for mergers of galaxies and ULIRGs than for early-type galaxies. Rothberg & Fischer (2010) found a correlation between the infrared luminosity () and for merger remnants, while no correlation is found for elliptical galaxies. Rothberg et al. (2013) showed that the correlation found for merger remnants extends to ULIRGs, suggesting that dust might play an important role in the values for this kind of object.
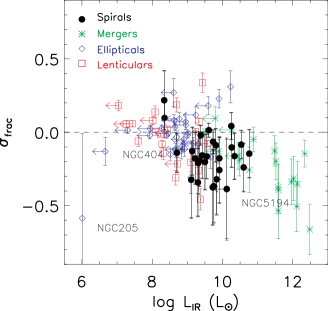
Figure 5 shows a plot of vs. log for the galaxies with available infrared luminosities (from Ho, Filippenko & Sargent (1997), Rothberg et al. (2013) and Rothberg & Fischer (2010)). The values of were estimated using their infrared fluxes from Ho, Filippenko & Sargent (1997), who defined it as W m2, and being the flux densities at 60 and 100 m, respectively. Although data with higher angular resolution and wider wavelength coverage are now available from Herschel and Spitzer Telescopes, we use the IRAS fluxes since they are available for most of our objects, while Herschel and Spitzer data are still not available for most of them of them (e.g. Marleau et al., 2006; Sauvage et al., 2013; De Looze et al., 2012; Ciesla et al., 2012; Auld et al., ). Figure 5 shows that galaxies with higher also have higher negative values of , and that the spiral galaxies fill the gap between early-type objects and merger remnants. This smooth trend suggests that dust might play some role in the observed discrepancy, as more warm dust is expected in spiral galaxies than in elliptical galaxies, and less than in merger remnants and ULIRGs.
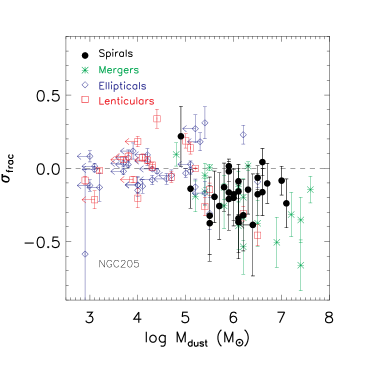
Following Rothberg & Fischer (2010) we estimate the mass of dust by
| (3) |
where and are the IRAS flux densities at 60 and 100m in Jy, respectively, and D is the distance to the galaxy in Mpc (see also Hildebrand, 1983; Thuan & Sauvage, 1992). Rothberg & Fischer (2010) found that correlates with Mdust for merger remnants, while no correlation is found for elliptical galaxies. Figure 6 shows the plot of vs. Mdust for the galaxies studied here. A similar trend to that seen in Fig. 5 is observed in this plot, suggesting that dust plays a role in the observed -discrepancy for spirals and merger remnants.
Dust may be relevant to the -discrepancy in two ways. First, as extinction is lower in the K band, the measurements could probe a dynamically cold, disk-like component that is more obscured than the dynamically hot bulge stars. Indeed, near-IR studies of nearby galaxies show that the reddening obtained from near-IR lines is larger than that obtained from optical lines, indicating that the near-IR samples an obscuring column larger than the optical spectral region (e.g. Moorwood & Oliva, 1988; Heisler & De Robertis, 1999; Martins et al., 2013a). Assuming a standard Galactic extinction curve (Weingartner & Draine, 2001; Draine, 2003), the extinction at 0.85 m (CaT) is about a factor of 5 larger than that at 2.3 m (CO), and the extinction at 0.52 m (Mgb) is about a factor of 2 greater again. If the difference between and is due to extinction, we may also expect a difference between and . However, Barth, Ho & Sargent (2002a) compared and and did not find any systematic difference between them.
Secondly, warm ( K), FIR-emitting dust may be associated with star formation in these galaxies. Indeed, the emission of the warm dust is directly correlated with the star formation rate, as it is heated by young stars (Kennicutt, 1998; Kennicutt & Evans, 2012).
Young stars form in disks, and in the absence of major perturbations generally remain dynamically cold. Indications of young stars in disks have been found in recent spatially resolved spectroscopy of galaxy nuclei with the Near-IR IFU Spectrograph (NIFS) on Gemini North. Riffel et al. (2010, 2011) and Storchi-Bergmann et al. (2012) carried out stellar population synthesis and found a spatial relation between low and the young/intermediate age stellar population, confirming that is affected by the presence of young/intermediate age stars. The presence of a young stellar population has also been proposed as an explanation of the -drop observed in some galaxies (e.g. Emsellem et al., 2001; Márquez et al., 2003). However, the comparison of our results with spatially resolved measurements should be taken with caution. While the NIFS data resolve a dynamically cold structure, our single-aperture measurements probe the second moment of the LOSVD, which does not necessarily imply a direct link between the two sets of results. New spatially resolved measurements of both the CaT and CO lines would show whether the effect we are observing here is related to the low- regions observed in the works cited above.
If the difference between and is due to the presence of a young stellar population in the disk of the galaxies, young stars must contribute more to the CO absorption features than do older stars, and the effect of this population on the measured from the CaT and optical lines must be negligible. The connection between the CO and CaT bands and the age of the stellar population is not straightforward, though. For example, the CO bands are relatively strong in both young/intermediate-age stars (AGB/TP-AGB stars) and old ones (M stars), while hotter, younger stars produce strong CaT bands along with weak CO features (e.g. Maraston, 2005; Riffel et al., 2007). On the other hand, previous work has shown that is not very sensitive to the stellar population (Barth, Ho & Sargent, 2002b, a). Full stellar population synthesis would help to resolve these issues, although different models currently make very different predictions for the NIR spectral region (e.g. Bruzual & Charlot, 2003; Maraston, 2005).
6.2 Implications for the relationship
As discussed above, the discrepancy observed in our sample of mostly late-type galaxies does not appear in previous studies of early-type galaxies. We can use the measured values to evaluate the impact of the discrepancy on determinations of the mass of the central SMBH using the relationship. Several studies have aimed at properly calibrating the relation for distinct classes of objects. Xiao et al. (2011) investigated the relation using a sample of 93 late-type galaxies with a Seyfert 1 nucleus. They found no difference in the slope for subsamples of barred and unbarred galaxies, but they found a small offset in the relation between low- and high-inclination disk galaxies, with the latter having a larger value for a given black hole mass. For a review of calibrations of the relation, see Kormendy & Ho (2013).
Actually, Kormendy, Bender & Cornell (2011) show that the physically relevant parameter in black hole correlations with host galaxy type is not early-type vs. late-type objects, but rather classical bulges versus pseudo bulges. The latter is defined as the buildup of dense central components that look like classical merger-built bulges but that were in fact formed slowly by disks out of disk material (Kormendy & Kennicutt, 2004).
Since the aim of the present paper is to evaluate the impact of the use of CO-based measurements of the stellar velocity dispersion on the derived mass of the super-massive black hole, and not to calibrate the relationship, we use the same calibration for all objects of our sample, given by (Kormendy & Ho, 2013) as:
| (4) |
We estimated the mass of the SMBH for all spiral galaxies of our sample using and in the equation above. The mean logarithmic difference is , which may be taken as a systematic error in the relation when using CO-based estimates of the stellar velocity dispersion.
7 Conclusions
We have used 0.85 – 2.5 m spectroscopy of a sample of 48 galaxies (35 spirals, 7 lenticulars and 6 ellipticals) obtained with the Gemini Near-Infrared Spectrograph (GNIRS) on Gemini North telescope to measure the stellar kinematics by fitting the K-band CO absorption band heads and the CaT at 8550 Å. This work is aimed at determining whether the difference in and (the “ discrepancy”) reported for ULIRGs and merger remnants persists in the hitherto unexplored regime of late-type galaxies. Our main conclusions are:
-
•
The velocity dispersion obtained from the 2.29 m CO band-heads is slightly smaller than the one from fitting the CaT, with an average difference of for the complete sample (all morphological types).
-
•
We compiled the available values from literature and found an almost one-to-one relation between optical (CaT, Mgb, etc.) and CO-based estimates for early-type galaxies. For spiral galaxies the discrepancy is higher, but still much lower than for merger remnants. The best fit for spiral galaxies is , but more observations covering the ranges and are needed to properly calibrate this relation.
-
•
The fractional difference correlates with the infrared luminosity, which may suggest that the -discrepancy is related to the presence of warm dust. In this scenario, the CO absorption band heads would be dominated by young stars located in the disc of the galaxy and thus result in smaller values, while the optical estimates are less sensitive to variations in the stellar population. However, the detailed spectral synthesis that would be needed to test this interpretation requires high spectral resolution SSP models, which are not yet available.
-
•
We investigated the impact of the discrepancy on the mass of the SMBH obtained via the relation and found a mean logarithmic difference of , that must be considered as a systematic error in the SMBH mass when using for spiral galaxies. However, this uncertainty is dominated by scatter of the relation and the conversion from to may introduce a even larger uncertainty in the derived .
Although the “ discrepancy” has already been discussed for ULIRGs and merger remnants (e.g. Rothberg & Fischer, 2010; Rothberg et al., 2013) and no discrepancy was found for early-type galaxies (e.g. Silge & Gebhardt, 2003; Vanderbeke et al., 2011; Kang et al., 2013), this is the first time that this comparison is done for a sample of mostly late-type galaxies.
Acknowledgements
We thank an anonymous referee for useful suggestions which helped to improve the paper and S. Rembold for help with the bootstrap technique. This work is based on observations obtained at the Gemini Observatory, which is operated by the Association of Universities for Research in Astronomy, Inc., under a cooperative agreement with the NSF on behalf of the Gemini partnership: the National Science Foundation (United States), the Science and Technology Facilities Council (United Kingdom), the National Research Council (Canada), CONICYT (Chile), the Australian Research Council (Australia), Ministério da Ciência, Tecnologia e Inovação (Brazil) and Ministerio de Ciencia, Tecnologia e Innovación Productiva (Argentina). R.A.R. acknowledges support from FAPERGS (project N0. 12/1209-6) and CNPq (project N0. 470090/2013-8). L.C.H. acknowledges support from the Kavli Foundation, Peking University, and grant N0. XDB09030102 (Emergence of Cosmological Structures) from the Strategic Priority Research Program of the Chinese Academy of Sciences. A.R.A. acknowledges CNPq for partial support to this work through grant 307403/2012-2. L.M. thanks CNPq through grant 305291/2012-2. L.C. acknowledges support from the Special Visiting Researcher Fellowship (PVE 313945/2013-6) under the Brazilian Scientific Mobility Program “Ciências sem Fronteiras”. R.R. acknowledges funding from FAPERGs (ARD 11/1758-5) and CNPq (PeP 304796/2011-5). C.R.A. is supported by a Marie Curie Intra European Fellowship within the 7th European Community Framework Programme (PIEF-GA-2012-327934) and by the Spanish Ministry of Science and Innovation (MICINN) through project PN AYA2010-21887-C04.04.
References
- (1) Auld, R. et al., 2013, 428, 1880.
- Barth, Ho & Sargent (2002a) Barth, A. J., Ho, L. C., Sargent, W. L. W., 2002, ApJ, 124, 2607.
- Barth, Ho & Sargent (2002b) Barth, A. J., Ho, L. C., Sargent, W. L. W., 2002, ApJ, 566, L13.
- Beers, Flynn & Gebhardt (1990) Beers, T. C., Flynn, K., Gebhardt, K., 1990, AJ, 100, 32.
- Bellovary et al. (2014) Bellovary, J., Holley-Bockelmann, K., Gültekin, K., Christensen, C., Governato, F., Brooks, A., Loebman, S., Munshi, F., 2014, http://arxiv.org/abs/1405.0286
- Bender, Burstein & Faber (1993) Bender, R., Burstein, D., & Faber, S. M. 1993, ApJ, 411, 153
- Bernardi et al. (2003) Bernardi, M. et al. 2003, AJ,125, 1866.
- Bourne et al. (2013) Bourne, N.et al. 2013, MNRAS, 436, 479.
- Bower et al. (2006) Bower, R. G. et al. 2006, MNRAS, 370, 645.
- Bruzual & Charlot (2003) Bruzual, G., Charlot, S., 2003, MNRAS, 344, 1000.
- Cappellari & Emsellem (2004) Cappellari, M. & Emsellem, E., 2004, PASP, 116, 138.
- Cappellari et al. (2007) Cappellari, M. et al., 2007, MNRAS, 379, 418.
- Cenarro et. al. (2001) Cenarro, A. J., Cardiel, N., Gorgas, J., Peletier, R. F., Vazdekis, A., Prada, F., 2001, MNRAS, 326, 959.
- Cid Fernandes et al. (2004) Cid Fernandes, R., Gu, Q. Melnick, J., Terlevich, E., Terlevich, R., Kunth, D., Rodrigues Lacerda, R., Joguet, B., 2004, MNRAS, 355, 273.
- Ciesla et al. (2012) Ciesla, L. et al., 2012, A&A, 543, 161.
- Cox et al. (2006) Cox, T. J., Dutta, S. N., Di Matteo, T., Hernquist, L., Hopkins, P. F., Robertson, B., Springel, V., 2006, ApJ, 650, 791.
- Cushing, Rayner, & Vacca (2005) Cushing, M.C., Rayner, J.T., & Vacca, W.D., 2005, ApJ, 623, 1115.
- Davies et al. (2012) Davies J. I. et al., 2012, MNRAS, 419, 3505.
- De Looze et al. (2012) De Looze, I. et al., 2012, MNRAS, 423, 2359.
- Di Matteo, Springel & Hernquist (2005) Di Matteo, T., Springel, V. & Hernquist, L. 2005, Nature, 433, 604.
- Djorgovski & Davis (1987) Djorgovski, S., Davis, M., 1987, ApJ, 313, 59.
- Draine (2003) Draine, B. T., 2003, ARAA, 41, 241.
- Dressler (1984a) Dressler, A. 1984, ApJ, 281, 512
- Dressler (1984b) Dressler, A. 1984, ApJ, 286, 97
- Dressler et al. (1987) Dressler, A., Lynden-Bell, D., Burstein, D., Davies, R. L., Faber, S. M., Terlevich, R., Wegner, G., 1987, ApJ, 313, 42.
- Emsellem et al. (2001) Emsellem, E., Greusard, D., Combes, F., Friedli, D., Leon, S., Pécontal, E., Wozniak, H., 2001, A&A, 368, 52.
- Emsellem et al. (2004) Emsellem, E., Cappellari, M., Peletier, R. F., McDermid, R. M., Bacon, R., Bureau, M., Copin, Y., Davies, R. L., Krajnović, D., Kuntschner, H., Miller, B. W., & de Zeeuw, P. T. 2004, MNRAS, 352, 721.
- Falcón-Barroso, Peletier & Balcells (2002) Falcón-Barroso, J. Peletier, R. F., Balcells, M., 2002, MNRAS, 335, 741.
- Ferrarese & Ford (2005) Ferrarese, L. & Ford, H. C., 2005, Space Science Reviews, 116, 523.
- Ferrarese & Merrit (2000) Ferrarese, L. & Merrit, D., 2000, ApJ, 547, 140.
- Gebhardt et al. (2003) Gebhardt, K., Richstone, D., Tremaine, S., Lauer, T. R., Bender, R., Bower, G., Dressler, A., Faber, S. M., Filippenko, A. V., Green, R., Grillmair, C., Ho, L. C., Kormendy, J., Magorrian, J., & Pinkney, J. 2003, ApJ, 583, 92
- Gebhardt et al. (2000) Gebhardt, K. et al. 2000, ApJ, 539, 13.
- Graham et al. (2011) Graham, A. W., Onken, C. A., Athanassoula, E., Combes, F., 2011, MNRAS, 412, 2211.
- Gültekin et al. (2009) Gültekin, K., Cackett, E. M., Miller, J. M., Di Matteo, T., Markoff, S., Richstone, D. O., 2008, ApJ, 706, 404.
- Heisler & De Robertis (1999) Heisler C. A., De Robertis M. M., 1999, AJ, 118, 2038.
- Ho, Filippenko & Sargent (1995) Ho, L. C., Filippenko, A. V., Sargent, W. L., 1995, ApJS, 98, 477.
- Ho, Filippenko & Sargent (1997) Ho, L. C., Filippenko, A. V., Sargent, W. L., 1997, ApJS, 112, 31.
- Ho et al. (2009) Ho, L. C., Greene, J. E., Filippenko, A. V., Sargent, W. L., 2009, ApJS, 183, 1.
- Hildebrand (1983) Hildebrand, R. H. 1983, Q. J. R. Astron. Soc., 24, 267
- Ivanov et al. (2000) Ivanov, V. D., Rieke, G. H., Groppi, C. E., Alonso-Herrero, A., Rieke, M. J., Engelbracht, C. W., 2000, ApJ, 545, 190.
- Kang et al. (2013) Kang, W-R., Woo, J-H., Schulze, J., Riechers, D. A., Kim, S. C., Park, D., & Smolcic, V., 2013, ApJ, 767, 26.
- Kennicutt (1998) Kennicutt R. C., 1998, ARA&A, 36, 189
- Kennicutt & Evans (2012) Kennicutt R. C., Evans N. J., 2012, ARA&A, 50, 531.
- Kormendy & Kennicutt (2004) Kormendy, J., & Kennicutt, R., ARA&A, 2004, 42, 603.
- Kotilainen et al. (2012) Kotilainen, J. K., Hyvönen, T., Reunanen, J., Ivanov, V. D., 2012, MNRAS, 425, 1057.
- Kormendy, Bender & Cornell (2011) Kormendy, J. Bender, R., & Cornell, M. E., Nature, 2011, 469, 374.
- Kormendy & Ho (2013) Kormendy, J., & Ho, L. C. 2013, ARA&A, 51, 511.
- Kuntschner (2000) Kuntschner, H., MNRAS, 2000, 315, 184.
- Maraston (2005) Maraston, C., 2005, MNRAS, 362, 799.
- Magorrian et al. (1998) Magorrian, J. et al. 1998, AJ, 115, 2285.
- Nemmen et al. (2007) Nemmen R., Bower, R., Babul, A. & Storchi-Bergmann, T. 2007, MNRAS, 377, 1652
- Marleau et al. (2006) Marleau, F. R. et al., 2006, ApJ, 646, 929.
- Martins et al. (2013a) Martins, L. P., Rodríguez-Ardila, A., Diniz, S., Gruenwald, R., de Souza, R., 2013a, MNRAS, 431, 1823.
- Martins et al. (2013b) Martins, L. P., Rodríguez-Ardila, A., Diniz, S., Riffel, R., de Souza, R., 2013b, MNRAS, 435, 2861.
- Márquez et al. (2003) Márquez, I. Masegosa, J., Durret, F., González Delgado, R. M., Moles, M., Maza, J., Pérez, E., Roth, M., 2003, A&A, 409, 459.
- Moorwood & Oliva (1988) Moorwood A. F. M., Oliva E., 1988, A&A, 203, 278
- Naab et al. (2013) Naab, T. et al., 2013, arXiv:1311.0284
- Origlia, Moorwood & Oliva (1993) Origlia, L., Moorwood, A. F. M., Oliva, E., 1993, A&A, 280, 5360.
- Rayner, Cushing, & Vacca (2009) Rayner, J.T., Cushing, M.C., & Vacca, W.D., 2009, ApJS, 185, 289.
- Richstone et al. (1998) Richstone, D. et al., 1998, Nature, 395, A14.
- Rothberg & Fischer (2010) Rothberg, B., & Fischer, J., 2010, ApJ, 712, 318.
- Rothberg et al. (2013) Rothberg, B., Fischer, J., Rodrigues, M., & Sanders, D. B., 2013, ApJ, 767, 72.
- Riffel, Rodríguez-Ardila & Pastoriza (2006) Riffel, R., Rodríguez-Ardila, A., Pastoriza, M. G., 2006, A&A, 457, 61.
- Riffel et al. (2007) Riffel, R., Pastoriza, M. G., Rodríguez-Ardila, A., Maraston, C., 2007, ApJ, 659L, 103.
- Riffel et al. (2008) Riffel, Rogemar A., Storchi-Bergmann, T., Winge, C., McGregor, P. J., Beck, T., Schmitt, H., 2008, MNRAS, 385, 1129.
- Riffel et al. (2009) Riffel, R., Pastoriza, M. G., Rodríguez-Ardila, A., Bonatto, C., 2009, MNRAS, 400, 273.
- Riffel (2010) Riffel, Rogemar A., 2010, Ap&SS, 327, 239.
- Riffel et al. (2010) Riffel, Rogemar A. & Storchi-Bergmann, T., Riffel, R., & Pastoriza, M. G., 2010, ApJ, 713, 469.
- Riffel et al. (2011) Riffel, R., Riffel, Rogemar A., Ferrari, F., Storchi-Bergmann, T., 2011. MNRAS, 416, 493.
- Sánchez-Blázquez et al. (2006) Sánchez-Blázquez, P., Peletier, R. F., Jiménez-Vicente, J., Cardiel, N., Cenarro, A. J., Falcón-Barroso, J., Gorgas, J., Selam, S., Vazdekis, A., 2006, MNRAS, 371, 703.
- Sauvage et al. (2013) Sauvage, M., et al. 2010, A&A, 518, 64.
- Silge & Gebhardt (2003) Silge, J. D., & Gebhardt, K., 2003, ApJ, 125, 2809.
- Silva et al. (2008) Silva, D. R., Kuntschner, H., Lyubenova, M., 2008, ApJ, 674, 194.
- Springel, Di Matteo & Hernquist (2005) Springel, V., Di Matteo, T. & Hernquist, L., 2005, ApJ, 620, 79.
- Storchi-Bergmann et al. (2012) Storchi-Bergmann, T., Riffel, Rogemar A., Riffel, R., Diniz, M. R., Borges Vale, T., McGregor, P. J., 2012, ApJ, 755, 87.
- Terlevich et al. (1981) Terlevich, R., Davies, R. L., Faber, S. M., Burstein, D. 1981, MNRAS, 196, 381
- Tremaine et al. (2002) Tremaine, S. et al. 2002, ApJ, 574, 740.
- Thuan & Sauvage (1992) Thuan, T. X., & Sauvage, M. 1992, A&AS, 92, 749
- Valluri, Merrit & Emsellem (2004) Valluri, M., Merritt, D., & Emsellem, E. 2004, ApJ, 602, 66.
- Vanderbeke et al. (2011) Vanderbeke, J., Baes, M., Romanowsky, A. J., & Schimidtobreick, L., 2011, MNRAS, 412, 2017.
- van der Marel & Franx (1993) van der Marel, R. P., & Franx, M. 1993, ApJ, 407, 525.
- Weingartner & Draine (2001) Weingartner, J.C., & Draine, B.T. 2001, ApJ, 548,296.
- Winge, Riffel & Storchi-Bergmann (2009) Winge, C., Riffel, Rogemar A., & Storchi-Bergmann, T., 2009, ApJS, 185, 186.
- Woo et al. (2013) Woo, J.-H., Schulze, A., Park, D., Kang, W.-R., Kim, S. C., & Riechers, D. A. 2013, ApJ, 772, 49
- Xiao et al. (2011) Xiao, T., Barth, A. J., Greene, J. E., Ho, L. C., Bentz, M., C., Ludwig, R. R., & Jiang, Y., 2011, ApJ, 739, 28.
Appendix A Fits of the spectra
Figures 7 and 2 show the resulting fit of the galaxy spectra for the CO and Ca triplet spectral regions, respectively.
 |
 |
 |
 |
 |
 |
 |
 |
 |
 |
 |
 |
 |
 |
 |
 |
 |
 |
 |
 |
 |
 |
 |
 |
 |
 |
 |
 |
 |
 |
 |
 |
 |
 |
 |
 |
 |
 |
 |
 |
 |
 |
 |
 |
 |
 |
 |
 |
 |
 |
 |
 |
 |
 |
 |
 |
 |
 |
 |
 |
 |
 |
 |
 |
 |
 |
 |
 |
 |
 |
 |
 |
 |
 |
 |
 |
 |
 |
 |
 |
 |
 |
 |
 |
 |
 |
 |
 |
 |
Appendix B Stellar templates used to fit the stellar kinematics
Table 1 shows the weights of each star (as well their spectral types) to the fit of the galaxy spectra for the CaT and CO spectral regions.
| CaT region | CO region | |||||
| Galaxy | Spectral Type | Star | Weight (%) | Spectral Type | Star | Weight (%) |
| NGC205 | F3III | HD115604 | 15 | K0III | HD105028 | 7 |
| GB | M67-F-108 | 21 | K2III | HD10598 | 5 | |
| HB | M71-1-41 | 8 | G8III | HD107467 | 16 | |
| HB | M92-I-13 | 3 | M3III | HD27796 | 7 | |
| K0III | HD54810 | 37 | M3III | HD112300 | 9 | |
| K3III | HD58972 | 1 | M0III | HD2490 | 12 | |
| K4II | HD130705 | 3 | K3III | HD4730 | 27 | |
| K5III | HD139669 | 6 | K7III | HD63425B | 1 | |
| K5III | HD149009 | 1 | G3V | HD6461 | 11 | |
| M7.5III | HD126327 | 2 | ||||
| NGC266 | GB | M67-F-108 | 13 | M3III | HD27796 | 6 |
| HB | M5-II-76 | 37 | M2III | HD30354 | 38 | |
| HB | M71-C | 2 | K8V | HD113538 | 41 | |
| M5III | HD172816 | 45 | M0III | HD2490 | 8 | |
| M6III | HD148783 | 1 | K7III | HD63425B | 4 | |
| NGC315 | GB | M67-F-108 | 33 | M2III | HD30354 | 44 |
| GB | NGC188-II-122 | 29 | G2Ib | HD209750 | 6 | |
| HB | M5-II-53 | 4 | M0III | HD2490 | 21 | |
| K5III | HD149009 | 26 | K0IV | HD34642 | 13 | |
| M4III | HD17491 | 2 | G5II | HD36079 | 13 | |
| M7III | HD207076 | 3 | ||||
| NGC404 | GB | M67-F-108 | 26 | K0III | HD105028 | 42 |
| HB | M5-II-76 | 34 | K3Iab | HD339034 | 4 | |
| HB | M92-XII-24 | 2 | M0III | HD2490 | 42 | |
| K5III | HD149009 | 21 | K0IV | HD34642 | 10 | |
| M7III | HD114961 | 15 | ||||
| NGC410 | M2III | HD30354 | 68 | |||
| K5II | HD3989 | 12 | ||||
| K8V | HD113538 | 17 | ||||
| K6III | HD32440 | 2 | ||||
| NGC474 | F3III | HD115604 | 1 | M3III | HD236791 | 1 |
| GB | NGC7789-501 | 25 | M2III | HD30354 | 33 | |
| HB | M92-I-13 | 19 | K8V | HD113538 | 9 | |
| K0III | HD54810 | 37 | G2Ib | HD209750 | 3 | |
| M6V | BD19-5116-B | 13 | M0III | HD2490 | 29 | |
| SGB | M67-IV-68 | 4 | K6III | HD32440 | 17 | |
| K0IV | HD34642 | 5 | ||||
| K3Iab | HD339034 | 3 | ||||
| NGC660 | G2Ib | HD209750 | 2 | |||
| K7III | HD63425B | 15 | ||||
| G8V | HD64606 | 80 | ||||
| NGC1052 | HB | M5-II-53 | 5 | M3III | HD236791 | 21 |
| HB | M92-I-13 | 19 | M3III | HD27796 | 2 | |
| K5III | HD139669 | 34 | M2III | HD30354 | 4 | |
| M7III | HD114961 | 18 | K8V | HD113538 | 32 | |
| SGB | M67-F-125 | 22 | K7III | HD63425B | 36 | |
| G3V | HD6461 | 3 | ||||
| NGC1167 | F5VI | HD108177 | 47 | M2III | HD30354 | 23 |
| G5IIIwe | HD88609 | 1 | M2III | BD-01 3097 | 1 | |
| GB | NGC188-II-122 | 35 | K8V | HD113538 | 17 | |
| HB | M92-XII-24 | 6 | G2Ib | HD209750 | 4 | |
| M7III | HD114961 | 8 | M0III | HD2490 | 8 | |
| K7III | HD63425B | 43 | ||||
| CaT region | CO region | |||||
| Galaxy | Spectral Type | Star | Weight (%) | Spectral Type | Star | Weight (%) |
| NGC1358 | HB | M71-1-34 | 44 | M2III | HD30354 | 57 |
| HB | M71-C | 9 | M2 | BD59 274 | 7 | |
| K4III | HD149161 | 6 | K8V | HD113538 | 33 | |
| M5III | HD172816 | 24 | M0III | HD2490 | 1 | |
| M7III | HD114961 | 15 | ||||
| NGC1961 | GB | NGC188-I-57 | 27 | M2III | HD30354 | 36 |
| K0V | HD149661 | 9 | K8V | HD113538 | 24 | |
| K5III | HD139669 | 39 | M0III | HD2490 | 39 | |
| M5.5III | HD94705 | 19 | ||||
| M6V | BD19-5116-B | 2 | ||||
| M7III | HD114961 | 1 | ||||
| NGC2273 | HB | M5-II-53 | 8 | M2III | HD30354 | 18 |
| K4II | HD130705 | 39 | K3Iab | HD339034 | 1 | |
| K5III | HD139669 | 1 | K8V | HD113538 | 1 | |
| M4III | HD17491 | 20 | M0III | HD2490 | 19 | |
| M5III | HD172816 | 8 | K0IV | HD34642 | 4 | |
| M5.5III | HD94705 | 1 | G5II | HD36079 | 33 | |
| M5III | HD175865 | 7 | K7III | HD63425B | 3 | |
| SGB | M67-F-115 | 10 | G8V | HD64606 | 11 | |
| SGB | M67-F-125 | 5 | G3V | HD6461 | 6 | |
| NGC2639 | M2III | HD30354 | 42 | |||
| M3Iab | BD39 4208 | 11 | ||||
| G2Ib | HD209750 | 29 | ||||
| M0III | HD2490 | 16 | ||||
| NGC2655 | F3III | HD115604 | 6 | M2III | HD30354 | 7 |
| GB | M67-F-108 | 7 | K3Iab | HD339034 | 1 | |
| HB | M5-II-53 | 8 | K8V | HD113538 | 25 | |
| K5III | HD139669 | 31 | M0III | HD2490 | 40 | |
| M6III | HD18191 | 22 | K0IV | HD34642 | 1 | |
| SGB | M67-F-125 | 24 | K7III | HD63425B | 23 | |
| NGC2768 | GB | NGC188-I-85 | 8 | M2III | HD30354 | 23 |
| HB | M71-1-41 | 16 | K3Iab | HD339034 | 1 | |
| HB | M92-XII-24 | 4 | K8V | HD113538 | 19 | |
| K3III | HD102328 | 37 | K1II | HD198700 | 3 | |
| M6III | HD18191 | 24 | M0III | HD2490 | 49 | |
| SGB | M67-F-125 | 7 | K0IV | HD34642 | 2 | |
| NGC2832 | F0 | BD-01-2582 | 1 | 1 | ||
| HB | M71-C | 41 | M2III | HD30354 | 30 | |
| HB | M92-XII-24 | 2 | K8V | HD113538 | 17 | |
| M5.5III | HD94705 | 20 | M0III | HD2490 | 51 | |
| M6V | BD19-5116-B | 16 | ||||
| M7III | HD207076 | 6 | ||||
| SGB | M67-F-125 | 10 | ||||
| NGC3031 | GB | M67-F-231 | 1 | M3III | HD27796 | 5 |
| GB | M92-XII-8 | 2 | M2III | HD30354 | 14 | |
| GB | NGC188-II-122 | 6 | K8V | HD113538 | 21 | |
| HB | M5-II-76 | 1 | M0III | HD2490 | 10 | |
| HB | M92-I-13 | 3 | K0IV | HD34642 | 2 | |
| K5III | HD139669 | 5 | G5II | HD36079 | 8 | |
| M5III | HD172816 | 25 | K7III | HD63425B | 25 | |
| M7III | HD114961 | 18 | G3V | HD6461 | 10 | |
| SGB | M67-F-115 | 7 | K4III | HD9138 | 1 | |
| SGB | M67-IV-68 | 29 | ||||
| NGC 3079 | M2III | HD30354 | 12 | |||
| K3Iab | HD339034 | 2 | ||||
| K8V | HD113538 | 18 | ||||
| M0III | HD2490 | 39 | ||||
| K7III | HD63425B | |||||
| CaT region | CO region | |||||
| Galaxy | Spectral Type | Star | Weight (%) | Spectral Type | Star | Weight (%) |
| NGC3147 | G2V | Hya-vB-64 | 2 | M2III | HD30354 | 26 |
| GB | NGC188-I-61 | 8 | K8V | HD113538 | 21 | |
| HB | M71-C | 1 | G2Ib | HD209750 | 6 | |
| K0III | HD88284 | 22 | M0III | HD2490 | 5 | |
| K4II | HD130705 | 46 | K0IV | HD34642 | 1 | |
| M6V | BD19-5116-B | 10 | G5II | HD36079 | 7 | |
| M7.5III | HD126327 | 4 | K7III | HD63425B | 31 | |
| M7III | HD207076 | 3 | ||||
| NGC3169 | F2II | HD164136 | 15 | M3III | HD27796 | 6 |
| GB | M67-F-108 | 19 | M2III | HD30354 | 33 | |
| GB | NGC7789-501 | 25 | K3Iab | HD339034 | 4 | |
| HB | M5-II-76 | 14 | K8V | HD113538 | 6 | |
| HB | M92-XII-24 | 7 | G2Ib | HD209750 | 5 | |
| M8III | HD113285 | 4 | M0III | HD2490 | 28 | |
| SGB | NGC188-I-88 | 12 | K0IV | HD34642 | 4 | |
| G3V | HD6461 | 9 | ||||
| NGC3190 | F0V | Hya-vB-103 | 3 | M2III | HD30354 | 14 |
| F6V | HD30652 | 1 | K3Iab | HD339034 | 5 | |
| GB | M67-F-108 | 8 | K8V | HD113538 | 23 | |
| HB | M71-1-41 | 32 | M0III | HD2490 | 24 | |
| K3III | HD169191 | 20 | K7III | HD63425B | 31 | |
| M7III | HD207076 | 16 | ||||
| SGB | M67-F-125 | 17 | ||||
| NGC3607 | HB | M5-II-53 | 7 | M2III | HD30354 | 36 |
| HB | M92-I-13 | 6 | K8V | HD113538 | 20 | |
| K0V | Coma-A-13 | 21 | M0III | HD2490 | 42 | |
| K5III | HD136028 | 4 | ||||
| K7V | HD157881 | 10 | ||||
| M4III | HD17491 | 27 | ||||
| M7III | HD114961 | 10 | ||||
| SGB | M67-F-125 | 12 | ||||
| NGC3718 | GB | M67-F-108 | 2 | 1 | ||
| GB | M71-1-71 | 1 | M2III | HD30354 | 25 | |
| HB | M71-C | 14 | K3Iab | HD339034 | 1 | |
| K0III | HD63352 | 6 | K8V | HD113538 | 22 | |
| K5III | HD136028 | 13 | M0III | HD2490 | 33 | |
| M5III | HD175865 | 13 | K7III | HD63425B | 14 | |
| SGB | M67-F-125 | 37 | G3V | HD6461 | 2 | |
| SGB | NGC188-I-97 | 11 | ||||
| NGC3998 | HB | M71-1-41 | 3 | M2III | HD30354 | 20 |
| HB | M71-C | 18 | K8V | HD113538 | 10 | |
| HB | M92-XII-24 | 9 | K0IV | HD34642 | 29 | |
| K0V | Coma-A-13 | 37 | K7III | HD63425B | 31 | |
| K5III | HD136028 | 31 | G3V | HD6461 | 7 | |
| NGC4203 | GB | NGC188-I-61 | 30 | M2III | HD30354 | 17 |
| HB | M5-II-53 | 4 | M3Iab | BD+39 4208 | 2 | |
| HB | M71-1-41 | 27 | K8V | HD113538 | 24 | |
| K0V | Coma-A-13 | 4 | G2Ib | HD209750 | 5 | |
| K5III | HD139669 | 4 | G5II | HD36079 | 14 | |
| K5III | HD149009 | 8 | K7III | HD63425B | 33 | |
| K7V | HD157881 | 1 | G8V | HD64606 | 2 | |
| M7III | HD114961 | 19 | ||||
| NGC4235 | M1.5Vb | HD72905 | 55 | G5II | HD36079 | 77 |
| G5III | HD134063 | 14 | K7III | HD63425B | 14 | |
| K4III | HD131918 | 2 | G3V | HD6461 | 7 | |
| M7III | HD207076 | 15 | ||||
| SGB | M67-IV-68 | 11 | ||||
| CaT region | CO region | |||||
| Galaxy | Spectral Type | Star | Weight (%) | Spectral Type | Star | Weight (%) |
| NGC4258 | G5IIIwe | HD2665 | 3 | M3III | HD236791 | 5 |
| GB | NGC188-II-187 | 1 | M3III | HD27796 | 4 | |
| K1III | HD185644 | 62 | M2III | HD30354 | 10 | |
| K3III | HD169191 | 10 | K3Iab | HD339034 | 2 | |
| M7III | HD207076 | 18 | K8V | HD113538 | 10 | |
| SGB | M67-F-125 | 3 | M0III | HD2490 | 10 | |
| K0IV | HD34642 | 7 | ||||
| K7III | HD63425B | 25 | ||||
| G8V | HD64606 | 1 | ||||
| G3V | HD6461 | 21 | ||||
| NGC4346 | G9III | HD112989 | 9 | M2III | HD30354 | 32 |
| GB | NGC188-II-122 | 1 | K8V | HD113538 | 19 | |
| HB | M71-C | 21 | M0III | HD2490 | 25 | |
| K3III | HD102328 | 37 | K7III | HD63425B | 22 | |
| M4III | HD17491 | 13 | ||||
| SGB | M67-F-125 | 8 | ||||
| SGB | NGC188-I-97 | 8 | ||||
| NGC4388 | GB | M67-F-108 | 4 | M2III | HD30354 | 23 |
| K7V | HD157881 | 46 | K8V | HD113538 | 4 | |
| M1III | HD168720 | 19 | G5II | HD36079 | 13 | |
| M6V | BD19-5116-B | 1 | G8V | HD64606 | 15 | |
| SGB | M67-F-115 | 27 | G3V | HD6461 | 29 | |
| SGB | M67-IV-68 | 1 | K4III | HD9138 | 12 | |
| NGC4450 | GB | NGC188-II-122 | 13 | M2III | HD30354 | 29 |
| HB | M92-XII-24 | 7 | K8V | HD113538 | 19 | |
| K5III | HD120933 | 1 | K1II | HD198700 | 14 | |
| K5III | HD139669 | 42 | M0III | HD2490 | 4 | |
| M5V | Gl-699 | 16 | K7III | HD63425B | 22 | |
| SGB | M67-F-115 | 15 | G3V | HD6461 | 9 | |
| SGB | NGC188-II-93 | 2 | ||||
| NGC4548 | HB | M71-C | 16 | M2III | HD30354 | 21 |
| HB | NGC188-I-105 | 4 | K8V | HD113538 | 15 | |
| K3III | HD102328 | 46 | M0III | HD2490 | 28 | |
| M5.5III | HD94705 | 10 | K7III | HD63425B | 12 | |
| SGB | M67-F-125 | 4 | G8V | HD64606 | 21 | |
| SGB | NGC188-I-97 | 16 | ||||
| NGC4565 | GB | M67-F-108 | 16 | M2III | HD30354 | 29 |
| GB | NGC188-I-57 | 3 | K8V | HD113538 | 17 | |
| HB | M71-1-41 | 7 | G2Ib | HD209750 | 4 | |
| HB | M92-XII-24 | 6 | M0III | HD2490 | 39 | |
| K0III | HD85503 | 11 | K7III | HD63425B | 4 | |
| K5III | HD139669 | 17 | G8V | HD64606 | 4 | |
| M4III | HD17491 | 22 | ||||
| M7III | HD114961 | 4 | ||||
| SGB | M67-F-125 | 8 | ||||
| NGC4569 | F3III | HD115604 | 26 | M2III | HD30354 | 21 |
| GB | M67-F-108 | 29 | M3Iab | BD39 4208 | 1 | |
| GB | NGC188-I-75 | 1 | K3Iab | HD339034 | 4 | |
| HB | M71-1-41 | 18 | K8V | HD113538 | 11 | |
| HB | M92-XII-24 | 7 | M0III | HD2490 | 59 | |
| K5III | HD139669 | 9 | ||||
| M7III | HD114961 | 9 | ||||
| NGC4579 | F3III | HD115604 | 2 | M2III | HD30354 | 16 |
| GB | NGC188-II-122 | 1 | G2Ib | HD209750 | 1 | |
| GB | NGC7789-971 | 8 | M0III | HD2490 | 35 | |
| HB | M92-XII-24 | 4 | K7III | HD63425B | 4 | |
| K0III | HD142091 | 65 | G8V | HD64606 | 42 | |
| K5III | HD136028 | 6 | ||||
| SGB | M67-F-125 | 11 | ||||
| CaT region | CO region | |||||
| Galaxy | Spectral Type | Star | Weight (%) | Spectral Type | Star | Weight (%) |
| NGC4594 | HB | M71-C | 7 | M2III | HD30354 | 27 |
| HB | M92-XII-24 | 2 | K8V | HD113538 | 19 | |
| K0V | Coma-A-13 | 36 | M0III | HD2490 | 43 | |
| K2III | HD54719 | 8 | K7III | HD63425B | 9 | |
| K3III | HD102328 | 2 | ||||
| M4III | HD17491 | 3 | ||||
| M5III | HD172816 | 25 | ||||
| SGB | M67-F-125 | 14 | ||||
| NGC4725 | GB | M67-F-108 | 24 | M2III | HD30354 | 19 |
| GB | NGC7789-971 | 2 | K8V | HD113538 | 19 | |
| HB | M5-II-53 | 11 | G2Ib | HD209750 | 3 | |
| M5III | HD172816 | 59 | M0III | HD2490 | 34 | |
| M7III | HD114961 | 1 | K7III | HD63425B | 21 | |
| G3V | HD6461 | 2 | ||||
| NGC4736 | F5 | HD14938 | 2 | M2III | HD30354 | 28 |
| G2V | HD76932 | 12 | G2Ib | HD209750 | 17 | |
| GB | M67-F-108 | 38 | M0III | HD2490 | 53 | |
| GB | NGC7789-971 | 8 | ||||
| HB | M5-II-53 | 3 | ||||
| HB | M92-I-13 | 10 | ||||
| K0III | HD63352 | 24 | ||||
| NGC4750 | HB | M92-XII-24 | 3 | M2III | HD30354 | 22 |
| HB | NGC7789-676 | 4 | K3Iab | HD339034 | 2 | |
| K3III | HD102328 | 6 | K8V | HD113538 | 15 | |
| K4II | HD130705 | 14 | G2Ib | HD209750 | 21 | |
| K5III | HD149009 | 9 | M0III | HD2490 | 8 | |
| M4III | HD17491 | 16 | K7III | HD63425B | 28 | |
| M5.5III | HD94705 | 7 | ||||
| SGB | M67-F-115 | 6 | ||||
| SGB | M67-F-125 | 13 | ||||
| SGB. | NGC188-I-55 | 16 | ||||
| NGC5005 | HB | M5-II-53 | 10 | M2III | HD30354 | 20 |
| HB | M92-XII-24 | 4 | K8V | HD113538 | 24 | |
| K0V | Coma-A-13 | 9 | M0III | HD2490 | 55 | |
| K5III | HD139669 | 46 | ||||
| M5III | HD172816 | 3 | ||||
| SGB | M67-F-125 | 24 | ||||
| NGC5033 | GB | M67-F-108 | 64 | M2III | HD30354 | 39 |
| HB | M5-II-53 | 7 | K8V | HD113538 | 14 | |
| M5.5III | HD94705 | 18 | M0III | HD2490 | 29 | |
| M7III | HD114961 | 9 | G8V | HD64606 | 16 | |
| NGC5194 | F3III | HD115604 | 2 | M2III | HD30354 | 27 |
| GB | M67-F-108 | 33 | M2III | BD-01 3097 | 13 | |
| HB | M92-XII-24 | 7 | K8V | HD113538 | 8 | |
| K3III | HD102328 | 2 | G2Ib | HD209750 | 15 | |
| K4II | HD130705 | 5 | M0III | HD2490 | 34 | |
| K5III | HD139669 | 10 | ||||
| M4III | HD17491 | 25 | ||||
| SGB | M67-F-125 | 8 | ||||
| SGB | M67-IV-68 | 2 | ||||
| NGC5371 | F8V | Hya-vB-19 | 8 | M2III | HD30354 | 38 |
| G2V | Hya-vB-64 | 18 | K3Iab | HD339034 | 4 | |
| HB | M71-C | 4 | K8V | HD113538 | 4 | |
| K0III | HD88284 | 30 | K1II | HD198700 | 1 | |
| K4II | HD130705 | 19 | G2Ib | HD209750 | 14 | |
| M6V | BD19-5116-B | 9 | hd218594 | HD218594 | 2 | |
| M7.5III | HD126327 | 9 | M0III | HD2490 | 11 | |
| K0IV | HD34642 | 2 | ||||
| K7III | HD63425B | 16 | ||||
| G3V | HD6461 | 2 | ||||
| CaT region | CO region | |||||
| Galaxy | Spectral Type | Star | Weight (%) | Spectral Type | Star | Weight (%) |
| NGC5850 | F0V | HD112412 | 1 | M2III | HD30354 | 30 |
| G2V | HD76932 | 10 | K3Iab | HD339034 | 1 | |
| F7V | HD102634 | 2 | K8V | HD113538 | 19 | |
| F8V | HD187691 | 1 | G2Ib | HD209750 | 2 | |
| GB | M92-XII-8 | 10 | M0III | HD2490 | 33 | |
| K0III | HD88284 | 36 | K0IV | HD34642 | 1 | |
| K3III | HD169191 | 1 | K7III | HD63425B | 10 | |
| K4II | HD130705 | 22 | ||||
| M1III | HD168720 | 12 | ||||
| M7.5III | HD126327 | 1 | ||||
| NGC6500 | M2III | HD30354 | 23 | |||
| K8V | HD113538 | 11 | ||||
| G2Ib | HD209750 | 18 | ||||
| K7III | HD63425B | 48 | ||||
| NGC7217 | F3III | HD115604 | 8 | M2III | HD30354 | 34 |
| GB | NGC188-II-122 | 1 | K3Iab | HD339034 | 1 | |
| HB | M92-XII-24 | 2 | K8V | HD113538 | 21 | |
| K0V | Coma-A-13 | 11 | M0III | HD2490 | 42 | |
| K3III | HD102328 | 52 | ||||
| M4III | HD17491 | 10 | ||||
| M5III | HD175865 | 6 | ||||
| M6V | BD19-5116-B | 6 | ||||
| NGC7331 | F6V | HD30652 | 1 | M2III | HD30354 | 16 |
| G2V | Hya-vB-64 | 10 | K8V | HD113538 | 19 | |
| G5IIIwe | HD88609 | 12 | M0III | HD2490 | 37 | |
| G8III | HD38751 | 36 | K7III | HD63425B | 26 | |
| HB | M71-C | 9 | ||||
| K3III | HD102328 | 11 | ||||
| M7III | HD207076 | 16 | ||||
| NGC7743 | HB | M71-C | 34 | M2III | HD30354 | 6 |
| HB | M92-XII-24 | 16 | K3Iab | HD339034 | 4 | |
| K0III | HD85503 | 41 | K8V | HD113538 | 3 | |
| M7III | HD114961 | 4 | G2Ib | HD209750 | 5 | |
| SGB | M67-F-125 | 2 | M0III | HD2490 | 65 | |
| K0IV | HD34642 | 12 | ||||
| G3V | HD6461 | 2 | ||||