Nucleation at the contact line observed on nano-textured surfaces
Abstract
It has been conjectured that roughness plays a role in surface nucleation, the tendency for freezing to begin preferentially at the liquid-gas interface. Using high speed imaging, we sought evidence for freezing at the contact line on catalyst substrates with imposed characteristic length scales (texture). Length scales consistent with the critical nucleus size and with , where is a relevant line tension and is the surface tension, range from nanometers to micron. It is found that nano-scale texture causes a shift in the nucleation of ice in supercooled water to the three-phase contact line, while micro-scale texture does not.
pacs:
64.60.Q-, 64.70.D-, 68.03.Cd, 92.60.NvWhile nucleation of solids in supercooled liquids is ubiquitousDiao et al. (2011); Sear (2011, 2012), surface nucleation, the tendency for freezing to begin preferentially at the liquid-gas interface, has remained puzzlingTabazadeh et al. (2002); Duft and Leisner (2004); Shaw et al. (2005); Shpyrko et al. (2006); Mendez-Villuendas and Bowles (2007); Sear (2007); Sutter and Sutter (2007); Djikaev and Ruckenstein (2008a); Carvalho and Dalnoki-Veress (2010). Furthermore, in the presence of foreign catalysts the associated heterogeneous nucleation has been observed to prefer the three-phase contact line (triple line), especially for small particles Durant and Shaw (2005) and rough surfaces Carvalho and Dalnoki-Veress (2010). Motivated by the conjectured importance of roughness and the contact line, we have searched for evidence of a shift to surface nucleation as the characteristic roughness length scale is decreased. Two plausible length scales associated with heterogeneous nucleation, the critical radius for a nucleation seed, and the length scale at which linear and surface energies are comparable, yield a range from micrometers to nanometers. In this Letter we show, using high speed imaging of the transient freezing process in supercooled water, that nano-scale texture causes a shift in the nucleation to the three-phase contact line, while micro-scale texture does not. Both the mean and variance of the freezing temperature are observed to increase, also pointing to the importance of nanotexture given that variances of independent causes add. The possibility of a transition or optimal length scale has implications for the effectiveness of nucleation catalysts, including formation of ice in atmospheric cloudsCantrell and Heymsfield (2005).
Uniform probability of freezing is a standard assumption in nucleation theory: probability scaling as the volume of supercooled liquid for homogeneous nucleation, or as the area of the liquid–catalyst interface for heterogeneous nucleation. Recent studies suggest that for systems as widely varying as atomic liquidsMendez-Villuendas and Bowles (2007), saltsBartell et al. (2000), tetrahedral liquidsLi et al. (2009), hexaflouridesChushak and Bartell (2000), metal alloysShpyrko et al. (2006); Sutter and Sutter (2007), Nickel-SiliconLü and Chen (2012), polymersCarvalho and Dalnoki-Veress (2011), and waterTabazadeh et al. (2002); Djikaev et al. (2002), homogeneous nucleation prefers the liquid-vapor interface, and therefore its rate scales not as volume but rather as area. The mechanism for surface nucleation remains unclear, and even more troubling, its predominance has been qualified and questionedDuft and Leisner (2004); Sigurbjörnsson and Signorell (2008); Knopf (2006); Turner and Bartell (2005). Meanwhile, experiments on the nucleation of ice on small particles in supercooled water have revealed a strong enhancement in nucleation rate for particles at the liquid-water – air interfaceShaw et al. (2005); Fornea et al. (2009), suggesting that whatever physics underlies surface nucleation likely extends to heterogeneous nucleation as well. Sorting out this mystery is more than academic because it addresses fundamental aspects of classical nucleation theory (CNT) and thus predictability of nucleation processes; some long standing puzzles such as the empirical observation that ‘contact nucleation’ is more efficient than ‘immersion nucleation’ in supercooled cloud dropletsendnote_definitions may well be intertwined with the physics of surface nucleation. A leading hypothesis for the preference for surface nucleation is the formation of a three-phase interfaceSear (2007); Djikaev and Ruckenstein (2008a), and this aspect is investigated here for heterogeneous nucleation of ice in supercooled water.
Rough Carvalho and Dalnoki-Veress (2010) or ‘point-like contact’ Durant and Shaw (2005) nucleation catalysts have been observed to induce nucleation at the three-phase contact (triple) line. It has been suggested that a free energy per unit length or line tension for the contact line contributes to the nucleation kinetics Djikaev and Ruckenstein (2008b). Thus, an extensive nucleation rate (number of freezing events per unit time) would be a sum of contributions from immersion and contact modes. In recent work we sought direct confirmation by observing the freezing of mm-sized supercooled water droplets on atomically smooth substrates using high speed optical imaging: and yet for a variety of contact angles and cooling rates, no preference for nucleation at the macroscopic air-water-substrate contact line was observed Gurganus et al. (2011, 2013). It is possible, however, that the lack of contact-line-nucleation in those experiments reflects the system geometry. For example, an extensive nucleation rate dependent on both droplet-substrate surface area and perimeter would lead to the relative role of immersion versus contact line nucleation scaling with drop diameter. If so, then decreasing the drop size should favor surface nucleation. Rather than decreasing the size of the supercooled liquid volume, which renders our high-speed imaging method more difficult, here we modify the geometry of the nucleation catalyst so as to impose ‘textures’ exhibiting a range of length scales on the air-water-substrate contact line. The question is whether catalyst geometry alone can induce a preference for nucleation at the contact line.
The apparent role of substrate geometry and roughness Carvalho and Dalnoki-Veress (2010); Diao et al. (2011) motivates a consideration of possible length scales that could enter the heterogeneous nucleation problem. One is the size of the critical nucleus predicted by CNT. It has been shown Chakraverty and Pound (1964); Page and Sear (2006); van Meel et al. (2010) that steps, pores, cracks, or other surface features with sizes on the order of the critical nucleus may promote more efficient nucleation by lowering the free energy barrier. For example, Page et al.Page and Sear (2006) demonstrated that a two-step nucleation rate exists for ice within and outside of a pore, and therefore an optimal pore size exists, near the critical nucleus size, at which nucleation rate is maximized. Quite generally, the critical radius for nucleation is obtained from the Gibbs-Thomson equation , where is the molecular volume for ice and is the chemical potential difference between the supercooled liquid and the nucleated solid. It can be expressed as , where and are the equilibrium vapor pressures of liquid water and ice, respectively, is the latent heat of fusion, is the melting temperature, and is the supercooling temperature. For the typical of 5 to 35 K, the critical radius varies over the approximate range to 10 nm. In the experiments reported here, the observed supercooling temperatures suggest a length scale nm as a candidate for substrate texture.
A second length scale motivated by the suggested importance of the three-phase contact line, arises naturally from the notion that the contact line is characterized by a free energy per unit length, the line tension . For a system involving air, supercooled liquid, nucleated solid, and catalyst substrate, four distinct line tensions exist and may play a role Navascués and Tarazona (1981); Djikaev and Ruckenstein (2008b). Regardless of which or combination of ’s plays a role, the ratio of line and surface tension suggests a length scale, below which free energy of the contact line exceeds free energy of the interfacede Gennes et al. (2004). The existence or significance of the line tension itself is still a matter of some debateWeijs et al. (2011); Rowlinson and Widom (1982), with conflicting reports in literature for the magnitude and even the signMarmur (1997); Berg et al. (2010). Despite poor experimental quantification, however, recent computationalAuer and Frenkel (2003) and nucleation studiesHienola et al. (2007) have reconciled observations to theory by including line tension. We ask, therefore, what substrate ‘texture’ length scales would introduce geometric variability to the contact line e.g., distortion due to pinningde Gennes et al. (2004), that may affect the nucleation rate? Perhaps surface texture length scales on the order of or smaller than will promote surface nucleation? While varies only slightlyde Gennes et al. (2004) with , from J m-2, the reported range of values for is wide, from to J m-1 endnote1 , yielding a range of from nm to m.
In summary, length scales that could contribute to contact-line nucleation range from from the mm-scale of the macroscopic droplets for which no contact-line nucleation was observed, through the plausible range of starting at m, and finally down to length scales of minimum and the critical nucleus size nm. To that end, we have conducted nucleation experiments in which we observe freezing of water with high-speed optical imaging to identify the spatial origin of nucleation with droplets in contact with surfaces that are textured over a range of length scales. A shift to preference for nucleation at the contact line in these experiments would suggest that, whatever the physical mechanism, catalyst geometry plays a defining role. It then opens the way for further investigation of specific mechanisms using other methods, e.g., whether steps or pores resonant with the critical nucleus size, or distortion and curvature of the contact line on the order of lead to reduced Gibbs free energy barrier for nucleation.
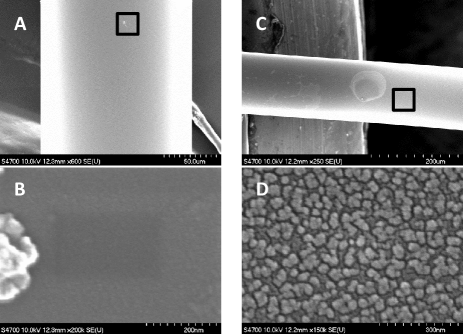
Guided by the cascade of scales described above, these experiments were conducted with heterogeneous nucleation catalysts textured to exhibit specific length scales. The fabricated catalysts consist of micro-textured silicon substrates (see supplemental Figure S2), and nano-textured optical fibers (Figure 1, panels C and D). Untextured substrates and fibers were used as controls; a smooth fiber is shown in Figure 1 (panels A and B) for reference. To impose micrometer-scales, single-crystal silicon substrates with periodic patterns of linear surface features were fabricated using photolithography (see supplemental material). The spatial feature sizes explored were 50, 10, 5, and 2 m; For large etch depths a superimposed, random texture with lengths in the range 1 m to nm also appeared (Supplemental Figure S2, bottom panel). To explore the nano-scales, below the limits of the photolithography method, an etching method was used on silica glass fibers. Fibers without and with the resulting nanotexture are shown at two resolutions in scanning electron microscope (SEM) images (Figure 1 A-D). Image analysis of the texture shown in Figure 1 (D) reveals linear sizes from approximately 100 nm down to 2 nm, which is near the resolution limit of the imaging method (see supplemental materials, section 4). Even in the absence of a contact line effect that changes with texture length scale, we can expect that roughness leads to an increase in catalyst surface area and therefore an increase in the extensive nucleation rate. The increases in surface area are small, but more importantly, the measurement depends on the spatial distribution of nucleation events, and is therefore is not directly dependent on quantification of nucleation rate.
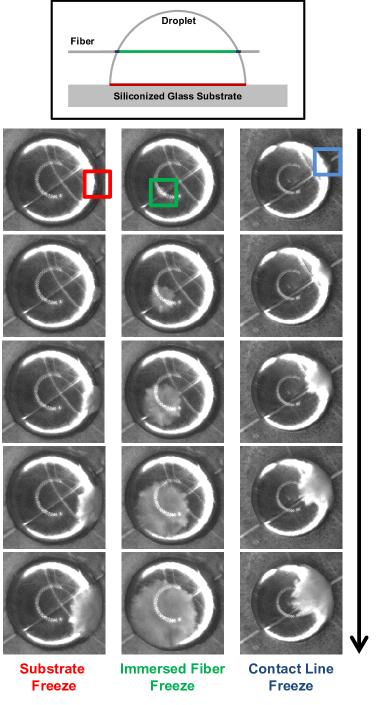
The freezing of supercooled water droplets in contact with a catalyst is observed with a high speed camera at 200 s between frames. The droplet is cooled at a rate of 2K min-1 to a temperature below the droplet freezing temperature (), then warmed to 10 ∘C to melt the droplet, see supplemental information for more details. As shown in Figure 2, reversing the freezing process in time pinpoints the epicenter of crystallization. The process is repeated many times so that the spatial distribution of nucleation events can be measured. In each cycle the water droplet is cooled until freezing occurs and then heated and melted. The droplet rests on a substrate, as shown schematically in Figure 2. Looking from above, it is apparent whether there is a preference for nucleation events at the clearly visible three-phase contact line. For smooth substrates it has been confirmedGurganus et al. (2011, 2013) that nucleation events are distributed randomly with no spatial correlations or preference for the contact line. When glass fibers are examined, the fiber pierces the drop as shown in Figure 2. Examples of nucleation events initiated on the substrate (red), on the immersed fiber (green), and at the fiber contact line (blue) are illustrated. Because the substrate and the fiber have essentially the same chemical composition (silica), a spatial shift from the substrate to the immersed fiber or to the fiber contact line is considered evidence for a change in the nucleation efficiency of those regions that represent a negligibly small fraction of the total catalyst surface area.
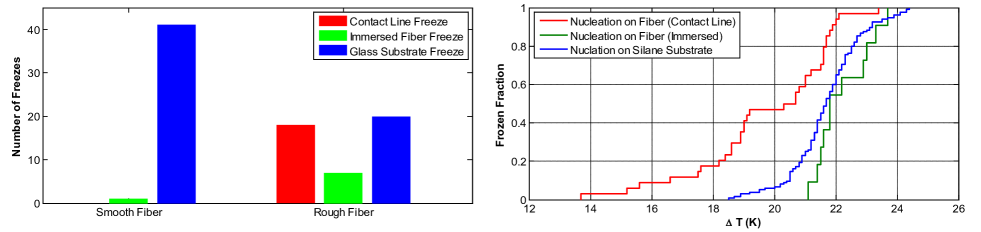
The microfabricated catalyst substrates, with length scales down to 2 m for the imposed pattern, and down to 100 nm for the deep etches, showed no change in the spatial distribution of nucleation events. Similarly, when the glass fiber with radius of 70 m was present, there was no tendency for nucleation to prefer the fiber over the substrate (see Figure 3, left panel). The nano-textured fiber, however displayed a shift in the spatial distribution of nucleation events to the fiber contact line. Despite the relatively small surface area of the nano-textured fiber, over half of the freezing events initiated there. And strikingly, despite the overwhelmingly small spatial odds, the majority of the fiber induced events originated at the three-phase contact line. This shift is consistent both with the surface texture length scale approaching the most likely value of nm, and the length scale associated with the critical radius for nucleation nm. Of course, the spatial evidence alone cannot be considered direct evidence for one length versus the other. Regardless of motivation, the observation clearly supports the notion that nano-scale surface features strongly favor ice nucleation at three-phase contact lines.
In addition to the direct spatial evidence inherent to the design of the experiment, the temperature at which crystallization is initiated is also recorded, providing information on the efficiency of nucleation. Figure 3 (right panel) shows cumulative freezing probabilities versus . Nucleation events at the fiber contact line (red curve) show significantly higher freezing temperatures, and these weaker supercoolings are indicative of nucleation rates enhanced by many orders of magnitudeShaw et al. (2005). The freezing temperature distribution for contact line events is not only shifted to higher temperatures, but is broadened. This is consistent with expectations for surface variabilitySear (2013) because variance adds for independent causes (e.g., randomness inherent to nucleation and randomness associated with surface texture). The temperature distributions thus support the spatial evidence for surface texture inducing the change in freezing behavior.
Is the observed temperature shift () consistent with the proposed mechanisms? Previous observations of contact line nucleation of ice suggest similar shifts of Durant and Shaw (2005); Fornea et al. (2009). It is customary in CNT to represent the efficiency of a heterogeneous catalyst through the contact angle of the nucleated phase, assumed to have the shape of a spherical cap: smaller contact angle implies more efficient catalyst. By comparison, to achieve a is required endnote2 Ervens and Feingold (2013). Although line tension values for ice and water are poorly known, direct measurements of other substances, via the modified Young’s equation , show that droplets exhibit Berg et al. (2010); Pompe and Herminghaus (2000). These values are consistent with our observed . Could nanopores explain this phenomenon? The nucleation barrier for has been shown to be a half of that for a flat catalyst. CNT for ice in water can realistically result in for similar changes in . However, this “pore-enhancement” can explain the magnitude of our observed temperature shift, but how they would cause a spatial transition to freezing at the contact line is unclear.
This evidence for a significant role of surface texture and characteristic length scales has wide implications: from catalyst design for drug synthesis, to improved parametrization of ice nucleation in clouds within weather and climate models. The demonstrated improvement in nucleation efficiency for nano-texture substrates is qualitatively consistent with recent work indicating that nucleation is enhanced by the introduction of sharp corners compared to circular shapes in catalysts with nano-poresDiao et al. (2011); Sear (2011). The relevant length scale may be the radius of curvature of a wetted surface feature, which is much smaller for ‘square’ nano-pores and is therefore consistent with the line tension hypothesis. The results from this work also help clarify why past work with ‘point-like’ contactShaw et al. (2005) showed a strong preference for surface nucleation: It is likely that the naturally occurring, irregular, micron-scale particles used there have surface features on the order of or smaller than the line tension scale, . This leads naturally to the speculation that spatially localized regions that are thought to induce crystallization, known as ‘active sites’, may be associated with surface features (steps, kink sites, defects) with characteristic length scales at or below .
This research was supported in part by an award from the Department of Energy (DOE) Office of Science Graduate Fellowship Program, the DOE Atmospheric System Research program through grant DE-SC0006949, and by the NSF grant AGS-111916. The authors wish to thank Dr. P. Bergstrom and the Microfabrication Facility at MTU for assistance with substrate lithography, and also Dr. J. Drelich and the Applied Chemical and Morphological Analysis Laboratory at MTU for assistance with AFM and SEM measurements.
References
- Diao et al. (2011) Y. Diao, T. Harada, A. S. Myerson, T. A. Hatton, and B. L. Trout, Nat Mater 10, 867 (2011).
- Sear (2011) R. P. Sear, Nat Mater 10, 809 (2011).
- Sear (2012) R. P. Sear, International Materials Reviews 0 (2012).
- Tabazadeh et al. (2002) A. Tabazadeh, Y. S. Djikaev, and H. Reiss, Proceedings of the National Academy of Sciences of the United States of America 99, 15873 (2002).
- Duft and Leisner (2004) D. Duft and T. Leisner, Atmospheric Chemistry and Physics 4, 1997 (2004).
- Shaw et al. (2005) R. A. Shaw, A. J. Durant, and Y. Mi, J Phys Chem B 109, 9865 (2005).
- Shpyrko et al. (2006) O. G. Shpyrko, R. Streitel, V. S. Balagurusamy, A. Y. Grigoriev, M. Deutsch, B. M. Ocko, M. Meron, B. Lin, and P. S. Pershan, Science 313, 77 (2006).
- Mendez-Villuendas and Bowles (2007) E. Mendez-Villuendas and R. Bowles, Physical Review Letters 98 (2007).
- Sear (2007) R. P. Sear, Journal of Physics-Condensed Matter 19 (2007).
- Sutter and Sutter (2007) P. W. Sutter and E. A. Sutter, Nat Mater 6, 363 (2007).
- Djikaev and Ruckenstein (2008a) Y. S. Djikaev and E. Ruckenstein, The Journal of Physical Chemistry. A 112, 11677 (2008a).
- Carvalho and Dalnoki-Veress (2010) J. L. Carvalho and K. Dalnoki-Veress, Physical Review Letters 105 (2010).
- Durant and Shaw (2005) A. J. Durant and R. A. Shaw, Geophysical Research Letters 32 (2005).
- (14) Contact and immersion ice nucleation are typically defined as nucleation of ice with a catalyst particle at the air-liquid interface or immersed in liquid water, respectively Cantrell and Heymsfield (2005).
- Cantrell and Heymsfield (2005) W. Cantrell and A. Heymsfield, Bulletin of the American Meteorological Society 86, 795 (2005).
- Bartell et al. (2000) L. S. Bartell, Y. G. Chushak, and J. Huang, Structural Chemistry 11, 105 (2000), ISSN 1040-0400.
- Li et al. (2009) T. Li, D. Donadio, L. M. Ghiringhelli, and G. Galli, Nat Mater 8, 726 (2009).
- Chushak and Bartell (2000) Y. Chushak and L. S. Bartell, The Journal of Physical Chemistry A 104, 9328 (2000).
- Lü and Chen (2012) Y. Lü and M. Chen, Acta Materialia 60, 4636 (2012).
- Carvalho and Dalnoki-Veress (2011) J. L. Carvalho and K. Dalnoki-Veress, Eur Phys J E Soft Matter 34, 1 (2011).
- Djikaev et al. (2002) Y. S. Djikaev, A. Tabazadeh, P. Hamill, and H. Reiss, The Journal of Physical Chemistry A 106, 10247 (2002).
- Sigurbjörnsson and Signorell (2008) m. F. Sigurbjörnsson and R. Signorell, Physical Review E 77 (2008).
- Knopf (2006) D. A. Knopf, J Phys Chem A 110, 5745 (2006).
- Turner and Bartell (2005) G. W. Turner and L. S. Bartell, The Journal of Physical Chemistry A 109, 6877 (2005).
- Fornea et al. (2009) A. P. Fornea, S. D. Brooks, J. B. Dooley, and A. Saha, Journal of Geophysical Research-Atmospheres 114 (2009).
- Djikaev and Ruckenstein (2008b) Y. S. Djikaev and E. Ruckenstein, The journal of physical chemistry. A 112, 11677 (2008b).
- Gurganus et al. (2011) C. Gurganus, A. B. Kostinski, and R. A. Shaw, Journal of Physical Chemistry Letters 2, 1449 (2011).
- Gurganus et al. (2013) C. Gurganus, A. B. Kostinski, and R. A. Shaw, The Journal of Physical Chemistry C 117, 6195 (2013).
- Chakraverty and Pound (1964) B. Chakraverty and G. Pound, Acta Metallurgica 12, 851 (1964).
- Page and Sear (2006) A. J. Page and R. P. Sear, Phys. Rev. Lett. 97, 065701 (2006).
- van Meel et al. (2010) J. A. van Meel, R. P. Sear, and D. Frenkel, Physical Review Letters 105 (2010).
- de Gennes et al. (2004) P.-G. de Gennes, F. Brochard Wyart, and D. Quéré, Capillarity and Wetting Phenomena (Springer, 2004).
- Navascués and Tarazona (1981) G. Navascués and P. Tarazona, The Journal of Chemical Physics 75, 2441 (1981).
- Lazaridis (1993) M. Lazaridis, Journal of Colloid and Interface Science 155, 386 (1993).
- Weijs et al. (2011) J. H. Weijs, A. Marchand, B. Andreotti, D. Lohse, and J. H. Snoeijer, Physics of Fluids (1994-present) 23 (2011).
- Rowlinson and Widom (1982) J. S. Rowlinson and B. Widom, Molecular Theory of Capillarity, vol. sec. 8.6. (Dover, Oxford, U.K., 1982).
- Marmur (1997) A. Marmur, Journal of Colloid and Interface Science 186, 462 (1997).
- Berg et al. (2010) J. K. Berg, C. M. Weber, and H. Riegler, Phys. Rev. Lett. 105, 076103 (2010).
- (39) Values as large as J m-1 have been reported (see references in Marmur (1997)), which would correspond to a length scale m. Such large values have been questioned de Gennes et al. (2004) and recent values seem to be converging on the range J m-1 Toshev et al. (1988); Stöckelhuber et al. (2010); Pompe and Herminghaus (2000); Hienola et al. (2007); Berg et al. (2010).
- (40) Similarly, an increase in surface area by approximately two orders of magnitude would be required to explain Ervens and Feingold (2013). The surface area enhancement between our smooth and textured fibers is estimated to be less than a factor of two , whereas our observed temperature shift would require an increase in surface area of 6 orders of magnitude compared to the smooth catalyst.
- Auer and Frenkel (2003) S. Auer and D. Frenkel, Physical Review Letters 91 (2003).
- Hienola et al. (2007) A. I. Hienola, P. M. Winkler, P. E. Wagner, H. Vehkamäki, A. Lauri, I. Napari, and M. Kulmala, The Journal of Chemical Physics 126 (2007).
- Toshev et al. (1988) B. V. Toshev, D. Platikanov, and A. Scheludko, Langmuir 4, 489 (1988).
- Pompe and Herminghaus (2000) T. Pompe and S. Herminghaus, Physical Review Letters 85, 1930 (2000).
- Stöckelhuber et al. (2010) K. W. Stöckelhuber, B. Radoev, and H. J. Schulze, Coll. Surf. A 156, 323 (1999).
- Sear (2013) R. P. Sear, Atmospheric Chemistry and Physics 13, 7215 (2013).
- Ervens and Feingold (2013) B. Ervens and G. Feingold, Geophysical Research Letters 40, 3320 (2013), ISSN 1944-8007.