2Department of Astronomy, University of Illinois, 1002 West Green Street, Urbana, IL 61801, USA
3Now at Institute of Astronomy and Astrophysics, Academia Sinica, Taipei, Taiwan, R.O.C.
XMM-Newton RGS observations of the Cat’s Eye Nebula
We present an analysis of XMM-Newton Reflection Grating Spectrometer (RGS) observations of the planetary nebula (PN) NGC 6543, rendering it the second PN with high resolution X-ray spectroscopic observations besides BD 30∘3639. The observations consist of 26 pointings, of which 14 included RGS observations for a total integration time of 435 ks. Many of these observations, however, were severely affected by high-background levels, and the net useful exposure time is drastically reduced to 25 ks. Only the O vii triplet at 22 Å is unambiguously detected in the RGS spectrum of NGC 6543. We find this spectrum consistent with an optically thin plasma at 0.147 keV (1.7 MK) and nebular abundances. Unlike the case of BD 30∘3639, the X-ray emission from NGC 6543 does not reveal overabundances of C and Ne. The results suggest the N/O ratio of the hot plasma is consistent with that of the stellar wind, i.e., lower than the nebular N/O ratio, but this result is not conclusive.
Key Words.:
Planetary nebulae: general — planetary nebulae: individual (NGC 6543) — stars: winds, outflows — X-rays: ISM1 Introduction
Since the EXOSAT discovery of soft X-ray emission from NGC 1360 (de Korte et al. 1985), planetary nebulae (PNe) have been routinely targeted by all subsequent X-ray missions. Those first detections, attributed to the photospheric emission of hot central stars (CSPNe), were soon followed by reports of harder X-ray emission originating in hot plasmas (e.g., Leahy et al. 1994; Arnaud et al. 1996). The X-ray observations of PNe up to the ROSAT era (Guerrero et al. 2000) set the scene for the major leap in the study of their hot gas content made with the advent of Chandra and XMM-Newton (see Kastner et al. 2012; Ruiz et al. 2013, and references therein).
The production of hot gas is a fundamental prediction of the Interacting Stellar Winds (ISW) models of PN formation and evolution (Kwok et al. 1978; Balick 1987). According to these models, the fast stellar wind developed during the post-asymptotic giant branch (AGB) sweeps up the previous slow and dense AGB wind. As a reverse shock propagates into the fast stellar wind, the central cavity is expected to be filled with highly pressurized shocked fast wind at temperatures of 107–108 K. This hot gas is too tenuous to produce appreciable X-ray emission, but the mixing of cool nebular material into the hot interior at their interface lowers the temperature and raises the density of the hot interior gas, producing optimal conditions for soft X-ray emission (Steffen et al. 2008; Toalá & Arthur 2014). The detection of diffuse X-ray emission, first hinted by ROSAT (Kreysing et al. 1992), then finally resolved by Chandra (Kastner et al. 2000; Chu et al. 2001), marked a milestone in our understanding of the formation and evolution of PNe.
ChanPlaNS, the Chandra Planetary Nebula Survey, is producing an unbiased view of the X-ray emission from PNe within 1.5 kpc. This survey is revealing notable correlations between the diffuse X-ray emission of PNe and their nebular and stellar properties (Freeman et al. 2014), but these results are based on low-resolution CCD imaging spectroscopic observations, which cannot provide a comprehensive description of the physical conditions and chemical abundances of the hot gas in PNe. As a result, issues such as the extent of turbulent mixing, the inhibition of heat conduction by magnetic fields, the ionization equilibrium of the hot material, or the origin of the X-ray-emitting material cannot be properly addressed.
To date, high-dispersion X-ray spectra have been reported only for BD+30∘3639, the X-ray brightest PN. Its detailed Chandra Low Energy Transmission Gratings (LETG) high-dispersion X-ray spectrum (Yu et al. 2009) has revealed many physical details and clarified conflicting descriptions of the chemical composition of its hot gas derived from CCD low-dispersion spectroscopic-imaging observations (Maness et al. 2003; Murashima et al. 2006). The X-ray-emitting plasma has a temperature in the range 1.7106–2.9106 K, and the C and Ne abundances are unequivocally shown to be enhanced (Yu et al. 2009). This implies that the hot gas originated in nucleosynthesis processes that occurred deep in the AGB star, in the intershell where He-burning produced C. Since the C- and Ne-rich gas has not mixed with nebular material, it suggests that heat conduction and mixing between hot and cool gas do not dominate the physical conditions of the X-ray-emitting plasma in BD+30∘3639.
| Observation ID. | Rev. | Raw exposure times | Net exposure times | ||||||
|---|---|---|---|---|---|---|---|---|---|
| High bck. | Moderate bck. | Low bck. | |||||||
| RGS1 | RGS2 | RGS1 | RGS2 | RGS1 | RGS2 | RGS1 | RGS2 | ||
| [ks] | [ks] | [ks] | [ks] | [ks] | [ks] | [ks] | [ks] | ||
| 0300570101 | 1143 | 20.1 | 20.1 | 16.75 | 11.29 | 5.65 | 0.59 | 2.55 | … |
| 0300570201 | 1144 | 22.5 | 23.3 | 2.86 | 1.09 | 0.69 | 0.19 | 0.06 | 0.19 |
| 0300570301 | 1145 | 22.3 | 22.2 | 4.49 | 8.75 | 0.06 | 0.73 | 0.06 | 0.73 |
| 0300570401 | 1146 | 18.9 | 18.1 | 12.29 | 6.01 | 1.35 | 2.84 | 0.45 | 0.55 |
| 0300570601 | 1141 | 10.9 | 11.1 | 5.43 | 6.90 | 4.62 | 3.73 | 3.13 | 2.14 |
| 0300570801 | 1142 | 14.3 | 14.1 | 11.21 | 10.50 | 5.32 | 3.83 | 3.17 | 1.98 |
| 0300571501 | 1161 | 21.6 | 21.6 | 17.85 | 20.19 | 12.58 | 8.84 | 4.94 | 2.11 |
| 0300571701 | 1149 | 10.4 | 10.4 | 0.31 | 0.30 | 0.31 | 0.30 | 0.21 | 0.10 |
| 0300571901 | 1151 | 19.9 | 19.9 | 20.02 | 19.30 | 3.49 | 6.45 | 0.15 | 0.74 |
| 0300572101 | 1160 | 12.9 | 12.8 | 1.78 | 4.60 | … | … | … | … |
| 0300572401 | 1162 | 13.4 | 13.4 | 0.06 | 0.06 | … | … | … | … |
| 0300572601 | 1163 | 14.5 | 7.9 | 3.31 | 2.22 | … | … | … | … |
| 0300572801 | 1164 | 19.4 | 19.3 | 11.64 | 17.86 | 6.35 | 3.17 | 1.03 | 0.74 |
| TOTAL | 221.1 | 214.2 | 108.00 | 109.07 | 40.42 | 30.67 | 15.75 | 9.28 | |
High-dispersion spectroscopy of the diffuse X-ray emission from PNe would certainly represent a great advance in the derivation of physical conditions and chemical abundances of their hot gas, but it requires high X-ray fluxes. The second X-ray brightest PN for high-dispersion X-ray spectroscopic observations is NGC 6543, a.k.a., the Cat’s Eye Nebula. Chandra’s superb angular resolution allowed Chu et al. (2001) to resolve the X-ray emission from NGC 6543 into a faint point-like emission source associated with the central star (CSPN) and a diffuse component within the central cavity. In this paper we present high-dispersion X-ray spectra of NGC 6543 obtained with the Reflection Grating Spectrometers (RGS) on board XMM-Newton. The observations and data reduction are presented in §2. Special care has been taken to minimize the effects of extended periods of high background that compromised the data quality. The data have been used to gain insight into the physical conditions and chemical abundances of the hot gas inside this PN, as described in §3. The main results and conclusions are discussed in §4.
2 XMM-Newton Observations
The XMM-Newton observations of NGC 6543 consisted of 26 individual pointings obtained in 2006 March and April (PI: M.A. Guerrero). The European Photon Imaging Cameras (EPIC) was used for all of them, but the RGS were used for only 14. In the following, we will focus our analysis in the RGS data. Details of the different observations, arranged by their observation ID, are listed in Table 1.
The observations were reprocessed using the XMM-Newton Science Analysis Software (SAS) 13.5.0 with the XMM-Newton calibration files available in the Current Calibration File as of 2014 July 25. RGS event files were created using the SAS tool rgsproc. In order to identify and excise periods of high background from the observations, light curves in the 10–12 keV energy range for the CCD #9 of each RGS observation were created. These light curves showed that most of the observations suffered from high background levels. This is the result of the visibility window of NGC 6543 being close to the moment when the satellite approaches to its orbit perigee at the end of the revolution and to the observation dates in March and April. That orbital segment and seasonal period are known to exhibit the highest background levels (Gónzalez-Riestra & Rodríguez-Pascual 2014). The situation was further aggravated by the high solar activity in 2006. Indeed, the high levels of background emission detected by the radiation monitor raised the warning flag active and commanded some of the five XMM-Newton instruments to the safe or standby mode for some of the 26 observations initially planned.
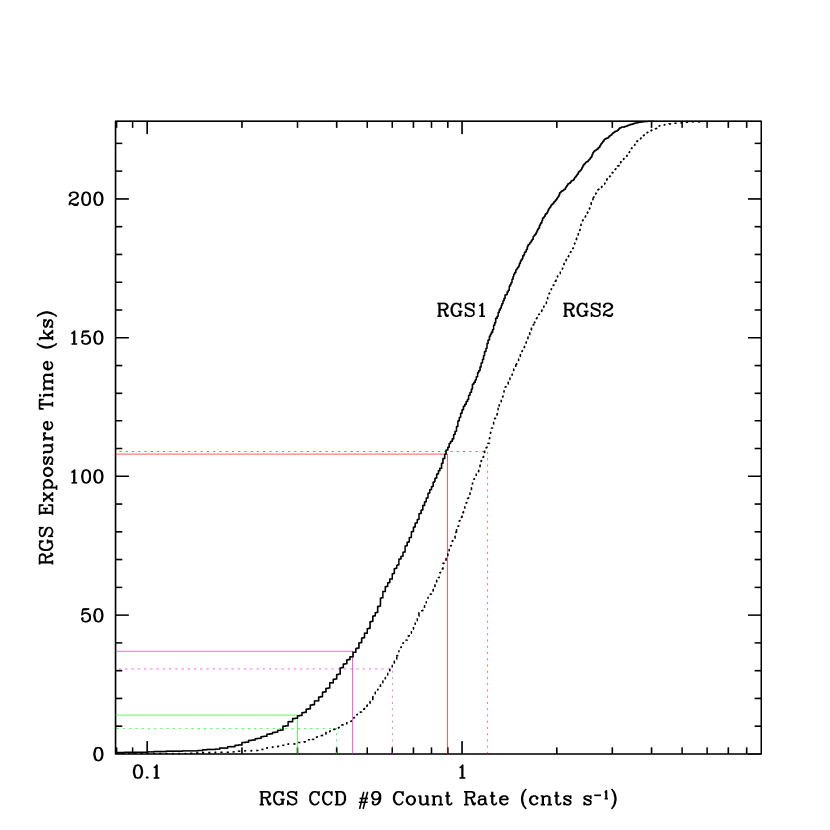
The cumulative frequency of the background count rate of the RGS1 and RGS2 CCD #9 is shown in Figure 1. We note that the RGS2 CCD #9 count rate is consistently a factor 4/3 higher than that of the RGS1 CCD #9. In order to assess the effects of background on the quality of the observations, we have extracted spectra for three levels of RGS1 and RGS2 CCD #9 count rates: high (0.9 cnts s-1 for RGS1 and 1.2 cnts s-1 for RGS2), moderate (0.45 cnts s-1 for RGS1 and 0.6 cnts s-1 for RGS2), and low (0.3 cnts s-1 for RGS1 and 0.4 cnts s-1 for RGS2). The net useful exposure times for individual spectra after processing are listed in Table 1, and the final combined spectra, with total exposure times of 217, 70, and 25 ks for the high-, moderate, and low-background spectra, respectively, are shown in Figure 2.
3 Results and discussion
An inspection of the spectra in Figure 2 identifies consistently the presence of an emission feature at 22 Å, which seems to correspond to the O vii triplet at 21.6, 21.8, and 22.1 Å. The spectra show continuum emission whose level declines as the background level is reduced. For the last spectrum, with the most stringent background reduction, there is little or negligible continuum emission. The emission from the O vii triplet is detected at a 5- level.
This spectrum is shown in more detail in Figure 3, where the wavelengths of emission lines that can be expected have been labeled. Besides the He-like lines of O vii, there is no significant evidence of the O viii 19.0 Å, N vi 29 Å, C vi 33.7 Å, and C v 35.0 Å lines, and only the N vii 24.8 Å emission line might have been detected at a low, questionable confidence level. When compared with the Chandra high resolution LETG spectrum of BD+30∘3639 (Yu et al. 2009), NGC 6543 shows also the O vii triplet, but the bright Ne ix 13.45 Å line and the relatively intense H-like lines of O viii and C vi in the former are completely absent in NGC 6543. These spectral variations imply notable differences in the physical conditions and/or chemical abundances of the X-ray-emitting plasma between these two PNe.

Obviously, the quality of the RGS spectrum of NGC 6543 is not suitable for deriving the physical conditions and chemical abundances of its hot gas by means of spectral fits. Instead, these will be investigated by comparing qualitatively the RGS spectrum with the spectra computed from different optically-thin plasma emission models. For this purpose, the XSPEC V12.8.2 apec code has been used. The chemical abundances of the emitting plasma have been assumed to be those of the nebula reported by Bernard-Salas et al. (2003), i.e., C/C⊙=0.9, N/N⊙=3.4, O/O⊙=1.1, and Ne/Ne⊙=2.2 (Asplund et al. 2009). These nebular abundances are otherwise similar to those of the stellar wind of the CSPN derived by Georgiev et al. (2008), whereas the high helium abundances (He/He⊙=60) of the stellar wind suggested by de Koter et al. (1996) can be completely discarded, as it would imply higher levels of continuum emission than line emission. Then, the hydrogen column density was set to =4.11020 cm-2, in accordance with its color excess =0.07 (Bernard-Salas et al. 2003). The plasma temperature implied by Chu et al. (2001), =0.147 keV (=1.7106 K), results in the synthetic spectrum shown in Figure 3 (black histogram).
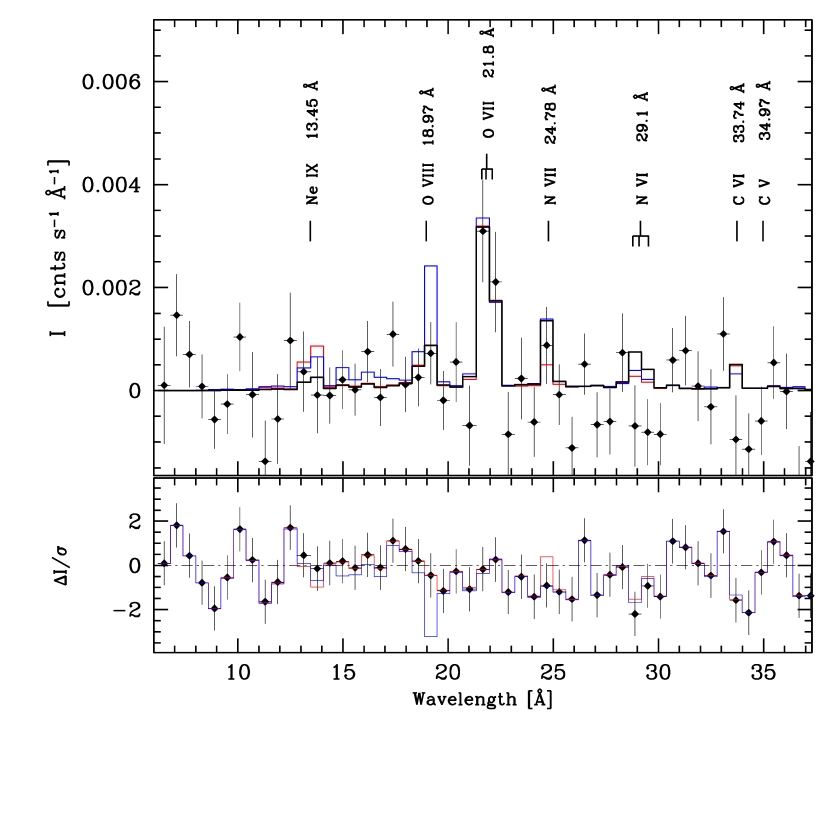
The intensity predicted for different emission lines is generally consistent with the observed spectrum. The nondetection of the O viii 19.0 Å implies an upper limit of 0.19 keV for the plasma temperature, as constrained by the 3- level of the line intensity (blue histogram in Fig. 3). The C and Ne abundances are also consistent with the observed spectrum, but it should be noted that an increase in the Ne abundances by a factor of 4 and a depletion of the N abundances by a factor of 3 would still produce acceptable results (red histogram in Fig. 3). The conspicuous absence of the N vi 29.1 Å triplet may hint at a solar abundance for N, as the alternative way to diminish the line intensity by raising the plasma temperature is constrained by the upper limit in temperature imposed by the O vii to O viii line ratios. Moreover, the absence of emission from this triplet sets a lower limit for the plasma temperature not much lower than the temperature of 0.147 keV used in our main model.
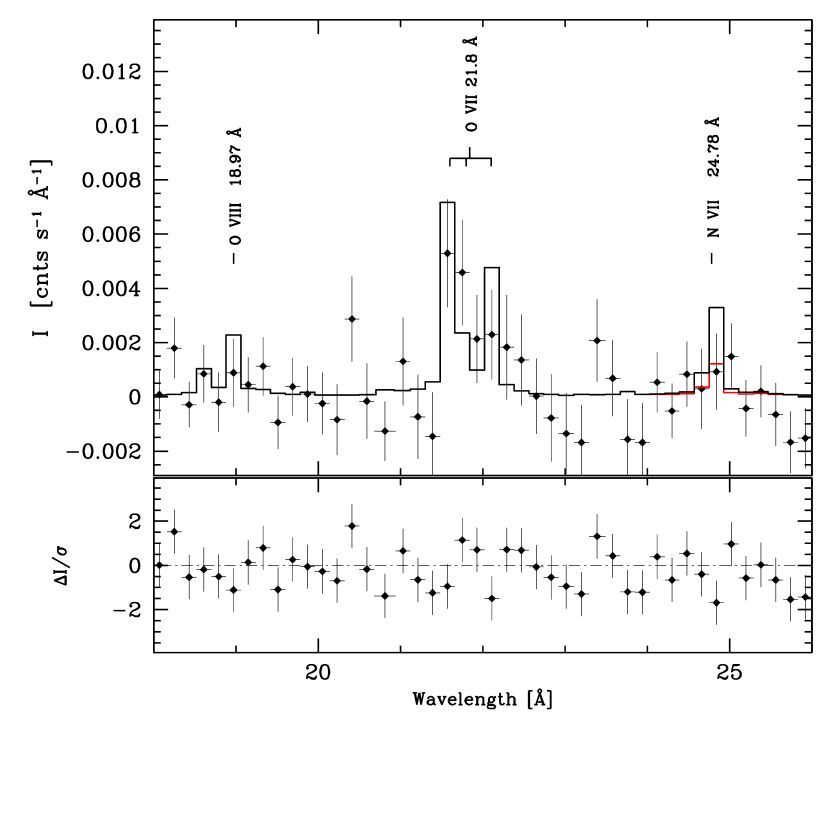
A higher resolution close-up of the spectrum is shown in Figure 4. In this spectrum, the components of the O vii triplet are resolved. Within the uncertainties, the relative intensities of the O vii 21.60 Å resonance (r), 21.80 Å intercombination (i), and 22.10 Å forbidden (f) lines are consistent with those of a coronal plasma, as expected for the low densities of the plasma inside the hot bubbles of PNe. The nondetection of the H-like lines of N vii at 24.78 Å and O viii at 18.97 Å is noticeable. The lack of O viii emission sets a reliable upper limit for the plasma temperature, but this is problematic for the Ly- line of N vii. A plasma temperature lower than the adopted value of 0.147 keV would imply a brighter N vi 29.1 Å triplet, which is completely absent. This seems to indicate that the actual abundance of N in the X-ray-emitting plasma is lower than those used in our model, N/N⊙=3.4. For comparison, a model with solar N/O ratio is also shown (red histogram in Fig. 4).
The plasma temperature constrained by the XMM-Newton RGS spectrum is consistent with that reported in previous studies of the diffuse X-ray emission of NGC 6543 based on Chandra ACIS data (Chu et al. 2001; Maness & Vrtilek 2003). The nondetection of the H-like line of O viii, contrary to the case of BD+30∘3639, implies a lower temperature for the X-ray-emitting plasma of NGC 6543. There is no evidence for an enhancement of the C and Ne abundances similar to those derived for BD+30∘3639 using Chandra LETG (Yu et al. 2009); the C/O ratio of 15-45 found in BD+30∘3639 is not seen in NGC 6543, but Ne abundances several times solar can not be completely excluded.
The RGS spectrum of NGC 6543 sheds some light on the disputed N/O ratio of the X-ray-emitting plasma in this nebula (Chu et al. 2001; Maness & Vrtilek 2003). The weak or absent N vii and N vi emission lines implies low N abundances. The N/O ratio is apparently closer to the ratio of 1.65N⊙/O⊙ found for the stellar wind (Georgiev et al. 2008) than to the ratio of 3.4N⊙/O⊙ found in the nebula (Bernard-Salas et al. 2003). We caution, however, that the low signal-to-noise ratio of the RGS spectrum does not allow us to obtain an accurate estimate of the N/O ratio.
4 Conclusions
We have presented XMM-Newton RGS observations towards the Cat’s Eye Nebula, NGC 6543. The total RGS exposure time was 435.3 ks, but the observations were severely affected by high-energy background episodes that reduce significantly the quality expected for this data set. Different levels of background emission have been considered and analyzed to make the best use of the data. Unfortunately, only the most stringent levels of background emission allow a reliable analysis of the spectrum of NGC 6543. In the end, the net useful exposure time of the spectrum used for analysis is 25 ks, i.e., only a meager 6% of the total exposure time.
This is the second PN reported with high resolution spectroscopic observations apart from BD 30∘3639 (Yu et al. 2009). The final background-subtracted combined RGS spectrum only shows a clear detection of the He-like triplet of O vii at 22 Å, whereas the N vii 24.78 Å line is only tentatively detected. The weakness or absence of the H-like O viii line points to lower X-ray temperatures than in BD+30∘3639. Indeed, we find the X-ray temperature to be consistent with that derived from the Chandra ACIS low-resolution spectrum, keV or K (Chu et al. 2001). Otherwise, the weakness or absence of Ne and C lines indicates much lower Ne/O and C/O than those of BD+30∘3639 derived from its LETG spectrum. The weakness of the N lines suggests a low N/O ratio as well, although we note the data quality is not sufficient for a solid statement.
The laborious X-ray analysis of the XMM-Newton RGS observations of NGC 6543 and the low quality of this data set unveil the difficulties for the X-ray study of PNe at high dispersion. Hopefully, Astro-H and Athena will be able to extend in the future (Nandra et al. 2013; Takahashi et al. 2012) the deep Chandra and XMM-Newton grating observations of the X-ray brightest PNe. In particular, the Soft X-ray Spectrometer (SXS), a microcalorimeter on board Astro-H, to be launched next year, may soon provide us with improved-quality high-dispersion X-ray spectra of PNe.
Acknowledgements.
J.A.T. and M.A.G. are partially funded by AYA 2005-01495 of the Spanish MEC (Ministerio de Educacion y Ciencia) and AYA 2011-29754-C03-02 of the Spanish MICINN (Ministerio de Ciencia e Innovación) co-funded with FEDER funds. J.A.T. acknowledges support by the CSIC JAE-Pre student grant 2011-00189. Y.-H.C. and R.A.G. acknowledge the support of the NASA XMM-Newton Guest Observer grant NNG06GE67G for this research project. We thank the referee, J.H. Kastner, for his helpful comments.References
- Arnaud et al. (1996) Arnaud, K., Borkowski, K. J., & Harrington, J. P. 1996, ApJ, 462, L75
- Asplund et al. (2009) Asplund, M., Grevesse, N., Sauval, A. J., & Scott, P. 2009, ARA&A, 47, 481
- Balick (1987) Balick, B. 1987, AJ, 94, 671
- Bernard-Salas et al. (2003) Bernard-Salas, J., Pottasch, S. R., Wesselius, P. R., & Feibelman, W. A. 2003, A&A, 406, 165
- Chu et al. (2001) Chu, Y.-H., Guerrero, M.A., Gruendl, R.A., Williams, R.M., & Kaler, J.B. 2001, ApJ, 553, L69
- de Koter et al. (1996) de Koter, A., Heap, S.R., Hubeny, I., & Lanz, T. 1996, in ASP Conf. Ser. 96, Hydrogen-deficient Stars, ed. C.S. Jeffery & U. Heber (San Francisco: ASP), 141
- de Korte et al. (1985) de Korte, P. A. J., Claas, J. J., Jansen, F. A., & McKechnie, S. P. 1985, Advances in Space Research, 5, 57
- Dyson & Williams (1997) Dyson, J. E., & Williams, D. A. 1997, The physics of the interstellar medium. Edition: 2nd ed. Publisher: Bristol: Institute of Physics Publishing, 1997. Edited by J. E. Dyson and D. A. Williams. Series: The graduate series in astronomy.
- Freeman et al. (2014) Freeman, M., Montez, R., Jr., Kastner, J. H., et al. 2014, ApJ, in press, arXiv:1407.4141
- Georgiev et al. (2008) Georgiev, L. N., Peimbert, M., Hillier, D. J., et al. 2008, ApJ, 681, 333
- Gónzalez-Riestra & Rodríguez-Pascual (2014) Gónzalez-Riestra, R., & Rodríguez-Pascual, P.M. 2014, The Behaviour of the XMM-Newton Background: From the beginning of the mission until May 2014, XMM-SOC-GEN-TN-0014
- Guerrero & De Marco (2013) Guerrero, M. A., & De Marco, O. 2013, A&A, 553, A126
- Guerrero et al. (2001) Guerrero, M. A., Chu, Y.-H., Gruendl, R. A., Williams, R. M., & Kaler, J. B. 2001, ApJ, 553, L55
- Guerrero et al. (2000) Guerrero, M. A., Chu, Y.-H., & Gruendl, R. A. 2000, ApJS, 129, 295
- Kastner et al. (2012) Kastner, J. H., Montez, R., Jr., Balick, B., et al. 2012, AJ, 144, 58
- Kastner et al. (2000) Kastner, J. H., Soker, N., Vrtilek, S. D., & Dgani, R. 2000, ApJ, 545, L57
- Kreysing et al. (1992) Kreysing, H. C., Diesch, C., Zweigle, J., et al. 1992, A&A, 264, 623
- Kwok et al. (1978) Kwok, S., Purton, C. R., & Fitzgerald, P. M. 1978, ApJ, 219, L125
- Leahy et al. (1994) Leahy, D. A., Zhang, C. Y., & Kwok, S. 1994, ApJ, 422, 205
- Maness & Vrtilek (2003) Maness, H., & Vrtilek, S. D. 2003, PASP, 115, 1002
- Maness et al. (2003) Maness, H. L., Vrtilek, S. D., Kastner, J. H., & Soker, N. 2003, ApJ, 589, 439
- Murashima et al. (2006) Murashima, M., Kokubun, M., Makishima, K., et al. 2006, ApJ, 647, L131
- Nandra et al. (2013) Nandra, K., Barret, D., Barcons, X., et al. 2013, arXiv:1306.2307
- Patriarchi & Perinotto (1991) Patriarchi, P., & Perinotto, M. 1991, A&AS, 91, 325
- Ruiz et al. (2013) Ruiz, N., Chu, Y.-H., Gruendl, R. A., et al. 2013, ApJ, 767, 35
- Soker (1994) Soker, N. 1994, AJ, 107, 276
- Steffen et al. (2008) Steffen, M., Schönberner, D., & Warmuth, A. 2008, A&A, 489, 173
- Takahashi et al. (2012) Takahashi, T., Mitsuda, K., Kelley, R., et al. 2012, Proc. SPIE, 8443,
- Toalá & Arthur (2014) Toalá, J.A., & Arthur, S.J. 2014, MNRAS, 443, 3486
- Yu et al. (2009) Yu, Y. S., Nordon, R., Kastner, J. H., et al. 2009, ApJ, 690, 440