natasha@imperial.ac.uk
FUSE: Multiple Network Alignment via Data Fusion
Abstract
Discovering patterns in networks of protein-protein interactions (PPIs) is a central problem in systems biology. Alignments between these networks aid functional understanding as they uncover important information, such as evolutionary conserved pathways, protein complexes and functional orthologs. However, the complexity of the multiple network alignment problem grows exponentially with the number of networks being aligned and designing a multiple network aligner that is both scalable and that produces biologically meaningful alignments is a challenging task that has not been fully addressed. The objective of a multiple network alignment is to create clusters of nodes that are evolutionarily conserved and functionally consistent across all networks. Unfortunately, the alignment methods proposed thus far do not fully meet this objective, as they are guided by pairwise scores that do not utilize the entire functional and topological information across all networks.
To overcome this weakness, we propose FUSE, a multiple network aligner that utilizes all functional and topological information in all PPI networks. It works in two steps. First, it computes novel similarity scores of proteins across the PPI networks by fusing from all aligned networks both the protein wiring patterns and their sequence similarities. It does this by using Non-negative Matrix Tri-Factorization (NMTF). When we apply NMTF on the five largest and most complete PPI networks from BioGRID, we show that NMTF finds a larger number of protein pairs across the PPI networks that are functionally conserved than can be found by using protein sequence similarities alone. This demonstrates complementarity of protein sequence and their wiring patterns in the PPI networks. In the second step, FUSE uses a novel maximum weight -partite matching approximation algorithm to find an alignment between multiple networks. We compare FUSE with the state of the art multiple network aligners and show that it produces the largest number of functionally consistent clusters that cover all aligned PPI networks. Also, FUSE is more computationally efficient than other multiple network aligners.
Keywords:
Multiple network alignment, -partite matching, data fusion, non-negative matrix tri-factorisation1 Introduction
Understanding the patterns in molecular interaction networks is of foremost importance in systems biology, as it is instrumental to understanding the functioning of the cell [33]. A large number of studies focused on understanding the topology of these networks [32, 29]. Network alignment started as a pairwise problem: given two networks, aligning them means finding a node-to-node mapping (called an alignment) between the networks that groups together evolutionarily or functionally related proteins between the networks. These methods uncovered valuable information, such as evolutionarily conserved pathways and protein complexes [20, 24], and functional orthologs [3]. Finding these allows transfer of information across species, such as performing Herpes viral experiments in yeast or fly and then applying the insights towards understanding the mechanisms of human diseases [39].
The pairwise network alignment problem is computationally intractable due to NP-completeness of the underlying sub-graph isomorphism problem [7]. Hence, several pairwise network alignment heuristics have been proposed. Early methods, called local network aligners, search for small, but highly conserved sub-networks [21, 23, 10]. As such sub-networks can be duplicated, local network aligners often produce one-to-many or many-to-many mappings, in which a node from a given network can be mapped to several nodes of the other network. While these multiple mappings can indicate gene duplications, they are often biologically implausible [36]. Hence, global network aligners, which perform an overall comparison of the input networks and produce one-to-one mappings between the nodes of the two networks have been introduced (see [6] for the most recent comparison of pairwise network aligners).
The number of known protein-protein interactions (PPIs) increased dramatically over the last two decades thanks to the technological advances in high-throughput interaction detection techniques, such as yeast two-hybrid [16, 38] and affinity purification coupled to mass spectrometry [14]. With the availability of PPI networks of multiple species came the multiple network alignment problem, where given networks, aligning them means to group together the proteins that are evolutionarily or functionally conserved between the networks. Similar to pairwise network alignment, multiple network alignment can be local or global, with node mappings one-to-one or many-to-many. As the complexity of the problem grows exponentially with the number of networks to be aligned, the proposed multiple network alignment algorithms use simple and scalable alignment schemes. The pioneering multiple network alignment algorithm is NetworkBLAST [35, 18], which greedily searches for highly conserved local regions in the alignment graph constructed from the pairwise protein sequence similarities. Graemlin [10] produces local multiple network alignments using a progressive alignment scheme, by successively performing pairwise alignments of the closest network pairs. IsoRank [37] and its successor IsoRankN [26] are the first multiple network aligners that do not only use pairwise sequence similarity to guide their alignment processes, but also take into account the topology (i.e., wiring patterns) around the two nodes in their corresponding networks to build up global many-to-many multiple network alignments, using a derivative of Google’s PageRank algorithm. Smetana [34] also produces global many-to-many multiple network alignments using both pairwise sequence scores and pairwise topological scores, which are derived from a semi-Markov random walk model. While NetCoffee [15] does not use topological information to build its global one-to-one alignment, it is the first multiple network aligner in which the score for mapping two nodes does not only depend on the scores in pairs of networks, but also on their conservation across all PPI networks being aligned, by using a triplet approach similar to the multiple sequence aligner, T-Coffee [30]. Finally, Beams [1] is a fast heuristics that constructs global many-to-many multiple network alignments from the pairwise sequence similarities of the nodes by using a backbone (seed) extraction and merge strategy. In the above mentioned aligners, most of the node mapping scores are local, in the sense that they only consider the sequence similarity or the topological similarity of the nodes. The only exception is NetCoffee, but its global scores are only based on sequence similarity and do not take into account the topology of the networks.
To overcome these limitations, we propose FUSE, a novel multiple network aligner that consists of two parts. In the first part, we compute novel similarity (association) scores between proteins by fusing sequence similarities and network wiring patterns over all proteins in all PPI networks being aligned. We do this by using Non-negative Matrix Tri-Factorization (NMTF) technique [42], initially used for co-clustering heterogeneous data, but recently proposed as a data fusion technique as well. NMTF has demonstrated a great potential in addressing various biological problems, such as drug-induced liver injuries prediction [43], disease association prediction [40] and gene function prediction [12, 44]. We apply NMTF on the PPI networks of the five species that have the largest and the most complete sets of PPIs in BioGRID database [5]. On this dataset, the fusion process changes the values of sequence similarities between proteins based on network topologies, so that some of the sequence similarities that existed before fusion disappear (about 41% in our experiments), while a large set of new ones is created by the matrix completion property of NMTF [22]. We show that the set of protein pairs predicted to be similar by NMTF, which contains 38 times more pairs than the set of sequence-similar pairs due to fusion with network topology, has the same functional consistency (i.e., shared GO terms across the pairs) as the set of protein pairs found to be similar by sequence alignment. To avoid losing sequence similarity information, our final functional similarity score for a pair of protein is a weighted sum of the sequence similarity and the similarity predicted by NMTF.
In the second part of FUSE, to construct a global one-to-one multiple network alignment, first we construct an edge-weighted -partite graph, with the proteins of each of the PPI networks being partitions of its node set and the above described functional similarity scores being edge weights. To construct a multiple network alignment, we find a maximum weight -partite matching in this graph. As finding a maximum weight -partite matching is NP-hard [19], we propose a novel approximation algorithm for it.
We evaluate the performance of FUSE against other state of the art multiple network aligners and show that FUSE produces the largest number of functionally consistent clusters that map proteins over all aligned networks. Moreover, we show that FUSE is scalable and computationally more efficient than all of the previous aligners except Smetana (but Smetana’s aligned proteins are not as functionally consistent as FUSE’s; detailed below). Specifically, the data-fusion step is the most time consuming in FUSE with the time complexity of , where is the number of proteins in the largest PPI network being aligned, while the alignment step has a smaller time complexity of , where is the number of proteins in all PPI networks and is the number of functional associations (similarity scores) between them.
2 Materials and methods
2.1 Datasets
From BioGRID (v3.2.111, April 25th, 2014) [5], we obtained the PPI networks of the 5 organisms having the largest and the most complete sets of physical PPIs: Homo sapiens (HS), Saccharomyces cerevisiae (SC), Drosophila melanogaster (DM), Mus musculus (MM), and Caenorhabditis elegans (CE). We retrieved the corresponding protein sequences from NCBI’s Entrez Gene database [28] and computed their pairwise similarities using BLAST [2]. We also retrieved from NCBI’s Entrez Gene database the Gene Ontology (GO) annotations of the proteins. Note that we only used experimentally validated GO annotations (i.e, excluding the annotations from computational analysis evidence such as sequence similarity) and that we additionally excluded annotations derived from protein-protein interaction experiments (code IPI). To standardize the GO annotations of proteins, similar to the evaluation methods of [37, 26, 1], we restrict the protein annotations to the fifth level of the GO directed acyclic graph by ignoring the higher-level annotations and replacing the deeper-level annotations with their ancestors at the restricted level. The network statistics are detailed in Table 1.
| Id | # Nodes | BP Ann. (%) | MF Ann. (%) | CC Ann. (%) | # Edges |
|---|---|---|---|---|---|
| HS | 14,164 | 37.2 | 23.2 | 9.6 | 127,907 |
| SC | 6,004 | 65.0 | 41.7 | 17.4 | 223,008 |
| DM | 8,125 | 36.1 | 13.4 | 6.3 | 38,892 |
| MM | 5,105 | 53.3 | 23.9 | 10.6 | 11,061 |
| CE | 3,841 | 35.0 | 7.3 | 4.2 | 7,726 |
2.2 Method
The PPI of each species is represented by a graph (network), , where the nodes in represent proteins, and where two proteins are connected by an edge in if they interact. Our multiple network alignment strategy consists of two steps. In the next two paragraphs, we give a short overview of these steps, before giving the full details of the methodology.
First, we use all PPI networks to be aligned and all the protein sequence similarities between them, as inputs into the NMTF-based data fusion technique to compute new protein similarity scores between the proteins of the networks. Considering the obtained normal distribution of similarity scores for aligning the 5 PPI networks described above, we define as significant the scores that are in top 5%. We combine significant scores with the original sequence similarities to derive the final functional scores between pairs of proteins for the reasons explained is section 3.1. We construct an edge-weighted -partite graph , where the node set is the union of the nodes sets (proteins) of the input PPI networks; two nodes , , , are connected by an edge in if their functional score is greater than zero; the corresponding edge weight in is their functional score. No edge exists between nodes coming from the same subset by definition of a -partite graph.
Second, we construct a one-to-one global multiple network alignment by using an approximate maximum weight -partite matching solver on .
2.2.1 Non-negative matrix tri-factorization.
NMTF is a machine learning technique initially designed for co-clustering of multi-type relational data [41, 42]. In this paper, we consider proteins belonging to different species as different data types. In the case of two species, and , the sequence similarity scores between their proteins are recorded in the high-dimensional relation matrix, , where, is the number of proteins in the species and is the number of proteins in the species . Entries in the relation matrix are -values of the protein sequence alignments computed by using BLAST. Specifically, we use as a measure of association between protein pairs. NMTF estimates the high-dimensional matrix, as a product of low-dimensional non-negative matrix factors: , where, and correspond to the cluster indicator matrices of proteins in the first and the second species respectively, and is a low-dimensional, compressed version of , where the choice of rank parameters provides dimensionality reduction. The close connection between non-negative matrix factorization problem and the clustering problem is well established [42, 9, 8].
In addition to co-clustering, NMTF technique can also be used for matrix completion. Namely, some entries in the initial relation matrix are zero (due to lack of sequence similarities between the corresponding proteins) and they can be recovered from the obtained low-dimensional matrix factors using the reconstructed relation matrix: (detailed bellow). Here we use this property to predict new and recover the existing association between proteins. To obtain the low-dimensional matrix factors, , we solve the following optimization problem:
We incorporate PPI network topology as constraints into our optimization problem; violation of these constraints causes penalties to our objective function. This is motivated by the co-clustering problem which uses networks as prior information to cluster proteins. Namely, the aim is to allow proteins interacting within a PPI network to belong to the same cluster. Interactions between proteins in PPI network, , are represented by a graph Laplacian matrix, , where is the adjacency matrix of network and is the diagonal degree matrix of (i.e., diagonal entries in are row sums of ). For all five of our PPI networks we construct a Laplacian matrix, resulting in the set: .
We use a block-based representation of relation () and Laplacian () matrices and matrix factors ( and ) for our 5 PPI networks as follows:
To simultaneously factorize all relation matrices, , , under the constraints of PPI networks, we minimize the following objective function:
| (1) |
where denotes the trace of a matrix and is a regularization parameter which balances the influence of network topologies in reconstruction of the relation matrix. The second term of equation 1 is the penalization term. It takes into account protein connections within the PPI network in the following way: connected pairs of proteins are represented with negative entries in the Laplacian matrix of the corresponding PPI network, and these entries act as rewards that reduce the value of the objective function, , forcing the proteins to belong to the same cluster.
The optimization problem (Equation 1) is solved by applying the algorithm following multiplicative update rules used to compute matrices and and under which the objective function, , is non-increasing [41]. These update rules are derived by minimizing the Langragian function, , constructed from the objective function and all additional constraints, including positivity of matrix factors , as follows [41]. The update rule for is obtained by fixing the other matrix factor, , and finding the roots of the equation: . A similar procedure is followed for obtaining the update rule for matrix factor . The multiplicative update rules, their derivation and the proof of their convergence can be found in [41].
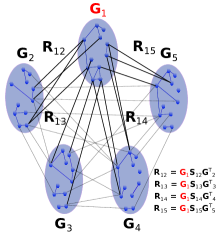
The central idea of the NMTF-based data fusion approach lies in the fact that the relation matrices are not factorized separately, but instead, are coupled by the same low-dimensional matrix factors, , which participate in their simultaneous decomposition [40] (see left panel of Figure 1 for an illustration). This corresponds to the intermediate data fusion approach (which keeps the structure of the data while inferring a model), that has been shown to be the most accurate from all data fusion approaches [25, 11, 40].
In our study, we use the the following values of parameters for NMTF: (a) factorization ranks, , , , and , which we estimated by computing principal components of relation matrices by using Principal Component Analysis (PCA) [17]; (b) we chose regularization parameter, , since it gave the best biological quality of predicted associations (we tested NMTF for ).
After convergence of NMTF, we compute reconstructed relation matrices: for each pair of networks, and . We compute the functional scores of associations between proteins from the statistically significant scores () predicted from the reconstructed matrices to which we add sequence similarity scores. We do this to avoid losing sequence information since a large number of initial associations is not recovered after NMTF procedure (see Section 3.1 for details).
2.2.2 Approximate maximum weight -partite matching.
Using the weighted k-partite graph representation described above, we globally align multiple networks by finding a maximum weight -partite matching in (defined above). Maximum weight -partite matching is known to be NP-hard for [19, 31]. Hence, we approximate it as follows.
We modify the algorithm proposed by He et al. [13] for finding an approximate solution to the -partite matching problem. We define the following graph merge operation. Let be an edge-weighted -partite graph, and be the edge-weighted bi-partite subraph of that is induced by the two subsets of nodes and . Let = be a matching of , where means that node is matched with node . We merge with into by identifying the mapped nodes and by creating a corresponding merged node . These merged nodes inherit the edges from their parent nodes, and multiple edges are replaced by a single edge with the sum of weights of the multiple edges as the new weight of the edge. We also move into the nodes of and that are not matched. The new weighted graph is called the merge of to from along . We note that is an edge-weighted partite graph.
Our approximated maximum weight -partite matching algorithm can be seen as a progressive aligner which first maps and merges the two first networks, and then successively adds into the “merge graph” the remaining networks (see Algorithm 1).
The main operation in Algorithm 1 is finding a maximum weight matching in an induced bi-partite graph, which takes time [4, 27], when the -partite graph has and edges. There are such operations, hence Algorithm 1 computes an approximate solution for the maximum weight -partite matching problem in time.
3 Results
3.1 Biological assessment of NMTF predicted protein similarities
The input data consist of sequence similarities between all proteins in the PPI networks of the 5 species. Using these similarities as input, the NMTF outputs significant similarities (top 5%), obtained from the reconstructed relation matrices. These significant similarities, resulting from NMTF, cover 58.61% of the input sequence similarities (reconstructed), while the remaining similarities, resulting from NMTF, are predicted.
To estimate the impact of PPI network topology on prediction of protein similarities and to understand why 41.39% of the initial sequence similarities are not reconstructed through factorization process, we perform the following experiment: for each reconstructed, predicted and non-reconstructed protein pair, we count the number of significant sequence similarities between their neighbors in the corresponding PPI networks. For the protein pairs with reconstructed sequence similarities, we find that their neighbors share on average significant sequence similarities. In contrast, a much smaller number of sequence similar neighbors, on average, is observed for the protein pairs with non-reconstructed similarities. Finally, the largest average number of similarities between neighboring proteins, , exists for protein pairs with predicted similarities. This means that NMTF induces new and reconstructs existing similarities between proteins that have many sequence similar neighbors in the corresponding PPI networks. Hence, the sequence similarity of protein pairs without many sequence similar neighbors in their PPI networks will be lost in NMTF process.
 |
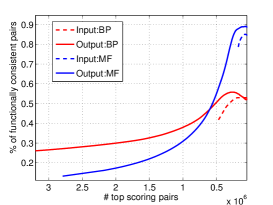 |
To assess the functional consistency of NMTF-predicted protein similarities, we compute the the cumulative number of predicted protein pairs and the percentage of them sharing GO term (MF and BP GO terms). Compared with input sequence similar pairs, NMTF produces more functionally consistent paired proteins (right panel of Figure 1). This means that topologies of PPI networks contribute to functional coherence of protein pairs predicted to be similar by NMTF.
3.2 FUSE-ing PPI networks
We FUSE the five PPI networks and assess its results against other multiple network aligners, Beams [1] and Smetana [34]. We tried to obtained alignments from IsorankN [26] and NetCoffee [15], but the computations did not finish after more than one week. We use BLAST e-values as input sequence scores for all methods, using as the similarity measure. Both FUSE and Beams use parameter to balance the amount of input protein sequence similarity versus network topology. For these methods, we sample from 0 to 1, in increments of 0.1. We left the other parameters of Beams and all the parameters of Smetana at their default values.
Evaluation based on coverage.
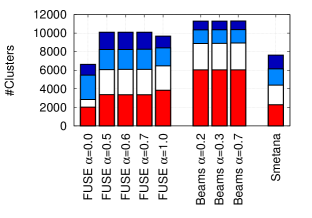
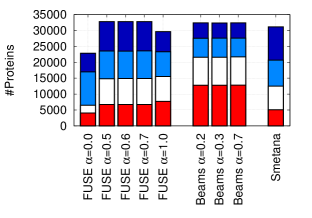
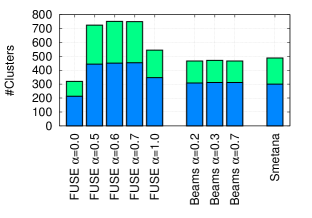
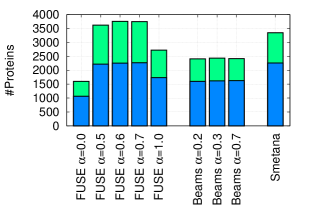
First, we compare the network aligners on their ability to form protein clusters that cover all of the input PPI networks. The -coverage is the number of clusters containing proteins from different PPI networks. Because the number of proteins per cluster may vary, the -coverage is also expressed in terms of the number of proteins that are in these clusters. The total coverage considers all clusters containing proteins from at least two networks. The coverage statistics of the alignments are summarised in Figure 2.
 |
|
FUSE produces larger number of good clusters (containing proteins from all five species, in dark blue in Figure 2), producing 1,855 of such clusters. Beams achieves the highest total coverage (with up to 11,302 clusters containing proteins from two to five species), but it does so by producing the largest number of bad clusters (containing proteins from only two species, in red in Figure 2), producing up to 6,046 of such clusters, and the smallest number of good ones (937 clusters containing 4,803 proteins).
When the coverage is expressed in terms of number of protein in the clusters (right panel of Figure 2), the coverages of FUSE and of Smetana are equivalent. This means that Smetana puts more proteins in its clusters, and as we show in the next experiment, it does so at the cost of the functional consistency of the clusters. The total coverage of Beams is equivalent to the one of FUSE and Smetana, but again because Beams puts a larger number of proteins in clusters that covers only two species (with up to 12,805 proteins in these clusters).
Interestingly, for FUSE, the best coverages are obtained for , when the functional similarity between proteins is a combination of their sequence similarity and of their NMTF predicted similarity, which shows the complementarity of network topology and protein sequence as sources of biological information.
Evaluation based on functional consistency.
We assess functional homogeneity of the clusters obtained by each method. We say that a cluster is annotated if at least two of its proteins are annotated by a GO term. We say that an annotated cluster is consistent if all of its annotated proteins have at least one common GO term. The ratio of all consistent clusters to all annotated clusters we call specificity. Another consistency measure that is used in previous studies [26, 34, 1] is the mean normalized entropy (MNE). The normalized entropy of an annotated cluster is defined as , where is the fraction of proteins in with the annotation , and represents the number of different annotations in . MNE is the average of the normalized entropy of all annotated clusters. We compare FUSE, Beams and Smetana on their ability to uncover functionally conserved proteins across all input networks, by measuring the consistency, specificity and MNE of their clusters that contain proteins from all five networks (see Figure 3 and supplementary material Table 1. We consider GO annotations from biological process (BP) and molecular function (MF) separately and do not consider cellular component (CC) annotations, as CC only annotate 9.7% of the proteins in the five networks.
 |
|
For BP, FUSE (with ) outperforms other aligners: it creates the largest number of consistent clusters, the largest number of proteins in these consistent clusters, the highest specificity, and the lowest MNE. For MF, FUSE (with ) obtains the largest number of consistent clusters and of proteins within these consistent clusters, but it is outperformed by Beams in terms of specificity and MNE. However, Beams achieves these higher specificity and lower MNE by producing smaller number of MF consistent clusters.
Finally, FUSE, obtains the best results when using a combination of sequence similarities and NMTF predicted similarities. Including predicted similarities () allows for finding up to 51% more of BP consistent clusters and up to 31% more of MF consistent clusters than when using sequence similarity alone (). Also, we note that these larger numbers of consistent clusters and proteins are not obtained at the cost of specificity (see supplementary material Table 1.).
FUSE is also computationally efficient and scalable. The matrix factorization step is an time operation, where is the number of proteins in the largest PPI network. On our dataset, the matrix factorization step is the most time consuming, and requires 20 hours to complete. The alignment step has a smaller time complexity of , where is the number nodes in FUSE’s -partite graph (i.e., the total number of proteins in all PPI networks), and is the total number of edges in FUSE’s -partite graph, and on our dataset the alignment process requires less than 15 minutes. The time complexity of Beams is , where is the maximum degree of a node in Beams’ -partite graph. Beams complexity becomes larger than FUSE’s one when its -partite graph becomes denser (i.e., when tends to ). Aligning our PPI networks with Beams requires 78 hours. Finally, Smetana has the lowest time complexity of , and on our dataset it requires 1 hours, but produces an alignment that have lower functional consistency than the ones of FUSE.
4 Conclusions
In this paper we propose FUSE, a novel global multiple network alignment algorithm which can efficiently align even the largest currently available PPI networks. FUSE computes novel similarity scores between the proteins in PPI networks by fusing all PPI network topologies and their protein sequence similarities by using non-negative matrix tri-factorization. We show that these new similarities complement solely sequence-based ones: NMTF predicts as similar 38 times more protein pairs than sequence alone does and these predicted protein pairs are functionally consistent. This demonstrates the power of data integration and contribution of network topology to sequence-based methods for finding functionally consistent proteins in different species.
We define new functional similarity scores between the proteins by combining the similarity scores obtained by NMTF with the sequence-based ones using a user-defined balancing parameter to either favour one or the other. FUSE uses these functional scores to construct global one-to-one multiple network alignment by using a novel maximum weight k-partite matching heuristic algorithm.
We compare the alignments of FUSE to the ones of the state-of-the art
aligners, Beams and Smetana, and find that when considering the clusters
that cover all input networks, FUSE produces the largest number of
functionally homogeneous clusters. Additionally, we find that the
results of FUSE are superior to those of the other state-of-the-art aligners when
functional similarity scores are created both from sequence and NMTF scores
(when ) rather than when we use sequence information only (when
). This again demonstrates complementarity of network topology and
sequence in carrying biological information.
Acknowledgments
Funding
This work was supported by the European Research Council (ERC) Starting Independent Researcher Grant 278212, the National Science Foundation (NSF) Cyber-Enabled Discovery and Innovation (CDI) OIA-1028394, the ARRS project J1-5454, and the Serbian Ministry of Education and Science Project III44006.
Conflict of interest
None declared.
References
- [1] Alkan, F., Erten, C.: Beams: backbone extraction and merge strategy for the global many-to-many alignment of multiple ppi networks. Bioinformatics 30(4), 531–539 (2014)
- [2] Altschul, S.F., Gish, W., Miller, W., Myers, E.W., Lipman, D.J.: Basic local alignment search tool. Journal of molecular biology 215(3), 403–410 (1990)
- [3] Bandyopadhyay, S., Sharan, R., Ideker, T.: Systematic identification of functional orthologs based on protein network comparison. Genome Research 16(3), 428–435 (2006)
- [4] Bondy, J.A., Murty, U.S.R.: Graph theory with applications, vol. 6. Macmillan London (1976)
- [5] Chatr-Aryamontri, A., Breitkreutz, B.J., Heinicke, S., et al.: The BioGRID interaction database: 2013 update. Nucleic Acids Research 41(D1), D816–D823 (2013)
- [6] Clark, C., Kalita, J.: A comparison of algorithms for the pairwise alignment of biological networks. Bioinformatics (2014)
- [7] Cook, S.A.: The complexity of theorem-proving procedures. In: Proceedings of the Third Annual ACM Symposium on Theory of Computing. pp. 151–158. STOC ’71, ACM, New York, NY, USA (1971)
- [8] Ding, C., He, X., Simon, H.D.: On the equivalence of nonnegative matrix factorization and spectral clustering. In: Proc. SIAM Data Mining Conf. pp. 606–610 (2005)
- [9] Ding, C., Li, T., Peng, W., et al.: Orthogonal nonnegative matrix t-factorizations for clustering. In: Proceedings of the 12th ACM SIGKDD International Conference on Knowledge Discovery and Data Mining. pp. 126–135. KDD ’06 (2006)
- [10] Flannick, J., Novak, A., Srinivasan, B.S., McAdams, H.H., Batzoglou, S.: Graemlin: General and robust alignment of multiple large interaction networks. Genome Research 16(9), 1169–1181 (2006)
- [11] Gevaert, O., Smet, F.D., Timmerman, D., Moreau, Y., Moor, B.D.: Predicting the prognosis of breast cancer by integrating clinical and microarray data with bayesian networks. Bioinformatics 22(14), e184–e190 (2006)
- [12] Gligorijević, V., Janjić, V., Pržulj, N.: Integration of molecular network data reconstruct gene ontology. Bioinformatics 30(17), i594–i600 (2014)
- [13] He, G., Liu, J., Zhao, C.: Approximation algorithms for some graph partitioning problems. Journal of Graph Algorithms and Applications 4(2), 1–11 (2000)
- [14] Ho, Y., Gruhler, A., Heilbut, A., Bader, G.D., et al.: Systematic identification of protein complexes in saccharomyces cerevisiae by mass spectrometry. Nature 415(6868), 180–183 (2002)
- [15] Hu, J., Kehr, B., Reinert, K.: Netcoffee: a fast and accurate global alignment approach to identify functionally conserved proteins in multiple networks. Bioinformatics p. btt715 (2013)
- [16] Ito, T., Tashiro, K., Muta, S., et al.: Toward a protein–protein interaction map of the budding yeast: A comprehensive system to examine two-hybrid interactions in all possible combinations between the yeast proteins. Proceedings of the National Academy of Sciences 97(3), 1143–1147 (2000)
- [17] Jolliffe, I.: Principal component analysis. Wiley Online Library (2005)
- [18] Kalaev, M., Smoot, M., Ideker, T., Sharan, R.: NetworkBLAST: comparative analysis of protein networks. Bioinformatics 24(4), 594–596 (2008)
- [19] Karp., R.: Reducibility among combinatorial problems. Complexity of Computer Computations. 6, 85–103 (06 1972)
- [20] Kelley, B.P., Sharan, R., Karp, R.M., et al.: Conserved pathways within bacteria and yeast as revealed by global protein network alignment. Proceedings of the National Academy of Sciences 100(20), 11394–11399 (2003)
- [21] Kelley, B.P., Yuan, B., Lewitter, F., et al.: PathBLAST: a tool for alignment of protein interaction networks. Nucleic Acids Research 32(suppl 2), W83–W88 (2004)
- [22] Koren, Y., Bell, R., Volinsky, C.: Matrix factorization techniques for recommender systems. Computer 42(8), 30–37 (Aug 2009)
- [23] Koyutürk, M., Kim, Y., Topkara, U., Subramaniam, S., Szpankowski, W., Grama, A.: Pairwise alignment of protein interaction networks. Journal of Computational Biology 13(2), 182–199 (2006)
- [24] Kuchaiev, O., Milenković, T., Memišević, V., Hayes, W., Pržulj, N.: Topological network alignment uncovers biological function and phylogeny. Journal of The Royal Society Interface 7(50), 1341–1354 (2010)
- [25] Lanckriet, G.R.G., De Bie, T., Cristianini, N., et al.: A statistical framework for genomic data fusion. Bioinformatics 20(16), 2626–2635 (2004)
- [26] Liao, C.S., Lu, K., Baym, M., Singh, R., Berger, B.: IsorankN: spectral methods for global alignment of multiple protein networks. Bioinformatics 25(12), i253–i258 (2009)
- [27] Lovász, L., Plummer, M.: Matching theory. number 29 in annals of discrete mathematics (1986)
- [28] Maglott, D., Ostell, J., Pruitt, K.D., Tatusova, T.: Entrez gene: gene-centered information at ncbi. Nucleic Acids Research 33(suppl 1), D54–D58 (2005)
- [29] Mitra, K., Carvunis, A.R., Ramesh, S.K., Ideker, T.: Integrative approaches for finding modular structure in biological networks. Nature Reviews Genetics 14(10), 719–732 (2013)
- [30] Notredame, C., Higgins, D.G., Heringa, J.: T-coffee: A novel method for fast and accurate multiple sequence alignment. Journal of molecular biology 302(1), 205–217 (2000)
- [31] Papadimitriou, C.H.: Computational Complexity. Addison Wesley Pub. Co. (1994)
- [32] Pržulj, N.: Protein-protein interactions: Making sense of networks via graph-theoretic modeling. Bioessays 33(2), 115–123 (2011)
- [33] Ryan, C.J., Cimermančič, P., Szpiech, Z.A., Sali, A., Hernandez, R.D., Krogan, N.J.: High-resolution network biology: connecting sequence with function. Nature Reviews Genetics (2013)
- [34] Sahraeian, S.M.E., Yoon, B.J.: Smetana: accurate and scalable algorithm for probabilistic alignment of large-scale biological networks. PloS one 8(7), e67995 (2013)
- [35] Sharan, R., Suthram, S., Kelley, R.M., Kuhn, T., McCuine, S., Uetz, P., Sittler, T., Karp, R.M., Ideker, T.: Conserved patterns of protein interaction in multiple species. Proceedings of the National Academy of Sciences of the United States of America 102(6), 1974–1979 (2005)
- [36] Singh, R., Xu, J., Berger, B.: Pairwise global alignment of protein interaction networks by matching neighborhood topology. In: Speed, T., Huang, H. (eds.) Research in Computational Molecular Biology, Lecture Notes in Computer Science, vol. 4453, pp. 16–31. Springer Berlin Heidelberg (2007)
- [37] Singh, R., Xu, J., Berger, B.: Global alignment of multiple protein interaction networks with application to functional orthology detection. Proceedings of the National Academy of Sciences 105(35), 12763–12768 (2008)
- [38] Uetz, P., Giot, L., Cagney, G., et al.: A comprehensive analysis of protein–protein interactions in saccharomyces cerevisiae. Nature 403(6770), 623–627 (2000)
- [39] Uetz, P., Dong, Y.A., Zeretzke, C., et al.: Herpesviral protein networks and their interaction with the human proteome. Science 311(5758), 239–242 (2006)
- [40] Žitnik, M., Janjić, V., Chris, L., et al.: Discovering disease-disease associations by fusing systems-level molecular data. Sci. Rep. 3(3202) (2013)
- [41] Wang, F., Li, T., Zhang, C.: Semi-supervised clustering via matrix factorization. In: SDM. pp. 1–12. SIAM (2008)
- [42] Wang, H., Huang, H., Ding, C.: Simultaneous clustering of multi-type relational data via symmetric nonnegative matrix tri-factorization. In: Proceedings of the 20th ACM International Conference on Information and Knowledge Management. CIKM ’11, ACM, New York, NY, USA (2011)
- [43] Žitnik, M., Zupan, B.: Matrix factorization-based data fusion for drug-induced liver injury prediction. Systems Biomedicine 2(1), 0–1 (2014)
- [44] Žitnik, M., Župan, B.: Matrix factorization-based data fusion for gene function prediction in baker ’s yeast and slime mold. In: Pacific Symposium on Biocomputing. Pacific Symposium on Biocomputing. vol. 19, p. 400. World Scientific (2014)
Supplementary Material
| FUSE | Beams | Smetana | ||||||||
|---|---|---|---|---|---|---|---|---|---|---|
| 0 | 0.5 | 0.6 | 0.7 | 1 | 0.2 | 0.3 | 0.7 | |||
| BP: | #C | 107 | 280 | 300 | 295 | 198 | 158 | 159 | 154 | 188 |
| #P | 535 | 1,400 | 1,500 | 1,475 | 990 | 809 | 815 | 790 | 1,086 | |
| Spec. | 10.6% | 18.6% | 19.7% | 19.5% | 18.2% | 19.2% | 19.4% | 18.8% | 14.7% | |
| MNE | 2.38 | 2.15 | 2.14 | 2.14 | 2.11 | 2.19 | 2.22 | 2.22 | 2.16 | |
| MF: | #C | 213 | 444 | 451 | 454 | 347 | 308 | 312 | 312 | 300 |
| #P | 1,065 | 2,220 | 2,255 | 2,270 | 1,735 | 1,601 | 1,619 | 1,628 | 2,262 | |
| Spec. | 38.6% | 58.3% | 59.0% | 59.5% | 59.9% | 65.8% | 66.0% | 68.3% | 42.1% | |
| MNE | 0.87 | 0.78 | 0.78 | 0.78 | 0.77 | 0.72 | 0.75 | 0.73 | 0.80 | |
Supplementary Table 1. Functional consistency analysis. Each column represents one of the compared aligners (for a specific value of for FUSE and Beams). Numbers in cell report (from top to bottom): the number of consistent clusters (#C), the number of proteins in consistent clusters (#P), the specificity (Spec.), and the mean normalized entropy (MNE). In each row, the highest value is shown in bold.