Detection of discretized single-shell penetration in mesoscopic vortex matter
Abstract
We investigated configurational changes in mesoscopic vortex matter with less than thousand vortices during flux penetration in freestanding 50 m diameter disks of Bi2Sr2CaCu2O8+δ. High-resolution AC and DC local magnetometry data reveal oscillations in the transmittivity echoed in peaks in the third-harmonics magnetic signal fainting on increasing vortex density. By means of extra experimental evidence and a simple geometrical analysis we show that these features fingerprint the discretized entrance of single-shells of vortices having a shape that mimics the sample edge.
1 Introduction
The study of vortex configurations, flux penetration, multi-vortex and giant-vortex states stabilized by confinement have attracted much attention during the last decade [1, 2, 3, 4, 5, 6]. The vortex arrangement in superconducting disks with sizes comparable or smaller than coherence length or penetration depth is quite different to that observed in macroscopic samples with weak [7, 8] or strong [9, 10] pinning. For instance, in disks thinner than coherence length the confinement effect overwhelms the inter-vortex interaction and vortices penetrate in ring-shaped shells mimicking the sample edge [3]. However, inter-vortex interaction strongly depends on the anisotropy of the material and the resulting mesoscopic vortex configuration can significantly change with the degree of layerness of the material.
The case of mesoscopic vortex matter nucleated in the extremely-layered high- Bi2Sr2CaCu2O8+δ studied here is rather interesting since the system presents a rich phase diagram. This is due to the dominant effect of thermal fluctuations and extreme anisotropy in samples with weak disorder. The phase diagram of macroscopic as well as mesoscopic [11] Bi2Sr2CaCu2O8+δ vortex matter is dominated by a first-order transition [12, 13] at between a solid phase at low temperatures and a liquid [14] or decoupled gas [15, 16] of pancake vortices at high temperatures. Irrespective of the sample size, vortex penetration in Bi2Sr2CaCu2O8+δ is dominated by Bean-Livingston surface barriers at high temperatures and bulk pinning effects at low temperatures [17, 18]. The temperature and measuring-time ranges in which every effect dominates is determined by the thickness-to-width ratio of the samples [17, 18, 19]. This results in the solid vortex phase presenting irreversible magnetic behavior whereas the high-temperature phase is magnetically reversible. The transition between both phases is detected as a jump in the DC local induction [12] and as a frequency-independent peak in the AC transmittivity [20, 21].
In this work we study mesoscopic vortex matter penetrating into micron-sized Bi2Sr2CaCu2O8+δ disks by means of local DC and AC micro-Hall-magnetometry measurements with low-noise level. We detect features in the AC transmittivity and third-harmonic signal at certain fields and ascribe them to the abrupt entrance of single vortex-shells on increasing field.
2 Experimental
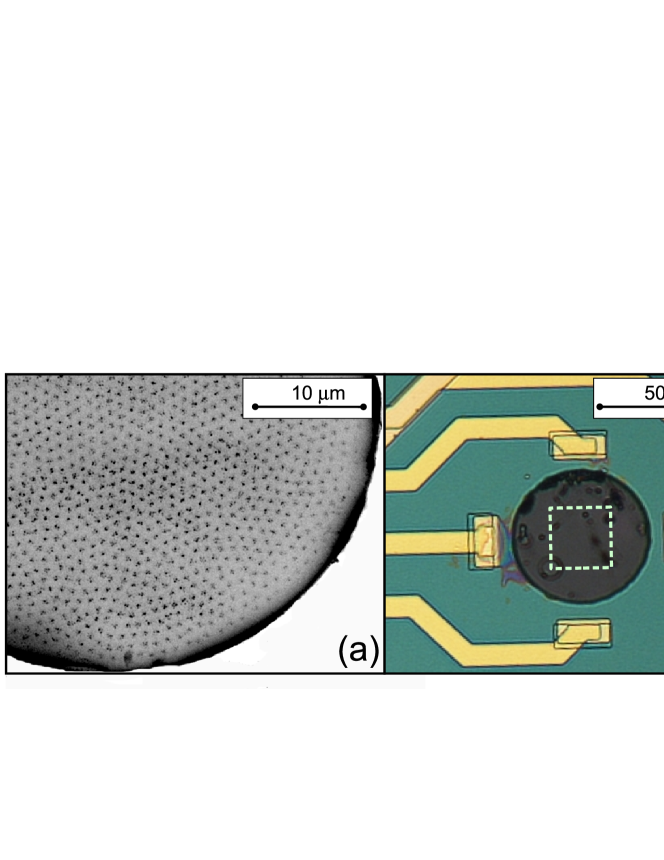
We studied disks fabricated from macroscopic optimally-doped Bi2Sr2CaCu2O8+δ ( K) single-crystals grown by means of the traveling-solvent floating zone technique [22]. Micron-sized disks of roughly 1 m thickness and diameter m as the one shown in Fig. 1 (a) were obtained by combining optical lithography and physical ion-milling techniques [23]. The disks were mounted with micron-precision manipulators onto -electron-gas Hall-sensors with active areas of m2 and glued with Apiezon N grease, see Fig. 1 (b).
The magnetic properties at individual-vortex scale nucleated in field-cooling were studied by means of magnetic decoration imaging [25]. Local magnetization was measured applying DC, , and AC , , fields parallel to the -axis. We simultaneously measure the first and third harmonics of the AC induction by means of a digital-signal-processing lock-in technique [11]. We obtained the transmittivity, , by normalizing the in-phase component of the first harmonic signal [26]. This is a magnitude extremely sensitive to discontinuities in the local induction. The modulus of the third harmonic signal is similarly converted to the magnitude that has a non-negligible value for non-linear magnetic response at , the irreversibility field [26].
3 Results and discussion
Figure 1 (a) shows a zoom-in of a magnetic decoration image revealing the vortex arrangement in the disks for a field-cooling experiment at 20 Oe. At the edge of the sample vortices arrange in a circular-shaped shell mimicking the disk geometry. This structure is the result of the nucleation of the vortex ensemble in the high-temperature vortex liquid and the subsequent freezing of the structure at the scale of lattice spacing at the temperature at which bulk pinning sets in [7], namely K for the 50 m disks [11].
For the flux-penetration at fixed temperature experiments we discuss from now on, vortices enter into the sample on increasing field above the first-penetration field, . In this experiment, a snapshot of flux-penetration would reveal a vortex arrangement certainly different to the one shown in Fig. 1 (a), with an induction gradient towards the sample center. However, Fig. 1 (a) suggest that in flux-penetration experiments vortices will enter into the sample in circular-shaped shells. The entrance of these shells can be continuous or discretized, namely vortices gradually enter one by one, or a circle of vortices suddenly jump into the sample.
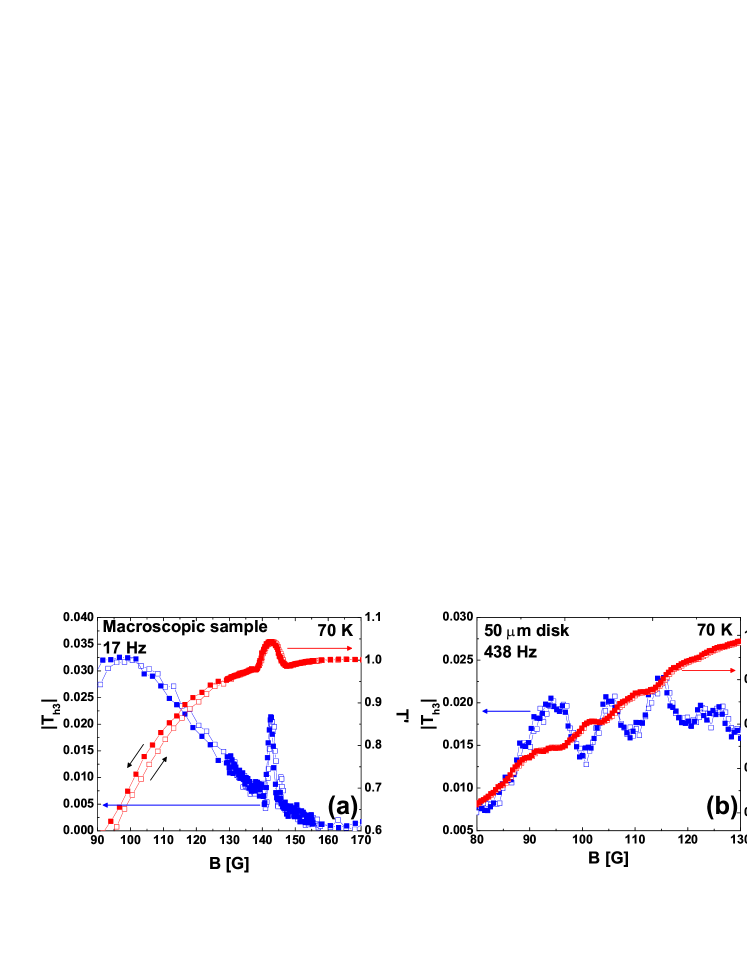
In macroscopic Bi2Sr2CaCu2O8+δ samples, the first-order phase transition is detected as a sharp peak in AC transmittivity [20, 21], a magnitude sensitive to discontinuities in the magnetic induction (proportional to the first derivative of the signal). Figure 2 (a) shows that for the macroscopic sample from which were fabricated the disks this peak develops at G at 70 K. Peaks or oscillations in are echoed as peaks in , see Fig. 2 (a), a magnitude proportional to the third derivative of the signal. On increasing field above G (for 17 Hz), is below the experimental resolution indicating a linear vortex magnetic response.
When vortices penetrate micron-sized disks the first-order phase transition do persist at the same than in macroscopic samples [11]. In addition, if the noise level and field-resolution of the measurements are improved, additional features are detected in the and curves for fields smaller than . On increasing field at 70 K vortices penetrate and oscillations in are observed in the range of 80 to 130 G, see Fig. 2 (b). This contrasts with the flat curve measured in this field-range for the macroscopic Bi2Sr2CaCu2O8+δ sample. These features observed in the micron-sized disks are due to discontinuities in the local induction when vortices are entering (full points) or exiting (open points) from the disks. The amplitude of the oscillations in for the disks are two-to-four times smaller than the peaks measured in the macroscopic sample at .
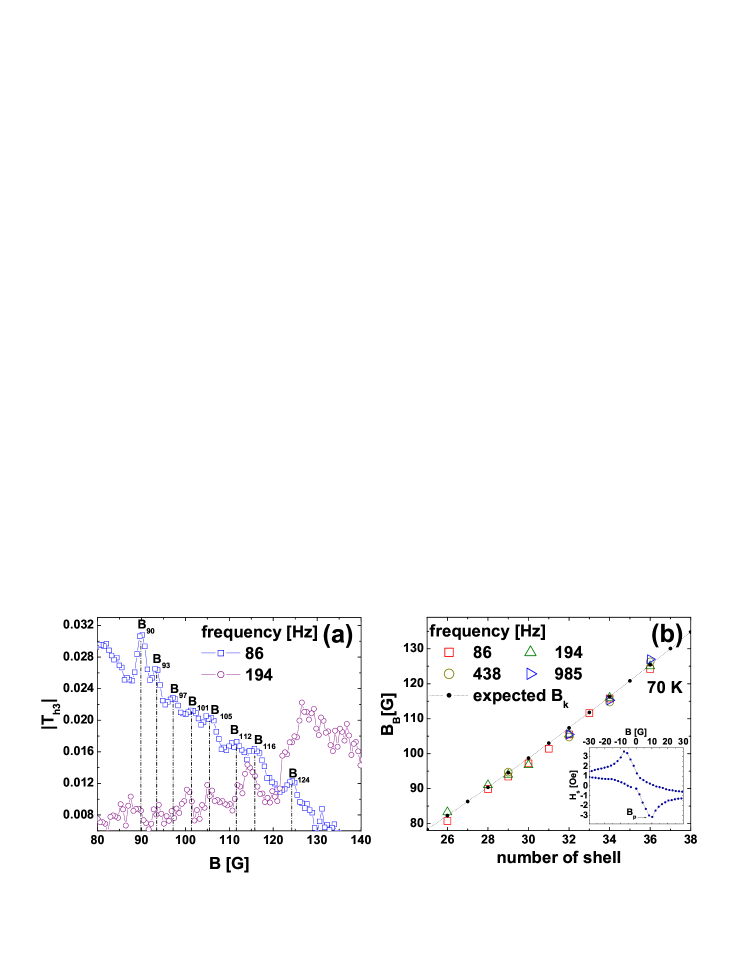
Figure 2 (b) shows that the oscillations in are echoed as peaks in . We were able to detect these peaks in the temperature-range between 70 to 90 K. For the 50 m disks at 70 K, the peaks are detected between 80 and 130 G, for a wide range of frequencies, see the examples of Fig. 3 (a). We identify the particular fields at which the peaks develop with , with the field-location of the maximum. For instance, Fig. 3(a) depicts peaks to . The fields at which becomes negligible on increasing vortex density rises with frequency, namely moves upward with frequency [11].
On sweeping up field, flux-penetration in the 50 m disks starts at G with the first single-shell of vortices nucleating at the sample edge. The field is obtained from DC local magnetization loops as indicated in the insert to Fig. 3 (b). Further increasing the field might entail either a continuous entrance of vortices, or a discretized process in which vortices do not enter until the increment in is such that its vorticity allows the formation of a new single-shell of vortices. In the latter case, the new -th single-shell of vortices jumps into the sample for a given field. We propose that the peaks observed in concomitant with the oscillations in are the fingerprint of this discretized entrance of vortices on increasing , namely that for given and . If vortices would penetrate the sample individually in a continuous way, no such sharp features in and are expected.
We can also consider a very simple geometrical analysis in order to relate the observed features with the entrance of a -th shell. By considering the measured , we estimate the number of vortices suddenly penetrating in the first single-shell () as , with the flux quantum. We then calculate the required increment in field in order to produce the jumping-in of the second single-shell (), . In order to do so we consider that and with the number of vortices in the second single-shell with the vortex spacing. We proceed in the same fashion for the following single-shells, and obtained the curve shown in Fig. 3 (b) as a function of the single-shells ordinal number . The vortex spacing is considered in a very rough approximation as with the special case of . This is a very simple analysis but since we do not have direct imaging evidence on the penetration of vortices within a single-shell, we can not suggest a more sophisticated model.
We then identified all the observed peaks from measurements at several frequencies in the range of 80 to 130 G. For every we then find the closest magnetic-field value for which is expected the entrance of a single-shell of vortices, , and construct the curves shown in Fig. 3 (b). Namely, we assume that the peaks in are located at the particular field-values such that its vorticity allows a single-shell of vortices with ordinal number penetrating into the sample. In spite of the simplicity of this analysis, the agreement between the experimental points and the values expected from this geometrical model is quite remarkable.
This interpretation could be challenged by arguing that the oscillations in come from inhomogeneities in the sample giving different local values of at a fixed measurement temperature. This seems not to be the case since these features in have a different shape than the paramagnetic peaks associated to the transition at , and they are observed in a different field-range than this transition. Nevertheless, we did an extra experimental check in order to verify our interpretation. In the case of the and concomitant peaks associated to the first-order transition in macroscopic samples, applying an in-plane field produces a shifting of the peaks towards smaller fields [21]. When we applied such a field in our 50 m disks we found that the field-location of the peaks in does not change appreciably. Therefore with these experiments we strengthen our interpretation of the peaks in being the fingerprint of the discretized entrance of single-shells of vortices. Vortex imaging experiments on increasing field in films with strong periodic pinning potentials show that the entrance of a vortex shell is not performed abruptly but in steps following the terrace critical state [27]. However, in our case the samples do not have a periodic pinning potential and such a penetration state is not expected. Nevertheless, whether the penetration is performed with all vortices of a single-shell entering suddenly at the same field, or slightly gradually in the small range of fields the peaks widen, can not be ascertained from our experiments.
Finally, we find that on further increasing the field above 130 Oe the oscillations in as well as the peaks in the third-harmonic signal progressively faint. This suggest that in this field-range the field-steps required to allow the discretized entrance of single-shell of vortices become smaller than the field-resolution of our experiments of roughly 0.1 G. Therefore this phenomenology is resolution-limited and we can not ascertain whether there is a discrete-to-continuum crossover of flux penetration in micron-sized vortex matter.
4 Conclusions
Low-noise level and high-resolution local magnetic measurements, as well as single-vortex imaging, allowed us to detect the entrance of quite-likely ring-shaped single-shells of vortices penetrating micron-sized samples. Therefore for the mesoscopic vortex matter nucleated in the extremely-layered Bi2Sr2CaCu2O8+δ superconductor, flux-penetration at low fields follows a discretized process in which the confinement plays a relevant role on imposing the geometry of the sample for vortex entrance. This effect is no longer detected for a system with more than 13.000 vortices indicating inter-vortex interaction becomes more relevant.
References
References
- [1] V. V. Moshchalkov, L. Gielen, C. Strunk, R. Jonckheere, X. Qiu et al., Nature 373, 319 (1995).
- [2] A. K. Geim, I. V. Grigorieva, S. V. Dubonos, J. G. S. Lok, J. C. Maan et al., Nature 390, 256 (1997).
- [3] V. A. Schweigert, F. M. Peeters, and P. S. Deo, Phys. Rev. Lett. 81, 2783 (1998).
- [4] J. J. Palacios, Phys. Rev. B 58, R5948 (1998).
- [5] V. Bruyndoncx, L. Van Look, M. Verschuere, and V. V. Moshchalkov, Phys. Rev. B 60, 10468 (1999).
- [6] L. R. E. Cabral, B. J. Baelus, and F. M. Peeters, Phys. Rev. B 70, 144523 (2004).
- [7] Y. Fasano, M. De Seta, M. Menghini, H. Pastoriza and F. de la Cruz, Proc. Nat. Acad. Sci. 102, 3898 (2005).
- [8] A. P. Petrovic, Y. Fasano, R. Lortz, C. Senatore, A. Demuer et al., Phys. Rev. Lett. 103, 257001 (2009).
- [9] M. Menghini, Y. Fasano, F. de la Cruz, S. S. Banerjee et al., Phys. Rev. Lett. 90, 147001 (2003).
- [10] S. Demirdis, C.J. van der Beek, Y. Fasano, N. R. Cejas Bolecek et al., Phys. Rev. B 84, 094517 (2011).
- [11] M. Konczykowski, Y. Fasano, M. I. Dolz, H. Pastoriza, V. Mosser, and M. Li, arXiv:1212.4564 (2012).
- [12] H. Pastoriza, M. F. Goffman, A. Arribere, and F. de la Cruz, Phys. Rev. Lett. 72, 2951 (1994).
- [13] E. Zeldov, D. Majer, M. Konczykowski, V. B. Geshkenbein, V. M. Vinokur et al., Nature 375, 373 (1995).
- [14] D. R. Nelson, Phys. Rev. Lett. 60, 1973 (1988).
- [15] L. I. Glazman, and A. E. Koshelev, Phys. Rev. B 43, 2835 (1991).
- [16] H. Pastoriza and P. H. Kes, Phys. Rev. Lett. 75, 3525 (1995).
- [17] N. Morozov, E. Zeldov, M. Konczykowski, and R.A. Doyle, Physica C 291, 113 (1997).
- [18] Y. M. Wang, A. Zettl, S. Ooi and T. Tamegai Phys. Rev. B, 65, 184506(2002).
- [19] N. Chikumoto, M. Konczykowski, N. Motohira, and A. P. Malozemoff, Phys. Rev . Lett. 69 1260 (1992).
- [20] N. Morozov, E. Zeldov, D. Majer and M. Konczykowski, Phys. Rev. B 54, R3784 (1996).
- [21] M. Konczykowski, C. J. van der Beek, A. E. Koshelev, V. Mosser et al., Phys. Rev. Lett. 97, 237005 (2006).
- [22] T. W. Li, P.H. Kes, N.T. Hien, J. J. M. Franse and A. A. Menovsky, J. Cryst. Growth 135, 481 (1994).
- [23] M. I. Dolz, A. B. Kolton and H. Pastoriza, Phy. Rev. B 81, 092502 (2010).
- [24] Y. Fasano, M. De Seta, M. Menghini, H. Pastoriza, and F. De la Cruz, Solid State Commun. 128, 51 (2003).
- [25] Y. Fasano, J. Herbsommer, and F. de la Cruz, Phys. Stat. Sol. (b) 215, 563 (1999).
- [26] J. Gilchrist, and M. Konczykowski, Phys. C 212, 43 (1993).
- [27] A. V. Silhanek et al. Phys. Rev. B 83, 024509 (2011).