Accretion-Inhibited Star formation in the Warm Molecular Disk of the Green-valley Elliptical Galaxy NGC 3226?
Abstract
We present archival Spitzer photometry and spectroscopy, and Herschel photometry, of the peculiar “Green Valley” elliptical galaxy NGC 3226. The galaxy, which contains a low-luminosity AGN, forms a pair with NGC 3227, and is shown to lie in a complex web of stellar and HI filaments. Imaging at 8 and 16m reveals a curved plume structure 3 kpc in extent, embedded within the core of the galaxy, and coincident with the termination of a 30 kpc-long HI tail. In-situ star formation associated with the IR plume is identified from narrow-band HST imaging. The end of the IR-plume coincides with a warm molecular hydrogen disk and dusty ring, containing 0.7–1.1 107 M⊙ detected within the central kpc. Sensitive upper limits to the detection of cold molecular gas may indicate that a large fraction of the H2 is in a warm state. Photometry, derived from the UV to the far-IR, shows evidence for a low star formation rate of 0.04 M⊙ yr-1 averaged over the last 100 Myrs. A mid-IR component to the Spectral Energy Distribution (SED) contributes 20 of the IR luminosity of the galaxy, and is consistent with emission associated with the AGN. The current measured star formation rate is insufficient to explain NGC3226’s global UV-optical “green” colors via the resurgence of star formation in a “red and dead” galaxy. This form of “cold accretion” from a tidal stream would appear to be an inefficient way to rejuvenate early-type galaxies, and may actually inhibit star formation.
1 Introduction
A complete picture of the evolution of galaxies, and how they are grouped into two major branches seen in the local universe, namely the red-sequence and the blue cloud (Strateva et al., 2001; Blanton et al., 2003; Hogg et al., 2004; Faber et al., 2007) is still a poorly understood problem in astronomy. One particular class of galaxy that may be relevant to the discussion of how stellar populations are built-up over time, are galaxies which fall in the so-called “green-valley”, defined in terms of the UV-optical color lying in the range 3 NUV-r 5, a color that places galaxies between the two main color classes. It has been suggested that galaxies in this region of color space can be characterized by a flow of star formation–quenched galaxies which migrate from the blue to the red (Martin et al., 2007) as star formation shuts down. However, the green-valley galaxies may not be representative of a single transitional population (Westoby et al., 2007; Schawinski et al., 2014), but instead may be complicated by the availability of gas supply, and the form of the quenching event that signals the start of a transition from blue to red color. AGN may play a role in quenching.
Alternatively, galaxies can potentially move into the green-valley (see Thilker et al., 2010) from the red sequence by a resurgence of star formation through accretion of gas from their environments: either through a gas-rich minor merger, or through acquisition of tidal debris. In this paper we present evidence of a possible on-going HI-gas accretion event in the center of the elliptical galaxy NGC 3226, and explore its implications for this kind of color change.
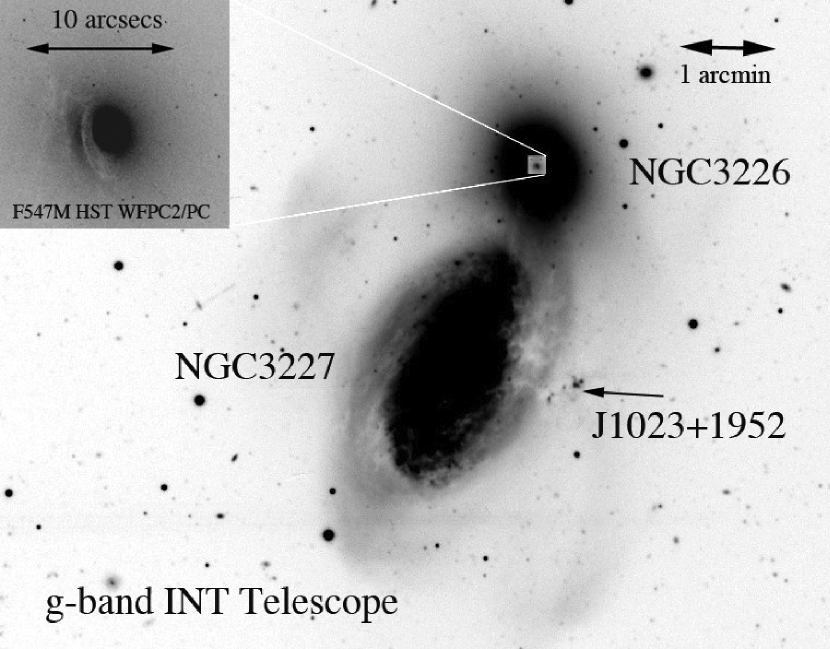
The green-valley (NUV-r = 4.35; this paper) elliptical galaxy NGC 3226 is a companion of the large disturbed barred-spiral galaxy NGC 3227, forming the Arp 94 system (Figure 1). The core of NGC3226 contains a dusty disk or partial ring (see Figure1-inset), and hints of its LINER-like optical spectra can be traced back to Rubin & Ford (1968). It was spectroscopically classified as a LINER- type 1.9 by Ho, Filippenko & Sargent (1997), and is it generally accepted as a classical example of a low-luminosity, X-ray-bright AGN, most likely the result of radiatively–inefficient accretion onto a supermassive black hole (Ho & Ulvestad, 2001; George et al., 2001; Ho et al., 2009; Liu & Wu, 2013, and references therein).
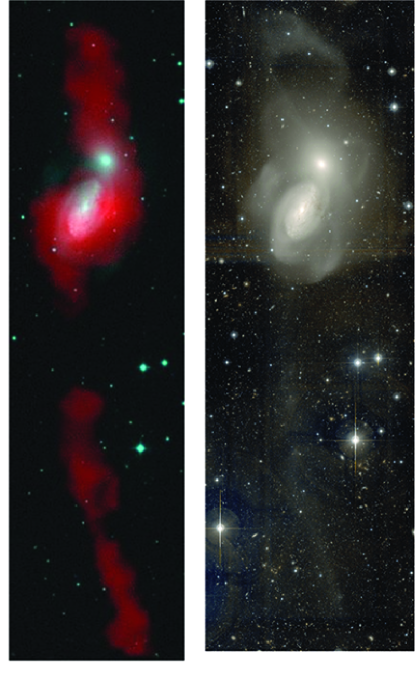
Evidence that NGC3226 and NGC3227 are interacting was first presented by Rubin & Ford (1968) through optical spectroscopy. Subsequent VLA observations revealed 100 kpc–scale plumes of neutral hydrogen extending over 20 arcminutes to the north and south of the galaxy pair (Mundell et al., 1995), shown in Figure 2 (left panel), which are most likely tidally–generated structures.
A contrast-enhanced MegaCam image from Duc et al. (2014), Figure 2 (right panel), exhibits a complex set of faint stellar arcs and ripples around both NGC 3227 and NGC 3226 (like those described by Schweizer & Seitzer, 1988). This suggests a rich dynamical history for the system. NGC 3226 shows several huge loops and a narrow optical filament extending from the galaxy to the north-east at a position-angle of 30 deg. The visible-light imagery presents a complexity that is hard to reconcile with a single tidal interaction between NGC 3227 and NGC 3226. Rather, the structures around NGC 3226 imply that this galaxy is itself the remnant of a recent merger which has launched stellar debris into the joint potential of what was probably a system of at least three constituent galaxies.
The HI map shown in Figure 2 seems consistent with two long tidal tails (north and south) perhaps associated with NGC 3227. However, this may be an oversimplification. Firstly, the system is complicated by the discovery of a 40 arcsec–scale HI-rich dwarf galaxy (J1023+1952) located in-front of the western disk of NGC3227 (Mundell et al., 1995). This galaxy is physically distinct from NGC3227, shows independent rotation (Mundell et at., 2004), and appears to be experiencing a burst of star formation in part of its disk (see also Figure 1). Studying the molecular and optical/IR properties in more detail, Lisenfeld et al. (2008) suggested that J1023+1952 may be formed at the intersection of two stellar streams. Secondly, although the southern HI tail contains an optical counterpart (seen faintly in Figure 2), connecting it to NGC 3227, the northern plume is less obviously correlated with the faint visible-light structures, and is most likely kinematically associated with NGC 3226 not NGC 3227 (see later).
We present Spitzer, Herschel and Hubble observations of NGC 3226, revealing the existence of a warm molecular disk in its core, which may be being fed from a dusty filament that is likely tidal debris falling-back onto NGC 3226. NGC 3226 has a heliocentric velocity of 131316 km s-1 (Simien & Prugniel 2002), and we adopt a distance of 15.1 Mpc based on a heliocentric velocity of 1135 km s-1 for NGC 3227 (the larger member of the pair) and H0 = 75 km s-1 Mpc-1.
2 The Observations
Table 1 summarizes the archival observations used in this paper, including Spitzer mid-infrared imaging and spectroscopy, Herschel far-infrared photometric mapping, and Hubble Space Telescope imaging.
2.1 Spitzer Observations
Some of the mid-IR observations described in this paper where made shortly after the launch of Spitzer, during the instrument verification phase of the mission. IRAC (Fazio et al., 2004) imaging in all four bands (3.6, 4.5, 6 and 8 m) was performed using a 7-point dither pattern to encompass both NGC 3227 and NGC 3226, although the emphasis here is on these data for NGC3226. Observations using the small-map photometry mode of the MIPS (Rieke et al., 2004) instrument were made at 24m. Infrared Spectrograph (IRS, Houck et al., 2004) photometric mapping using the blue peak-up camera, provided a 16m image of the galaxy as part of the first calibration observations of this mode. Raw data from these latter observations were processed through the Spitzer Science Center standard S18 pipelines, and the 16 and 24m maps where further processed using the MOPEX mapping package (Makovoz & Marleau, 2005).
A small spectral map was taken in the IRS Short-Low (hereafter SL) module, covering the wavelength range of 5-15m. A 9 1 grid of spectra was obtained centered on the nucleus of NGC 3226: each single spectrum covered an area 57 3.7 arcsec2. At each slit position, a spectrum was taken, and the slit was moved 2.5 arcseconds (2/3 of a slit width) before taking the next exposure. Reduction of the spectra were performed using the Spitzer Science Center (SSC) IRS S18 pipeline, and resulted in a 2-d images of the spectral-orders. The spectral cubes were further processed using the CUBISM package (Smith et al., 2007a). Local sky subtraction was performed in the construction of the spectral cubes, using off-target observations of identical integration time. Spectral line fluxes were extracted using PAHFIT (Smith et al., 2007b)
Spitzer high resolution (LH = 18.7-37.2 m, and Short-High SH = 9.9-19.6m modes) spectra taken at the center of NGC 3226 (see Table 1) were processed through the SSC S18 pipeline.The LH and SH apertures subtend an area of 22.3 11.1 arcsec2 and 11.3 4.7 arcsecs2 respectively. The two dithered spectra taken in each order were blinked against one another, to allow identification of cosmic ray glitches and “rogue” pixels, whose values were then replaced by interpolation from surrounding pixels. Spectral extractions were made using the SSC software package SPICE (Spitzer IRS Custom Extraction–a Java based interactive analysis tool), and line fluxes were extracted using the ISAP package (Sturm et al., 1998).
2.2 Herschel Observations
Herschel111Herschel is an ESA space observatory with science instruments provided by European-led Principal Investigator consortia and with important participation from NASA (Pilbratt et al., 2010)observations at 70 and 160m were obtained with the PACS photometer (Poglitsch et al., 2010), and at 250, 350 and 500m with the SPIRE (Griffin et al. 2010) photometer. Raw data, Level 0, for both instruments were de-archived from the Herschel Science Archive, and processed to Level 1 using the HIPE (Herschel Interactive processing Environment) 11.1 software (Ott 2006). For PACS, map-making beyond Level 1 was performed using the “Scanamorphos” software package (Roussel 2013). These PACS observations combined scan and cross scan maps covering 8.3 x 8.3 arcmin2, and were obtained at medium-speed resulting in a total on-source integration times of 600s. SPIRE imaging (Griffin et al., 2010) was performed in large map mode covering an 8 x 8 arcmin area centered on the NGC3226/7 pair. SPIRE data was processed through the “Destripper” pipeline in HIPE 11. Details of the observing programs and other information is provided in Table1.
2.3 Hubble Space Telescope Observations
Hubble Space Telescope H observations (originally discussed by Martel et al. (2004) in a different context) taken with the Advanced Camera for Surveys(ACS) were obtained of the region surrounding NGC 3226 from the Hubble archive (see Table 1). The observations were obtained in the broad-band F814W continuum filter, in which negligible contamination from emission lines is expected, and in a F658N narrow-band filter, which includes the redshifted H and [Nii]λλ6548,6584 emission lines. Data were processed with the on-the-fly-calibration procedures on retrieval from the HST archive, and the final drizzled images were post-processed as follows. The two images were initially flux calibrated using their respective PHOTFLAM keywords to ensure correct continuum subtraction with the F814W; the optimal scaling was verified by ensuring that pure continuum sources, such as background galaxies, were correctly subtracted. The F814W was shifted slightly ( pixels, pixels) for correct alignment with the F658N image. A revised equivalent PHOTFLAM for the continuum-subtracted F658N image was then computed using CALCPHOT in the IRAF SYNPHOT package. Although the F658N bandpass includes contamination from the [Nii] emission lines, their contribution is assumed to be no more than 20% in normal star forming regions222If shocks were present this approximation may not be appropriate, and we may overestimate the H contribution.. We therefore followed Martel et al. (2004) and assumed a single 5-wide gaussian line at the H wavelength appropriate for the redshift of NGC 3226. We also present archival V-band HST observations of the core of NGC 3226 obtained in 1997 with the WFPC2/PC.
3 Results
3.1 A dusty star-forming filament inside the optical dimensions of NGC 3226
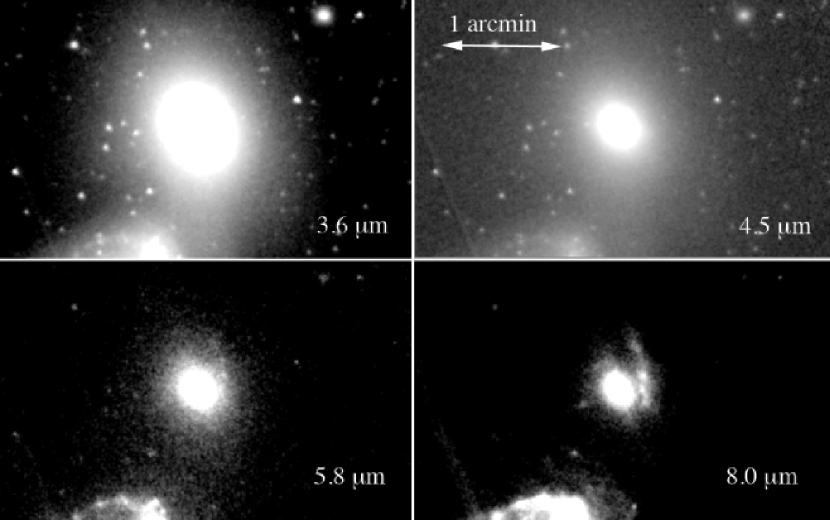
In Figure 3 we show IRAC images of NGC 3226. Although this elliptical galaxy shows only a smooth stellar distribution at 3.5m, and 4.5m, the galaxy contains a filament of emission in the 8m band (and faintly in the 5.8m band). The latter is centered close to the 7.7m polycyclic aromatic hydrocarbon (PAH) complex, whereas the former may be from the 6.3m PAH band. This structure (noticed by Tang et al., 2009; Lanz et al., 2013), lies well inside the D25 optical dimensions of the galaxy (3.16 x 2.81 arcmin2 de Vaucouleurs et al., 1991) and is composed of knots of emission extending northwards from the western side of the inner galaxy. The filament’s southern-most extent terminates close to a prominent dust lane seen in optical images of the galaxy (see Figure 1). We argue later that the feature is detected in HI emission, and represents the termination of a possible in-falling stream of gas in a tidal tail.
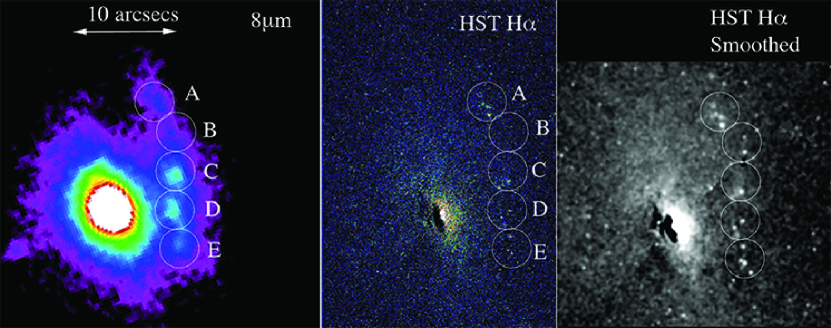
Figure 4 shows the relationship between the IRAC 8m emission and the continuum-free HST H+[NII] image, at both full resolution and smoothed to show extended emission. HII region complexes are seen associated with the main 8m clumps in the filament. Observed and derived properties from the photometry are presented in Table 2 for the knots labeled A-E in Figure 4. We present the 8m flux density and luminosity (Table 2; Column 2 & 4) converted to a stellar-free flux density S(8)dust by subtracting 25 of the S(3.6m) flux density from the same aperture from the 8m emission to provide a “dust+PAH” band flux (Calzetti et al., 2007). The H flux and luminosity are estimated from the H HST image for each of the regions (uncorrected for extinction; Table 2; Column 3 & 5).
Since the filament was not detected at 24m, we estimated the star formation rates in the filament regions using two methods. The first is based simply on the observed H luminosity L(H) only (Kennicutt, 1998), (Table 2; Column 5) providing a SFR(H)(Table 2; Column 7) assuming a Kroupa IMF. This SFR is uncorrected for extinction. A second method, uses both the 8m dust(+PAH) luminosity, and the observed H luminosity from the HST image, and the empirical relationship of Kennicutt et al. (2009) between these quantities and the unobscured Hcorr luminosity (Table 2; Column 6). This provides an unobscured SFR (Table 2; Column 8). As expected, the first method yields slightly lower star formation rates than the combined visible/IR method, most likely due to modest extinction in the filament. The star formation rates in the filament clumps are very low, between 1-3 10-3 M⊙ yr-1.
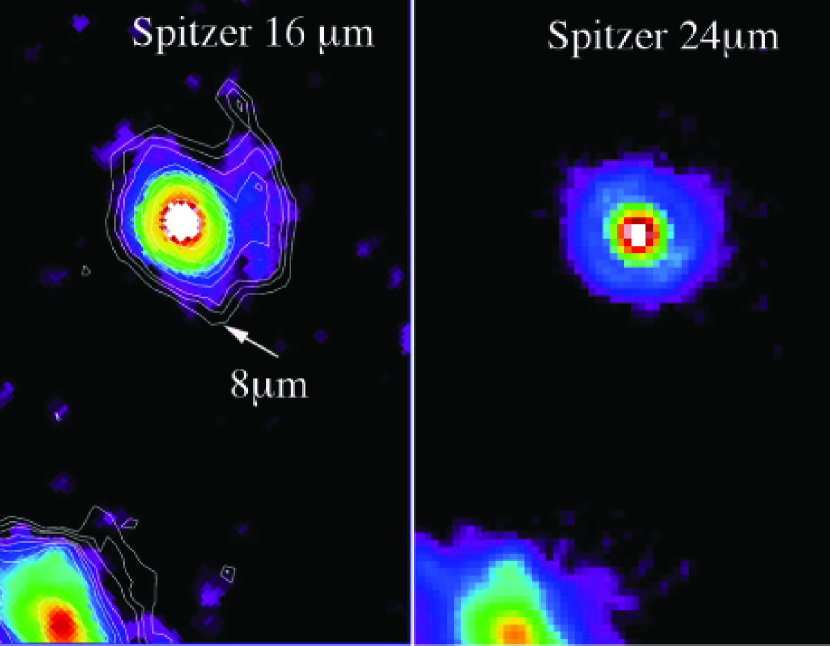
Further insight into the IR properties of the filament can be obtained by looking at the observations of NGC 3226 at longer wavelengths. The filament is detected at 16m, but not 24m. Figure 5 shows the close correspondence between the 16m emission (contours) and the 8m image centered on the 7.7-8.6 PAH bands. Since no detectable emission is seen at 24m (Figure 5, right panel), this implies that the 16m image is detecting line emission, either narrow 17m 0-0S(1) molecular hydrogen emission, or broader 16m PAH emission, or both. It is therefore likely that most of the light in the IR originates in line emission rather than warm dust.
Emission from PAHs would be expected from the previous discussion on star formation, as the PAHs would be thermally spiked by UV radiation. Since our IRS spectroscopic observations did not cover this region, we cannot conclusively prove whether either large composite planar-bending mode PAHs are responsible for the 16m emission, or warm molecular hydrogen. Such emission might be expected if the filament contains shocks.
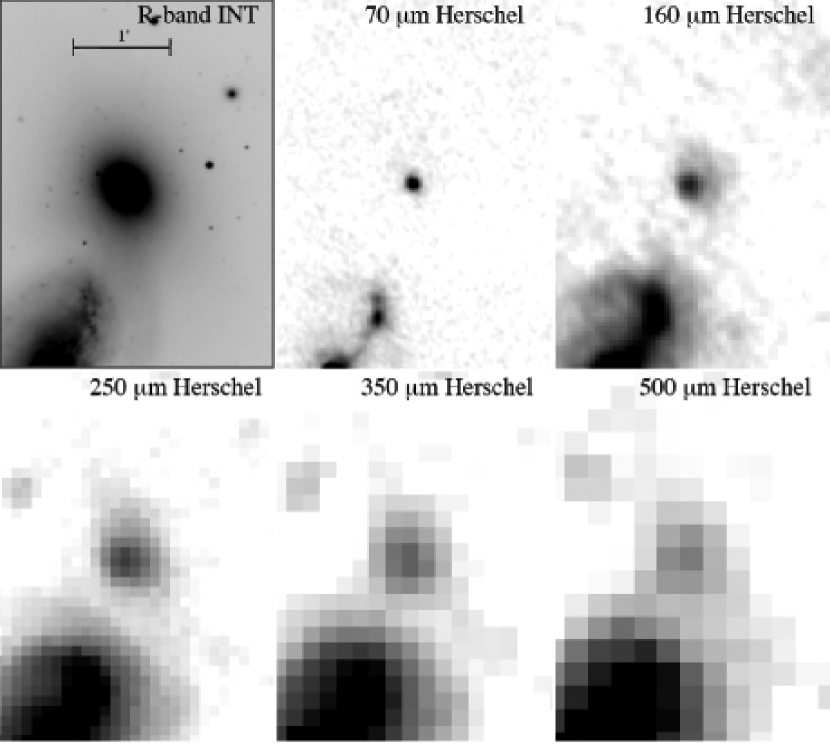
Figure 6 shows Herschel PACS and SPIRE images of the galaxy compared with an optical image on the same scale. The 70m map, which has similar spatial resolution to the Spitzer 24m image of Figure 5 (right panel) shows an unresolved core (on scale 5.5 arcsec = 400 pc) with a faint extended (35 arcsec = 2.5 kpc) component elongated roughly along a position angle of 42-45 (N thru E), especially to the north.
The filament may contain colder dust as it is weakly detected in the PACS 160m image to the NW of the dusty core, and possibility in the lower resolution SPIRE images (Figure 6).
3.1.1 A neutral hydrogen counterpart to the IRAC dust filament
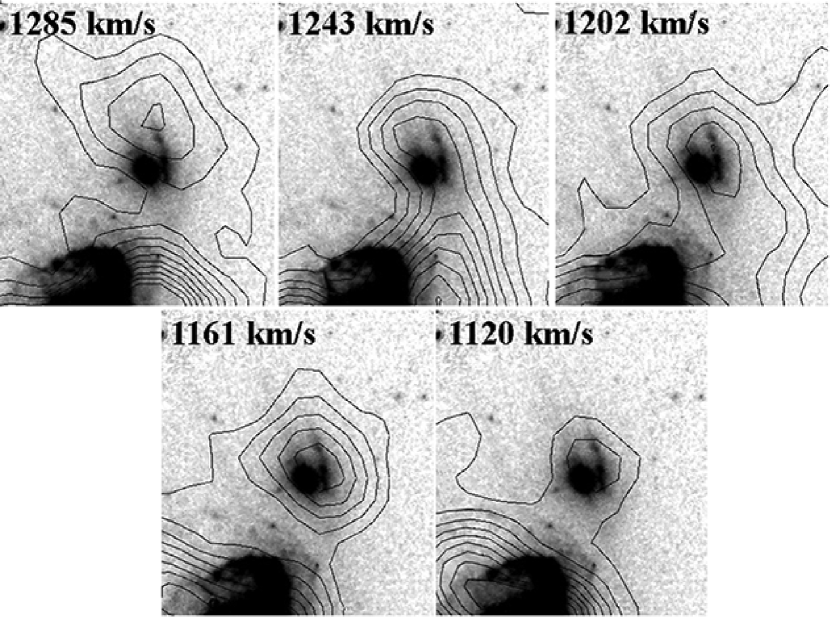
We show in Figure 7 a series of channel-map images showing HI column density, in steps of 41 km s-1, obtained by Mundell et al. (1995) from D-array VLA observations (contours), superimposed on the IRAC 8m image (greyscale) for a series of correlator channels ranging from a heliocentric velocity of 1285 - 1120 km s-1 . The maps show a clear association in the centroid of HI emission at each velocity with the 8m PAH-emitting filament. As one proceeds through the channel maps from 1285 to 1120 km-1, we see the centroid following the filament until the HI emission completely disappears at velocities lower than 1120 km s-1. At higher velocities than 1285 km s-1 (not shown here-but see Mundell et at., 2004), the centroid joins the bulk of the gas which forms the northern HI filament seen in Figure 2. Figure 7 shows two things: i) that the IRAC 8m emitting filament is gas rich (MH= 9.2 107 M⊙ for D = 15.1 Mpc and integrating over the range of HI channels shown in Figure 7) with the center of the filament having a systemic velocity of 1202 km/s, and ii) the star formation seen in this dusty structure seems to represents the southern tip and kinematic termination of the large northern HI plume. The termination of the northern HI plume deep inside the inner regions of NGC3226 may suggest “late-stage” accretion onto the galaxy.
3.2 Mid-IR Spectral Properties of NGC 3226
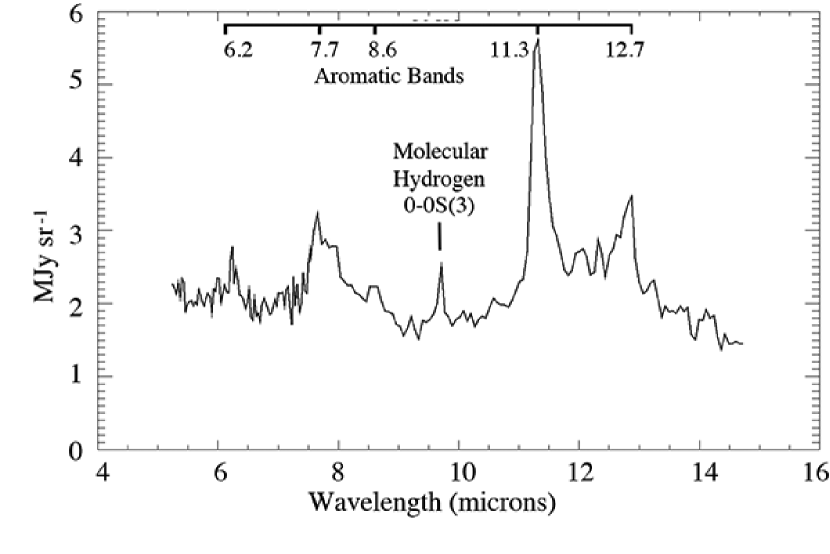
We show in Figure 8 the IRS-SL spectrum of NGC 3226 extracted from the spectral cube. The galaxy shows PAH emission and emission from the 0-0S(3)9.66m rotational line of warm molecular hydrogen. In Table 3, we present the band and line fluxes for the well determined PAH features and the 0-0 S(3) line determined from the application of PAHFIT (Smith et al., 2007b). The large value of the 11.3/7.7 (= 0.67) PAH-feature power ratio, and small ratio of the 6.2/7.7 PAH (= 0.22) ratio, places NGC3226 in the region of neutral PAHs with long carbon chains(N 300; Draine & Li, 2001). This may relate to a relatively quiescent UV environment in NGC 3226 due to its low star formation rate and weak AGN properties.
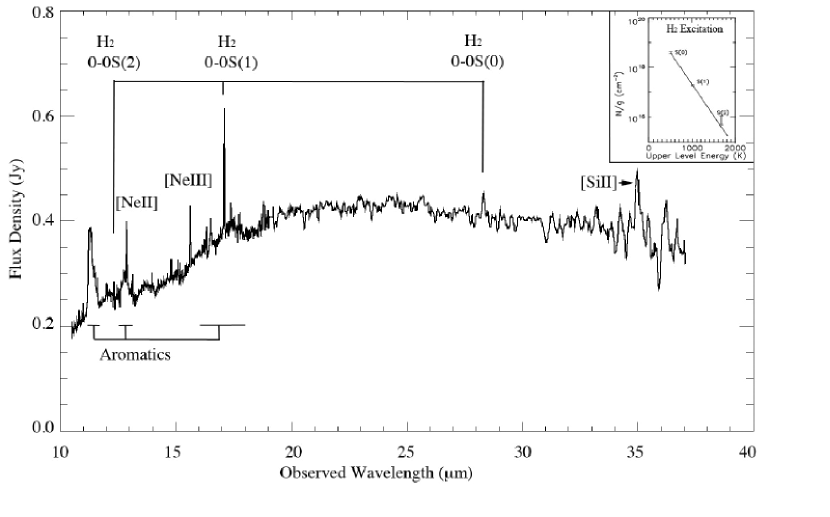
In Figure 9 we show the high-resolution spectrum of NGC 3226 obtained with the IRS. Unlike the SL spectrum, a dedicated background observation, off the target, was not made for this archival observation (taken early in the mission). Therefore there is an unknown offset in the spectrum from zodiacal light contamination. However, the line fluxes themselves are not affected. The SH spectrum, extending to 19.5m was scaled upwards (in the figure by a factor of 4) so that its continuum matched the overlapping continuum of the LH spectrum which has a larger slit. Line fluxes are provided in Table 3. Figure 9 shows strong emission from the rotational H2 transition 0-0S(1)17.03m and well as weaker emission from 0-0S(2)12.28 and S(0)28.22m. Atomic fine-structure lines of [NeII]12.8m, [NeIII]15.6m,[ SiII]34.81m as well as PAH emission is also seen in the spectrum. These observations were taken against a relatively high zodiacal light background (NGC 3226 is only 9 degrees from the ecliptic plane), and therefore the absolute scaling (and possibly the shape) of the continuum is likely affected by extra (zodiacal) background emission. The measurement of the strength of the emission lines is not affected by zodiacal light.
4 Warm H2 properties
The discovery of strong pure-rotational emission lines of molecular hydrogen in NGC3226, implies the existence of warm (T 100 K) H2 in the galaxy. Temperatures significantly below 100K are not capable of exciting even the lowest level transition which gives rise to the 28m line. If several emission lines are detected, it is possible to gain some idea of the temperature and total column density of gas by creating a H2 excitation diagram: a plot of the upper-level transition column density normalized by its statistical weight Nu/gu, against the upper-level transition energy Eu. If the gas is in thermal equilibrium, the ortho- and para-branches of the H2 energy level diagram contribute points in the excitation diagram that fall on a straight line, the slope of which is inversely proportional to the temperature (for more details see: Rigopoulou et al., 2002; Roussel et al., 2007).
The inset to Figure 9 shows the excitation diagram derived from the SH/LH spectra, and are based on the line fluxes (Table 3) for the three lowest energy rotational transitions (0-0 S(0), S(1) and S(2)). We also provide line fluxes for other detected atomic lines in Table 3. We estimate a range of temperatures and total H2 masses of the warm molecular hydrogen. Assuming an ortho-to-para H2 ratio appropriate for LTE, we derive a temperature range of 144–173 K and a warm H2 mass of 1.1–0.7 107 M⊙ in the LH aperture (1.6 0.8 kpc2). The range of temperatures and masses takes into account both observational uncertainty, as well as uncertainty in the relative scaling of the SH and LH spectra which depends on the assumed H2 distribution.
Deep single-dish IRAM 30-m CO observations by Young et al. (2011) failed to detect molecular hydrogen down to a level of 1.7 107 M⊙, for a nominal velocity width of 300 km s-1 and a 3- upper limit, and assuming XCO= N(H2)/I(CO)1-0 = 2 1020 cm-2 (K km s-1)-1. Assuming the CO is not very extended on the scale of the 22 arcsec IRAM beam, and using this XCO factor would imply a warm-to-total H2 mass ratio, M(H2)w/M(H2)total 0.29-0.39.
Roussel et al. (2007) investigated the M(H2)w/M(H2)total ratio for the SINGs sample, and found that it decreased with H2 excitation temperature–ranging from 0.5 to 0.02, with a median value of 0.15 (correcting for a slightly different assumed XCO ratio). It was also found that the temperature of the warm H2 in LINERs and Seyferts was systematically higher than in HII region-dominated galaxies, and the M(H2)w/M(H2)total ratio was generally lower in these galaxies, as compared with HII-dominated galaxies.
NGC 3226 lies on the upper end of the distribution of M(H2)w/M(H2)total ratios for HII-dominated galaxies, but is an outlier for LINERs and Seyferts, having more warm H2 than expected for its temperature. The intergalactic filament in Stephan’s Quintet (Guillard et al., 2012) has also been shown to exhibit a high fraction of warm H2, and in that case there is strong evidence that the filament is strongly heated by mechanical energy from shocks (see also Appleton et al., 2013).
We caution, however, about over-interpreting the significance of the warm molecular fraction. A comparison of this ratio between galaxies is only meaningful if the value of XCO is the same in NGC 3226 to that in other galaxies, including the Milky-Way (see Bolatto, Wolfire & Leroy, 2013, for a complete discussion).
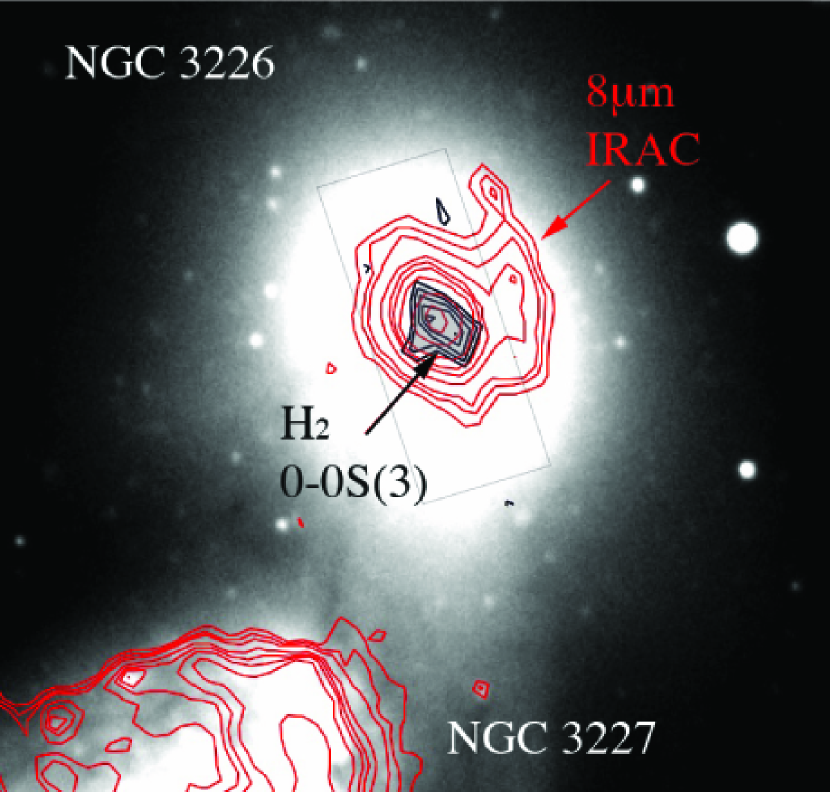
To explore the distribution of the H2 in NGC 3226, we created a spectral cube from spectral maps made with the IRS SL data using the CUBISM software of Smith et al. (2007b). From that cube we extracted a map of the 0-0S(3)9.66m H2 line, after removing a local continuum. This is shown (black contours) in Figure 10 along with the IRAC 8m contours (red contours), both superimposed against a B-band image of the galaxy. The emission from H2 is confined to an elongated structure with a PA 45 and on a smaller scale than the PAH emission (which is much more extensive and symmetrically distributed).
It is reasonable to ask what might be the source of heating of the warm H2 emission? One possibility is that the H2 is heated by the AGN known to lie at the center of NGC 3226. The X-ray luminosity of the nuclear source (George et al., 2001; Ho, 2009) is 4-7 1039 ergs s-1 (scaled to D =15.1 Mpc). Summing just the warm H2 line for the 0-0 S(0), S(1) and S(2) lines gives a warm H2 line luminosity in the range 2.0 1039 ergs s-1 L(H2) is 3.4 1039 ergs s-1, which would imply an impossibly high X-ray gas heating efficiency (the efficiency is expected to be significantly less than 10 Lepp & McCray, 1983). We can therefore rule out X-ray heating of the H2.
A common explanation for the detection of emission from the rotational lines of H2 in normal galaxies is through photoelectric heating from small grains and PAH molecules excited in Photo-Dissociation Regions (PDR) associated with young stars. However, for NGC 3226, we estimate the H2/PAH(7.7 m ratio) to be 0.06, which places it in the class of galaxies which exceeds the efficiency of H2 heating by PDRs (see Roussel et al., 2007) by a large factor (The median value for this ratio for SINGS galaxies is 0.0086). Guillard et al. (2012) used the Meudon PDR code333See http://pdr.obspm.fr/PDRcode.html for details to demonstrate that over a wide range of UV excitation and densities in PDRs, the L(H2 S(0)-S(3)) /L(PAH7.7) ratio cannot exceed 0.04. Ratios exceeding this value must have an additional heating source, such as the dissipation of mechanical energy through shocks and turbulence or very high cosmic rays energy densities.
Evidence that shocks can create very strong heating of H2, and can boost the far-IR cooling from the [CII]158m line has been presented for the intergalactic filament in the Stephan’s Quintet compact group (Appleton et al., 2006; Guillard et al., 2009; Cluver et al., 2010; Appleton et al., 2013), the bridge between the “Taffy’ galaxies (Peterson et al., 2012), as well as in other Hickson Compact Groups (HCGs; Cluver et al., 2013). Ogle et al. (2010) defined galaxies with H2/PAH ratios 0.04 as Molecular Hydrogen Emission Line Galaxies (MOHEGS). Like other MOHEGs, the warm H2 in NGC 3226 is likely heated by mechanical energy through shocks and turbulence. PDR heating must play a minor role, especially given the very low star formation rates we find for this galaxy.
One possibility is that the gas is shock-heated through energy deposited by infall from the HI plume. For a mass infall rate from the plume of = 1 M⊙ yr-1, falling from
a distance of r 10 kpc, and assuming a mass within that radius of = 1011 M⊙, the energy input rate would be = 3 x 1033 W (3 x 1040 erg s-1), which is enough energy to heat the warm H2 with a 10 efficiency.
We cannot completely rule out a role in the shock-heating of the H2 by the AGN. Recently, Ogle, Lanz & Appleton (2014) have shown that even the weak radio jet in NGC 4258 is capable of shock-heating large quantities of molecular hydrogen in that galaxy. NGC 3226 contains a 3.9 mJy flat or inverted spectrum radio source at 5GHz (Filho et
al., 2006) which is compact on milli-arcsecond scales (Nagar, Falcke & Wilson, 2005). However, unlike NGC 4258, there is no direct indication that any radio jet in the system is directly interacting with the host galaxy (in NGC 4258 the so called ”anomalous arms“ are very obvious at many wavelengths).
5 The Spectral Energy Distribution of NGC 3226
5.1 AGN Contribution to IR
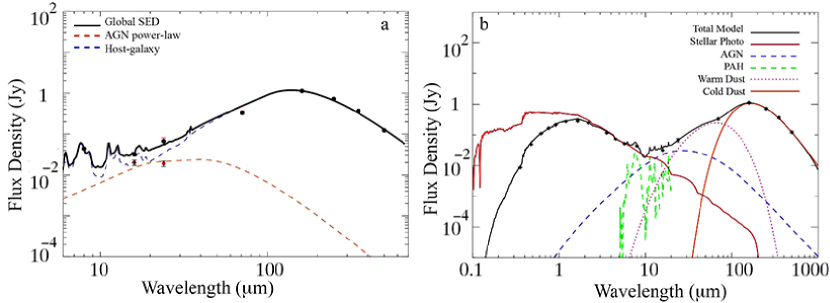
NGC 3226 is known to contain a low-luminosity AGN, and this might manifest itself in the spectral energy distribution (SED) of the galaxy shown in Figure 11a and b (the flux densities plotted are presented in Table 4). We first consider the infrared component of the SED derived from Spitzer (IRAC and MIPS 24m) and Herschel far-IR photometry (70 and 120, 250, 350 and 500m) derived from a 54 arcsec diameter aperture covering the whole galaxy. Figure 11a shows the observed SED and a model decomposition of the SED into an AGN and host galaxy component, using the method of Mullaney et al. (2011). The modeling software developed by these authors, ”
5.2 Star formation estimates and other properties based on SED modeling
The Sajina et al. (2012) modeling described above provides several important parameters that describe the host galaxy, including the star formation rate which is given in Table 5. The star formation rate obtained is found to be 0.046 ( 0.005) M⊙ yr-1. However, in order to provide an alternative estimate, we also repeat the MAGPHYS modeling performed by Lanz et al. (2013), but using more points. MAGPHYS constrains a range of physical properties in the galaxy, such as far-IR luminosity, star formation rate, total dust mass and metallicity. This approach has been used successfully in a number of samples, including large SDSS galaxy samples (da Cunha et al., 2010a), ULIRGs (da Cunha et al., 2010b), and in a large study of early and late type galaxies in HCGs by Bitsakis et al. (2011). We present the results of the fitted parameters in Table 5, along with those measured by Lanz et al. (2013). Since our values differ only slightly from their fit, we do not present the SED graphically, rather we refer the reader to this paper. Using this method, we find a total star formation rate of 0.038 ( 0.0002) M⊙ yr-1. These values are similar to those found using the Sajina et al. model.
The total stellar mass computed by both the Sajina et al, and MAGPHYS models are close to 1010 M⊙, allowing us to calculate the specific star formation rate in the range -11.13 (sSFR) -11.47 yr-1 from both methods. This places it squarely between spiral and elliptical galaxies in the Hickson Compact Group sample of Bitsakis et al. (2010, 2011), consistent with its green-valley ”
6 The recent evolution of NGC 3226
NGC 3226 is far from a normal elliptical galaxy. Although there is evidence that it is strongly interacting with NGC 3227,
the complex web of optical and HI gas in the Arp 94 system as a whole suggests that this is not a simple two-body interaction.
The optical ripples around both galaxies (see Figure 1), and the complex loops and optical spurs around NGC 3226 may suggest that this galaxy itself is the result
of a recent merger, the tidal debris of which may have become shared with NGC 3227. We concentrate here only on the potential connection between
northern HI plume, and recent star formation
in and around NGC 3226, as a complete understanding of the many complexities of Arp 94 is beyond the scope of this paper.
There are several possibilities for the origin of the IRAC-detected filament. The first
is that it is a structure tidally spun out from NGC 3226 from some
pre-existing ring of material orbiting the galaxy–perhaps originally
captured from the gas-rich companion at an earlier time, or, more
likely, it is the result of late-stage accretion onto NGC 3226 from
the large neutral hydrogen plume. We favor the second explanation on
kinematic grounds, and because material falling back onto
both galaxies is expected in mature tidal systems like Arp 94 from
modeling arguments (Struck, 1997).
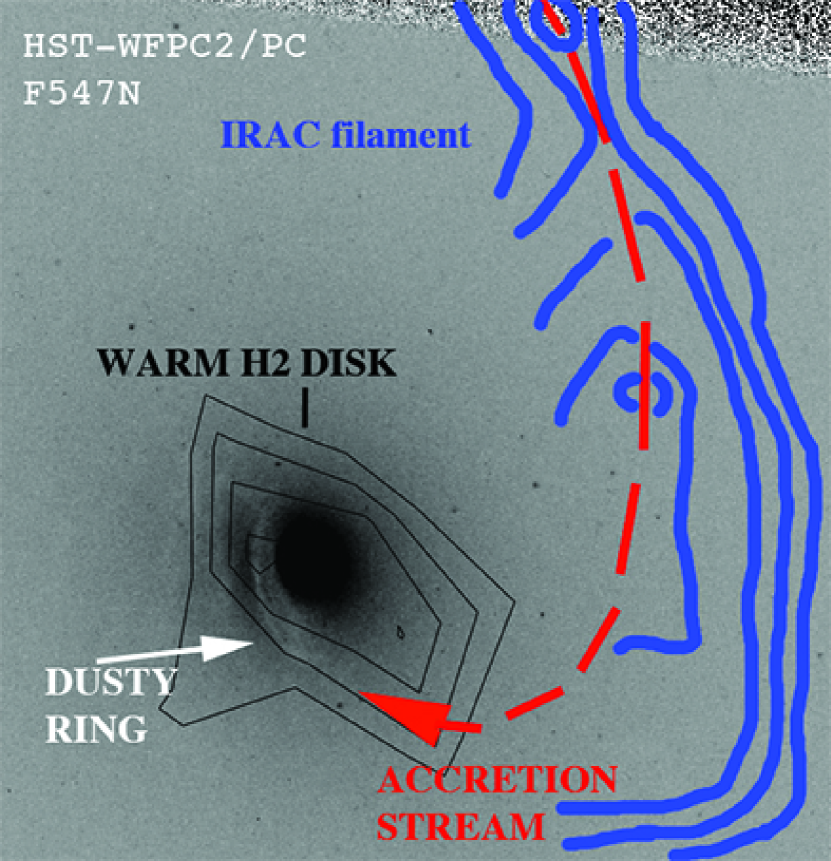
Asymmetric strong dust absorption structures, such as the
incomplete dust absorption ring structure is seen in the deep HST B-band image of NGC 3226, and reproduced in Figure 12, have often been associated with possible infall events (Tran et al., 2001; Martel et al., 2004). We superimpose the warm H2 distribution from the IRS cube as well as a schematic of the position of
the IRAC filament on the image. One possibility is that the dusty/PAH emitting filament (which is associated with the HI plume)
is feeding the warm H2 disk and dust-lanes seen in Figure 12. As discussed by (Simões Lopes et al., 2007), the presence of nuclear dust lanes may also correlate with AGN activity.
Is there a kinematic connection that might link the structures?
We note that the systemic velocity of NGC 3226 (determined optically) is
1313 (13) km s-1, approximately 100 km s-1 higher than the central
velocity of the IRAC filament (measured using HI). Atlas3D IFU data (Krajnović et al., 2011) provides information on the rotation of the stars
(91 km/s peak values along a kinematic major axis PA 28 of deg.).
The scale of this rotating stellar core is large enough to extend
towards the point where the IR filament reaches the minor axis. More recently unpublished Atlas3D
imaging of the ionized gas in NGC 3226 (M. Sarzi, University of Hertfordshire; Private Communication)
shows a clear connection between a rotating ionized disk in NGC3226 and the filament–with
ionized gas in the filament having a similar velocity to the HI (around 1260-1280 km s-1).
It is not unreasonable to speculate that the HI/dust filament may be feeding
both the warm H2 disk and the ionized disk.
As Davis et al. (2011) have pointed out, in fast rotators like NGC 3226, there are many cases where aligned (or almost aligned) stellar and ionized gas disks exist in galaxies that have clear evidence of external accretion. In this case the kinematic axes of the stellar and ionized-gas disks are not strongly divergent, with position angles of
28 and 36 respectively (see also Krajnović et al., 2011) with an uncertain of 6. We measure the position angle of the major axis of the incomplete dust ring in Figure 12 to be very similar (28) to the stellar disk rotation major axis, suggesting that the dust has settled into the rotational plane of the stars. However, we find that the position angle of the warm molecular disk 45, is significantly different from the other components, indicating that it may be dynamically unrelaxed.
A rough estimate of the accretion rate onto NGC 3226 can be
obtained by dividing the HI mass in the dusty part of the filament by
the fall-back time onto the galaxy. There is a small velocity gradient
along the filament (from inspection of Figure 6 of Mundell et
al. 1995) which is 2.9 km s-1 kpc-1. Inverting this gives a timescale of
approximately 300 Myr, which would be an upper limit to
the time taken for gas to move along the filament. This timescale could be much shorter since the free-fall time for gas at 10 kpc for a galaxy of mass 1011 M⊙ is approximately 70 Myr. However, given the effects of tidal interactions, gas is unlikely to fall radially onto the galaxy, and so the actual infall rate may be somewhere between these two values. Taking the HI mass
of the inner filament (we only include the gas shown in Figure 7 which is contained within 5 kpc of the galaxy) we obtain a very approximate accretion rate of dM/dt
0.3 M yr-1. As discussed above this is likely a conservative lower limit because the infall time could shorter.
This rate is close that needed to heat the warm H2-see Section 4. This accretion rate implies that
108 M of HI could pile up into the center of NGC 3226 over a few hundred Myrs. Hence
a substantial disk of material could be formed in the core of the
galaxy during the later stages of the collision. We have already shown
that the warm molecular hydrogen disk has an H2 mass of 0.75–1.1 10M⊙, which could be
supplied to the galaxy through from the HI filament. Since the inner parts of NGC 3226 contain both ionized and
warm molecular gas, it is possible that the mainly neutral in-falling gas is shock-heated as it falls into the nucleus. Attempting to model this possible
accretion process through various ISM phases is beyond the scope of this observational paper.
6.1 Is the measured SF activity consistent with the galaxy transitioning from red to green by resurgence of star formation?
The very low star formation rate obtained from the UV to far-IR SED fitting, along with the predominantly warm state of the molecular hydrogen
in the core, argues against the idea that
NGC3226 could lie in the UV-optical green-valley because of a possible resurgence of star formation. For example, a reasonable ”
6.2 Does NGC 3226 fit into a broader picture of star formation ”
It is tempting to see NGC 3226 as a pathological case which shares little in common with other green valley galaxies. However, the environment of NGC 3226 may share some similarities with denser galaxy environments, like compact groups. This would be especially true if, as we suspect, NGC 3226 is actually itself a relatively recent merger product . The loops and filaments spread throughout the system shown in Figure 2 certainly suggest that the Arp 94 system was composed of more than two galaxies in the past.
Recently Cluver et al. (2013) has shown that 10 of HCG galaxies studied by the Spitzer’s IRS contain galaxies with enhanced L(H2)/L(PAH7.7) ratios. These MOHEG-classified HCG galaxies predominantly lie in the UV-optical green valley, and have unusually low sSFR. NGC 3226 shares similar properties to these galaxies. Johnson et al (2007) and Walker et al. (2010) suggested that these galaxies are undergoing some kind of transition from the blue cloud to the green valley based on their IR colors, and Cluver et al. (2013) suggested that shocks and turbulence may partly be responsible for their green-valley colors by helping to suppress star formation. In one example studied in detail, HCG57A, Alatalo et al. (2014a) have shown that star formation seems to be suppressed in regions of the galaxy which are experiencing large disturbances in the CO-measured velocity-field caused by a collision with a companion. NGC 3226, which is clearly disturbed, shares some of the same properties of these unusual HCG galaxies.
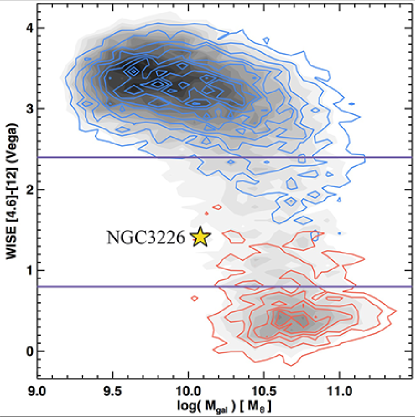
If NGC 3226 is really a composite galaxy formed by the recent merger of two smaller galaxies, then perhaps the green-valley nature of NGC 3226 can be explained as a galaxy caught in the late stages of star formation quenching. For example, the merger may have largely exhausted its gas supply, and its ability to form many new stars. Further suppression by the action of shocks from external tidal accretion may also play a role. Some support for this picture can be seen by considering the WISE (Wide-field Infrared Survey Explorer; Wright et al., 2010) colors of the galaxy. Figure 13 shows a WISE color-mass diagram from Alatalo et al. (2014b) showing a strong bifurcation of galaxies into late-type and early type galaxies from a spectroscopically selected SDSS sample. Alatalo et al. show that there exists an Infrared Transition Zone (IRTZ) which likely contains quenched galaxies which are moving from the top part of the diagram (blue contours = gas rich late-type galaxies) towards the lower part of the diagram (red contours = red cloud galaxies). The IRTZ galaxies are shown to predominantly have the spectral signatures of LINER galaxies and shocked post-starburst galaxy candidates based on their optical spectral-line ratios. NGC 3226 falls within the lower part of the transition zone444We obtained the WISE 4.6 and 12m magnitudes from the ALLWISE survey catalog (Wright et al., 2010). NGC3226 has w2gmag (4.6m) and w3gman (12m) values of 8.6660.008 and 7.250.02 mag.. It is therefore consistent with being part of a larger transitional population of galaxies in which shocks or low-luminosity AGNs play a role in transitioning the galaxies. Further work on the stellar populations in NGC3226, such as searching for evidence of a post-starburst population hinting at recent quenching, would be worthwhile.
7 Conclusions
By combining mainly archival infrared observations from Spitzer and Herschel, with optical images from HST we have expanded our understanding of the green-valley elliptical galaxy NGC 3226 and have come to the following conclusions:
1) A narrow filament is detected in the mid-IR extending into the core of the galaxy, approximately terminating at the scale of a dusty ring or partial spiral seen in deep optical HST images and a warm H2 disk (next item). The filament is closely associated with HI emission from a much larger HI plume which extends to the north, but which kinematically ends at the filament, and is spatially coincident with it. The filament–which mainly glows in the light of PAH molecules and probably molecular hydrogen emission, is likely heated by string of tiny HII regions (SFR 3 x 10⁻³ yr-1) which we detect at the termination of this HI plume. The median star formation rate in the filament clumps is about 7 of the star formation rate of the entire galaxy. We suggest that the HI plume is feeding material into the center of the galaxy.
2) Spitzer IRS observations of NGC 3226 show the existence of a 1 kpc-scale warm disk of molecular hydrogen of 0.75–1.1 107 M⊙ which has a different orientation (by 17) from the major-axis of the dusty incomplete nuclear ring, and the position angle of the major axis of the fast stellar rotation seen in the galaxy’s core. This differences may imply that the warm molecular disk is not yet in dynamical equilibrium with the other components.
3) We can rule out heating of the warm H2 gas disk by either X-rays from the low-luminosity AGN, or a dominant PDR component associated with star formation. Instead, we suggest that the H2 line luminosity can be explained by shock heating. We favor HI gas accretion as the source of the mechanical heating. An accretion rate of 1 M⊙ yr-1 would be needed (assuming a 10 efficiency) to balance the observed warm H2 line luminosity, which we show is plausible.
4) The bulk of the molecular gas in NGC 3226 is warm (with M(H2)warm/M(H2)cold 0.3) based on an upper limit to the detection of CO in the system. Such gas may not be conducive to significant star formation if it is turbulently heated (see Cluver et al., 2010). Alternatively, the conversion factor XCO assumed for Galactic emission may be a factor of 4 higher in NGC 3226 if the in-falling gas has low metalicity.
5) We measure the star formation rate in the galaxy globally to be
very small ( 0.04 M⊙ yr-1). Since NGC 3226 lies in the UV-optical green-valley ([NUV-r]corr = 4.35), we show that
the current star formation rate in NGC 3226 is insufficient to explain the ”green“ colors of the galaxy based on a resurgence of
star formation, unless the star formation rate was significantly higher in the past. The SED is also consistent with the existence
of a hot dust component which we associate with the AGN, which contributes no more than 20 to the bolometric luminosity of the galaxy.
6) NGC 3226 has some similar properties to a subset of early-type galaxies in Hickson Compact Groups that may be undergoing rapid evolution (low specific star formation rate, green UV-optical colors, large warm H2/PAH ratio). We also show that NGC 3226
lies in the newly discovered WISE infrared transition zone for SDSS galaxies (Alatalo et al., 2014b). This zone, which may signify evolution from dusty late-type galaxies to dust-free early type galaxies, has been shown to be dominated by galaxies with LINER and post-starburst shocked-gas optical spectra. NGC 3226 may, despite its complex dynamical environment, fall on a continuum of galaxies undergoing star formation quenching.
References
| Knot | S(8m)dusta,b | Huncb,d flux (x 10-15 | Log(L(8m))b | log(L(Hunc))b,d | SFR(Hunc))b,c | SFR(8m+H)b,e |
| (mJy) | ergs s-1 cm-2) | (erg s-1) | (erg s-1) | (10-3 M⊙yr-1) | (10-3 M⊙yr-1) | |
| (1) | (2) | (3) | (4) | (5) | (6) | (7) |
| A | 0.51 (0.1) | 1.5 (0.15) | 39.71 | 38.23 | 0.9 | 1.2 |
| B | 0.42 (0.1) | 4.7 (0.2) | 39.63 | 38.73 | 2.8 | 3.1 |
| C | 0.91 (0.1) | 5.0 (0.2) | 39.96 | 38.76 | 3.0 | 3.6 |
| D | 0.82 (0.1) | 4.6 (0.2) | 39.92 | 38.72 | 2.8 | 3.3 |
| E | 0.53 (0.1) | 4.4 (0.2) | 39.81 | 38.70 | 2.7 | 3.0 |
| IRS Module | 6.2m PAH | 7.7m PAH | 11.3m PAH | 12.6mPAH | 0-0S(3)9.7m | 11.3/7.7 | 6.2/7.7 |
|---|---|---|---|---|---|---|---|
| SLa | 15.0 (1.5) | 67.1 (6.7) | 44.6 (4.5) | 19.9 (2.0) | 2.35 (0.3) | 0.66 | 0.22 |
| IRS Module | 0-0S(0)28.2m | 0-0S(1)17.0m | 0-0S(2)12.3m | 11.3m PAH | [NeII]12.8m | [NeIII]15.5m | [SiII]34.8m |
| LH | 1.8 (0.15) | - | - | - | - | - | 2.53 (0.29) |
| SHb | - | 9.2 (0.4) | 1.5 (0.6) | 94 (10) | 7.8 (0.67) | 5.7 (0.24) | - |
| SHc(Preferred) | - | 4.6 (0.2) | 0.75 (0.3) | 47 (6) | 4.0 (0.34) | 2.8 (0.12) | - |
| UVW2a | NUVb | UVW1a | SDSSuc | SDSSgc | SDSSrc | SDSSic | SDSSzc |
| (mJy) | (mJy) | (mJy) | (mJy) | (mJy) | (mJy) | (mJy) | (mJy) |
| 0.86 (0.09) | 1.24 (0.12) | 2.65 (0.39) | 8.71 (0.45) | 49.2 (2.0) | 110.7 (6.0) | 166 (9) | 211 (10) |
| Jd | Hd | Ksd | IRAC-3.6me | IRAC-4.5me | IRAC-5.8me | IRAC-8me | IRS-16me |
| (mJy) | (mJy) | (mJy) | (mJy) | (mJy) | (mJy) | (mJy) | (mJy) |
| 275 (25) | 286 (28) | 249 (25) | 117 (7) | 74 (4) | 51.9 (2.8) | 44.0 (1.4) | 32 (6) |
| MIPS-24me | PACS-70me | PACS-160me | SPIRE-250me | SPIRE-350me | SPIRE-500me | ||
| (mJy) | (mJy) | (mJy) | (mJy) | (mJy) | (mJy) | ||
| 67 (7) | 332 (17) | 1133 (56) | 722 (4) | 367 (15) | 123 (10) |
| Source | v | Log(sSFR) | Log(SFR) | Log(LAGN) | Log(Ldust) | Log(Stellar Mass) | Log(Mdust) | Cold Dust | Warm Dust |
|---|---|---|---|---|---|---|---|---|---|
| (yr-1) | (M⊙ yr-1) | (L⊙) | (L⊙) | (M⊙) | (M⊙) | Temp. (K) | Temp. (K) | ||
| AGN+SFa | 1.93 | -11.13 | -1.34f | 7.70 | – | 9.79 | 6.62 | 16.34 | – a |
| MAGPHYSb | 0.34c | -11.47 | -1.43 | – | 8.63 | 10.07 | 6.09 | 17.2 | 59.4 |
| Lanz et al. (2013)d | 0.91 | -11.67e | -1.35 | 9.14 | 10.36 | 6.00 | 24.1 | 54.4 |