Dynamic conductivity scaling in photoexcited V2O3 thin films
Abstract
Optical-pump terahertz-probe spectroscopy is used to investigate ultrafast far-infrared conductivity dynamics during the insulator-to-metal transition (IMT) in vanadium sesquioxide (V2O3). The resultant conductivity increase occurs on a tens of ps timescale, exhibiting a strong dependence on the initial temperature and fluence. We have identified a scaling of the conductivity dynamics upon renormalizing the time axis with a simple power law () that depends solely on the initial, final, and conductivity onset temperatures. Qualitative and quantitative considerations indicate that the dynamics arise from nucleation and growth of the metallic phase which can be described by the Avrami model. We show that the temporal scaling arises from spatial scaling of the growth of the metallic volume fraction, highlighting the self-similar nature of the dynamics. Our results illustrate the important role played by mesoscopic effects in phase transition dynamics.
The variety of electronic, magnetic and structural phases exhibited by transition metal oxides arise from a delicate balance between competing degrees-of-freedom whose contribution to the macroscopic properties is challenging to ascertain Rondinelli and Spaldin (2011). An increasingly successful approach to tackle this problem is that of time resolved experiments, where ultrafast excitation and probing enables the determination of the fundamental timescales of the material down to femtosecond resolution Schuller and Gray (1976); Orenstein (2012); Zhang and Averitt (2014). Access to specific energy scales and modes of the system is made possible by ultrafast sources ranging from terahertz (THz) to x-rays frequencies. Initial all-optical measurements of electron-phonon relaxation in metals Brorson et al. (1990); Sun et al. (1994) have paved the way to time resolved investigations of complex systems, from spins in magnetic materials van Kampen et al. (2002); Zhu et al. (2005); Kampfrath et al. (2011); Vicario et al. (2013); Graves et al. (2013) to superconducting gaps Demsar et al. (2003); Matsunaga and Shimano (2012) or to surface charges in topological insulators Wang et al. (2013).
To date, most time-resolved experiments in complex transition metal oxides, and in particular the vanadates, have focused on microscopic dynamics Cavalleri et al. (2001, 2004); Kubler et al. (2007); Mansart et al. (2010); Pashkin et al. (2011); Liu et al. (2011); Wall et al. (2012); Cocker et al. (2012). For example, fast sub-ps electronic and structural responses have been reported for vanadium dioxide Cavalleri et al. (2001, 2004); Kubler et al. (2007); Pashkin et al. (2011); Wall et al. (2012); Cocker et al. (2012), though the precise driving mechanism of the IMT remains unclear Biermann et al. (2005); Lazarovits et al. (2010). However, it is increasingly evident from static measurements that nano-to-meso scale phase coexistence plays a crucial role in determining the properties of complex materials, including cuprates, manganites, and vanadates Dagotto (2005); Basov et al. (2011); Qazilbash et al. (2011); Liu et al. (2013). This naturally extends to the dynamic investigation of the phase coexistence stage, as investigated in VO2 Hilton et al. (2007); Pashkin et al. (2011); Liu et al. (2012); Cocker et al. (2012). At a minimum, neglecting mesoscale effects can lead to a misinterpretation of the dynamics. More importantly, as shown in this letter, mesoscale dynamics are of intrinsic interest from fundamental and applied perspectives.
V2O3 is a paramagnetic metal with rhombohedral crystal symmetry McWhan et al. (1969, 1971, 1973); Qazilbash et al. (2008); Stewart et al. (2012); Hansmann et al. (2013) that undergoes a first order phase transition to an antiferromagnetic insulating state at K, accompanied by a change to a monoclinic crystal structure McWhan and Remeika (1970). In this letter, we present the mesoscopic conductivity dynamics of V2O3 across the insulator-to-metal transition following an optical initiated picosecond thermal quench into the metallic state. Importantly, we identify scaling of the conductivity dynamics upon renormalizing the time axis with a simple power law () that depends solely on the experimentally determined temperatures. These temperatures consist of the initial temperature , final temperature, (determined by and the incident fluence, ), and conductivity onset temperature, K (defined as the onset of a macroscopic THz conductivity which, for a system, occurs at a volume fraction of ). Further, the temporal evolution of the conductivity is well fit by the Avrami model consistent with nucleation and growth of the metallic phase. In conjunction with scaling, this allows us to demonstrate that the temporal rescaling arises from spatial scaling of the metallic volume fraction. Thus, the mesoscopic conductivity dynamics of the IMT are dictated by a length scale, , associated with metallic phase domain coarsening. Our analysis further indicates that the growth of the metallic phase is ballistic, occurring at the sound velocity.
Growth of thick V2O3 films was performed in an ultrahigh purity Ar environment by rf magnetron sputtering of a V2O3 target onto an r-plane (102) sapphire substrate Stewart et al. (2012). X-ray diffraction characterization indicates near single crystal growth following the substrate orientation. Transient conductivity measurements are performed using eV, fs pulses from a mJ Ti:Sapph amplifier. Incident pump fluences, to mJ/cm2, remain below the damage threshold for V2O3 Liu et al. (2011). THz probe pulses are generated and detected in thick ZnTe crystals.
We first present the V2O3 static conductivity characterization using THz time-domain spectroscopy (i.e. the photoexcitation is blocked). The temperature dependent real part of the Drude conductivity, , is shown in Fig. 1(a). The IMT occurs at K, with a narrow hysteresis associated with its first order nature Ramírez et al. (2009). As indicated by the arrow in Fig. 1(a), K corresponds to the temperature above which a finite THz conductivity arises.
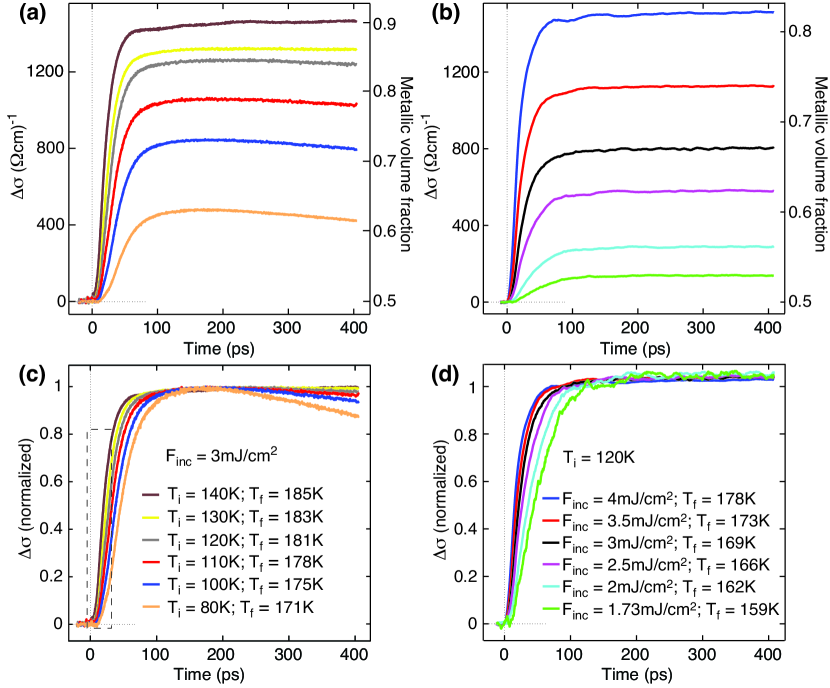
Optical-pump THz-probe experiments were performed for several () and values. Photoexcitation at initiates an ultrafast heat quench in the V2O3 film, where excited electrons relax via phonon emission in ps (as determined from the two temperature model Kaganov et al. (1957); Anisimov et al. (1974); Allen (1987); Brorson et al. (1990)). In other words, heating from to occurs in ps, setting up a nonequilibrium situation where the insulating phase is unstable, leading to metallic phase growth. As such, changes in the transient THz conductivity are reflective of nucleation and growth dynamics. One of the hallmarks of a photoinduced phase transition is the observation of a fluence threshold, , for the onset of the IMT, as shown in Fig. 1(b) as a function of . decreases with increasing and is in line with what is observed in VO2 Hilton et al. (2007); Pashkin et al. (2011). The determination of is made possible by detailed measurements of the conductivity dynamics which are considered in greater detail in Fig. 2. Figure 2(a) shows (for various ) for mJ/cm2, corresponding to an absorbed energy density of J/cm3. increases over of ps following photoexcitation, and saturates at long times to a value corresponding to . In fact, comparison of ps with Fig. 1(a) provides a means to estimate , and is consistent with two temperature model estimates (Fig. S1 sup ). Varying at fixed leads to variations in and consequently in , as shown in Fig. 2(b). Clearly, the dynamics depend on both and .
Further insight into the dynamics can be obtained by normalizing the data, as illustrated in Figs. 2(c) and 2(d). Fig. 2(c) shows that the rise time is faster for increasing . For instance, for K the maximum in is reached in ps, while for K it takes ps. The rise time is also faster for increasing , as shown in Fig. 2(d). A detailed analysis of these rise time dynamics will be presented below and constitutes the main result of this letter.
A partial recovery of is observable with decreasing , as shown in Figs. 2(a) and 2(c).
Recovery on this timescale is unlikely due to heat escape from the sample which typically takes several nanoseconds Bechtel (1975); Demsar et al. (1997); Wen et al. (2013), though our data does not allow us to unequivocally rule out such a ps-scale decrease of due to cooling.
The recovery may be related to the decreased stability of the metallic volume fraction distribution at low , associated with a larger fraction of metallic regions whose characteristic dimensions are too small to undergo stable growth Caviglia et al. (2012).
The qualitative discussion of the conductivity dynamics presented above suggests the primary role of nucleation and growth, with a clear dependence on and . In the following, we investigate these dynamics in greater detail, first demonstrating their temperature dependent scaling. The temperature above which a macroscopic conductivity can be measured, , is the critical temperature characteristic of the nucleation and growth process that underlies the IMT. It is therefore reasonable to expect a dependence of the IMT dynamic properties on Khomskii (2010). The curves collapse by scaling the time axis as shown in Fig. 3. In Fig. 3(a) is kept fixed at mJ/cm2 and is varied between K and K (cf. Figs. 2(a) and 2(c)). Scaling of the time axis by the dimensionless factor, , with , leads to a collapse of all the curves with different values (Fig. 3(a)). The same scaling leads to the collapse of the dynamics for mJ/cm2 (Fig. S2 sup ), which is close to at low temperatures (Fig. 1(b)). However, varying corresponds to a variation not only of but also of . A variation of alone can be achieved by fixing and varying . Fig. 3(b) shows results for a fixed K and for values between and mJ/cm2 (cf. Figs. 2(b) and 2(d)). A collapse of the normalized curves arises if the time axis is rescaled by (Fig. 3(b)). Notably, the scaling behavior relies on the experimentally determined , and values. The only parameter that is varied to achieve the scaling shown in Fig. 3 is the exponent .
To determine the value of that provides the best scaling of the data, a scaling error was calculated for each value of sup .
The optimal values of are seen to lie close to and these minimized values were used to scale the data in Figs. 3(a) and 3(b). This temporal scaling is quite remarkable, indicating that the processes underlying the conductivity dynamics must also exhibit scaling. Further, the mean-field-like exponent of suggests that fluctuations are not dominant, and that a simple model can provide additional insights Binder (1987); Chaikin and Lubensky (2000). In the following, we consider these results in terms of the nucleation and growth of the metallic volume fraction, .
The IMT in V2O3 is known to arise from nucleation and growth of metallic domains in an insulating background Lupi et al. (2010); Mansart et al. (2012); McLeod et al. (2014). The metallic volume fraction, , can be calculated from using the Bruggeman effective medium approximation:
| (1) |
where and correspond to metallic and insulating state conductivities, respectively, and the dimensionality for thin films Choi et al. (1996); Hilton et al. (2007). In the temperature range where , taking is a valid approximation, and Eq. 1 yields a linear dependence of on , . The right axis of Fig. 1(a) shows across the IMT. The correspondence between and values derived from THz time-domain spectroscopy data is strictly valid only in the K range (unshaded region of the curve). For K, and the decrease in , consistent with previous reports, arises from correlation effects, beyond a simple thermally induced increase in the scattering rate Qazilbash et al. (2008); Liu et al. (2011); Stewart et al. (2012); Hansmann et al. (2013). For K, the approximation in Eq. 1 breaks down. DC resistivity measurements yield a thermally activated , which we use to estimate below K from Eq. 1. It is clear that a non-zero for implies a non-zero well below . This is an important consideration for time-resolved experiments, where the initial condition is a mixed phase with metallic volume fraction .
Classical models of nucleation and growth predict a dynamic evolution of the volume fraction , which can be described by the Avrami equation Papon et al. (2002),
| (2) |
where is the rate at which increases, and is an exponent that depends on the dimensionality and nature of the nucleation and growth. As mentioned above, for , a linear relationship exists between and . The photoinduced conductivity variations we measure, , are therefore proportional to , and Eq. 2 can be used to fit the normalized data. A good fit is obtained for sup , as illustrated by the grey crosses in Figs. 3(a) and 3(b). Rescaling the time axis effectively corresponds to a rescaling of . This is highlighted by the rescaled fitting curves, shown as black crosses in Figs. 3(a) and 3(b), which are obtained by replacing by (Fig. 3(a)) and by (Fig. 3(b)) in Eq. 2, while keeping the time axis unchanged. Such a behavior implies a temperature dependence of , and , i.e. the IMT is faster for increasing and .
Both nucleation and growth contribute to . In the current experiments, prior to the optically induced quench to , the sample is at with a volume fraction of metallic nuclei . The ultrafast quench to modifies the free energy landscape with a shift of the minimum from the insulating to the metallic phase. Therefore, the energy gain associated with the IMT following photoexcitation drives the growth of metallic domains leading to an increasing volume fraction. A model that is consistent with describes two-dimensional interfacial growth with quickly exhausted nucleation Papon et al. (2002). This yields
| (3) |
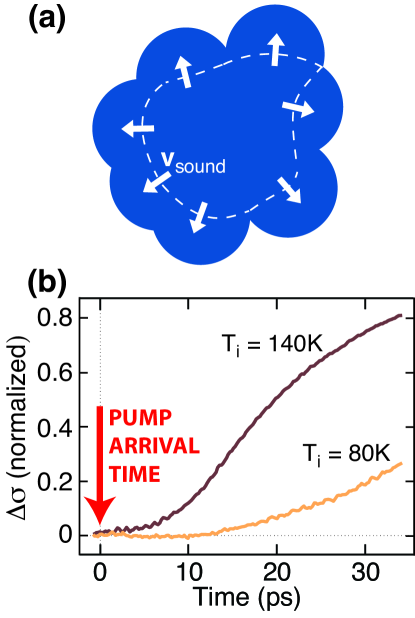
where is the domain density and is the growth velocity. A schematic of this process (in ) is shown in Fig. 4(a), with the metallic regions, shown in blue, growing at velocity , as indicated by the white arrows. Eq. 3 contains independent contributions from growth, through , and nucleation, through , allowing for additional insight into the experimental conductivity dynamics. We note that in thin film samples excited homogeneously across the entire thickness (the penetration depth of the optical pump is on the order of the film thickness) the growth is essentially (in-plane growth) Choi et al. (1996).
We first consider the growth of the metallic regions where the interface (domain wall) separating the metallic and insulating phases propagates at , defining a characteristic size given by the local radius of curvature . It is worth noting that the structural transition which accompanies the IMT in V2O3 implies that cannot exceed the propagation velocity for structural distortions, i.e. the sound velocity, . Growth of the metallic phase at is ballistic rather than diffusive, and is in line with previous descriptions of thermally driven IMT in vanadates as martensitic, i.e. diffusionless Shadrin and Il’inskii (2000); Lopez et al. (2002). An estimate of using for V2O3 strongly suggests that growth is in the ballistic limit. Making the assumption that is given by the effective nuclei density Lopez et al. (2002) and taking Seikh et al. (2006) yields ps-2, consistent with the ps rise times we observe (corresponding to , from Eq. 2). Of course the assumption that corresponds to the equilibrium defect density is rather crude, but nonetheless verifies the applicability of the Avrami model and suggests interfacial ballistic growth of the metallic phase as the underlying dynamics of the macroscopic conductivity increase following photoexcitation.
Given that the sound velocity in V2O3 varies little with temperature Seikh et al. (2006), the temperature dependence (and hence the scaling) of arises from nucleation processes that give rise to . That is, in the and range we are exploring in these experiments, the metallic domain density must exhibit and . Since the growth is ballistic (i.e. it proceeds at the maximum allowed velocity), it is changes in that determine the conductivity rise time dynamics. This means that for increasing , the initial domain density available for growth increases. Additionally, with increasing , increases meaning that the photoinduced thermal quench increases the domain density available for subsequent growth. Thus, the evolution of is fairly complicated and strongly dependent on the details of the nucleation process.
Nucleation has been reported to occur preferentially at defect sites on VO2 and V2O3 Hansmann et al. (2013). Such defect pinning effects can influence the IMT dynamics, leading to two limiting situations. For samples with a large defect density the nucleation is entirely heterogeneous and is expected to occur quasi-instantaneously (e.g. ps), so that all nuclei are immediately available for growth Papon et al. (2002); Lopez et al. (2002). In clean samples, on the other hand, nucleation is essentially homogeneous and new nuclei formed during a finite period after the quench constitute a sizable fraction of the overall nuclei density from which the growth proceeds Papon et al. (2002); Rethfeld et al. (2002). Neither of these limits appear to be completely verified in our experiments.
Importantly, the time delay, , for the onset of (when ) following photoexcitation is quite long, on the order of a few picoseconds (Figs. 2 and 4(b)). is longer for lower , as detailed in Fig. 4(b), where for K, ps, while for K, ps. The longer for lower is consistent with a smaller . We have observed that is sample dependent hinting at the possibility of variations of the nucleation process with defect density, such that films with a lower extrinsic defect density have a larger homogeneous nucleation contribution. However, homogeneous nucleation models predict an exponential increase of the nucleation rate (not to be confused with ) with superheating (), i.e. with sup ; Papon et al. (2002); Rethfeld et al. (2002), while in the heterogeneous limit the dependence on becomes a power law sup ; Lopez et al. (2002). Thus, the experimentally observed power law scaling attests to a significant heterogeneous contribution to the nucleation. Our analysis indicates that the dynamics can, to a certain extent, be controlled by the defect density. The higher the defect density, the faster the mesoscopic conductivity will be established after photoexcitation. This would come at the expense of a reduced metallic state conductivity.
More detail will be achievable once samples with controllable defect densities become available Ramirez et al. (2014), since our data suggests that a change in the dependence of is to be expected as nucleation becomes more homogeneous (i.e. decreased defect density). A change in the initial time delay, (Fig. 4(b)), would also be expected with variations in defect density. That is, with heterogeneous dominated nucleation, would be shorter since growth could proceed immediately, whereas for increasingly homogeneous nucleation, would increase since nuclei would need to be formed prior to growth. There is some evidence of this in our studies of different samples. Details of the scaling exponent should be accessible by Monte Carlo simulations. Further insight into can also be gained from considering different system dimensionalities sup . As discussed in Ref. sup , the geometry of domain growth is sensitive to the dimensionality of the system, and so is in Eq. 2. The dynamic scaling we identified provides a simple yet robust means to analyze nucleation and growth dynamics during first order transitions. In general, from an experimental perspective, an obvious follow-up to the present work would be to analyze samples with different morphologies and a controlled defect density, and using time resolved techniques that reveal the spatial distribution of the metallic domains at the mesoscale.
In summary, our conductivity dynamics investigations of the IMT in V2O3 thin films reveal the temperature dependence of domain growth through dynamic scaling of the rise time. These results highlight the importance of the mesoscale in shaping the dynamic evolution of first order IMTs. Such a temperature dependence of the dynamics provides additional control over the properties of transition metal oxides. This dependence must, furthermore, be taken into account when investigating materials where phase coexistence plays a significant role in the IMT.
Acknowledgements.
The authors would like to thank A. Polkovnikov and A. Sandvik for useful discussions. E.A. and R.D.A. acknowledge support from DOE - Basic Energy Sciences under Grant No. DE-FG02-09ER46643. E.A. acknowledges support from Fundação para a Ciência e a Tecnologia, Portugal, through doctoral degree fellowship SFRH/ BD/ 47847/ 2008. The research at UCSD (S.W., G.R., I.K.S.) was supported by the AFOSR Grant No. FA9550-12-1-0381.References
- Rondinelli and Spaldin (2011) J. M. Rondinelli and N. A. Spaldin, Adv. Mater. 23, 3363 (2011).
- Schuller and Gray (1976) I. K. Schuller and K. E. Gray, Phys. Rev. Lett. 36, 429 (1976).
- Orenstein (2012) J. Orenstein, Phys. Today 65, 44 (2012).
- Zhang and Averitt (2014) J. Zhang and R. D. Averitt, Annu. Rev. Mater. Res. 44, 19 (2014).
- Brorson et al. (1990) S. D. Brorson, A. Kazeroonian, J. S. Moodera, D. W. Face, T. K. Cheng, E. P. Ippen, M. S. Dresselhaus, and G. Dresselhaus, Phys. Rev. Lett. 64, 2172 (1990).
- Sun et al. (1994) C.-K. Sun, F. Vallée, L. H. Acioli, E. P. Ippen, and J. G. Fujimoto, Phys. Rev. B 50, 15337 (1994).
- van Kampen et al. (2002) M. van Kampen, C. Jozsa, J. Kohlhepp, P. LeClair, L. Lagae, W. de Jonge, and B. Koopmans, Phys. Rev. Lett. 88, 227201 (2002).
- Zhu et al. (2005) X. Zhu, Z. Liu, V. Metlushko, P. Grütter, and M. Freeman, Phys. Rev. B 71, 180408(R) (2005).
- Kampfrath et al. (2011) T. Kampfrath, A. Sell, G. Klatt, A. Pashkin, S. Ma, T. Dekorsy, M. Wolf, M. Fiebig, A. Leitenstorfer, and R. Huber, Nat. Photonics 5, 31 (2011).
- Vicario et al. (2013) C. Vicario, C. Ruchert, F. Ardana-Lamas, P. M. Derlet, B. Tudu, J. Luning, and C. P. Hauri, Nat. Photonics 7, 720 (2013).
- Graves et al. (2013) C. E. Graves, A. H. Reid, T. Wang, B. Wu, S. de Jong, K. Vahaplar, I. Radu, D. P. Bernstein, M. Messerschmidt, L. Müller, R. Coffee, M. Bionta, S. W. Epp, R. Hartmann, N. Kimmel, G. Hauser, A. Hartmann, P. Holl, H. Gorke, J. H. Mentink, A. Tsukamoto, A. Fognini, J. J. Turner, W. F. Schlotter, D. Rolles, H. Soltau, L. Strüder, Y. Acremann, A. V. Kimel, A. Kirilyuk, T. Rasing, J. Stöhr, A. O. Scherz, and H. A. Dürr, Nat. Mater. 12, 293 (2013).
- Demsar et al. (2003) J. Demsar, R. D. Averitt, A. J. Taylor, V. V. Kabanov, W. N. Kang, H. J. Kim, E. M. Choi, and S. I. Lee, Phys. Rev. Lett. 91, 267002 (2003).
- Matsunaga and Shimano (2012) R. Matsunaga and R. Shimano, Phys. Rev. Lett. 109, 187002 (2012).
- Wang et al. (2013) Y. H. Wang, H. Steinberg, P. Jarillo-Herrero, and N. Gedik, Science (80-. ). 342, 453 (2013).
- Cavalleri et al. (2001) A. Cavalleri, C. Tóth, C. W. Siders, J. A. Squier, F. Ráksi, P. Forget, and J. C. Kieffer, Phys. Rev. Lett. 87, 237401 (2001).
- Cavalleri et al. (2004) A. Cavalleri, T. Dekorsy, H. Chong, J. Kieffer, and R. W. Schoenlein, Phys. Rev. B 70, 161102(R) (2004).
- Kubler et al. (2007) C. Kubler, H. Ehrke, R. Huber, R. Lopez, A. Halabica, R. F. Haglund, and A. Leitenstorfer, Phys. Rev. Lett. 99, 116401 (2007).
- Mansart et al. (2010) B. Mansart, D. Boschetto, S. Sauvage, A. Rousse, and M. Marsi, Europhys. Lett. 92, 37007 (2010).
- Pashkin et al. (2011) A. Pashkin, C. Kübler, H. Ehrke, R. Lopez, A. Halabica, R. F. Haglund Jr., R. Huber, and A. Leitenstorfer, Phys. Rev. B 83, 195120 (2011).
- Liu et al. (2011) M. K. Liu, B. Pardo, J. Zhang, M. M. Qazilbash, S. J. Yun, Z. Fei, J.-H. Shin, H.-T. Kim, D. N. Basov, and R. D. Averitt, Phys. Rev. Lett. 107, 066403 (2011).
- Wall et al. (2012) S. Wall, D. Wegkamp, L. Foglia, K. Appavoo, J. Nag, R. F. Haglund, J. Stähler, and M. Wolf, Nat. Commun. 3, 721 (2012).
- Cocker et al. (2012) T. L. Cocker, L. V. Titova, S. Fourmaux, G. Holloway, H.-C. Bandulet, D. Brassard, J.-C. Kieffer, M. A. El Khakani, and F. A. Hegmann, Phys. Rev. B 85, 155120 (2012).
- Biermann et al. (2005) S. Biermann, A. Poteryaev, A. Lichtenstein, and A. Georges, Phys. Rev. Lett. 94, 026404 (2005).
- Lazarovits et al. (2010) B. Lazarovits, K. Kim, K. Haule, and G. Kotliar, Phys. Rev. B 81, 115117 (2010).
- Dagotto (2005) E. Dagotto, Science 309, 257 (2005).
- Basov et al. (2011) D. N. Basov, R. D. Averitt, D. van der Marel, M. Dressel, and K. Haule, Rev. Mod. Phys. 83, 471 (2011).
- Qazilbash et al. (2011) M. M. Qazilbash, A. Tripathi, A. A. Schafgans, B.-J. Kim, H.-T. Kim, Z. Cai, M. V. Holt, J. M. Maser, F. Keilmann, O. G. Shpyrko, and D. N. Basov, Phys. Rev. B 83, 165108 (2011).
- Liu et al. (2013) M. K. Liu, M. Wagner, E. Abreu, S. Kittiwatanakul, A. McLeod, Z. Fei, M. Goldflam, S. Dai, M. M. Fogler, J. Lu, S. A. Wolf, R. D. Averitt, and D. N. Basov, Phys. Rev. Lett. 111, 096602 (2013).
- Hilton et al. (2007) D. J. Hilton, R. P. Prasankumar, S. Fourmaux, A. Cavalleri, D. Brassard, M. El Khakani, J. Kieffer, A. J. Taylor, and R. D. Averitt, Phys. Rev. Lett. 99, 226401 (2007).
- Liu et al. (2012) M. K. Liu, H. Y. Hwang, H. Tao, A. C. Strikwerda, K. Fan, G. R. Keiser, A. J. Sternbach, K. G. West, S. Kittiwatanakul, J. Lu, S. A. Wolf, F. G. Omenetto, X. Zhang, K. A. Nelson, and R. D. Averitt, Nature 487, 345 (2012).
- McWhan et al. (1969) D. B. McWhan, T. M. Rice, and J. P. Remeika, Phys. Rev. Lett. 23, 1384 (1969).
- McWhan et al. (1971) D. B. McWhan, J. P. Remeika, T. M. Rice, W. F. Brinkman, J. P. Maita, and A. Menth, Phys. Rev. Lett. 27, 941 (1971).
- McWhan et al. (1973) D. B. McWhan, A. Menth, J. P. Remeika, W. F. Brinkman, and T. M. Rice, Phys. Rev. B 7, 1920 (1973).
- Qazilbash et al. (2008) M. M. Qazilbash, A. A. Schafgans, K. S. Burch, S. J. Yun, B. G. Chae, B. J. Kim, H. T. Kim, and D. N. Basov, Phys. Rev. B 77, 115121 (2008).
- Stewart et al. (2012) M. K. Stewart, D. Brownstead, S. Wang, K. G. West, J. G. Ramirez, M. M. Qazilbash, N. B. Perkins, I. K. Schuller, and D. N. Basov, Phys. Rev. B 85, 205113 (2012).
- Hansmann et al. (2013) P. Hansmann, A. Toschi, G. Sangiovanni, T. Saha-Dasgupta, S. Lupi, M. Marsi, and K. Held, Phys. Status Solidi B 250, 1251 (2013).
- McWhan and Remeika (1970) D. B. McWhan and J. P. Remeika, Phys. Rev. B 2, 3734 (1970).
- Ramírez et al. (2009) J.-G. Ramírez, A. Sharoni, Y. Dubi, M. Gómez, and I. K. Schuller, Phys. Rev. B 79, 235110 (2009).
- Kaganov et al. (1957) M. I. Kaganov, I. M. Lifshitz, and L. V. Tanatarov, Sov. Phys. - JETP 4, 173 (1957).
- Anisimov et al. (1974) S. I. Anisimov, B. L. Kapeliovich, and T. L. Perel’man, Sov. Phys. - JETP 39, 375 (1974).
- Allen (1987) P. B. Allen, Phys. Rev. Lett. 59, 1460 (1987).
- (42) See Supplemental Material at ????
- Bechtel (1975) J. H. Bechtel, J. Appl. Phys. 46, 1585 (1975).
- Demsar et al. (1997) J. Demsar, M. Zavrtanik, B. Podobnik, V. I. Dediu, and D. Mihailovic, J. Supercond. 10, 455 (1997).
- Wen et al. (2013) H. Wen, L. Guo, E. Barnes, J. H. Lee, D. a. Walko, R. D. Schaller, J. A. Moyer, R. Misra, Y. Li, E. M. Dufresne, D. G. Schlom, V. Gopalan, and J. W. Freeland, Phys. Rev. B 88, 165424 (2013).
- Caviglia et al. (2012) A. D. Caviglia, R. Scherwitzl, P. Popovich, W. Hu, H. Bromberger, R. Singla, M. Mitrano, M. C. Hoffmann, S. Kaiser, P. Zubko, S. Gariglio, J.-M. Triscone, M. Först, and A. Cavalleri, Phys. Rev. Lett. 108, 136801 (2012).
- Khomskii (2010) D. I. Khomskii, Basic Aspects of the Quantum Theory of Solids: Order and Elementary Excitations (Cambridge University Press, Cambridge; New York, 2010).
- Binder (1987) K. Binder, Reports Prog. Phys. 50, 783 (1987).
- Chaikin and Lubensky (2000) P. Chaikin and T. Lubensky, Principles of Condensed Matter Physics (Cambridge University Press, Cambridge; New York, 2000).
- Lupi et al. (2010) S. Lupi, L. Baldassarre, B. Mansart, A. Perucchi, A. Barinov, P. Dudin, E. Papalazarou, F. Rodolakis, J.-P. Rueff, J.-P. Itié, S. Ravy, D. Nicoletti, P. Postorino, P. Hansmann, N. Parragh, A. Toschi, T. Saha-Dasgupta, O. K. Andersen, G. Sangiovanni, K. Held, and M. Marsi, Nat. Commun. 1, 105 (2010).
- Mansart et al. (2012) B. Mansart, A. Barinov, P. Dudin, L. Baldassarre, A. Perucchi, E. Papalazarou, P. Metcalf, S. Lupi, and M. Marsi, Appl. Phys. Lett. 100, 014108 (2012).
- McLeod et al. (2014) A. S. McLeod, E. Van Heumen, B. C. Chapler, M. D. Goldflam, M. K. Liu, L. Anderegg, S. Wang, J. G. Ramirez, S. Guenon, I. K. Schuller, and D. N. Basov, Bulletin of the American Physical Society , J49.11 (2014).
- Choi et al. (1996) H. S. Choi, J. S. Ahn, J. H. Jung, T. W. Noh, and D. H. Kim, Phys. Rev. B 54, 4621 (1996).
- Papon et al. (2002) P. Papon, J. Leblond, and P. H. E. Meijer, The Physics of Phase Transitions: Concepts and Applications, Advanced Texts in Physics (Springer, Berlin; New York, 2002) pp. 37–55.
- Shadrin and Il’inskii (2000) E. B. Shadrin and A. V. Il’inskii, Phys. Solid State 42, 1126 (2000).
- Lopez et al. (2002) R. Lopez, T. Haynes, L. Boatner, L. Feldman, and R. Haglund, Phys. Rev. B 65, 224113 (2002).
- Seikh et al. (2006) M. M. Seikh, C. Narayana, A. Sood, P. Murugavel, M. Kim, P. Metcalf, J. Honig, and C. Rao, Solid State Commun. 138, 466 (2006).
- Rethfeld et al. (2002) B. Rethfeld, K. Sokolowski-Tinten, D. von der Linde, and S. Anisimov, Phys. Rev. B 65, 092103 (2002).
- Ramirez et al. (2014) J. G. Ramirez, T. Saerbeck, S. Wang, J. Trastoy, M. Malnou, J. Lesueur, J. P. Crocombette, J. E. Villegas, and I. K. Schuller, (2014), submitted.