![[Uncaptioned image]](/html/1410.6766/assets/x1.png)
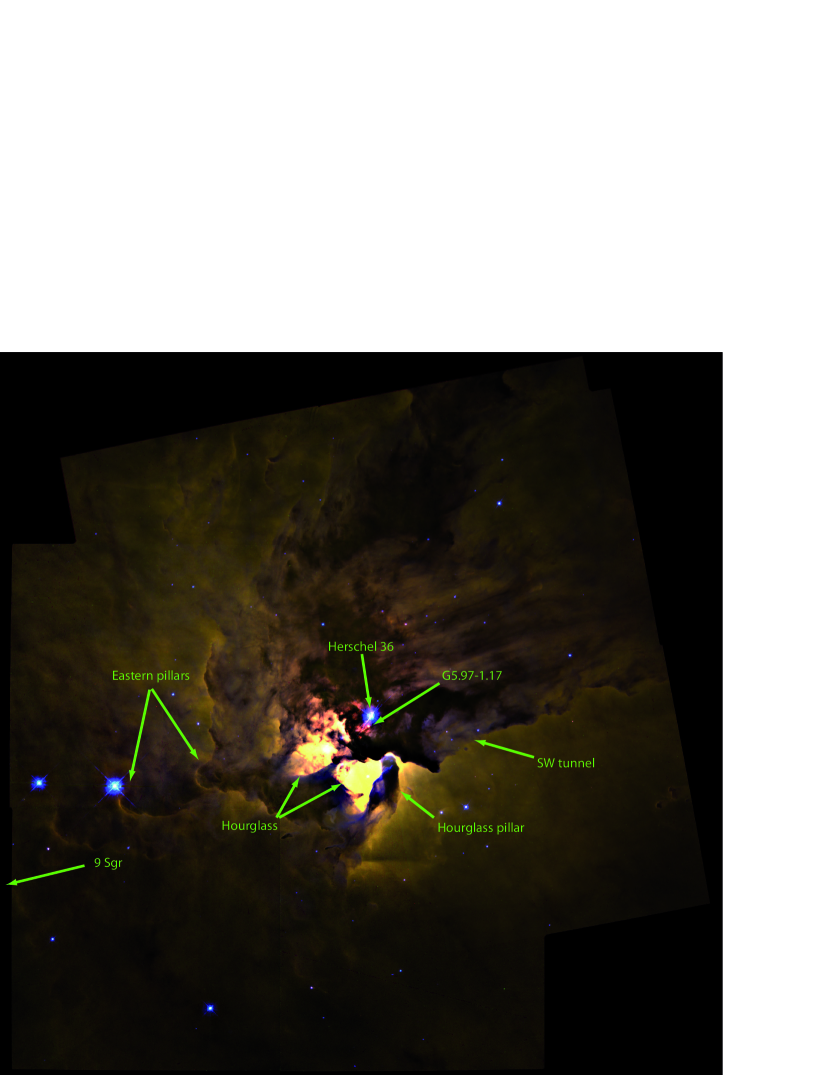
The Hourglass as seen with HST/WFPC2
J. Maíz Apellániz1,
L. Úbeda2,
R. H. Barbá3,
J. W. MacKenty2,
J. I. Arias3,
and
A. I. Gómez de Castro4
1
Centro de Astrobiología, INTA-CSIC, Spain
2 Space Telescope Science Institute, USA
3 Universidad de La Serena, Chile
4 Universidad Complutense de Madrid, Spain
Abstract
We present a multi-filter HST/WFPC2 UV-optical study of the Hourglass region in M8. We have extracted the stellar photometry of the sources in the area and obtained the separations and position angles of the Herschel 36 multiple system: for Herschel 36 D we detect a possible orbital motion between 1995 and 2009. We have combined our data with archival IUE spectroscopy and measured the Herschel 36 extinction law, obtaining a different result from that of Cardelli et al. (1989) due to the improvement in the quality of the optical-NIR data, in agreement with the results of Maíz Apellániz et al. (2014). A large fraction of the UV flux around Herschel 36 arises from the Hourglass and not directly from the star itself. In the UV the Hourglass appears to act as a reflection nebula located behind Herschel 36 along the line of sight. Finally, we also detect three new Herbig-Haro objects and the possible anisotropic expansion of the Hourglass Nebula.
1 Motivation
Herschel 36 (O7: V + sec, Sota et al. 2014) is a unique object. It is the main ionizing source of the Hourglass Nebula (for most of M8 it is 9 Sgr), a ZAMS SB3 system (O7.5 V + O9 V + B0.5 V, Arias et al. 2010), and the prototype of large- extinction laws (Cardelli et al. 1989). Herschel 36 C (025 away) is another B star companion, deeply embedded in dust (Goto et al 2006 and contribution by J. Maíz Apellániz in these proceedings). In the surrounding nebula, the Hourglass region has a very high surface brightness, the gas and dust distributions are complex (Arias et al. 2006), and several other interesting objects (Goto et al. 2006, Arias et al. 2006) can be found. All of this prompted us to request HST time during Supplemental Cycle 16, which was the last chance for FUV observations with WFPC2.
2 The data
We used three kinds of data:
-
•
Archival WFPC2 data (GO 6227, 1995, PI: Trauger). These have the Hourglass in the PC, with WF2 to the W and include + filters (F547M + F814W) and nebular filters (F487N + F502N + F656N + F658N + F953N).
-
•
New WFPC2 data (GO 11 981, 2009, PI: Maíz Apellániz). These have the Hourglass in the PC, with WF2 to the E and include new FUV to -band filters (F170W + F255W + F336W + F439W), an -band filter (F675W), and previously used filters for larger coverage and second epochs (F487N + F547M + F656N + F814W).
-
•
Archival 2MASS photometry and IUE spectroscopy for Herschel 36.
3 Processing
See Arias et al. (2006) for the initial processing of GO 6227 data. We performed aperture photometry for point-like or quasi-point-like sources using the original (geometrically-distorted) data and selecting the best exposure time as a function of magnitude. For saturated sources we applied techniques similar to that of Gilliland (1994) for GAIN=15 and Maíz Apellániz (2003) for GAIN=7. We used a realistic (spatially-varying) background subtraction and applied CTI, contamination, and aperture corrections. Aperture and zero-point uncertainties were added to the final result. A ghost produced by Herschel 36 was discarded in the long exposures. Finaly, the nebulosity was analyzed with large-area photometry.
4 The overall structure of M8
As seen in Figure 1, the Hourglass has a much higher surface brightness than the rest of M8. The eastern pillars point towards 9 Sgr (O4 V((f))z, Sota et al. 2014), the main ionizing source of M8. The southern limit of the Hourglass is a pillar pointing towards Herschel 36. The region around Herschel 36 shows higher extinctions than the Hourglass (Figure 1 and Arias et al. 2006): reddened holes are seen among (even more extinguished) dark regions. Some regions (tunnel towards the SW, part of the Hourglass pillar) are relatively brighter in F547M with respect to F656N or F487N: they are illuminated by mostly non-ionizing radiation.
Quantity CCM laws New laws 5.3 2.0 0.8830.008 0.7840.008 5.0980.073 5.9420.096 3.0490.007 3.0230.007 0.9540.008 0.8350.008 4.5120.037 4.6700.038 5.7430.033 5.6130.035
∗ Do not trust: it assumes a single, typical MS star.
5 Herschel 36 and its reflection nebula
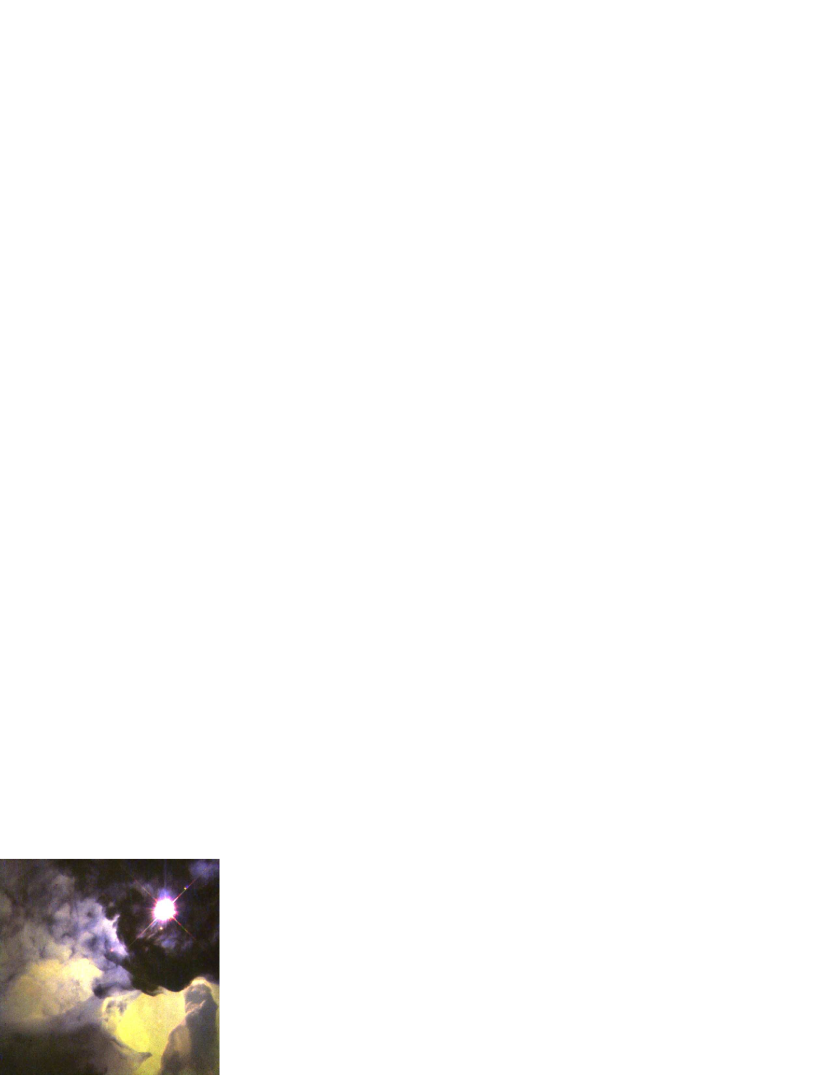
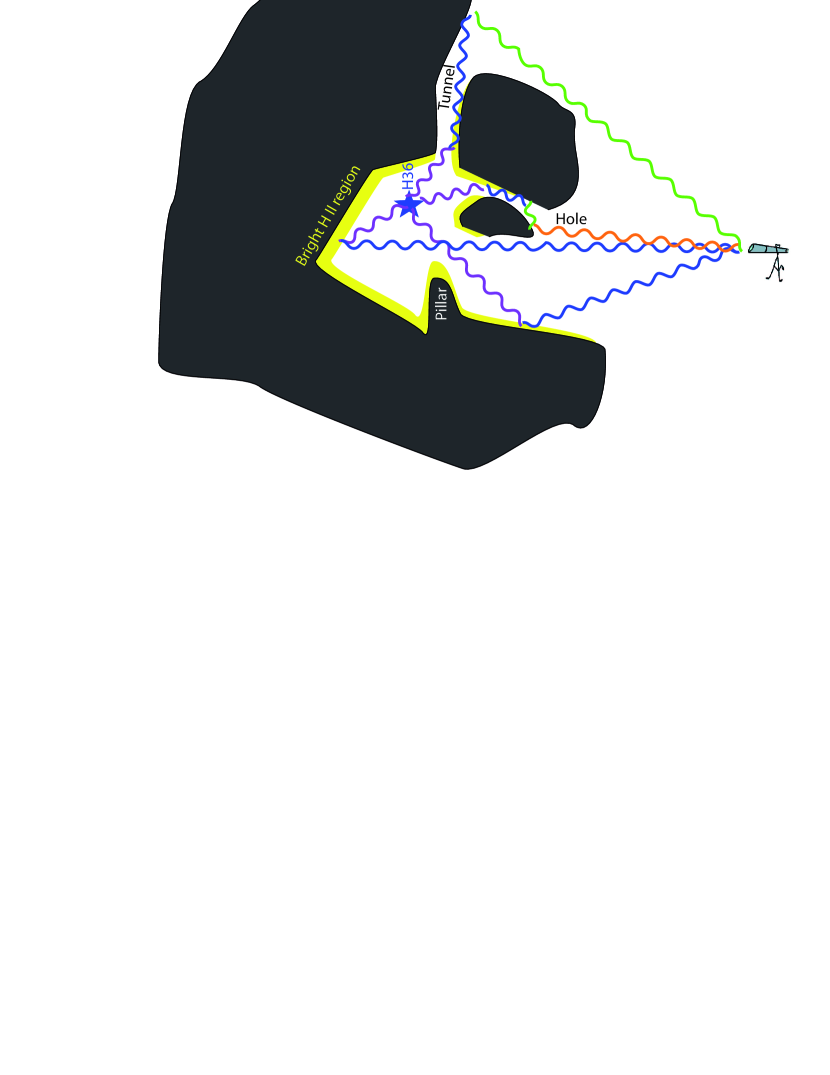
Herschel 36 is the only bright point source in the FUV (Figure 2), but surprisingly it contains only 296% of the F170W flux in the PC. Furthermore, there is only partial correlation between nebular emission and diffuse F170W (indicating that the cause is not the red leak). The latter comes preferentially from the more extinguished regions: holes around Herschel 36 and NW part of the Hourglass. The preferred explanation is that the FUV diffuse radiation is mostly (forward) scattered light (with smaller contributions from other sources such as free-free, free-bound, and 2-photon Lyman continuum). Our proposed geometry is shown in Figure 3:
-
•
Herschel 36 is creating a cavity inside the molecular cloud.
-
•
The direct light from the star arrives at us through a partially open hole.
-
•
The bright regions of the Hourglass are farther away than Herschel 36 and they are the visible surface of the molecular cloud directly illuminated by the star.
-
•
The cloud is porous e.g. SW tunnel.
6 Herschel 36: optical+NIR analysis
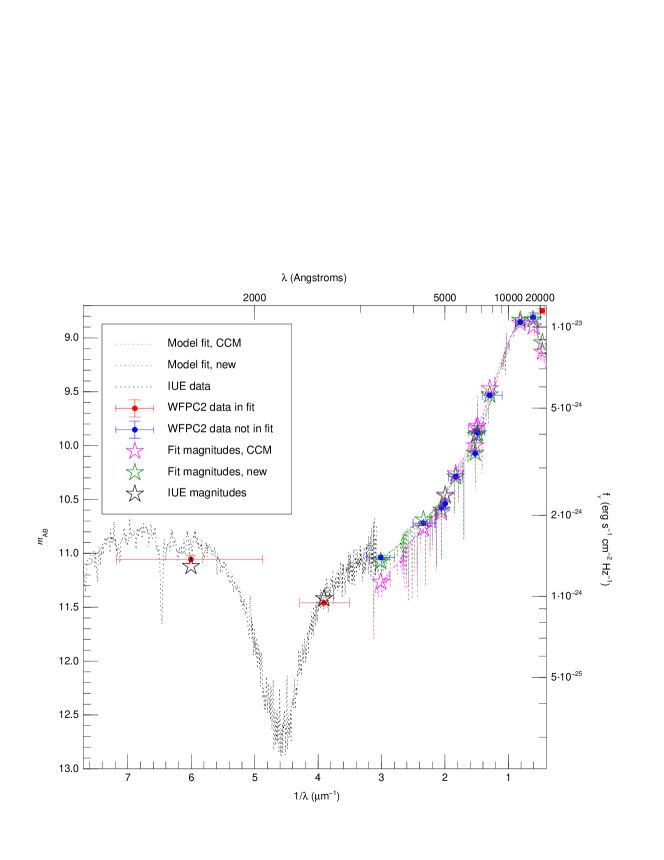
We used CHORIZOS (Maíz Apellániz 2004, 2013b) to measure the Herschel 36 extinction. We fixed the luminosity class (5.0) and (38 400 K). We left the amount () and type () of extinction and logarithmic distance () as variables. We used two alternative extinction law families: CCM (Cardelli et al. 1989) and new (Maíz Apellániz 2013a, Maíz Apellániz et al. 2014). For the fit we used the WFPC2 F336W + F439W + F487N + F502N + F547M + F656N + F673N + F675W + F814W and the 2MASS + filters. The -band photometry was excluded due to the IR excess caused by Herschel 36 C (see talk by J. Maíz Apellániz). The results are shown in Table 1 and Figure 4): the new extinction laws provide a better fit to the optical+NIR data, especially for F336W. It should be pointed out that the original CCM paper used Herschel 36 as an anchor point for large- extinction laws but they overestimated the amount of extinction ( = 0.89) and underestimated (5.30).
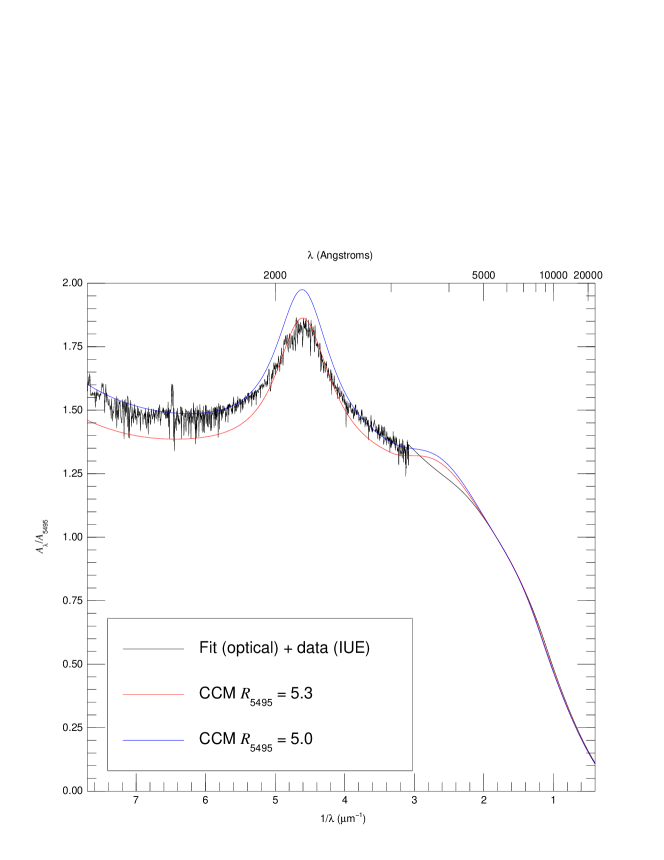
7 Herschel 36: onto the UV
We compared the IUE spectroscopy with the F170W + F255W magnitudes (Figure 4). There is agreement between the IUE and WFPC2 fluxes a sign that the IUE extraction corresponds to the point source (it does not include the reflection nebula). There is a discontinuity between the CCM fit to the optical+NIR data and the IUE spectroscopy at the UV-optical boundary. On the other hand, there is an agreement with the large- extinction laws measured in 30 Doradus (Maíz Apellániz et al. 2014). We calculated the UV extinction law by dividing the measured IUE flux by the intrinsic TLUSTY SED derived from CHORIZOS and the new extinction laws (Figure 5)¿ We found that:
-
•
The = 5.0 CCM law works better than the = 5.3 CCM law (the value used by CCM).
-
•
The 2175 Å bump is weaker than in the CCM laws.
-
•
The most likely explanation for the above is that CCM used the wrong value of .
Component Other name Separation PA F814W (′′) (∘) (mag) Ba KS 1-S 2.913 8. 7 6. 98 Bb KS 1-N 3.484 4. 3 14 C∗ Herschel 36 SE 0.250 110. 0 — D G5.97-1.17 2.903 123. 3 6. 40 E 0.740 201. 7 4. 82 F 4.196 125. 8 10. 0 G 2.774 272. 6 10. 3 H 2.415 112. 0 10. 4 I 3.456 168. 2 12. 3 J 1.660 313. 0 13
∗ Data from Goto et al. (2006).
8 Other sources in the Hourglass
There is only a handful of point sources seen in most optical filters in the PC. We have measured the seporations, position angles, and F814W for the Herschel 36 multiple system (Table 2), defined as the objects within 5′′ of A: We have not attempted to resolve the embedded star Herschel 36 C (the contrast in the optical is very large and we are using aperture photometry), so the information provided in that case is from Goto et al. (2006). We note that Herschel 36 Ba is much brighter than Bb in F814W (Arias et al. 2006).
Probably, the most interesting componente of Herschel 36 after A is D ( G5.97-1.17), an ultracompact H ii region proposed as a proplyd by Stecklum et al. (1998). For Herschel 36 D we measured a shift of 0.3 PC px (0015 or 19 AU) between 1995 and 2009 (Figure 6): this might correspond to the orbital motion around Herschel 36 with a minimum period of 17 000 a. We also determined the extinction from the H/H ratio (F487N and F656N have low continuum contamination) assuming the same as for Herschel 36 A and obtained = 9.90.3 mag.

9 Herbig-Haro objects and nebular expansion
The comparison between new and archival WFPC2 images also reveals internal movements in the Hourglass Nebula. Three new Herbig-Haro objects are identified in Figure 6: the HH nebular structures are displaced 02-03 during the interval between observations, indicating tangential velocities of 85-130 km/s. Also, a variety of nebular structures show displacements of up to 1 px (0045), suggesting an anisotropic expansion of the whole Hourglass Nebula (Figure 6).
References
- •
- •
- •
- •
- •
- •
- •
- •
- •
- •
- •
- •