Source plane reconstruction of the giant gravitational arc in Abell 2667: a candidate Wolf-Rayet galaxy at
Abstract
We present a new analysis of HST, Spitzer telescope imaging and VLT imaging and spectroscopic data of a bright lensed galaxy at =1.0334 in the lensing cluster Abell 2667. Using this high-resolution imaging we present an updated lens model that allows us to fully understand the lensing geometry and reconstruct the lensed galaxy in the source plane. This giant arc gives a unique opportunity to peer into the structure of a high-redshift disk galaxy. We find that the lensed galaxy of Abell 2667 is a typical spiral galaxy with morphology similar to the structure of its counterparts at higher redshift . The surface brightness of the reconstructed source galaxy in the z850 band reveals the central surface brightness mag arcsec-2 and the characteristic radius kpc at redshift . The morphological reconstruction in different bands shows obvious negative radial color gradients for this galaxy. Moreover, the redder central bulge tends to contain a metal-rich stellar population, rather than being heavily reddened by dust due to high and patchy obscuration. We analyze the VIMOS/IFU spectroscopic data and find that, in the given wavelength range ( Å), the combined arc spectrum of the source galaxy is characterized by a strong continuum emission with strong UV absorption lines (FeII and MgII) and shows the features of a typical starburst Wolf-Rayet galaxy NGC5253. More specifically, we have measured the EWs of FeII and MgII lines in the Abell 2667 spectrum, and obtained similar values for the same wavelength interval of the NGC5253 spectrum. Marginal evidence for CIII] 1909 emission at the edge of the grism range further confirms our expectation.
1 Introduction
Considerable advances have been made over the past 15 years to chart and investigate the properties and evolution of the disk galaxies, which may provide an insight into the galaxy formation process in a dark matter-dominated universe. Moreover, it is well known that the galaxy stellar disks can not only be thickened by interactions with low-mass halos (Benson et al., 2004), but also be entirely disrupted by the galaxies or halos with a few of the galaxy masses (Koda et al., 2008). Therefore, the environments where these galaxies are located also play a significant role in the basic observational features of the disk galaxy population.
HST imaging and spectroscopy of high-redshift disk galaxies provide critical diagnostics of their formation and evolution (e.g., Law et al. (2009); Cassata et al. (2010)). However, there are several observational challenges in pursuing the evolution history of disk galaxies beyond . On the one hand, observations of low surface brightness galaxies at are very challenging, thus limiting the size of the available data; on the other hand, at high redshift it becomes increasingly more difficult to resolve the spatial structure within galaxies, greatly restraining the possibility to understand the exact position where processes (like star formation) occur. Consequently, gravitationally lensing galaxy clusters provide a unique and detailed view of the high-redshift universe, allowing to probe the faint population of distant, background galaxies. This technique, often referred to as gravitational telescope , was first proposed by Zwicky (1937) and has developed into an important astrophysical tool since the advent of the Hubble Space Telescope, since lensed galaxies are magnified by typically 1-3 magnitudes and spatial sizes are correspondingly stretched (Kneib et al., 2005; Bradley et al., 2008; Zheng et al., 2009).
A magnificent gravitational lensing example is provided by the galaxy cluster Abell 370 at (Soucail et al., 1987; Lynds & Petrosian, 1989) showing a giant gravitational arc () (Richard et al., 2010) that has been extensively analyzed with the multiband HST/ACS images. The galaxy cluster has a large Einstein radius, , for a source redshift at and strong magnification in the central region make Abell 370 one of the best clusters to search for high redshift galaxies. The first metallicity gradient measurement for a face-on spiral galaxy at was also discussed by Yuan et al. (2011), through the analysis of the arc produced by the massive galaxy cluster MACS J1149.5+2223 at . More recently, Sharon et al. (2012) successfully reconstructed the source plane of a bright lensed galaxy at magnified by the lensing cluster RCS2 032727-132623, by using a new high-resolution imaging from Hubble Space Telescope/Wide Field Camera3 (HST/WFC3). A similar rare case was discovered in VIMOS Integral Field Unit (IFU) spectroscopic observations of the X-ray luminous cluster Abell 2667 ().
The galaxy cluster Abell 2667 is another remarkable example of gravitational telescope . It is among the most luminous galaxy clusters in the X-ray sky (Ebeling et al., 1996), with a regular X-ray morphology (Newman et al., 2013; Weissmann et al., 2013) and a cool core (Covone et al., 2006a). Redshift survey in the central acrmin2 reveals a unimodal velocity distribution of the member galaxies (Covone et al., 2006b). Abell 2667 shows a remarkable giant gravitational arc (Sand et al., 2005) originated from a blue star-forming galaxy at (Covone et al., 2006b), and a system of lensed sources at high redshift (Laporte et al., 2011, 2012). Covone et al. (2006b) performed a wide field integral field spectroscopy survey of the central arc min square, using the VIMOS Integral Field Unit (IFU) and built a strong lensing model using HST/WFPC2 data. Yuan et al. (2012) have used this lensing model to derive the source-plane morphology from the archive WFPC2 data. They analyzed Keck II/ OSIRIS spatially resolved NIR spectra and found that the higher [NII]/H ratio in the outer region might be contaminated by a significant fraction of shock excitation due to galactic outflows.
In this paper, we extend the previous analysis on the magnified source of the giant arc in Abell 2667, based on HST/ACS imaging data and a set of complementary imaging and spectroscopic data. We improve the previous lensing model, produce a new inversion of the source galaxy and study in detail the color gradient in this system. The paper is organized as follows. In Section 2, we present the used observational data used in this work. The lensing analysis including a new lens model is presented in Section 3. Section 4 shows the physical conditions and main properties of the reconstructed source galaxy. Discussion and conclusions appear in Section 5. We assume a flat cosmology with , , and km s-1 Mpc-1. All magnitudes refer to those in the AB system.
2 Observations
In this section we will present the imaging and spectroscopic data used in the analysis of Abell 2667. We use the imaging data from the Hubble Space Telescope, taken with the Advanced Camera for Surveys (ACS; Program 10504, PI R. Ellis; filter F850LP), Wide-Field Planetary Camera 2 (WFPC2; Program 8882, PI Allen; filters F450W, F606W, F814W), and Near Infrared Camera and Multi-Object Spectrometer (NICMOS; Program 10504, PI R. Ellis) and ground-based data from ISAAC at VLT (Program 71.A-0428, PI J.-P. Kneib) through the F110W, F160W filters. HST high-resolution images are essential to build an accurate model of the gravitational lens, while the large multi-wavelength coverage allows us to constrain the properties, for example, the color gradient of the lensed source in different bands.
The HST/WFPC2 observations were obtained on October 10-11, 2001, for a total of 12000/5000/5000s in the F450W/F606W/F814W bands, respectively. Final data have the depth of mag. Compared to the WFPC2 observations, the HST/ACS data in the F850LP band cover a square field of about 18 acrmin2 are deeper and have higher resolution. Final data were obtained on July 21, 2006 for a total of 8765s, which have the pixel scale of , with the depth of . The near infrared imaging data are observed from NICMOS in broad, medium, and narrow band filters, broad-band imaging polarimetry, coronographic imaging, and slitless grism spectroscopy. The NICMOS observations were obtained on August 6, 2006, for a total of 4608/7104s in the F110W/F160W bands with the depth of mag. Moreover, the mid-infrared data for Abell 2667, which were obtained with Spitzer/IRAC (Program 83, PI G. Rieke; and Program 60034, PI E. Egami), will also be used for multi-band photometric measurements presented in Section 4. The final Spitzer/IRAC data were acquired using four broad-band filters in the IR channel, and centered at 3.6, 4.5, 5.8 and 8.0 microns.
The central region of the galaxy cluster was observed with the VIMOS Integral Field Unit (Covone et al., 2006b; Grin et al., 2007) mounted on VLT Melipal, with a f.o.v. of , fiber size , and the low-resolution red grism (), covering from about 3900 to 5300 Å. Covone et al. (2006b) extracted 22 galaxy spectra and the spatially resolved spectra of three lensed images of the gravitational arc.
3 Strong Lensing Mass Model
We used the publicly-available software LENSTOOL 111http://projets.lam.fr/projects/lenstool/wiki (Jullo et al., 2007) to compute the best-fit lens model. LENSTOOL makes use of a Monte Carlo Markov Chain (MCMC) optimization method.
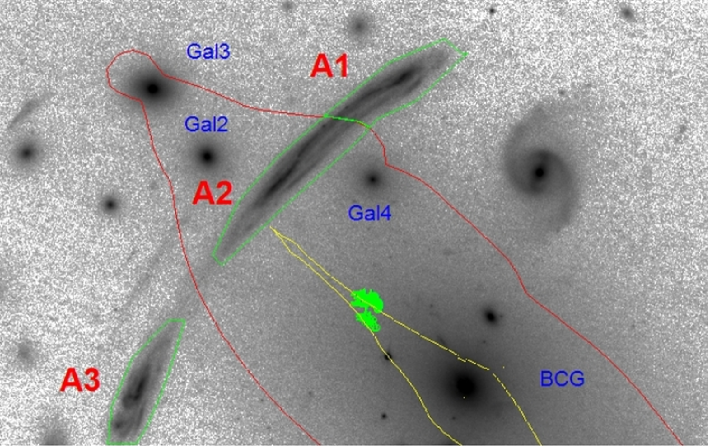
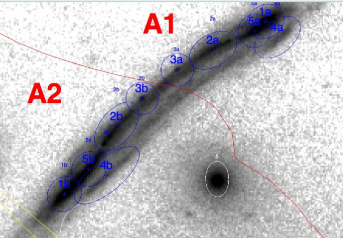
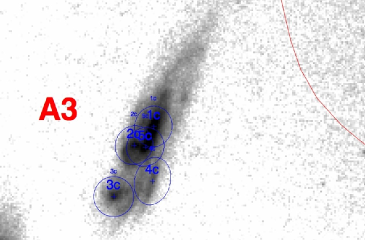
The source galaxy is multiply-imaged into three images (A1, A2, A3; see Fig. 1)222Hereafter, we use the same notation for the lensed images as in Covone et al. (2006b).: two of them (A1, A2) are merged, forming the giant gravitational arc located North-East of the brightest cluster galaxy (BCG), while A3 constitutes an isolated system. The clear mirror symmetry along the giant arc provides additional constraints on the location of the critical line at the arc redshift. HST/ACS data allow to identify unambiguously multiply-imaged subregions within the three images (Fig. 1b,c).
We use the HST/ACS to build a new lensing model of the matter distribution in the cluster core. The positions of the images are the main input observational data to constrain the lens model parameters. We determine the position of the brightest peak for each multiply lensed feature in the arc, assuming a position error of (the spatial resolution of the HST/ACS data per pixel), see also Faure et al. (2011); Cao et al. (2013); Collett & Auger (2014).
To model the mass distribution, we include both a cluster mass-scale component (representing the contribution of the dark matter and baryonic gas halo) and cluster galaxy mass components (Kneib et al., 1996; Smith et al., 2005). Bright cluster galaxies within the central belonging to the galaxy cluster are selected according to their redshift, while massive galaxies along the line of sight are also included, with their lensing properties rescaled at the cluster redshift. All the model components (including the large scale cluster halo, the BCG, and individual galaxies) are parameterized using a pseudo-isothermal mass distribution model (PIEMD, Kassiola & Kovner (1993)), which is determined by its position , ; ellipticity , where and are the semi major and semi minor axes; a position angle ; the velocity dispersion ; a core radius ; and a truncation radius .
The best-fit lensing mass model is found by fitting the position, ellipticity, orientation and mass parameters (velocity dispersion, core and truncation radii) of the cluster-scale component. The center of the BCG (x and y) is fixed at the observed values in the ACS image, while the other parameters (the ellipticity, orientation, and mass parameters) are set free. Other galaxies are individually chosen to have the same position, ellipticity and orientation as of their corresponding -band image. The effect of the mass distributions of the most massive member galaxies Gal2-Gal4 are taken into consideration with only one free parameter, the central velocity dispersion, . By assuming a Faber & Jackson (1976) relation and a global mass-to-light ratio (M/L), the mass of the other galaxies are scaled according to their K-band luminosity estimated by using a typical E/S0 spectral energy distribution (Covone et al., 2006b). Therefore, the truncation radius and the velocity dispersion are the two independent parameters of the ensemble of cluster galaxies. The best-fit values of the model parameters and their uncertainties are summarized in Table 1. The mean source-plane rms is . Concerning the ratio of the sizes between the image-plane and the source-plane reconstruction, we obtain the total flux magnification for the giant arc , consistent with the result of Yuan et al. (2012).
| Halo | RA | Dec | |||||
|---|---|---|---|---|---|---|---|
| (PIEMD) | () | () | (deg) | () | () | (km ) | |
| Cluster | |||||||
| BCG | 0 | 0 | |||||
| Gal2 | -12.71 | 11.34 | 0.25 | -41.40 | |||
| Gal3 | -15.42 | 14.66 | 0.17 | -9.40 | |||
| Gal4 | -4.53 | 10.21 | 0.41 | -88.40 | |||
| L* galaxy |
4 Properties of the source galaxy
4.1 Source reconstruction
The gravitational lensing model enables us to derive the source plane properties independently through each of the three images A1, A2, A3. The source plane reconstruction is performed by using the task cleanlens in LENSTOOL, computing the corresponding position in the source plane for each point of the image plane through the best-fit lens model. There are two related subsampling parameters in our analysis, echant and s-echant. With =2, each pixel in the CCD frame will be cut into 4 smaller pixels during the calculation of the the source frame. The s-echant parameter plays the same role when subsampling the frame in the source plane. In our analysis, echant and s-echant are both fixed at 2.
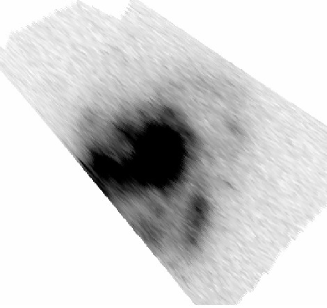
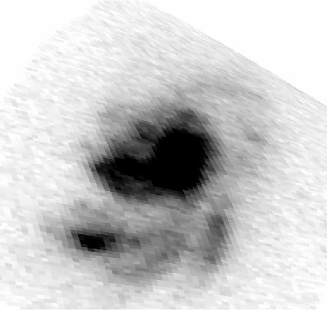
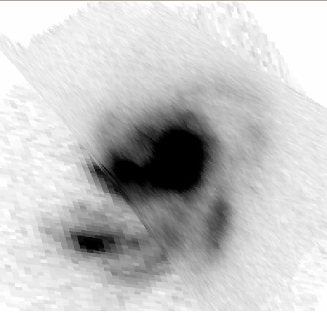
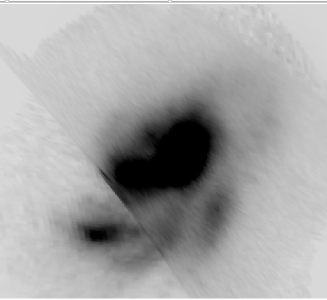
We extract the giant arc within three polygonal apertures constructed to enclose the whole lensed system (See Fig. 1). Fig. 2 shows the three independent reconstructions of the source from the three different lensed images, separately, as well as the result obtain by considering the three images simultaneously. The overall agreement between the three source reconstructions from individual images validates the best-fit model.
In order to take account the uncertainties of the best-fit lens model parameters, we produce 600 source plane images through a MCMC simulation, which are then combined to obtain information on the uncertainties on the reconstructed source. The simulation results are shown in Fig. 3. The scatter in the pixel values tells us about the impact of the lens model on our reconstruction. We find the largest systematic errors on the source reconstruction come from the two clumps on the southeast (about 20%) and the faint spiral arms (about 15%). As for the central bulge of the galaxy, the effect of reconstruction errors is relatively small (about 10%).
On the basis of the reconstructed source from WFPC2 data of the image A3, Yuan et al. (2012) could not resolve between a merging system and a disturbed disk galaxy. In our reconstruction from the three images, the source galaxy appears to be an asymmetric disk galaxy with a bright central bulge, and tightly wrapped spiral arms. This picture is also confirmed by the regular and smooth exponential profile shown in the disk (see Section 4.2) and by the small velocity gradient across the disk found by Yuan et al. (2012) based on the observations of the H emission line. Hence, the source is approximately a face-on rotating disk or a non-rotating system.
4.2 Multi-band photometry
A detailed photometric analysis in different wavebands is required to derive the color profile of the disk galaxy. Therefore, we used the fiducial best-fit lensing model based on the HST/ACS image (see Table 1) to reconstruct the intrinsic source morphology in other bands and measure the luminosity profiles.
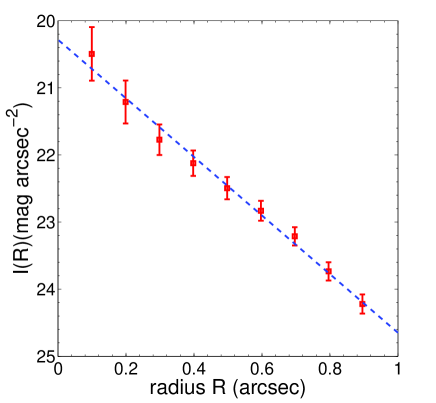
Fig. 4 shows the surface brightness I(R)(in the unit of mag arcsec-2) of the reconstructed source galaxy from the -band image. Surface brightness is measured in elliptical regions, in order to take into account projection effects: by assuming intrinsic circular isophotes, we find an inclination angle (along the line of sight) degrees. In the stellar disk, when averaged over features like spiral arms, the surface brightness follows approximately an exponential profile. When expressed in units of mag arcsec-2, this reads
| (1) |
At the center of the source galaxy, the -band surface brightness is mag arcsec-2. Fig. 4 shows the fit to the source -band surface brightness: the scale length is , corresponding to a linear radius kpc at the source redshift. The apparent magnitude within is . After correcting for the flux magnification, the intrinsic luminosity at the galaxy redshift is .
Yuan et al. (2012) have measured the stellar mass of the source galaxy by fitting the spectral energy distribution (SED). By assuming an extinction value E(B-V)=0.60 and a star-formation rate SFR, they estimated the stellar mass to be log.
We can compare the source of the giant arc in A2667 with the large sample of disk galaxies ta high-z observed by Miller et al. (2011). Based on spectra from DEIMOS on the Keck II telescope, Miller et al. (2011) measured the evolving scaling relation of three types of disk-like galaxies in the redshift range . Disk-like galaxies with extended line emission across the 2D spectrum (like the A2667 giant arc source) have larger mean scale radii ( kpc) with respect to the compact ( kpc) and passive ( kpc) galaxy samples. Our system has stellar max also very close to the average stellar mass of disk-like galaxies in Miller et al. (2011), log. Therefore the giant arc source appears to be a typical disk-galaxy at . Note that the passive disk galaxies constitute the upper end of the total stellar mass with log, while the typical values are log for the compact.
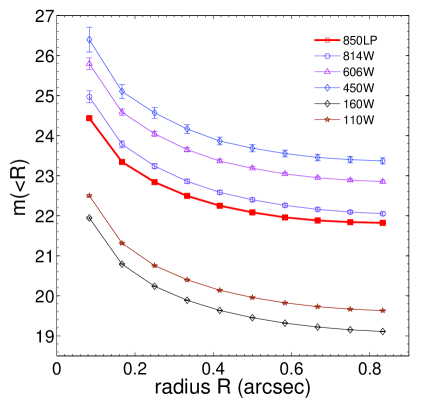
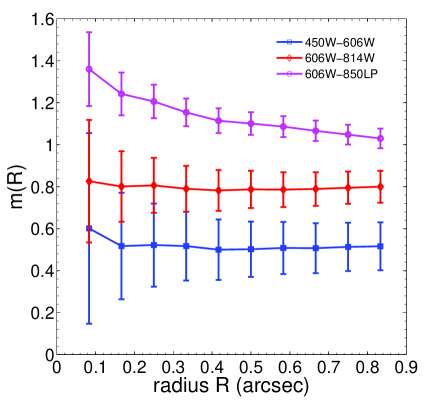
It is well known that radial color gradient of a spiral galaxy provides a unique test on the star-formation rate along the disk and thus the disk formation and evolution. Multiband photometry of the reconstructed source in six different bands is presented in Fig. 5. The lensed galaxy exhibits a negative gradient (i.e., the color is gradually bluer outwards), as observed for most of the spiral galaxies (Moth & Elston, 2002; MacArthur et al., 2004; Taylor et al., 2005). Moreover, the color profile becomes shallower with increasing radius and the color of this source galaxy is redder in the central bulge, which could be explained by either a standard bulge/disk structure with the center of this galaxy dominated by an old stellar population (Yuan et al., 2012), or by a merging/ disturbed system that happens to have more attenuation by dust toward the center of the galaxy.
The above two possible causes can helpfully explain both the color gradient and the reddened central bulge of the target galaxy. Regarding the stellar population, it is broadly accepted that for galactic disks, the star formation rate (SFR) is proportional to the surface mass density (Bell & de Jong, 2000; Kauffmann et al., 2003), but inversely proportional to the radius (Kennicutt et al., 1998; Boissier & Prantzos, 1999). Therefore, the inner regions of spiral galaxies may possibly evolve faster than outer regions, which directly leads to older metal-rich stellar populations in the center (Prantzos & Boissier, 2000). As for the dust, many previous works also showed that its distribution along the disk of spiral galaxies might be proportional to the stellar mass density profile (Regan et al., 2006), which gives birth to a inner galactic region containing more dust and also naturally generates a negative color gradient.
We have measured the color gradient within half-light radius and obtained the corresponding values and . To make a quantitative comparison, we compare with the previous measurements of the color difference in galaxies observed in the GOODS-South Field (Welikala & Kneib, 2012), which investigated the galactic radial variation of colors evolving with redshift. For the stacked bright sample like our case, the color difference are for galaxies within the redshift range and for high redshift galaxies at . Concerning the color gradient within , the corresponding values change to for galaxies for low-redshift galaxies () and for high-redshift galaxies () (Welikala & Kneib, 2012). In our analysis, the calculated color gradients of the lensed galaxy of Abell 2667, a spiral galaxy at , are in good quantitative agreement with the previous results above.
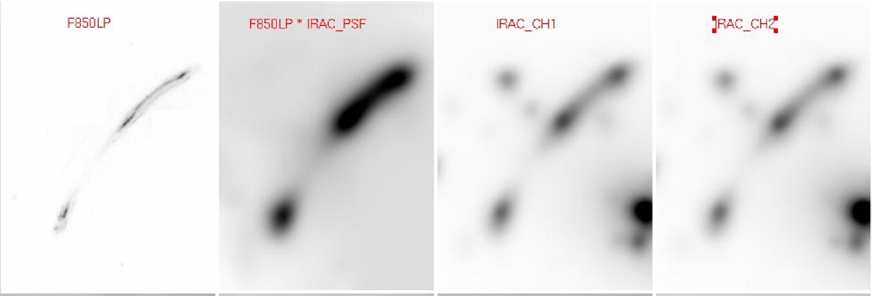
In order to determine the nature of the reddened galactic center, firstly, we make measurements of the apparent magnitude of the galaxy center within (which corresponds to 1.34 kpc). As can be seen in Fig. 5, the center of this galaxy is much redder (B450-V606=0.50). Secondly, the colors -mag3.6 and -mag4.5 are also measured in the image plane. In order to perform photometric measurement on the Spitzer IRAC data, we convolve the HST image with the IRAC PSF and subtract it, after rescaling, from the IRAC images (see Fig. 6). As expected, the colors of the arc are quite different between the center of the spiral and the spiral arms. We find that in the bulge -mag3.6=0.23 and -mag4.5=0.03. In the spiral arms, the color is much bluer: -mag3.6=-0.36 and -mag4.5=-0.72. The uncertainty on these colors is mag, as evaluated from the amount of residuals in the respective regions.
Theory of dust attenuation has been reviewed many times in different papers (MacArthur et al., 2004; Taylor et al., 2005). However, we lack theories with dust attenuation only to explain the fact that the center of this galaxy is too much brighter in the R band than the B band. From the observational point of view, galaxies with high surface mass density always have more dust and generate steeper color gradients (Regan et al., 2006; Liu et al., 2009), i.e. the more luminous galaxies have steeper scaled color gradients, which is inconsistent with our observations. Consequently, dust attenuation only plays a minor role in regulating the color gradients of spiral galaxies, or at least could not be the only role in the origin of reddened galactic center (MacArthur et al., 2004; Taylor et al., 2005).
Thus, we can reach a careful conclusion that the central bulge of the lensed galaxy of Abell 2667 tends to be heavily dominated by an old stellar population, meanwhile, the other two blue clumps on the south are very likely to be active starforming regions and responsible for the starbursts of this blue star-forming galaxy (Yuan et al., 2012). Further constraints and discussion on the spectroscopic type of this star-forming galaxy are given in Section 4.3.
4.3 VIMOUS/IFU spectroscopy
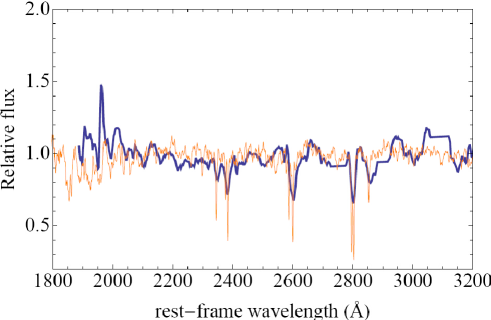
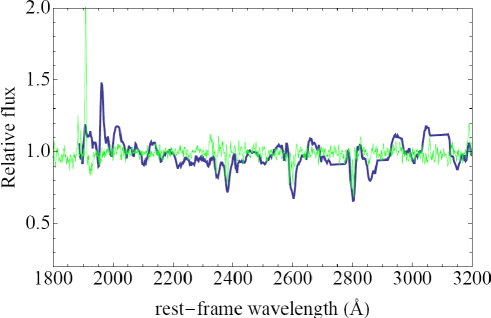
We discuss here the VIMOUS/IFU spectroscopic data collected by Covone et al. (2006b), in the given wavelength range ( Å). Fig. 7 shows the combined spectrum in blue line from the three images of the the giant gravitational arc (i.e., summing the signal from all the three images of the arc). The source shows the characteristic spectrum of a blue star-forming galaxy, with a strong UV continuum emission and evident spectral features due to low-ionization absorption lines (In particular, the strongest in our spectra are the CIII] 1909 line, the FeII 2370/2600 lines, and the MgII/2800 line).
We have compared the spectrum of the arc on Abell 2667 with some galaxy templates, focusing particularly on starburst galaxies. Following the work of Leitherer et al. (2011), we have first compared the spectrum of the arc on Abell 2667 with two templates of high (orange spectrum) and low-metallicity (green spectrum) starbursting galaxies in Fig. 7. The high-z spectrum is characterized by an almost absence of the CIII] 1909 line and more pronounced interstellar lines of FeII, MnII and MgII, while in the low-z spectrum the CIII] nebular line is very pronounced, but a lower intensity for interstellar lines. In the spectrum of Abell 2667 these absorption lines are all present, including the MgI 2853 line. The resolution of the spectrum does not allow to split the single FeII-MnII line and the MgII doublet at 2796-2803 Å.
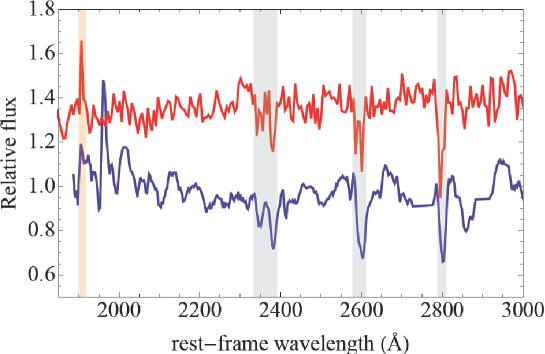
The presence of the CIII] line suggests a further spectra comparison with the starbursting Wolf-Rayet galaxy NGC5253, from the database complied by Storchi-Bergmann et al. (2004, 2005). Wolf-Rayet (WR) galaxies are a subset of blue emission-line galaxies showing the signature of large numbers of WR stars in their spectra (Vacca & Conti, 1992). WR galaxies are thought undergoing present or very recent star formation, with a large population of massive stars in the age range yr. NGC 5253 is a blue compact WR galaxy at distance Mpc (Sakai et al., 2004), showing an intense burst of star formation in the central region. With the measurements of the equivalent widths of blended interstellar lines for NGC 5253 (Leitherer et al., 2011), we have measured the EWs in the arc on Abell 2667 spectrum considering the same wavelength interval of the NGC 5253 spectrum (gray shaded lines in Fig. 7).
We obtain EW(FeII 2370)= 5.42 0.58, EW(FeII 2600) = 6.77 1.32, and EW(MgII 2800)=5.66 1.26, similar to the values obtained for the NGC5253 spectrum: EW(FeII 2370) = , EW(FeII 2600) = , and EW(MgII 2800) = . We then first infer a quite low-metallicity (log[O/H] ) for the lensed galaxy Abell 2667. In Fig. 7 it is also shown the presence of the CIII] line in the spectrum of NGC 5253 with the one in the arc on Abell 2667 spectrum (orange shaded line). The low-significance CIII] line in the spectra is likely a product of the low resolution VIMOS spectra, which makes it difficult to identify lines with relatively small equivalent widths (Bayliss et al., 2013).
Meanwhile, we remark that the physical origin of CIII] emission is not entirely certain, as it should in general be offset in velocity from absorption features that are result from the large gas outflows that WR stars create. To fully understand the classification of the lensed galaxy, a higher resolution spectrum is required to measure the velocity offsets between the CIII] emission and the FeII and MgII absorption lines.
5 Discussion and conclusions
We used HST/ACS z850 imaging data to construct an improved lens model for the lensing cluster Abell 2667. Using the new lens model, we reconstructed the de-lensed image of the source galaxy at . The source resembles a normal disk galaxy with a bright, large central bulge, and tightly wrapped spiral arms. Multiband imaging data allowed us to identify features of the lensed source galaxy in different bands. We summarize our main findings here:
1. The surface brightness (Fig. 4) of the reconstructed source galaxy from the CCD image in the z850 band reveals the central surface brightness mag arcsec-2 and the exponential slope with scale length (a characteristic radius kpc at redshift ). The smooth exponential profile supports the hypothesis of mildly disturbed, almost face-on, disk versus a merging system, consistent with the velocity structure observed by Yuan et al. (2012).
2. After correcting for the flux magnification, the intrinsic luminosity of this spiral galaxy is , with the corresponding stellar mass log. These values are close to the ones of disk galaxies with extended emission lines observed at (Miller et al., 2011).
3. There is negative radial color gradients along the disk (i.e., the color is gradually bluer outwards). The color profile becomes shallower with increasing radius, which provides unique star-forming information along the disk and thus the history of disk formation and evolution. Moreover, we find that the central region of the galaxy tends to contain more metal-rich stellar populations, rather than heavily reddened by dust due to high and patchy obscuration.
4. We further analyze the archive VIMOUS/IFU spectroscopic data (Covone et al., 2006b) and find that the spectra of the source galaxy with the giant gravitational arc is characterized by a strong continuum emission with strong UV absorption lines (FeII and MgII). Moreover, in the given wavelength range ( Å) of the combined arc spectrum, the lensed galaxy of Abell 2667 shows some typical features of a typical starburst WR galaxy (NGC 5253) with strong signatures from large numbers of WR stars (Fig. 7). More specifically, we have measured the EWs in the Abell 2667 spectrum considering the same wavelength interval of the NGC5253 spectrum, and obtained EW(FeII 2370)= 5.42 0.58, EW(FeII 2600) = 6.77 1.32, and EW(MgII 2800)=5.66 1.26, which are similar to the values for the NGC5253 spectrum. Marginal evidence for CIII] 1909 emission at the edge of the grism range, as expected for a typical WR galaxy, further confirm our expectation. However, this conclusion still needs to be checked by high resolution spectrum covering different wavelength range.
Acknowledgments
We thank the anonymous referee for comments which improved the presentation of the paper. This work was supported by the Ministry of Science and Technology National Basic Science Program (Project 973) under Grants Nos. 2012CB821804 and 2014CB845806, the National Natural Science Foundation of China under Grants Nos. 11073005 and 11373014, the Fundamental Research Funds for the Central Universities and Scientific Research Foundation of Beijing Normal University, and China Postdoctoral Science Foundation under Grant No. 2014M550642. We acknowledge financial support from the grant PRIN-INAF 2011 ”Galaxy Evolution with the VLT Survey Telescope”.
References
- Allen et al. (1976) Allen, D. A., Wright, A. E., & Goss, W. M. 1976, MNRAS, 177, 91
- Bayliss et al. (2013) Bayliss, M. B., et al. 2013, arxiv:1310.6695
- Bell & de Jong (2000) Bell, E. F., & de Jong, R. S. 2000, MNRAS, 312, 497
- Benson et al. (2004) Benson, A. J. et al. 2004, MNRAS, 351, 1215
- Boissier & Prantzos (1999) Boissier, S., & Prantzos, N. 1999, MNRAS, 307, 857
- Bradley et al. (2008) Bradley, L. D. et al. 2008, ApJ 678, 647
- Cao et al. (2013) Cao, S., et al. 2013, RAA, 13, 15
- Cassata et al. (2010) Cassata, P., et al. 2010, ApJL, 714, L79-L83
- Collett & Auger (2014) Collett, T. E. & Auger, M. W. 2014, submitted to MNRAS [arXiv:1403.5278v1]
- Covone et al. (2006a) Covone, G., Adami, C., Durret, F., et al. 2006a, A&A, 460, 381
- Covone et al. (2006b) Covone, G., Kneib, J.-P., Soucail, G., et al. 2006b, A&A, 456, 409
- Ebeling et al. (1996) Ebeling, H., Voges, W., Bohringer, H. et al. 1996, MNRAS 281, 799
- Faber & Jackson (1976) Faber, S. M. & Jackson, R. E. 1976, ApJ, 204, 668
- Faure et al. (2011) Faure, C., et al. 2011, A&A, 529, A72
- Genzel et al. (2011) Genzel, R., et al. 2011, ApJ, 733, 101
- Grin et al. (2007) Grin, D., Covone, G., Kneib, J.-P., et al. 2007, PRD, 75, 105018
- Koda et al. (2008) Koda, J., Milosavljevic, M., & Shapiro, P. R. 2009, ApJ 696, 254
- Jullo et al. (2007) Jullo, E., et al. 2007, New Journal of Physics, 9, 447
- Kassiola & Kovner (1993) Kassiola, A. & Kovner, I. 1993, ApJ, 417, 450
- Kauffmann et al. (2003) Kauffmann, G., et al. 2003, MNRAS, 341, 54
- Kennicutt et al. (1998) Kennicutt, R. C. 1998, ApJ, 498, 541
- Kneib et al. (1996) Kneib, J.-P., Ellis, R. S., Smail, I., Couch, W. J., Sharples, R. M., 1996, ApJ 471, 643
- Kneib et al. (2005) Kneib, J.-P., et al. 2004, ApJ 607, 697
- Laporte et al. (2011) Laporte, N., et al. 2011, A&A, 531, A74
- Laporte et al. (2012) Laporte, N., et al. 2012, A&A, 542, L31
- Law et al. (2009) Law, D. R., Steidel, C. C., Erb, D. K., et al. 2009, ApJ, 697, 2057
- Leitherer et al. (2011) Leitherer, C., et al. 2011, AJ, 141, 37
- Liu et al. (2009) Liu, C.-Z., et al. 2009, RAA, 9, 1119
- Lynds & Petrosian (1989) Lynds, R. & Petrosian, V. 1989, ApJ, 336, 1
- MacArthur et al. (2004) MacArthur, L. A., Courteau, S., Bell, E., & Holtzman, J. A. 2004, ApJS, 152, 175
- Miller et al. (2011) Miller, S. H., et al. 2011, ApJ, 741, 115
- Moth & Elston (2002) Moth, P., Elston, R. J., 2002, AJ, 124, 1886
- Newman et al. (2013) Newman, A. B., et al. 2013, ApJ, 765, 24
- Regan et al. (2006) Regan, M. W., et al. 2006, ApJ, 652, 1112
- Richard et al. (2010) Richard, J., et al. 2010, MNRAS Letters, 402, 1
- Rizza et al. (1998) Rizza, E., Burns, J. O., Ledlow, M. J. et al. 1998, MNRAS, 301, 328
- Prantzos & Boissier (2000) Prantzos, N., & Boissier, S. 2000, MNRAS, 313, 338
- Sakai et al. (2004) Sakai, S., et al. 2004, ApJ, 608, 42
- Sand et al. (2005) Sand, D. J., Treu, T., Ellis, R. S., Smith, G. P. 2005, ApJ, 627, 32
- Sharon et al. (2012) Sharon, K., et al. 2012, ApJ, 746, 161
- Smith et al. (2005) Smith, G. P., Kneib, J.-P., Smail, I. et al. 2005, MNRAS, 359, 417
- Soucail et al. (1987) Soucail, G., et al. 1987, A&A, 184, L7
- Storchi-Bergmann et al. (2004) Storchi-Bergmann, T., et al. 2004, ApJ, 429, 572
- Storchi-Bergmann et al. (2005) Storchi-Bergmann, T., et al. 2005, ApJS, 98, 103
- Taylor et al. (2005) Taylor, V. A., Jansen, R. A., Windhorst, R. A., Rogier, A., Odewahn, S. C., & Hibbard, J. E. 2005, ApJ, 630, 784
- Vacca & Conti (1992) Vacca, W. D., & Conti, P. S. 1992, ApJ, 401, 543
- Weissmann et al. (2013) Weißmann, A., et al. 2013, A&A, 549, A19
- Welikala & Kneib (2012) Welikala, N. & Kneib, J.-P. 2012, submitted to ApJ [arXiv:1202.0494]
- Yuan et al. (2011) Yuan, T.-T., et al. 2011, ApJL, 732, L14
- Yuan et al. (2012) Yuan, T.-T., Kewley, L. J., Swinbank, A. M., & Richard, J. 2012, ApJ, 759, 66
- Zheng et al. (2009) Zheng, W., et al. 2009, ApJ, 697, 1907
- Zwicky (1937) Zwicky, F. 1937, Phys. Rev. 51, 290