The frequency and infrared brightness of circumstellar discs at white dwarfs
Abstract
White dwarfs whose atmospheres are polluted by terrestrial-like planetary debris have become a powerful and unique tool to study evolved planetary systems. This paper presents results for an unbiased Spitzer IRAC search for circumstellar dust orbiting a homogeneous and well-defined sample of 134 single white dwarfs. The stars were selected without regard to atmospheric metal content but were chosen to have 1) hydrogen rich atmospheres, 2) K K and correspondingly young post main-sequence ages of 15–270 Myr, and 3) sufficient far-ultraviolet brightness for a corresponding Hubble Space Telescope COS Snapshot. Five white dwarfs were found to host an infrared bright dust disc, three previously known, and two reported here for the first time, yielding a nominal % of white dwarfs in this post-main sequence age range with detectable circumstellar dust. Remarkably, the complementary Hubble observations indicate that a fraction of 27% show metals in their photosphere that can only be explained with ongoing accretion from circumstellar material, indicating that nearly 90% of discs escape detection in the infrared, likely due to small emitting surface area. This paper also presents the distribution of disc fractional luminosity as a function of cooling age for all known dusty white dwarfs, suggesting possible disc evolution scenarios and indicating an undetected population of circumstellar discs.
keywords:
circumstellar matter – stars: abundances – planetary systems – white dwarfs1 Introduction
The field of exoplanetary research is one of the most rapidly expanding subjects in astrophysics. The large number of new discoveries made in the past 20 years have led to swift progress and a preliminary characterisation of the Galactic planet population. Current detection techniques enable estimates of exoplanet radius and mass, using mainly the transit and radial velocity methods, but density alone does not yield a unique solution for the bulk composition of the planet (Adams, Seager, & Elkins-Tanton, 2008; Valencia, Sasselov, & O’Connell, 2007). Transit spectroscopy can also provide some insights into the composition of exoplanet atmospheres (Grillmair et al., 2007; Tinetti et al., 2007) but to date has proved difficult.
In this context, white dwarfs offer a unique laboratory to study exoplanetary compositions. It is now clear that planetary systems around Sun-like and intermediate-mass stars survive, at least in part, the post-main sequence phases of their hosts (Zuckerman et al., 2010). Compelling evidence comes from metal polluted white dwarfs that commonly exhibit closely orbiting circumstellar dust (and sometimes gas) discs originating from the disruption of large asteroids or planetesimals (Farihi, Zuckerman, & Becklin, 2008b; von Hippel et al., 2007; Gänsicke et al., 2006; Becklin et al., 2005; Zuckerman & Becklin, 1987).
Owing to high surface gravity and negligible radiative forces, heavy elements sink on relatively short timescales within the atmospheres of relatively cool ( K) white dwarfs if compared to the evolution timescales (Paquette et al., 1986; Fontaine & Michaud, 1979). Hence, the presence of metals in the atmospheres of cool degenerates must be a sign of recent external accretion (Zuckerman et al., 2003). The source of this accreting material was initially attributed to the interstellar medium (Dupuis et al., 1993a; Dupuis, Fontaine, & Wesemael, 1993b; Dupuis et al., 1992) or comets (Alcock, Fristrom, & Siegelman, 1986), but both theories had trouble in explaining the high and ongoing accretion rates found at hydrogen dominated white dwarfs (Zuckerman et al., 2003). Today accretion from circumstellar material, resulting from the disruption of large asteroids or minor planets, is, by far, the most compelling explanation for atmospheric metals seen at a large fraction of cool white dwarfs (Veras et al., 2013; Jura, 2003).
Metal enriched white dwarfs have become a powerful tool to indirectly analyse the composition of exoterrestrial planetary matter, as their photospheres in principle mirror the composition of the accreted material. As an example of this technique, it was demonstrated that the relative abundances of 15 heavy elements in the atmosphere of GD 362 reflect the composition of a large asteroid that was similar in composition to the bulk Earth-Moon system (Zuckerman et al., 2007). Notably, ultraviolet and optical spectroscopy have shown that metal-contaminated degenerates are, in general, refractory-rich and volatile-poor (Gänsicke et al., 2012; Klein et al., 2010; Desharnais et al., 2008; Dufour et al., 2007; Wolff, Koester, & Liebert, 2002), while infrared spectroscopy reveals that the circumstellar dust itself is silicate-rich and carbon-poor (Jura, Farihi, & Zuckerman, 2009; Reach et al., 2009; Reach et al., 2005), and thus similar to materials found in the inner Solar System (Lodders, 2003). Furthermore, a circumstellar disc that resulted from the destruction of a rocky and water-rich extrasolar minor planet was identified around the white dwarf GD 61 (Farihi, Gänsicke, & Koester, 2013), demonstrating the existence of water in terrestrial zone planetesimals that could play an important role in delivering water to the surface of planets.
Detailed modelling of the infrared excesses found at a fraction of metal polluted white dwarfs suggests that the circumstellar dust is arranged in the form of an optically thick but geometrically thin disc, with similar properties to the rings of Saturn (Rafikov & De Colle, 2006; Jura, 2003). These rings of warm dust are situated within the Roche limit of their host star, as also confirmed by the emission and absorption profiles of gaseous debris discovered at several dusty white dwarfs (Brinkworth et al., 2012; Debes et al., 2012a; Brinkworth et al., 2009; Gänsicke et al., 2006). There is substantial theoretical support for disc creation via tidal disruption of post-main sequence planetary systems, perturbed by unseen planets (Veras et al., 2014, 2013; Debes & Sigurdsson, 2002). The transition from disruption to disc is still poorly understood but there are good models for the evolution of these metal dominated discs (Frewen & Hansen, 2014; Debes, Walsh, & Stark, 2012b; Metzger, Rafikov, & Bochkarev, 2012; Bonsor, Mustill, & Wyatt, 2011).
After nearly a decade of dust disc discoveries at metal enriched degenerates, the statistical frequency of the phenomenon still suffers from significant observational biases. While the fraction of metal polluted white dwarfs that are currently accreting has been constrained by several unbiased surveys to about 20–30% (Koester, Gänsicke, & Farihi, 2014; Zuckerman et al., 2010; Zuckerman et al., 2003), surveys aiming to detect infrared bright dust discs at white dwarfs suffer from considerable biases. The first searches for infrared excesses targeted relatively cool ( K) stars known to be metal-polluted (Farihi et al., 2010; Jura, Farihi, & Zuckerman, 2007; Debes, Sigurdsson, & Hansen, 2007), and this approach does not permit robust statistics of disc frequency over the entire white dwarf population. With little restriction of stellar effective temperature, wide field surveys such as SDSS, UKIDSS, and WISE have found disc frequencies between 0.4 and 1.9% (Girven et al., 2011; Steele et al., 2011; Debes et al., 2011b). On the other hand, more sensitive Spitzer observations of -band bright white dwarfs, without regard to stellar temperature, resulted in a nominal disc frequency of 1.6% (Mullally et al., 2007). A higher frequency of 4.5% was obtained by Barber et al. (2012), by targeting stars in a restricted temperature range where dust detections were expected based on prior surveys. Moreover, the observed sample was fragmented over several instruments and hence the result is difficult to compare with other surveys.
In order to determine definite statistics of the frequency of infrared bright discs at white dwarfs, this paper presents Spitzer observations of a well defined sample of 134 young DA white dwarfs in the temperature range K. Metal abundances for 85 of the stars were also determined in a complementary Hubble Space Telescope COS Snapshot program (Koester et al., 2014), and permit the first unbiased statistics of the frequency of circumstellar discs at young white dwarfs.
Section 2 describes the sample selection criteria and Spitzer photometry, Section 3 discusses how the spectral energy distributions of the sample stars were obtained and describes those with detected discs. Sections 4 and 5 present the derived disc frequency in the context of complementary HST ultraviolet observations and previous surveys, and Section 6 discusses the distribution of the fractional disc luminosity for all known dusty white dwarfs. Section 7 presents notes on the individual objects, and Section 8 gives a short conclusion.
2 Observations
2.1 Sample selection
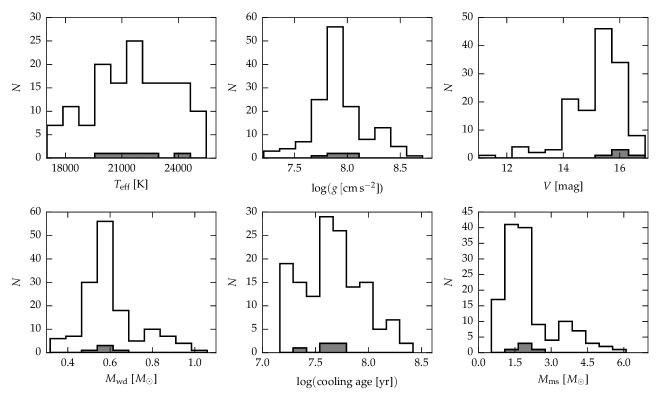
The sample of hydrogen dominated white dwarfs was selected from the catalogues compiled by Liebert, Bergeron, & Holberg (2005) and Koester et al. (2009), who performed model atmosphere analyses based on optical spectroscopy, providing effective temperature, surface gravity, mass and cooling age. The only criteria for selection were 1) K and corresponding young cooling ages of 15–270 Myr, 2) predicted fluxes for the corresponding HST COS Snapshot survey. As such, the selection was performed only for temperature and brightness, resulting in an unbiased sample of 134 DA young single white dwarfs. The distributions of the fundamental stellar parameters are shown in Figure 1.
2.2 Spitzer observations
A total of 100 sample stars were observed between 2012 May and October in the 3.6 and 4.5 m bandpasses using the Infrared Array Camera (IRAC; Fazio et al., 2004) on-board the Spitzer Space Telescope (Werner et al., 2004) as part of Program 80149111Five stars were also observed as part of the same Program but are not included in this study. The white dwarf 1929+012 was observed as an ancillary target (see Section 7.2) while four white dwarfs (0933+025, 1049+103, 1335+369, 1433+538) initially considered to be single stars and included in the original sample were found to host unresolved M dwarf companions and were therefore excluded. Infrared fluxes for these four binaries are reported in the Appendix.. An exposure time of 30 s was used for each individual frame, with 20 medium-size dithers in the cycling pattern, resulting in 600 s total exposure time in each warm IRAC channel. The remaining 34 sample stars were previously observed during either the cold or warm mission, and their archival data were analysed.
The analysis of all targets was performed using the pixel-1 mosaics (Post-Basic Calibrated Data) processed by the IRAC calibration pipeline version S 18.25.0 which produces a single, fully processed and calibrated image. Aperture photometry was performed using the point source extraction package apex within mopex (Makovoz et al., 2006) and an aperture radius of 4 pixels with a 24–40 pixels sky annulus. Fluxes were corrected for aperture size, but not for colour. For blended sources, point response function (PRF) fitting was performed on the Basic Calibrated Data frames, using the package apex multiframe within mopex. Fluxes obtained with PRF fitting were compared with the daophot PSF fitting routine within iraf for a representative sample, and led to consistent results to within 4%, and always within the relative uncertainties. The measured flux uncertainty was computed by apex and include the source photon noise and the variance in sky background. A 5% calibration uncertainty is conservatively added in quadrature to all IRAC fluxes. The flux determinations and uncertainties for the science targets, together with the physical parameters of the stars, are reported in the Appendix.
2.3 Additional near-infrared observations
Independent photometry was also obtained for five targets (Table 1). The stars were observed in 2011 October with LIRIS (Manchado et al., 1998) at the William Herschel Telescope (WHT) and in 2011 August with SOFI (Moorwood et al., 1998) at the New Technology Telescope (NTT), with exposure times of 30, 15, and 10 s at , , and respectively. Sufficient dithers were performed for a total exposure time of 270 s at each bandpass for each target. Three standard star fields from the ARNICA catalogue (Hunt et al., 1998) were observed each night for flux calibration. The data were reduced using standard aperture photometry with the iraf task apphot. The flux calibration for all nights was good to 5% or better.
| WD | Instrument | |||
|---|---|---|---|---|
| (mag) | (mag) | (mag) | /Telescope | |
| 1013+256 | LIRIS/WHT | |||
| 0843+516 | LIRIS/WHT | |||
| 0431+126 | LIRIS/WHT | |||
| 0421+162 | LIRIS/WHT | |||
| 1953–175 | SOFI/NTT |
3 Data Analysis
The spectral energy distributions (SEDs) of the sample stars were constructed with additional short wavelength photometry from a variety of catalogues, including Sloan Digital Sky Survey (SDSS; Ahn et al., 2012), AAVSO Photometric All-Sky Survey (APASS; Henden et al., 2009), Two Micron All Sky Survey (2MASS; Skrutskie et al., 2006), UKIRT Infrared Deep Sky Survey (UKIDSS; Lawrence et al., 2007), and Deep Near Infrared Survey of the Southern Sky (DENIS; Epchtein et al., 1999). Additional near-infrared fluxes for a few targets were also obtained from the literature (Barber et al., 2012; Farihi, 2009).
The available optical and near-infrared fluxes were fitted with pure hydrogen white dwarf atmosphere models (Koester, 2010), kindly provided by the author. The fit was computed by matching the optical and near-infrared best-quality photometric data points with a model spectrum with and effective temperature obtained from Liebert et al. (2005) or Koester et al. (2009), approximated to the closest available model. The Levenberg-Marquardt minimisation algorithm was used to find the best scaling factor.
3.1 Stars with infrared excesses
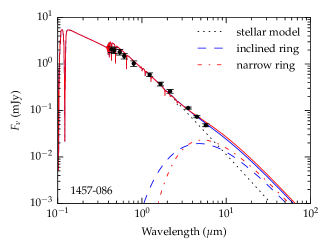
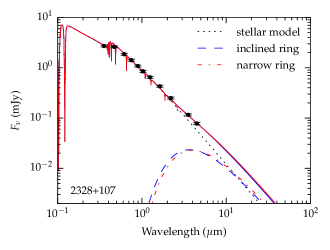
Amongst the 134 sample stars, a total of five white dwarfs show a significant () excess in the IRAC bands: 0843+516, 1015+161, 1457–086, 1018+410, and 2328+107. The first three stars have known infrared excesses (Xu & Jura, 2012; Farihi et al., 2009; Jura et al., 2007) and are also known to be metal polluted (Gänsicke et al., 2012; Koester et al., 2005), while the infrared excesses at 1018+410 and 2328+107 are reported here for the first time. The presence of a significant excess at the ancillary target 1929+012 (Melis et al., 2011; Debes et al., 2011b; Vennes et al., 2010) is also confirmed. This target, which is not part of the statistical sample, is discussed separately in Section 7, together with notes on individual excesses. The infrared excesses were individually modelled as thermal continua using an optically thick, geometrically thin disc (Jura, 2003). Stellar, substellar or planetary companions, and background contamination were confidently ruled out as the excess emission is either too strong (Farihi et al., 2009, 2008a) or the infrared colours are not compatible. The white dwarf radius was estimated from evolutionary models (Fontaine et al., 2001) while the distance was derived using synthetic absolute photometry (Holberg & Bergeron, 2006) compared with available optical and near-infrared magnitudes. Fluxes at 7.9 m were excluded from the fits as these are often contaminated by a strong, m silicate emission feature, as seen in e.g. GD 362 (Jura et al., 2009) and G29-38 (Reach et al., 2005).
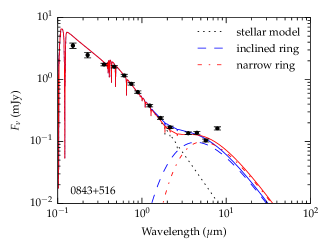
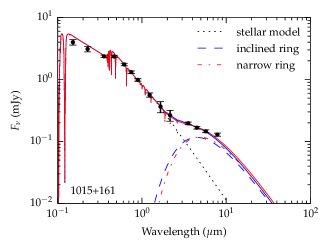
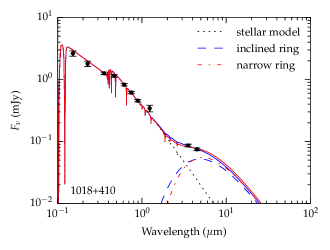
The free parameters in the disc model are the inner disc temperature , the outer disc temperature , and the disc inclination . The radius of the disc at these temperatures can be easily estimated and is proportional to (Chiang & Goldreich, 1997). In the absence of longer wavelength photometry extending to 24 m, these three free parameters cannot be well constrained (Jura et al., 2007). A modest degree of degeneracy is found between the inclination and the radial extent of the disc, especially for subtle excesses (Bergfors et al., 2014; Girven et al., 2012). While the inner disc temperature and radius can be well constrained by the 3.6 m emission, a large set of outer radii and disc inclinations can equally fit the longer-wavelength excess (see e.g. Jura et al., 2007). Two sets of representative models are therefore presented for each star with infrared excess, one corresponding to a relatively wide disc at high inclination and one to a more narrow ring at low inclination. An algorithm for bound constrained minimisation (Byrd et al., 1995) was used to estimate the best fit parameters in both cases.
Figure 2 shows the modelled and photometric SEDs of the dusty white dwarfs, and Table 2 gives the fitted disc parameters for the two sets of models. It can be seen that the outer radii of the model discs are all located within the Roche limit of the star () where planetesimals larger than km would be tidally destroyed. Moreover, the acceptable values for the inner disc temperatures are in agreement with the temperature at which solid dust grains rapidly sublimate in a metal-rich and hydrogen-poor disc (Rafikov, 2012). It is interesting to notice that all models with larger radial extent require improbably high inclinations, all greater or equal to 85∘ (Table 2). Because it is highly unlikely for all the inclinations to be so confined, most if not all these discs must actually be relatively narrow. Section 6 discusses this evidence in greater detail.
| WD | ||||||
|---|---|---|---|---|---|---|
| () | (K) | (K) | () | () | (deg) | |
| Model 1: High inclinations | ||||||
| 0843+516 | 3.2 | 1750 | 800 | 14 | 30 | 87 |
| 1015+161 | 4.2 | 1450 | 900 | 14 | 22 | 85 |
| 1018+410 | 2.9 | 1600 | 700 | 14 | 32 | 87 |
| 1457–086 | 2.8 | 2000 | 600 | 10 | 34 | 89 |
| 2328+107 | 4.4 | 1480 | 1300 | 14 | 16 | 88 |
| Model 2: Narrow rings | ||||||
| 0843+516 | 3.2 | 1000 | 960 | 24 | 25 | 30 |
| 1015+161 | 4.2 | 1120 | 1000 | 18 | 20 | 70 |
| 1018+410 | 2.9 | 1000 | 940 | 22 | 24 | 40 |
| 1457–086 | 2.8 | 1000 | 940 | 20 | 21 | 75 |
| 2328+107 | 4.4 | 1300 | 1270 | 16 | 17 | 75 |
4 The frequency of circumstellar debris
The detection of dust at five of 134 sample stars translates to a nominal excess frequency of % for post-main sequence ages of 15–270 Myr. The upper and lower bounds are calculated using the binomial probability distribution and confidence level. This frequency is a firm lower limit on the fraction of 2–3 stars (the typical progenitors of the white dwarfs in our sample) that form planetary systems. However, complementary HST COS observations demonstrate that at least 27% of white dwarfs with diffusion timescales of only a few weeks have photospheric metals that require ongoing accretion of a circumstellar reservoir. These findings clearly indicate that the actual fraction of debris discs at white dwarfs is almost an order of magnitude higher, with nearly 90% of discs emitting insufficient flux to be detected by the current infrared facilities, such as Spitzer.
4.1 Complementary HST COS observations
The entire sample of 134 stars observed with Spitzer was also approved as an HST COS Snapshot program. Snapshot targets are observed during gaps between regular guest observer programs, and a total of 85 of the 134 white dwarfs were observed between 2010 September and 2013 February within programs 12169 and 12474. The results of the HST survey itself are published elsewhere (Koester et al., 2014), and these are summarised briefly here. It was found that amongst these 85 stars, 56% display atmospheric metals: 48 exhibit photospheric Si, 18 also show C, and 7 show further metals. The analysis indicated that for 25 stars the metal abundances may be explained by radiative levitation alone, although accretion has likely occurred recently, leaving 23 white dwarfs (27%) that exhibit traces of heavy elements that can only be explained with ongoing accretion of circumstellar material, in agreement with previous estimates (Zuckerman et al., 2010, 2003). Spitzer observations of the 85 star subsample with HST data show that, amongst the 23 metal polluted white dwarfs that are currently accreting, there are two that exhibit detectable infrared excesses: 0843+516 and 1015+161. The co-observed subsample thus translates to approximately 10% of metal-enriched stars exhibiting detectable dust, indicating that about 90% of debris discs escape detection in the infrared. As expected, no infrared excesses are confidently found in the subsample of non-metal bearing degenerates observed with HST, strongly supporting the connection between infrared excesses and metal pollution.
Possible reasons for the apparent lack of infrared disc detections are still a matter of debate. The collective data for the known circumstellar discs at hydrogen dominated white dwarfs indicate that the DA degenerates with the highest accretion rates are significantly more likely to host an infrared detectable circumstellar disc (Xu & Jura, 2012; Farihi et al., 2009; Jura et al., 2007). The infrared excesses at 0843+516 and 1015+161 confirm this trend, as they both have the highest inferred Si accretion rates amongst the HST sample stars ( g s-1 and g s-1 respectively). This is consistent with a picture where white dwarfs accreting at the highest rates require the most massive and highest surface density discs, which are more likely to be detected in the infrared. One possible explanation for the dearth of infrared excesses is that mutual collisions may be enhanced in low surface density discs, and result in the partial or complete destruction of dust grains (Jura et al., 2007). A related possibility is increased, collisional grain destruction due to the impact of additional, relatively small planetesimals on a pre-exiting dust disc (Jura, 2008). This may explain the lower frequency of infrared excess detections at older and cooler white dwarfs (Bergfors et al., 2014, see also Section 6), as the depletion of the reservoir of large asteroids for older white dwarfs would imply that smaller planetesimals are primarily accreted. In contrast, this work corroborates the interpretation that the lack of infrared excess detections at a large fraction of metal polluted white dwarfs is largely caused by the small total emitting surface area of dust grains, which implies a very low infrared fractional luminosity and hence undetectability with the current instrumentation. Sections 4.2 and 6 provide evidence supporting this hypothesis.
4.2 Hidden subtle excesses in the DAZ sample
Thanks to the large number of stars observed as part of this Spitzer survey, one can investigate the possibility that some DAZ white dwarfs have an infrared excess that is just below the current sensitivity limit. The distribution of excess and deficit infrared fluxes with respect to the model fluxes demonstrates a correlation between subtle infrared excesses and atmospheric metals indicating a population of tenuous circumstellar discs.
The observed excess and deficit fluxes with respect to the model flux at different wavelengths were expressed as a fraction of the photometric and model uncertainties, and were quantified by an excess significance, defined as:
| (1) |
where and are the observed and photospheric model fluxes respectively, and similarly for the uncertainties, and .
The excess significance values were derived for each star in the subsample of 85 degenerates that have both Spitzer and HST observations. Two subgroups were created, one containing non-metal lined (DA) white dwarfs only and one containing degenerates exhibiting atmospheric metals (DAZ) only. All stars that show Si absorption in their spectra – including those whose metals can be explained by radiative levitation alone – were included in the DAZ sample, as these stars have likely accreted circumstellar material recently (Koester et al., 2014). The DA sample consists of 32 stars observed at 3.6 m and 38 stars at 4.5 m, while the DAZ sample consists of 34 stars observed at 3.6 m and 45 stars at 4.5 m. The differences in the subsample sizes are due to the lack of IRAC observations in channel 1 or 2 for some stars whose data were taken from the Spitzer archive. Infrared excesses that have and cases of strong contamination from nearby sources were excluded. The excess significance values were then plotted in separate histograms, for fluxes measured at 3.6 m and 4.5 m. The resulting four histograms are shown in Figure 3. It is important to stress that statistically confident excesses are defined for , corresponding to a significance level of 4. An excess with can be defined as a candidate subtle excess, which cannot yet be confirmed with confidence. However, one can test the observed distribution of all for each subsample of DA and DAZ stars observed at 3.6 m and 4.5 m against expectations.
The number of candidate subtle excesses with and their expected values were computed for each of these subsamples, and these are shown in Figure 3. The expected values were inferred assuming no correlation between atmospheric metals and infrared excesses and were computed in the following way. The observed excesses were randomly distributed in two subsamples equal in size to the observed DA and DAZ subsamples, at 3.6 and 4.5 m. This computation was repeated 1000 times, and the average number of stars with and its standard deviation were used as estimates.
Interestingly, departure from expectations was found. In the DA sample there is only one candidate excess at 4.5 m, while the expected number is at 3.6 m and at 4.5 m. In contrast, the bulk of candidate excesses are found in the DAZ sample, where four and eight values were found at 3.6 m and 4.5 m, while the expected numbers are and respectively.
This apparent correlation between atmospheric metals and subtle infrared excesses, especially at longer wavelengths, may reinforce the idea that most if not all circumstellar discs at metal polluted white dwarfs harbour dust that emits in the infrared, but its signature is too subtle to be detected with the current instrumentation.

5 Comparison with previous surveys
In this section the frequency of infrared excesses at white dwarfs derived in this work is compared with previous surveys.
Implementing a colour selection valid for K, Girven et al. (2011) selected 1884 DA white dwarf candidates from the SDSS DR7 catalogue spatially cross-correlated with the UKIDSS catalogue, and found an 0.8% of infrared bright disc candidates. This frequency includes a correction for the contamination of hot stars and sub-luminous B stars. Amongst the photometrically selected stars, about 1000 white dwarfs were further identified spectroscopically. Restricting this sample to the effective temperature range of the COS/IRAC survey it was found that for K a fraction of 6.2% have infrared excesses. This frequency is higher than that derived from this Spitzer survey, but includes non-discs such as low mass stellar and substellar companions and closely aligned background sources. Similarly, Steele et al. (2011) identified 811 DA white dwarfs with K in common between SDSS DR4, or Sion (1999) catalogues, and UKIDSS. It was found that only three stars have a -band excess consistent with a debris disc, translating to a nominal frequency of 0.4%. Direct comparison with this work is not possible, due to the disparate effective temperature regimes and the lack of on-line data.
Mid-infrared photometry from the preliminary Wide-field Infrared Survey Explorer (WISE; Wright et al., 2010) catalogues, cross-correlated with the preliminary SDSS DR7 white dwarf catalogue, resulted in 1527 WISE detections and 52 disc candidates (Debes et al., 2011b). The frequency of discs was estimated applying a flux cutoff in the WISE photometry, resulting in six disc candidates amongst 395 white dwarfs, and yielding a lower frequency of . Further analysis of the sample revealed that two of these candidates are spurious, so that a new estimate for the frequency of discs in the brightness limited WISE sample is 1% (Barber et al., 2014). This sample had no restriction in effective temperature and included K stars, for which discs have never been confirmed.
These frequencies should be considered with care, as disc candidates often need to be confirmed with additional data. For instance, Spitzer observations of six disc candidates from Girven et al. (2011) reveal that only five of the excesses are confirmed at longer wavelengths, and only three are due to dust discs (Farihi et al., 2012). Prior Spitzer observations also show that only 50% of dusty white dwarfs show an excess in -band (Farihi et al., 2010). Lastly, further follow-up of 16 disc candidates in the WISE survey (Debes et al., 2011b) revealed that the majority of the detected excesses are due to background contamination (Barber et al., 2014; Wang, Tziamtzis, & Wang, 2014), showing that excess photometric fluxes detected with WISE need additional confirmation. It is also worth noting that, although many WISE disc candidates might be spurious, it is likely that all white dwarfs with bright dust discs have been discovered for the bulk of known white dwarfs (Hoard et al., 2013).
Mullally et al. (2007) presented the first unbiased Spitzer surveys of white dwarfs in search of infrared excesses. A brightness limited sample of 135 single stars from Sion (1999) and with mag in 2MASS was selected to be observed at 4.5 and 7.9 m. Infrared fluxes were successfully measured for 124 of these, and only two showed significant excess due to dust, yielding a frequency of 1.6%. The sample stars have a large temperature range, extending to hot effective temperatures at which solid dust grains rapidly sublimate within the Roche limit of the star. This brightness limited sample was naturally diverse in effective temperature, stellar mass, and atmospheric composition, making it problematic to compare with other surveys.
Barber et al. (2012) report a % frequency of discs at DA white dwarfs but this result contains biases due to 1) the method used to select the statistical sample and 2) the strategy to detect the discs. A total of 117 single white dwarfs with K were selected from the Palomar Green (PG) Survey (Green, Schmidt, & Liebert, 1986), but the authors did not provide details on the actual selection. There are in fact 145 single degenerates in the PG catalogue in this temperature range, and all of these stars should have been considered for an unbiased frequency. The frequency reported is also significantly higher than that found by other surveys, especially considering the preliminary -band excess selection method. As mentioned previously, only about half of known dusty white dwarfs have a -band excess (Farihi et al., 2010), and this 4.3% frequency represents only a lower limit. This means that excesses that show their signature beyond 2.2 m have likely been missed. Indeed, one of the stars in the Barber et al. (2012) sample, PG 2328+108, was observed as part of this Spitzer survey, and a subtle excess was confidently detected (see Figure 2). It is also worth noting that 2MASS photometry becomes unreliable for sources fainter than mag (Farihi, 2009; Hoard et al., 2007) and most of their 39 stars with only 2MASS photometry are fainter than this limit. Finally, four previously known dusty white dwarfs (1015+161, 1116+026, 1457–086 and 2326+049) were included in the sample of 117 stars, but were not followed-up photometrically or spectroscopically, and were assumed to have discs a priori. This can introduce a strong bias in disc frequency, as two of these discs (1015+161, 1116+026) do not actually have detectable -band excess ( and respectively) and would have been missed if not previously known.
Despite these issues, it is worth trying to derive a robust lower limit for the frequency of detectable discs in the PG catalogue. Considering the infrared excess discovered at 2328+108, together with the other five known infrared excesses detected in the complete PG sample of 145 stars with K, a lower limit for the disc frequency in this temperature range is 4.1%. Note that other subtle infrared excesses might still be present, as not all 145 stars have Spitzer observations. Restricting the range of effective temperatures to K allows direct comparison with this work. There are 96 stars and five infrared excesses in this temperature range in the sample analysed in this study, translating to a 5.2% frequency. Similarly, there are three infrared excesses amongst 50 stars in the PG sample with K, yielding a frequency of . For comparison, Girven et al. (2011) found a higher fraction of 6.9% -band excesses in this temperature range, but this frequency does not take into account contaminant sources.
6 The fractional luminosity of dust discs
| WD | Ref. | ||||
|---|---|---|---|---|---|
| (Myr) | (K) | (K) | (%) | ||
| 0106–328 | 160 | 16000 | 1470 | 0.08 | 1 |
| 0110–565 | 81 | 19200 | 1050 | 0.15 | 2 |
| 0146+187 | 418 | 11500 | 1120 | 1.47 | 3 |
| 0246+734† | 995 | 8250 | 1000 | 0.31 | 4 |
| 0300–013 | 189 | 15200 | 1200 | 0.31 | 5 |
| 0307+078 | 531 | 10500 | 1200 | 0.18 | 1 |
| 0408–041 | 224 | 14400 | 1020 | 2.94 | 5 |
| 0435+410 | 116 | 17500 | 1250 | 0.28 | 2 |
| 0735+187 | 264 | 13600 | 1330 | 1.59 | 6 |
| 0842+231 | 92 | 18600 | 1350 | 0.60 | 6 |
| 0843+516 | 29 | 23900 | 1310 | 0.13 | 7 |
| 0956–017 | 283 | 13280 | 1220 | 2.73 | 8 |
| 1015+161 | 80 | 19300 | 1210 | 0.17 | 5 |
| 1018+410 | 45 | 22390 | 1210 | 0.11 | 9 |
| 1041+091 | 106 | 17910 | 1500 | 0.15 | 6 |
| 1116+026 | 358 | 12200 | 1000 | 0.48 | 5 |
| 1150–153 | 314 | 12800 | 940 | 2.02 | 10 |
| 1219+130 | 350 | 12300 | 1250 | 1.61 | 8 |
| 1225–079 | 531 | 10500 | 300 | 0.05 | 1 |
| 1226+110 | 45 | 22000 | 1070 | 0.40 | 11 |
| 1349–230 | 100 | 18200 | 1260 | 0.33 | 2 |
| 1455+298 | 1315 | 7400 | 400 | 0.19 | 12 |
| 1457–086 | 63 | 20400 | 1400 | 0.04 | 3 |
| 1541+651 | 409 | 11600 | 980 | 1.23 | 13 |
| 1551+175 | 178 | 15500 | 1690 | 0.19 | 4 |
| 1554+094 | 37 | 22800 | 1100 | 0.43 | 8 |
| 1615+164 | 274 | 13430 | 1370 | 1.28 | 6 |
| 1729+371 | 531 | 10500 | 820 | 2.02 | 14 |
| 1929+011 | 57 | 20890 | 1060 | 0.19 | 5 |
| 2115–560 | 653 | 9700 | 820 | 0.84 | 3 |
| 2132+096 | 301 | 13000 | 550 | 0.11 | 4 |
| 2207+121 | 122 | 17300 | 1100 | 0.74 | 7 |
| 2221–165 | 588 | 10100 | 950 | 0.67 | 1 |
| 2326+049 | 409 | 11600 | 1060 | 2.87 | 12 |
| 2328+107 | 37 | 21000 | 2000 | 0.05 | 9 |
-
†
Needs to be confirmed.
-
•
References:
(1) Farihi et al. (2010) (2) Girven et al. (2012) (3) Farihi et al. (2009) (4) Bergfors et al. (2014) (5) Jura et al. (2007) (6) Brinkworth et al. (2012) (7) Xu & Jura (2012) (8) Zuckerman et al. (2003); Farihi et al. (2012) (9) this work; (10) Jura et al. (2009) (11) Brinkworth et al. (2009) (12) Farihi et al. (2008b) (13) Barber et al. (2012) (14) Jura et al. (2007)
Here it is shown that the distribution of the disc fractional luminosities () for the sample of known dusty white dwarfs reinforces the interpretation that a large fraction of circumstellar discs remain undetected in the infrared and may also provide insight into their evolution.
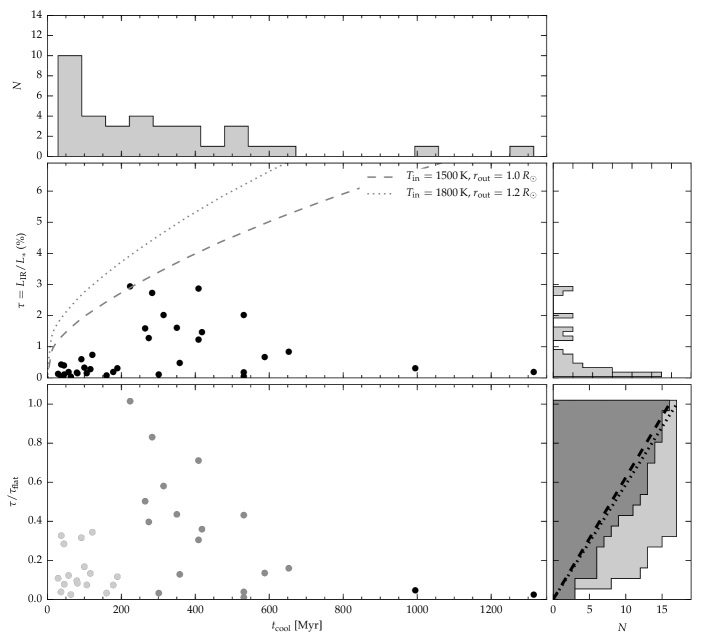
The value of fractional luminosity of all known infrared excesses at cool white dwarfs was estimated in a consistent manner. The photospheric flux was fitted as described in Section 3 and a blackbody distribution was then fitted to the infrared excesses seen in the -band and the three shortest wavelength IRAC bandpasses. The mid-infrared fluxes were all measured with Spitzer IRAC and were obtained from the literature and this work. Although a precise estimate of requires detailed modelling of the photospheric and disc flux, the values reported here are estimated to be good to 10%. Independently measured values for 18 discs known as of mid-2010 agree to within 10% (Farihi, 2011). Note also that is the observed fractional luminosity and it does not take into account the disc inclination, which cannot be determined confidently (Section 3.1). The fractional luminosity and the blackbody dust temperature for all 35 Spitzer detected white dwarfs with infrared excesses are listed in Table 3. The measured values of and their distribution are also plotted in Figure 4.
6.1 An undetected population of subtle excesses
The right hand histogram of the middle panel of Figure 4 shows the distribution of , with 20 bins between 0% and 3%. It can be seen that the distribution rises sharply at the smallest fractional luminosities indicating that the majority of circumstellar discs are subtle. This suggests that many discs might have a fractional luminosity that is below the sensitivity limits of the current instrumentation and therefore escape detection.
Together with the likely presence of several additional subtle excesses seen in this Spitzer sample (see Section 4.2), the distribution of points to a large population of subtle excesses, suggesting that most if not all, currently accreting white dwarfs with metals have circumstellar dust. This significant population of dust discs are not detectable with current facilities, likely due to low surface areas and optical depth.
6.2 Narrow rings at young white dwarfs
The central panel of Figure 4 shows as a function of cooling age. The two lines represent the value of the maximum fractional disc luminosity for a flat disc model (Jura, 2003) with a face-on configuration. This value was calculated assuming that the dust occupies all the space available between the distance from the star at which dust grains rapidly sublimate and the stellar Roche limit. The two lines correspond to two different assumptions about the maximum disc extent. The dotted line assumes that silicates rapidly sublimate at K and the stellar Roche limit is , while the dashed line assumes K and .
From the central panel it can be seen that infrared excesses have so far only been detected at white dwarfs older than Myr, and with corresponding K. This is somewhat expected, as at higher stellar temperatures, any disrupted asteroids debris will evaporate relatively quickly, so that their detection is less likely. However, the calculations done here and shown in the plot indicate that optically thick discs may exist at higher effective temperatures and cooling ages. Such discs would likely evolve more rapidly (Rafikov, 2011), and have a higher gas to dust ratios from sublimation prior to settling into optically thick rings.
As the white dwarf cools below 25 000 K the distance at which silicates rapidly sublimate decreases. Hence, the area available for dust grains increases, so that the disc luminosity should increase as well. However, the expected increase assuming that discs are fully extended (shown by the two lines in the central panel of Figure 4), is not seen in the observed fractional luminosities. Between 25 Myr and Myr there are 17 dusty white dwarfs, all with fractional luminosities significantly less than the maximum value allowed for flat discs. This suggests that, at these young white dwarfs, large and extended discs do not form, or only persist for timescales significantly shorter than the disc lifetime.
This finding can be better explored and tested in the bottom-left panel of Figure 4, showing the ratio for K and as a function of cooling age. Supposing that discs are fully extended, and assuming random inclinations, the distribution of should be uniform between zero and one. However, this does not seem to be true, especially for white dwarfs younger than 200 Myr and older than 700 Myr. To better explore if discs have different radial extents at different ages it is useful to consider three cooling age ranges separately, for Myr (light grey symbols), for (dark grey symbols), and for . It can be seen that:
-
1)
At Myr, the values are all below 0.4, clearly demonstrating that inclination is not the only parameter influencing the distribution. A Kolmogorov–Smirnov (KS) test confirms this, resulting in a probability of that the observed distribution is uniform in . As any observational bias would favour the detection of discs with lower inclinations and correspondingly higher fractional luminosities, this indicates that the observed discs must be relatively narrow at these young cooling ages.
-
2)
Between there is a notable increase in the observed fractional luminosities, with the brightest () disc modelled as face on at 0408–041 (GD 56). In this range of cooling ages, a KS test reveals that the distribution of is uniform with a probability of only 0.07, again indicating that a second parameter shapes the distribution, namely the disc radial extent. While not as striking as for the youngest cooling ages, this group likely contains several relatively narrow discs, as indicated by the cumulative distribution at smaller values.
-
3)
Lastly, at Myr there are only two detected discs with relatively low fractional luminosities (). The small values of these discs, together with the decreasing frequency of detections seen at older white dwarfs (top histogram of Figure 4), suggest that the number of large asteroid disruptions per time bin may be decreasing and hence also the fraction of detectable infrared excesses (Bergfors et al., 2014). However, it is interesting to note that the inferred metal accretion rates do not show a decreasing trend with cooling age (Koester et al., 2014), indicating that circumstellar material is present at older stars. This could be explained by the accretion of smaller asteroids, which can still provide continuous accretion, but are less likely to produce detectable amounts of dust (Wyatt et al., 2014).
6.3 Possible disc evolution scenarios
Interestingly, the existence of narrow rings is predicted by global models of white dwarf disc evolution. In general, the outer radii of flat and optically thick discs will rapidly decrease due to Poynting-Robertson (PR) drag. Specifically, for a range of initial, realistic surface density distributions, PR drag is significantly more efficient per unit mass on the outermost (and innermost) disc regions where grain density and optical depth is lowest. Solids are quickly gathered inward until they result in a region of moderate optical depth (Metzger, Rafikov, & Bochkarev, 2012; Bochkarev & Rafikov, 2011), giving rise to a sharp outer edge.
This edge forms rapidly, and marches appreciably inward within a few to several hundred PR drag timescales (Bochkarev & Rafikov, 2011), which can be as short as years for typical dusty white dwarfs and 1 m dust at 1 . The rate at which the outer edge migrates inward will be ultimately set by the dominant grain size, as the rate scales linearly with particle size and can be a factor of 1000 longer for centimetre vs. micron sizes. Stellar luminosity plays a smaller role, varying by less than a factor of 20 between typical 10 000 K and 20 000 K white dwarfs (Fontaine et al., 2001). Thus, if this mechanism is responsible for sculpting narrow rings, their radial extents as a function of white dwarf cooling age and luminosity may broadly constrain typical particle sizes.
The transition in disc brightness between the Myr and cooling age ranges appears relatively abrupt, however, and it is not clear that a change in stellar luminosity (and PR drag timescale) alone can account for the difference between the two populations. It is perhaps tempting to interpret the brighter and presumably larger discs at as evidence of disc spreading, but the viscous timescale among particulates, for any reasonable particle size, is orders of magnitude insufficient and thus highly unlikely to have an effect on disc evolution (Metzger et al., 2012; Farihi et al., 2008b).
A distinct possibility for the narrowing of rings is disc truncation by impact. Theoretical models show that post-main sequence dynamical instabilities arise near Myr, then peak around Myr, decreasing towards later times (Veras et al., 2013; Mustill, Veras, & Villaver, 2014). This suggests that impacts on pre-existing discs by additional, perturbed and tidally shredded asteroids would be most prevalent among the Myr disc sample. Disc impacts would have the favourable characteristic that they should occur preferentially at larger orbital radii, thus typically creating outwardly truncated discs. The impactor fragments would destroy dust masses comparable to their initial, intact masses, creating gas that would quickly dissipate (Jura, 2008). Interestingly, the recently observed drop in infrared luminosity from the dusty white dwarf SDSS J095904.69020047.6, and the disappearance of metallic gas emission lines from the similarly dusty and polluted star SDSS J161717.04+162022.4, may represent such impact events (Xu & Jura, 2014; Wilson et al., 2014).
Because viscous spreading is inefficient (see above), discs will not grow outward significantly during their lifetime, and the narrower discs might be the result of initial conditions; specifically, smaller disrupted parent bodies. However, assuming the same overall disc properties, flat configurations and random inclinations, the average disc mass should correlate with over each population, implying parent body masses all similar to within a factor of roughly 50. This would require relatively fine-tuned mass influxes per unit time in the post-main sequence, including a subtle change around 300 Myr to include slightly larger disruptions. Taken together, this seems unlikely to account for the disc brightness differences among the two cooling age ranges.
In summary, while none of the above mechanisms appears to be without possible drawbacks, the clear observational difference in disc populations demands a closer look with formation and evolutionary modelling. Insufficient data could be masking a more gradual change in the fractional disc luminosities that would favour the edge migration scenario, for example. The detection of a larger number of discs, especially those producing subtle excesses, would improve the statistics and reduce the possibilities.
7 Notes on individual targets
7.1 Sample stars with infrared excesses
0843+516 and 1015+161. These are two metal polluted white dwarfs (Gänsicke et al., 2012) with known infrared excesses (Xu & Jura, 2012; Jura et al., 2007). The excesses at 7.9 m lay significantly above the predicted fluxes of both disc models (Figure 2), likely due to the presence of a strong silicate emission feature.
1018+410. The infrared excess detected at this star is reported here for the first time. There is no reliable near-infrared photometry available for this star, and the 2MASS catalogue only reports mag. However, photometry is available from SDSS and the photospheric level of the white dwarf can be well constrained. This degenerate was not observed in the complementary HST survey, and there are no high-resolution optical spectra available. Follow-up should confirm that this is a DAZ white dwarf.
1457–086. This is a known metal polluted white dwarf (Koester et al., 2005) that was found to host a narrow dust ring with high inclination and radial extent of only 0.01 (Farihi et al., 2009). The fit to the excess emission with both a narrow and highly inclined disc model show that the optical fluxes might be overestimated and 15% error bars were assumed to obtain a satisfactory fit. The star was not observed in the complementary HST survey and additional optical photometry may better constrain the photospheric flux.
2328+107. With a fractional luminosity of only 0.1% this infrared excess, reported here for the first time, joins an expanding list of attenuated discs (Bergfors et al., 2014; Farihi et al., 2010). Both and photometry are available from the 2MASS and SDSS online catalogues and allow to constrain the photospheric level confidently. This degenerate was not observed in the HST survey and high-resolution spectra are not yet available but should reveal the presence of metals.
7.2 The infrared excess at 1929+012
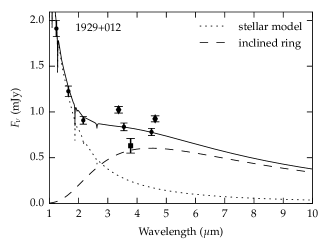
This star, also known as GALEX 1931, is a metal polluted white dwarf (Vennes et al., 2010) with a known infrared excess (Gänsicke et al., 2012; Melis et al., 2011; Debes et al., 2011a), included in the Spitzer Program as an ancillary target. Photometry from WISE revealed infrared excess consistent with emission from a dust disc (Debes et al., 2011a), while ground-based photometry out to -band indicated significant contamination from background sources in the WISE data (Melis et al., 2011). The Spitzer IRAC 3.6 and 4.5 m photometry of GALEX 1931 confirms the excess emission but is heavily blended with two nearby sources, as shown by the higher resolution images (Melis et al., 2011). Despite the success in extracting most of the flux, the relatively low spatial resolution of IRAC implies likely contamination in the derived fluxes. Therefore, 10% error bars are conservatively assumed in the resulting photometry. Figure 5 shows the SED of 1929+012, including IRAC, ISAAC (Melis et al., 2011), and WISE All-Sky photometry. A fiducial disc model is also plotted. It can be seen that the IRAC fluxes are somewhat lower than the WISE values, but also higher than the ground-based -band flux. These data indicate mild contamination is likely in the IRAC data and strong contamination is present in WISE.
8 Summary and conclusion
Spitzer observations of an unbiased sample of 134 DA white dwarfs yield a disc frequency near 4% in the effective temperature range . Complementary HST observations of 85 sample stars reveal that a much larger fraction of at least 27% host circumstellar material, indicating that about 90% of the discs remain undetected in the infrared.
Possible reasons for the lack of infrared detections were investigated. The distribution of observed fluxes compared to photospheric models at 3.6 and 4.5 m for the subsamples with and without metals point to a population of excesses too subtle to currently confirm. Future observations, for example with JWST using spectroscopy, have the potential to confirm the presence of faint dust discs.
The distribution of the fractional disc luminosities of all known dusty white dwarfs also points towards a hidden population of subtle discs. In addition, this distribution indicates that the disc population evolves over time. Only relatively narrow rings are found at Myr, while relatively extended discs, filling the majority of the space available between the distance at which silicates rapidly sublimate and the stellar Roche limit, occur only after a few hundred Myr. A marked decrease in the observed fractional disc luminosities, as well as a decrease in the frequency of detections towards cooler ages, is seen after this peak, suggesting that the number of large asteroids might be gradually depleted.
This study strongly reinforces the hypothesis that most if not all metal-enriched white dwarfs harbour circumstellar dust, but the majority remain unseen due to low surface area and the sensitivity limits of current instrumentation.
Acknowledgments
The authors thank the anonymous referee for suggestions that improved the manuscript. The authors acknowledge Tom Marsh and Mark Hollands for discussions on disc geometry, and Giuseppe Morello and Ingo Waldmann for discussions on statistics. This work is based on observations made with the Spitzer Space Telescope, which is operated by the Jet Propulsion Laboratory, Caltech, under NASA contracts 1407 and 960785. The following databases were used in the process of this research: the Sloan Digital Sky Survey, which is managed by the Astrophysical Research Consortium for the Participating Institutions (http://www.sdss.org/); the Two Micron All Sky Survey, which is a joint project of the University of Massachusetts and IPAC/Caltech, funded by NASA and the NSF; the Deep Near-Infrared Survey of the southern sky, which has been partly funded by the SCIENCE and the HCM plans of the European Commission; the AAVSO Photometric All-Sky Survey, funded by the Robert Martin Ayers Sciences Fund. This research has made use of the VizieR catalogue access tool and the SIMBAD database operated at CDS, Strasbourg, France. MR, JF, and CB collectively acknowledge support from the STFC; JF via an Ernest Rutherford Fellowship. The research leading to these results has received funding from the European Research Council under the EU 7th Framework Programme (FP/2007–2013)/ERC Grant Agreement n. 320964 (WDTracer).
References
- Adams et al. (2008) Adams E. R., Seager S., Elkins-Tanton L., 2008, ApJ, 673, 1160
- Ahn et al. (2012) Ahn C. P. et al., 2012, ApJS, 203, 21
- Alcock et al. (1986) Alcock C., Fristrom C. C., Siegelman R., 1986, ApJ, 302, 462
- Barber et al. (2014) Barber S. D., Kilic M., Brown W. R., Gianninas A., 2014, ApJ, 786, 77
- Barber et al. (2012) Barber S. D., Patterson A. J., Kilic M., Leggett S. K., Dufour P., Bloom J. S., Starr D. L., 2012, ApJ, 760, 26
- Becklin et al. (2005) Becklin E. E., Farihi J., Jura M., Song I., Weinberger A. J., Zuckerman B., 2005, ApJ, 632, L119
- Bergfors et al. (2014) Bergfors C., Farihi J., Dufour P., Rocchetto M., 2014, MNRAS, 444, 2147
- Bochkarev & Rafikov (2011) Bochkarev K. V., Rafikov R. R., 2011, ApJ, 741, 36
- Bonsor et al. (2011) Bonsor A., Mustill A. J., Wyatt M. C., 2011, MNRAS, 414, 930
- Brinkworth et al. (2012) Brinkworth C. S., Gänsicke B. T., Girven J. M., Hoard D. W., Marsh T. R., Parsons S. G., Koester D., 2012, ApJ, 750, 86
- Brinkworth et al. (2009) Brinkworth C. S., Gänsicke B. T., Marsh T. R., Hoard D. W., Tappert C., 2009, ApJ, 696, 1402
- Byrd et al. (1995) Byrd R. H., Lu P., Nocedal J., Zhu C., 1995, SIAM Journal on Scientific Computing
- Chiang & Goldreich (1997) Chiang E. I., Goldreich P., 1997, ApJ, 490, 368
- Debes et al. (2011a) Debes J. H., Hoard D. W., Kilic M., Wachter S., Leisawitz D. T., Cohen M., Kirkpatrick J. A., Griffith R. L., 2011a, ApJ, 729, 4
- Debes et al. (2011b) Debes J. H., Hoard D. W., Wachter S., Leisawitz D. T., Cohen M., 2011b, ApJS, 197, 38
- Debes et al. (2012a) Debes J. H., Kilic M., Faedi F., Shkolnik E. L., Lopez-Morales M., Weinberger A. J., Slesnick C., West R. G., 2012a, ApJ, 754, 59
- Debes & Sigurdsson (2002) Debes J. H., Sigurdsson S., 2002, ApJ, 572, 556
- Debes et al. (2007) Debes J. H., Sigurdsson S., Hansen B., 2007, AJ, 134, 1662
- Debes et al. (2012b) Debes J. H., Walsh K. J., Stark C., 2012b, ApJ, 747, 148
- Desharnais et al. (2008) Desharnais S., Wesemael F., Chayer P., Kruk J. W., Saffer R. A., 2008, ApJ, 672, 540
- Dufour et al. (2007) Dufour P. et al., 2007, ApJ, 663, 1291
- Dupuis et al. (1992) Dupuis J., Fontaine G., Pelletier C., Wesemael F., 1992, ApJS, 82, 505
- Dupuis et al. (1993a) Dupuis J., Fontaine G., Pelletier C., Wesemael F., 1993a, ApJS, 84, 73
- Dupuis et al. (1993b) Dupuis J., Fontaine G., Wesemael F., 1993b, ApJS, 87, 345
- Epchtein et al. (1999) Epchtein N. et al., 1999, A&A, 349, 236
- Farihi (2009) Farihi J., 2009, MNRAS, 398, 2091
- Farihi (2011) Farihi J., 2011, White Dwarf Atmospheres and Circumstellar Environments, 117
- Farihi et al. (2008a) Farihi J., Becklin E. E., Zuckerman B., 2008a, ApJ, 681, 1470
- Farihi et al. (2013) Farihi J., Gänsicke B. T., Koester D., 2013, Science, 342, 218
- Farihi et al. (2012) Farihi J., Gänsicke B. T., Steele P. R., Girven J. M., Burleigh M. R., Koester D., 2012, MNRAS, 421, 1635
- Farihi et al. (2009) Farihi J., Jura M., Zuckerman B., 2009, ApJ, 694, 805
- Farihi et al. (2010) Farihi J., Jura M., Zuckerman B., 2010, ApJ, 714, 1386
- Farihi et al. (2008b) Farihi J., Zuckerman B., Becklin E. E., 2008b, ApJ, 674, 431
- Fazio et al. (2004) Fazio G. G. et al., 2004, ApJS, 154, 10
- Fontaine et al. (2001) Fontaine G., Brassard P., Bergeron P., 2001, The Publications of the Astronomical Society of the Pacific, 113, 409
- Fontaine & Michaud (1979) Fontaine G., Michaud G., 1979, ApJ, 231, 826
- Frewen & Hansen (2014) Frewen S. F. N., Hansen B. M. S., 2014, MNRAS, 439, 2442
- Gänsicke et al. (2012) Gänsicke B. T., Koester D., Farihi J., Girven J. M., Parsons S. G., 2012, MNRAS, 424, 333
- Gänsicke et al. (2006) Gänsicke B. T., Marsh T. R., Southworth J., Rebassa-Mansergas A., 2006, Science, 314, 1908
- Girven et al. (2012) Girven J. M., Brinkworth C. S., Farihi J., Gänsicke B. T., Hoard D. W., Marsh T. R., Koester D., 2012, ApJ, 749, 154
- Girven et al. (2011) Girven J. M., Gänsicke B. T., Steeghs D., Koester D., 2011, MNRAS, 417, 1210
- Green et al. (1986) Green R. F., Schmidt M., Liebert J., 1986, ApJS, 61, 305
- Grillmair et al. (2007) Grillmair C. J., Charbonneau D., Burrows A., Stauffer J. R., Meadows V., Levine D., 2007, ApJ, 658, L115
- Henden et al. (2009) Henden A. A., Welch D. L., Terrell D., Levine S. E., 2009, American Astronomical Society, 214
- Hoard et al. (2013) Hoard D. W., Debes J. H., Wachter S., Leisawitz D. T., Cohen M., 2013, ApJ, 770, 21
- Hoard et al. (2007) Hoard D. W., Wachter S., Gibiansky M., 2007, AJ, 134, 26
- Holberg & Bergeron (2006) Holberg J. B., Bergeron P., 2006, AJ, 132, 1221
- Hunt et al. (1998) Hunt L. K., Mannucci F., Testi L., Migliorini S., Stanga R. M., Baffa C., Lisi F., Vanzi L., 1998, AJ, 115, 2594
- Jura (2003) Jura M., 2003, ApJ, 584, L91
- Jura (2008) Jura M., 2008, AJ, 135, 1785
- Jura et al. (2007) Jura M., Farihi J., Zuckerman B., 2007, ApJ, 663, 1285
- Jura et al. (2009) Jura M., Farihi J., Zuckerman B., 2009, AJ, 137, 3191
- Kalirai et al. (2008) Kalirai J. S., Hansen B. M. S., Kelson D. D., Reitzel D. B., Rich R. M., Richer H. B., 2008, ApJ, 676, 594
- Klein et al. (2010) Klein B., Jura M., Koester D., Zuckerman B., Melis C., 2010, ApJ, 709, 950
- Koester (2010) Koester D., 2010, Memorie della Societa Astronomica Italiana, 81, 921
- Koester et al. (2014) Koester D., Gänsicke B. T., Farihi J., 2014, A&A, 566, 34
- Koester et al. (2005) Koester D., Rollenhagen K., Napiwotzki R., Voss B., Christlieb N., Homeier D., Reimers D., 2005, A&A, 432, 1025
- Koester et al. (2009) Koester D., Voss B., Napiwotzki R., Christlieb N., Homeier D., Lisker T., Reimers D., Heber U., 2009, A&A, 505, 441
- Lawrence et al. (2007) Lawrence A. et al., 2007, MNRAS, 379, 1599
- Liebert et al. (2005) Liebert J., Bergeron P., Holberg J. B., 2005, ApJS, 156, 47
- Lodders (2003) Lodders K., 2003, ApJ, 591, 1220
- Makovoz et al. (2006) Makovoz D., Roby T., Khan I., Booth H., 2006, Advanced Software and Control for Astronomy. Edited by Lewis, 6274, 10
- Manchado et al. (1998) Manchado A. et al., 1998, Proc. SPIE Vol. 3354, 3354, 448
- Melis et al. (2011) Melis C., Farihi J., Dufour P., Zuckerman B., Burgasser A. J., Bergeron P., Bochanski J. J., Simcoe R., 2011, ApJ, 732, 90
- Metzger et al. (2012) Metzger B. D., Rafikov R. R., Bochkarev K. V., 2012, Monthly Notices of the Royal Astronomical Society, 423, 505
- Moorwood et al. (1998) Moorwood A., Cuby J. G., Lidman C., 1998, The Messenger, 91, 9
- Mullally et al. (2007) Mullally F., Kilic M., Reach W. T., Kuchner M. J., von Hippel T., Burrows A., Winget D. E., 2007, ApJS, 171, 206
- Mustill et al. (2014) Mustill A. J., Veras D., Villaver E., 2014, MNRAS, 437, 1404
- Paquette et al. (1986) Paquette C., Pelletier C., Fontaine G., Michaud G., 1986, ApJS, 61, 197
- Rafikov (2011) Rafikov R. R., 2011, MNRAS, 416, L55
- Rafikov (2012) Rafikov R. R., 2012, ApJ, 760, 123
- Rafikov & De Colle (2006) Rafikov R. R., De Colle F., 2006, ApJ, 646, 275
- Reach et al. (2005) Reach W. T., Kuchner M. J., von Hippel T., Burrows A., Mullally F., Kilic M., Winget D. E., 2005, ApJ, 635, L161
- Reach et al. (2009) Reach W. T., Lisse C., von Hippel T., Mullally F., 2009, ApJ, 693, 697
- Sion (1999) Sion E. M., 1999, ApJS, 121, 1
- Skrutskie et al. (2006) Skrutskie M. F. et al., 2006, AJ, 131, 1163
- Steele et al. (2011) Steele P. R., Burleigh M. R., Dobbie P. D., Jameson R. F., Barstow M. A., 2011, MNRAS, 416, 2768
- Tinetti et al. (2007) Tinetti G. et al., 2007, Nature, 448, 169
- Valencia et al. (2007) Valencia D., Sasselov D. D., O’Connell R. J., 2007, ApJ, 665, 1413
- Vennes et al. (2010) Vennes S., Kawka A., Németh P., 2010, MNRAS, 404, L40
- Veras et al. (2014) Veras D., Leinhardt Z. M., Bonsor A., Gaensicke B. T., 2014, arXiv, 2493
- Veras et al. (2013) Veras D., Mustill A. J., Bonsor A., Wyatt M. C., 2013, MNRAS, 431, 1686
- von Hippel et al. (2007) von Hippel T., Kuchner M. J., Kilic M., Mullally F., Reach W. T., 2007, ApJ, 662, 544
- Wang et al. (2014) Wang Z., Tziamtzis A., Wang X., 2014, ApJ, 782, 20
- Werner et al. (2004) Werner M. W. et al., 2004, ApJS, 154, 1
- Wilson et al. (2014) Wilson D. J., Gänsicke B. T., Koester D., Raddi R., Breedt E., Southworth J., Parsons S. G. 2014, MNRAS, 445, 1878
- Wolff et al. (2002) Wolff B., Koester D., Liebert J., 2002, A&A, 385, 995
- Wright et al. (2010) Wright E. L. et al., 2010, AJ, 140, 1868
- Wyatt et al. (2014) Wyatt M. C., Farihi J., Pringle J. E., Bonsor A., 2014, Monthly Notices of the Royal Astronomical Society, 439, 3371
- Xu & Jura (2012) Xu S., Jura M., 2012, ApJ, 745, 88
- Xu & Jura (2014) Xu S., Jura M., 2014, The Astrophysical Journal Letters, 792, L39
- Zuckerman & Becklin (1987) Zuckerman B., Becklin E. E., 1987, Nature, 330, 138
- Zuckerman et al. (2007) Zuckerman B., Koester D., Melis C., Hansen B. M., Jura M., 2007, ApJ, 671, 872
- Zuckerman et al. (2003) Zuckerman B., Koester D., Reid I. N., Hünsch M., 2003, ApJ, 596, 477
- Zuckerman et al. (2010) Zuckerman B., Melis C., Klein B., Koester D., Jura M., 2010, ApJ, 722, 725
Appendix A Supplementary material
| WD | ||||||||||
|---|---|---|---|---|---|---|---|---|---|---|
| (K) | [log(cm s-2)] | (mag) | [ (yr)] | (Jy) | (Jy) | (Jy) | (Jy) | |||
| 0000+171 | 20 210 | 7.99 | 15.81 | 0.62 | 2.07 | 7.81 | ||||
| 0013–241 | 18 530 | 7.90 | 15.38 | 0.56 | 1.56 | 7.90 | ||||
| 0018–339 | 20 630 | 7.84 | 14.64 | 0.54 | 1.36 | 7.65 | ||||
| 0028–474 | 17 390 | 7.65 | 15.15 | 0.44 | … | 7.87 | ||||
| 0047–524 | 18 810 | 7.73 | 14.23 | 0.48 | 0.83 | 7.77 | ||||
| 0048+202 | 20 360 | 7.89 | 15.38 | 0.57 | 1.57 | 7.72 | ||||
| 0048–544 | 17 870 | 7.98 | 15.16 | 0.61 | 1.94 | 8.02 | ||||
| 0059+257 | 21 370 | 8.04 | 15.90 | 0.65 | 2.35 | 7.75 | ||||
| 0102+095 | 24 770 | 7.93 | 14.44 | 0.60 | 1.86 | 7.28 | ||||
| 0110–139 | 24 690 | 7.99 | 15.75 | 0.63 | 2.16 | 7.36 | ||||
| 0114–605 | 24 690 | 7.75 | 15.11 | 0.51 | 1.08 | 7.17 | ||||
| 0124–257 | 23 040 | 7.79 | 16.18 | 0.52 | 1.18 | 7.35 | ||||
| 0127+270 | 24 870 | 7.83 | 15.90 | 0.55 | 1.40 | 7.18 | ||||
| 0129–205 | 19 950 | 7.88 | 15.30 | 0.56 | 1.54 | 7.75 | ||||
| 0140–392 | 21 810 | 7.92 | 14.35 | 0.58 | 1.74 | 7.59 | ||||
| 0155+069 | 22 010 | 7.67 | 15.47 | 0.47 | 0.66 | 7.39 | ||||
| 0200+248 | 23 280 | 7.86 | 15.71 | 0.56 | 1.50 | 7.37 | ||||
| 0201–052 | 24 630 | 7.64 | … | 0.46 | 0.62 | 7.19 | ||||
| 0221–055 | 24 750 | 7.72 | 16.22 | 0.50 | 0.94 | 7.16 | ||||
| 0222–265 | 23 200 | 7.91 | 15.68 | 0.58 | 1.74 | 7.43 | ||||
| 0227+050 | 19 340 | 7.76 | 12.80 | 0.50 | 0.97 | 7.73 | ||||
| 0229+270 | 24 160 | 7.90 | 15.52 | 0.58 | 1.71 | 7.31 | ||||
| 0231–054 | 17 310 | 8.45 | 14.31 | 0.90 | 4.60 | 8.42 | ||||
| 0242–174 | 20 660 | 7.85 | 15.38 | 0.55 | 1.41 | 7.66 | ||||
| 0300–232 | 22 370 | 8.39 | 15.68 | 0.86 | 4.32 | 8.04 | ||||
| 0307+149 | 21 410 | 7.91 | 15.38 | 0.58 | 1.69 | 7.62 | ||||
| 0308+188 | 18 450 | 7.72 | 14.19 | 0.48 | 0.79 | 7.80 | ||||
| 0308–230 | 23 570 | 8.54 | 15.08 | 0.96 | 5.18 | 8.10 | ||||
| 0331+226 | 21 450 | 7.78 | 15.28 | 0.52 | 1.12 | 7.52 | ||||
| 0341+021 | 22 150 | 7.27 | 15.41 | 0.33 | … | 7.27 | ||||
| 0349–256 | 20 970 | 7.91 | 15.67 | 0.58 | 1.67 | 7.67 | ||||
| 0352+018 | 22 110 | 7.80 | 15.57 | 0.52 | 1.19 | 7.46 | ||||
| 0358–514 | 23 380 | 7.93 | 15.72 | 0.59 | 1.82 | 7.43 | ||||
| 0403–414 | 22 700 | 7.94 | 16.35 | 0.60 | 1.85 | 7.51 | ||||
| 0410+117 | 21 070 | 7.84 | 13.91 | 0.54 | 1.37 | 7.60 | ||||
| 0414–406 | 20 940 | 8.00 | 16.13 | 0.63 | 2.13 | 7.75 | ||||
| 0416–105 | 24 850 | 7.92 | 15.37 | 0.59 | 1.80 | 7.26 | ||||
| 0418–103 | 23 390 | 8.29 | 15.68 | 0.80 | 3.76 | 7.87 | ||||
| 0421+162 | 19 620 | 8.03 | 14.29 | 0.64 | 2.23 | 7.89 | ||||
| 0431+126 | 21 370 | 7.97 | 14.23 | 0.61 | 1.98 | 7.68 | ||||
| 0452–347 | 21 210 | 7.84 | 16.13 | 0.54 | 1.36 | 7.59 | ||||
| 0455–532 | 24 430 | 7.55 | … | 0.43 | … | 7.22 | ||||
| 0507+045.1 | 20 840 | 7.90 | 14.22 | 0.57 | 1.62 | 7.67 | ||||
| 0843+516 | 23 870 | 7.90 | 16.04 | 0.58 | 1.70 | 7.35 | ||||
| 0854+404 | 22 250 | 7.91 | 14.81 | 0.58 | 1.71 | 7.53 | ||||
| 0859–039 | 23 730 | 7.79 | 13.19 | 0.53 | 1.21 | 7.28 | ||||
| 0920+363 | 24 060 | 7.63 | 16.07 | 0.46 | 0.58 | 7.22 | ||||
| 0933+025 | 22 360 | 8.04 | 15.93 | 0.65 | 2.37 | 7.66 | ||||
| 0938+550 | 18 530 | 8.10 | 14.79 | 0.68 | 2.62 | 8.04 | ||||
| 0944+192 | 17 440 | 7.88 | 14.51 | 0.55 | 1.47 | 8.00 | ||||
| 0947+325 | 22 060 | 8.31 | 15.50 | 0.82 | 3.87 | 7.98 | ||||
| 0954+697 | 21 420 | 7.91 | 15.96 | 0.58 | 1.69 | 7.62 | ||||
| 1003–023 | 20 610 | 7.89 | 15.27 | 0.57 | 1.58 | 7.69 | ||||
| 1005+642 | 19 660 | 7.93 | 13.69 | 0.58 | 1.75 | 7.82 | ||||
| 1012–008 | 23 200 | 8.07 | 15.59 | 0.67 | 2.57 | 7.62 | ||||
| 1013+256 | 21 990 | 8.00 | 16.32 | 0.63 | 2.15 | 7.65 | ||||
| 1015+161 | 19 950 | 7.92 | 15.61 | 0.58 | 1.73 | 7.78 | ||||
| 1017+125 | 21 390 | 7.88 | 15.67 | 0.56 | 1.53 | 7.60 | ||||
| 1018+410 | 22 390 | 8.04 | 16.37 | 0.65 | 2.37 | 7.66 | ||||
| 1020–207 | 19 920 | 7.93 | 15.04 | 0.58 | 1.74 | 7.79 | ||||
| 1034+492 | 20 650 | 8.17 | 15.43 | 0.73 | 3.05 | 7.94 | ||||
| 1038+633 | 24 450 | 8.38 | 15.15 | 0.86 | 4.31 | 7.90 | ||||
| 1049+103 | 20 550 | 7.91 | 15.81 | 0.58 | 1.67 | 7.71 | ||||
| 1049–158 | 20 040 | 8.28 | 14.36 | 0.79 | 3.65 | 8.08 | ||||
| 1052+273 | 23 100 | 8.37 | 14.12 | 0.86 | 4.23 | 7.98 | ||||
| 1058–129 | 24 310 | 8.71 | 14.91 | 1.06 | 6.10 | 8.20 | ||||
| 1102+748 | 19 710 | 8.36 | 15.05 | 0.84 | 4.13 | 8.18 | ||||
| 1104+602 | 17 920 | 8.02 | 13.74 | 0.63 | 2.17 | 8.04 | ||||
| 1115+166 | 22 090 | 8.12 | 15.05 | 0.70 | 2.80 | 7.77 | ||||
| 1122–324 | 21 670 | 7.86 | 15.82 | 0.55 | 1.44 | 7.55 | ||||
| 1129+155 | 17 740 | 8.03 | 14.09 | 0.64 | 2.22 | 8.06 | ||||
| 1133+293 | 23 030 | 7.84 | 14.88 | 0.55 | 1.41 | 7.39 | ||||
| 1134+300 | 21 280 | 8.55 | 12.45 | 0.96 | 5.23 | 8.26 | ||||
| 1136+139 | 23 920 | 7.83 | … | 0.54 | 1.37 | 7.28 | ||||
| 1201–001 | 19 770 | 8.26 | 15.16 | 0.78 | 3.55 | 8.08 | ||||
| 1204–322 | 21 260 | 8.00 | 15.62 | 0.62 | 2.12 | 7.72 | ||||
| 1229–013 | 19 430 | 7.47 | 14.46 | 0.38 | … | 7.54 | ||||
| 1230–308 | 22 760 | 8.28 | 15.73 | 0.80 | 3.71 | 7.90 | ||||
| 1233–164 | 24 890 | 8.21 | 15.10 | 0.76 | 3.33 | 7.66 | ||||
| 1243+015 | 21 640 | 7.82 | 16.46 | 0.53 | 1.27 | 7.52 | ||||
| 1249+182 | 19 910 | 7.73 | 15.24 | 0.49 | 0.85 | 7.65 | ||||
| 1257+048 | 21 760 | 7.95 | 14.94 | 0.60 | 1.89 | 7.62 | ||||
| 1310–305 | 20 350 | 7.82 | 14.48 | 0.53 | 1.25 | 7.66 | ||||
| 1323–514 | 19 360 | 7.76 | 14.39 | 0.50 | 0.98 | 7.73 | ||||
| 1325+279 | 21 270 | 8.04 | 15.80 | 0.65 | 2.35 | 7.76 | ||||
| 1325–089 | 17 020 | 7.81 | … | 0.52 | 1.12 | 8.00 | ||||
| 1330+473 | 22 460 | 7.95 | 15.23 | 0.60 | 1.91 | 7.55 | ||||
| 1334–160 | 18 650 | 8.32 | … | 0.82 | 3.86 | 8.20 | ||||
| 1335+369 | 20 510 | 7.78 | … | 0.51 | 1.08 | 7.62 | ||||
| 1337+705 | 20 460 | 7.90 | 12.60 | 0.57 | 1.62 | 7.71 | ||||
| 1338+081 | 24 440 | 7.65 | 16.44 | 0.47 | 0.66 | 7.20 | ||||
| 1353+409 | 23 530 | 7.59 | 15.49 | 0.44 | … | 7.26 | ||||
| 1408+323 | 18 150 | 7.95 | 13.97 | 0.59 | 1.81 | 7.97 | ||||
| 1433+538 | 22 410 | 7.80 | 16.14 | 0.53 | 1.21 | 7.43 | ||||
| 1449+168 | 22 350 | 7.79 | 15.39 | 0.52 | 1.15 | 7.42 | ||||
| 1451+006 | 25 480 | 7.89 | 15.27 | 0.58 | 1.69 | 7.16 | ||||
| 1452–042 | 23 530 | 8.19 | 16.29 | 0.74 | 3.21 | 7.74 | ||||
| 1457–086 | 21 450 | 7.97 | 15.76 | 0.61 | 1.99 | 7.68 | ||||
| 1459+347 | 21 520 | 8.48 | 15.79 | 0.92 | 4.84 | 8.18 | ||||
| 1507+220 | 19 870 | 7.75 | 14.95 | 0.49 | 0.91 | 7.66 | ||||
| 1524–749 | 23 090 | 7.74 | 15.99 | 0.50 | 0.99 | 7.32 | ||||
| 1525+257 | 22 290 | 8.28 | 15.73 | 0.80 | 3.70 | 7.93 | ||||
| 1527+090 | 21 200 | 7.85 | 14.30 | 0.55 | 1.39 | 7.59 | ||||
| 1531–022 | 18 620 | 8.41 | 13.97 | 0.87 | 4.41 | 8.30 | ||||
| 1533–057 | 20 000 | 8.50 | 15.38 | 0.93 | 4.94 | 8.29 | ||||
| 1535+293 | 24 470 | 7.92 | … | 0.59 | 1.81 | 7.30 | ||||
| 1547+057 | 24 360 | 8.36 | 15.94 | 0.85 | 4.16 | 7.88 | ||||
| 1548+149 | 21 450 | 7.86 | 15.16 | 0.55 | 1.45 | 7.57 | ||||
| 1614+136 | 22 020 | 7.21 | 15.23 | 0.32 | … | 7.23 | ||||
| 1620–391 | 24 680 | 7.93 | 11.00 | 0.60 | 1.85 | 7.29 | ||||
| 1633+676 | 23 660 | 7.97 | 16.25 | 0.62 | 2.04 | 7.45 | ||||
| 1647+375 | 21 980 | 7.89 | 14.91 | 0.57 | 1.61 | 7.55 | ||||
| 1713+332 | 22 120 | 7.43 | 14.39 | 0.38 | … | 7.32 | ||||
| 1755+194 | 24 440 | 7.80 | 15.99 | 0.53 | 1.28 | 7.21 | ||||
| 1914–598 | 19 760 | 7.84 | … | 0.54 | 1.31 | 7.74 | ||||
| 1929+012 | 20 890 | 7.91 | 14.20 | 0.58 | 1.68 | 7.68 | ||||
| 1943+163 | 19 760 | 7.79 | 13.95 | 0.51 | 1.11 | 7.71 | ||||
| 1953–715 | 19 270 | 7.87 | 15.06 | 0.55 | 1.47 | 7.81 | ||||
| 2021–128 | 20 750 | 7.82 | 15.20 | 0.53 | 1.26 | 7.62 | ||||
| 2032+188 | 18 200 | 7.36 | 15.32 | 0.34 | … | 7.58 | ||||
| 2039–202 | 19 740 | 7.79 | 12.33 | 0.51 | 1.08 | 7.70 | ||||
| 2046–220 | 23 410 | 7.83 | 15.37 | 0.54 | 1.36 | 7.33 | ||||
| 2058+181 | 17 350 | 7.75 | 15.20 | 0.49 | 0.88 | 7.94 | ||||
| 2134+218 | 18 000 | 7.86 | 14.48 | 0.55 | 1.39 | 7.93 | ||||
| 2149+021 | 17 930 | 7.86 | 12.76 | 0.54 | 1.38 | 7.94 | ||||
| 2152–045 | 19 840 | 7.38 | 15.69 | 0.35 | … | 7.44 | ||||
| 2200–136 | 24 730 | 7.61 | 15.33 | 0.45 | 0.53 | 7.19 | ||||
| 2204+071 | 24 450 | 7.95 | 15.78 | 0.61 | 1.95 | 7.34 | ||||
| 2210+233 | 23 230 | 8.24 | 15.84 | 0.77 | 3.48 | 7.82 | ||||
| 2220+133 | 22 580 | 8.30 | 15.61 | 0.81 | 3.82 | 7.93 | ||||
| 2220+217.1 | 18 740 | 8.24 | 15.22 | 0.77 | 3.43 | 8.13 | ||||
| 2229+235 | 19 300 | 7.90 | 16.01 | 0.57 | 1.60 | 7.83 | ||||
| 2231–267 | 21 590 | 7.99 | 14.97 | 0.62 | 2.09 | 7.68 | ||||
| 2238–045 | 17 540 | 8.18 | 16.90 | 0.73 | 3.04 | 8.17 | ||||
| 2244+210 | 24 110 | 7.89 | 16.45 | 0.57 | 1.66 | 7.31 | ||||
| 2257+162 | 24 580 | 7.49 | 15.97 | 0.41 | … | 7.24 | ||||
| 2306+124 | 20 360 | 7.99 | 15.08 | 0.62 | 2.08 | 7.80 | ||||
| 2322–181 | 21 680 | 7.90 | 15.28 | 0.57 | 1.65 | 7.59 | ||||
| 2328+107 | 21 000 | 7.78 | 15.76 | 0.51 | 1.08 | 7.56 | ||||
| 2359–324 | 22 480 | 7.74 | 16.26 | 0.50 | 0.97 | 7.38 |