Selection of AGN candidates in the GOODS-South Field through SPITZER/MIPS 24 m variability
Abstract
We present a study of galaxies showing mid-infrared variability in data taken in the deepest Spitzer/MIPS 24 m surveys in the GOODS-South field. We divide the dataset in epochs and subepochs to study the long-term (months-years) and the short-term (days) variability. We use a -statistics method to select AGN candidates with a probability 1% that the observed variability is due to statistical errors alone. We find 39 (1.7% of the parent sample) sources that show long-term variability and 55 (2.2% of the parent sample) showing short-term variability. That is, 0.03 sources arcmin-2 for both, long-term and short-term variable sources. After removing the expected number of false positives inherent to the method, the estimated percentages are 1.0% and 1.4% of the parent sample for the long-term and short-term respectively. We compare our candidates with AGN selected in the X-ray and radio bands, and AGN candidates selected by their IR emission. Approximately, 50% of the MIPS 24 m variable sources would be identified as AGN with these other methods. Therefore, MIPS 24 m variability is a new method to identify AGN candidates, possibly dust obscured and low luminosity AGN, that might be missed by other methods. However, the contribution of the MIPS 24 m variable identified AGN to the general AGN population is small ( 13%) in GOODS-South.
keywords:
galaxies:active-infrared:galaxies1 Introduction
Supermassive black holes (SMBH) () are believed to exist in the center of all galaxies containing a significant bulge component (, 1995). Furthermore, the bulge properties, such as stellar mass and velocity dispersion, are correlated with the black hole mass (1998; 2003; 2004). From these relations one may deduce that the bulges of the galaxies and the supermassive black holes evolve together, probably mutually regulating each other, or at least, sharing formation and growing mechanisms (see 2012 for a review).
In order to study the connection between galaxy and SMBH formation, we must study those galaxies where the SMBH is growing. This phenomenon is revealed in a variety of ways and it is generally referred to as active galactic nucleus or AGN. There are different methods to identify AGN. Conventionally, the most direct and used one has been optical spectroscopy (Baldwin, Phillips & Terlevich 1981; 1987). AGN can be identified through the presence of broad lines (FWHM 1000 km s-1, Type 1 AGN) or by narrow lines (FWHM 1000 km s-1) and line ratios in diagnostic diagrams such as [OIII]/H vs [NII]/H (Type 2 AGN). Unfortunately, spectroscopy of a large number of objects is very expensive in terms of observing time, especially for faint sources in cosmological fields. Furthermore, AGN lines can be obscured and/or swamped by emission from the host galaxy (Moran, Filippenko & Chornock 2002).
AGN in cosmological fields are routinely identified by their X-ray emission (2003; 2005), mid-infrared (IR) emission (2004; 2005; 2006; 2012; 2012, 2012, 2013; 2013), excess radio emission (2005, 2013), and combinations of different emissions (e.g., , 2005). All these methods present their own biases. For example, only about 10% of the optically selected QSO are detected as radio sources (1980), and in general there is little overlap between radio and IR/X-ray selected AGN (, 2009). X-ray surveys may miss the most obscured AGN needed to fit the cosmic X-ray background (, 2007). The IR methods, on the other hand, are only complete for the most luminous AGN (e.g., 2012), but they are likely to select obscured AGN not detected in X-rays (2013).
Variability can also be used to select AGN. Practically all AGN vary on time-scales from hours to millions of years (Ulrich, Maraschi & Urry 1997; 2014). Any variability detected in galaxies on human time-scales must originate in the nuclear region, because the typical timescale for star formation variability is 100 Myr (2014). In particular low-luminosity AGN are expected to show stronger variability than the luminous ones (1994). Therefore, variability is likely to be an effective method to select low-luminosity AGN. Although the mechanisms that produce variability are not well understood, the main explanations involve disk instabilities (2006) or changes in the amount of accreting material (2006).
All these methods of AGN selection are complementary and each one can detect sources other methods miss. It is therefore important to study the same region of the sky with different methods of AGN selection.
In the last decade a number of studies have identified AGN in the Great Observatory Origins Deep Survey (GOODS; 2004) fields. The GOODS fields are two fields of 150 arcmin2 centered around of the Hubble Deep Field North (HDFN; 1996) and the Chandra Deep Field South (CDFS; 2001). The observations in the GOODS fields are amongst the deepest at all wavelengths, from X-rays to radio. In particular, these fields have observations from Spitzer, Hubble Space Telescope (HST), Chandra, Herschel, XMM-Newton and many ground-based facilities.
There are a number of variability studies in the GOODS fields, most of them using optical data. The first one was made by Sarajedini, Gilliland & Kasm (2003) using V-band data ( nm) from HST in two epochs separated by five years. They found nuclear variability evidence in 16 of 217 galaxies (7% of the sample) with magnitudes down to 27.5. (2006) conducted a similar study using the HST i-band ( nm) data from the Hubble Ultra Deep Field (HUDF; 2006). They determined that 1% of the sources (45 sources) presented significant variability. (2007) conducted a study of five epoch V-band data in the GOODS South field. They selected a sample of 22 mid-IR power-law sources (using the criteria of , 2006) and 102 X-ray sources and found that 26% of the sample were variable in the optical. (2008) used ground-based data, also in the V-band and obtained 132 variable AGN candidates (2.6% of the sample). Villforth, Koekemoer & Grogin (2010) selected all the objects in the z-band ( nm) catalog in the GOODS fields in five epochs. They found 139 variable AGN candidates (1.3% of the sample) in the North and South fields. (2011) identified 85 variable galaxies (2% of the sample) in the North and South fields using five epochs V-band images from the Hubble Space Telescope Advanced Camera for Surveys.
X-ray variability of low luminosity X-ray sources has also been used to identify additional AGN in the CDFS. (2004) studied 346 sources and found that 45% of the sources with more than 100 counts presented X-ray variability. (2012) found that 185 of 369 AGN and 20 of 92 galaxies (i.e., low-luminosity AGN with ) presented X-ray variability.
(2013) studied radio variability in the Extended-CDFS. They found that 1.2% of the point sources presented radio variability associated with the central regions of AGN or star-forming galaxies.
The aim of this paper is to identify AGN through mid-IR variability in the GOODS-South field using 24 m observations taken with the Multiband Imaging Photometer for Spitzer (MIPS, , 2004) on board the Spitzer Space Telescope (2004). The near and mid-IR nuclear emission of AGN, once the stellar component is subtracted, is believed to be due to hot and warm dust (K) in the dusty torus of the AGN, according to the Unified Model (, 1993). In this context, variability in the accretion disk emission would cause delayed variability in the near and mid-IR as the hot and warm dust, respectively, in the torus react to this change (see 2011 and references therein).
Our choice of using mid-IR variability allows a novel way to select low luminosity and possibly obscured AGN that might be otherwise missed by other techniques. Apart from this work, there is only other IR variability study in the Boötes cosmological field using IRAC data (2010). They used the most sensitive IRAC bands at 3.6 and 4.5 m and found that 1.1% of the sources satisfied their variability criteria.
The paper is organized as follows: in Section 2 we present the MIR data used to detect variable sources. In Section 3 we explain the procedures followed to get photometry of the data. In Section 4 we present the statistical method used to select the variable candidates. In Section 5 we present the general properties of these candidates, as well as their IRAC properties. In Section 6 we present the candidates in the Extended Chandra Deep Field South (E-CDFS), their properties, and a cross-correlation with other AGN catalogs in the same field. The discussion and conclusions are given in Section 7. Throughout this work we use a cosmology with H km s-1 Mpc-1, and .

| Epoch | PI | Program | Program name | Initial date | Final date | AORs1 | BCDs2 | 3 | Area |
|---|---|---|---|---|---|---|---|---|---|
| ID | (s) | (arcmin2) | |||||||
| 1 | Rieke, G. | 81 | The Deep Infrared Sky | 29-01-2004 | 01-02-2004 | 12 | 7660 | 10 | 2653 |
| 2 | Dickinson, M. | 194 | Great Observatories Origins Deep Survey (GOODS), continued | 19-08-2004 | 23-08-2004 | 24 | 14974 | 30 | 255 |
| 3 | Rieke, G. | 81 | The Deep Infrared Sky | 26-08-2005 | 28-08-2005 | 12 | 6660 | 10 | 1706 |
| 4 | Frayer, D. T. | 20147 | Ultra-Deep MIPS-70 Imaging of GOODS CDF-S | 24-02-2006 | 26-02-2006 | 12 | 19968 | 10 | 226 |
| 5 | Dickinson, M. | 30948 | A deep-Wide Far-Infrared Survey of Cosmological Star Formation and AGN Activity | 01-09-2006 | 05-09-2006 | 24 | 39633 | 10 | 756 |
| 6 | Dickinson, M. | 30948 | A deep-Wide Far-Infrared Survey of Cosmological Star Formation and AGN Activity | 22-01-2007 | 23-01-2007 | 8 | 6216 | 10 | 2293 |
| 7 | Dickinson, M. | 30948 | A deep-Wide Far-Infrared Survey of Cosmological Star Formation and AGN Activity | 01-03-2007 | 07-03-2007 | 32 | 44274 | 10 | 2265 |
1 AOR: Astronomical Observation Request.
2 BCD: Basic Calibrated Data.
3 : Exposure time per BCD.
2 The data
We compiled all the data taken around the GOODS South field with the MIPS instrument at 24 m by querying the Spitzer Heritage Archive111http://sha.ipac.caltech.edu/applicatio ns/Spitzer/SHA. This field was observed by Spitzer during several campaigns from January 2004 to March 2007. We focused our study on a region around RA= (J2000) and DEC= (J2000). These data correspond to different observing proposals from different PI, including the Guaranteed Time Observations program (GTO, PI: G. Rieke) and the GOODS program (PI: M. Dickinson). We refer the reader to Table 1 for a detailed description of all the MIPS 24 m observing programs in GOODS-South. We have obtained 151 AORs (Astronomical Observation Request) but only downloaded 127 because the others were from the SWIRE (Spitzer Wide-area InfraRed Extragalactic) survey and were not sufficiently deep. For each epoch and subepoch, we built a mosaic with the AORs using the software MOPEX222http://ssc.spitzer.caltech.edu provided by the Spitzer Science Center (SSC).
We divided these data sets into 7 different epochs in order to detect variable sources (see Figure 1). Epochs 5 and 7, which have the longest durations, can also be divided into subepochs to detect short term variability in time scales of days and even of hours. In Table 1 we list the main information about the epochs. Each epoch has both a different field of view (FoV) and a different depth. As can be seen from Table 1, Epoch 2 has the longest exposure time per Basic Calibrated Data (BCD), resulting in the deepest MIPS 24 m exposure in our data sets (see below).
For this study we decided to exclude Epochs 2, 4, and 5 because their FoV is small when compared to the other epochs (see Table 1). Figure 2 shows the FoV of Epochs 1, 3, 6, and 7 and how they overlap. The common area for the four epochs is 1360 arcmin2. They probe time scales of months up to three years, and henceforth are used to study the long-term variability covering a period of over three years. We also subdivided Epoch 7 in three epochs, namely Epochs 7a, 7b, and 7c to study the short-term variability. The short-term variability epochs have a common area of 1960 arcmin2 and probe time scales of days, covering a period of 7 days.

3 MIPS m photometry
To study the temporal variability of MIPS m sources detected in the common regions we built a source catalog for each epoch and subepoch. We used SExtractor (Source-Extractor, 1996) to detect sources and the Image Reduction and Analysis Facility (IRAF)333IRAF is distributed by the National Optical Astronomy Observatory, which is operated by the Association of Universities for Research in Astronomy (AURA), Ibc., under cooperative agreement with the National Science Foundation. to perform the photometry following the procedure explained in Pérez González et al. (2005, 2008). Sources were detected in five passes to recover the faintest ones, possibly hidden (i.e., more difficult to detect) by brighter sources. All the measurements were made by PSF fitting. To obtain the photometry, we used a circular aperture of radius 12 and then applied an aperture correction of 17% as in (2005) to obtain the total flux. We calculated the uncertainties in the flux taking into account the correlation of the pixel-to-pixel noise introduced by the reduction method and mosaic construction, as described in appendix A.3 of (2008). We obtained a 24 m source catalog for each epoch. In this work we restrict the analysis to sources above the 5 detection limit in the shallowest data in the mosaics. This corresponds to MIPS m fluxes of Jy and Jy for the long-term and the short-term epochs, respectively. We also discarded sources with neighbours at distances of less than 10 to minimize crowding effects in the photometry that could affect the flux measurements and produce false variability positives. In Table 2 we list for each epoch the total number of detections, the number of detections, the number of detections without neighbours, the area covered, and the density of objects. The positional accuracy of our catalogs is better than 0.7.
| Epoch | Area | Density | |||
| F>5 | F>5 without neighbours | (arcmin2) | (objects/) | ||
| Long-term variability (5=80 Jy) | |||||
| 1 | 19742 | 11467 | 8017 | 2653 | 3.02 |
| 3 | 11843 | 7116 | 5041 | 1706 | 2.95 |
| 6 | 15707 | 9697 | 6870 | 2293 | 3.00 |
| 7 | 18406 | 9320 | 6605 | 2265 | 2.92 |
| Short-term variability (5=100 Jy) | |||||
| 7a | 14453 | 7607 | 5715 | 2027 | 2.82 |
| 7b | 15629 | 7348 | 5551 | 2107 | 2.63 |
| 7c | 14659 | 7673 | 5789 | 2046 | 2.83 |
To identify the common sources in all the epochs we cross-matched the catalogs using a 2 radius, imposing additionally that the criterion was fulfilled in each pair of epochs. Due to this criterion, we missed 316 sources cross-matching Epochs 1, 3, 6, and 7 and 282 sources cross-matching Epochs 7a, 7b, and 7c. For the long-term variability (Epochs 1, 3, 6, and 7) there are 2277 sources (1.67 objects arcmin-2) in common with 24 m flux >80 Jy (5 detection) without neighbours within 10 and satisfying the criterion. For the short-term variability (Epochs 7a, 7b, and 7c) there are 2452 sources (1.25 objects arcmin-2) in common with 24 m flux >100 Jy (5 detection) without neighbours within 10 and satisfying the criterion. Our final catalogs contain 2277 MIPS 24 m sources detected in Epochs 1, 3, 6, and 7 and 2452 MIPS 24 sources in Epochs 7a, 7b, and 7c, covering an area of 1360 and 1960 arcmin2, respectively.
4 Selection of MIPS m variable sources
In this section we describe the method used to select the 24 m variable sources. To do so we used a -statistics method to account for the variations of intrinsic flux uncertainties of each epoch (related to differences in depth). This is the case for our study as different epochs have different depths and within a given mosaic there are some variations in depth. The latter effect is most prominent in epoch 7, which is deeper in the center.
This method associates each flux with its error. The -statistics is defined as follows:
| (1) |
where n is the number of epochs, is the flux in a given epoch, is the associated error in the epoch, and is the mean flux.
As errors are essential in this method, we checked them for each epoch. Errors in the parent photometric catalog could be affected by correlation of the noise due to the reduction method. We compared our estimated errors with the uncertainties resulting from the scatter of points with the fluxes estimated in images from different epochs (see Figure A1 and Appendix A). As fluxes in different epochs are measured independently, the scatter must account for the real uncertainties of the measured fluxes. The scatter in this plot is entirely consistent with the photometric errors estimated in Section 3. We refer the reader to Appendix A for more details.
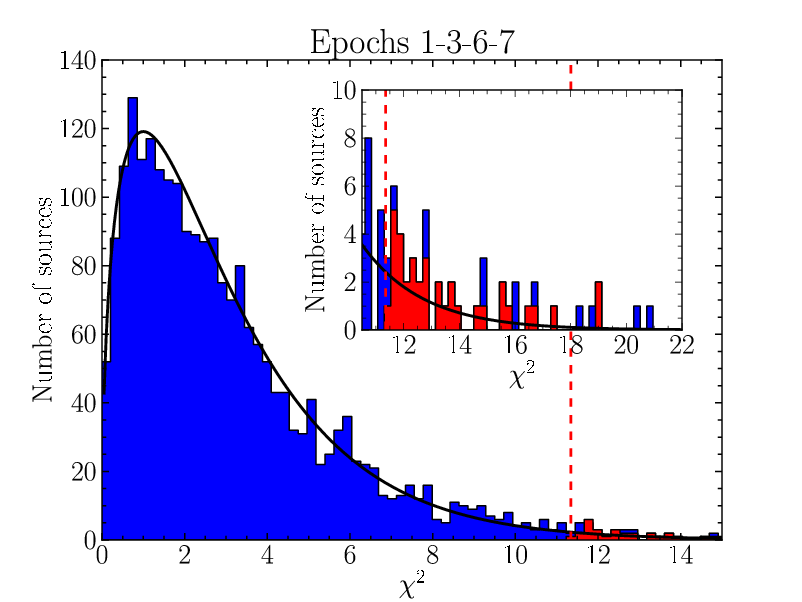
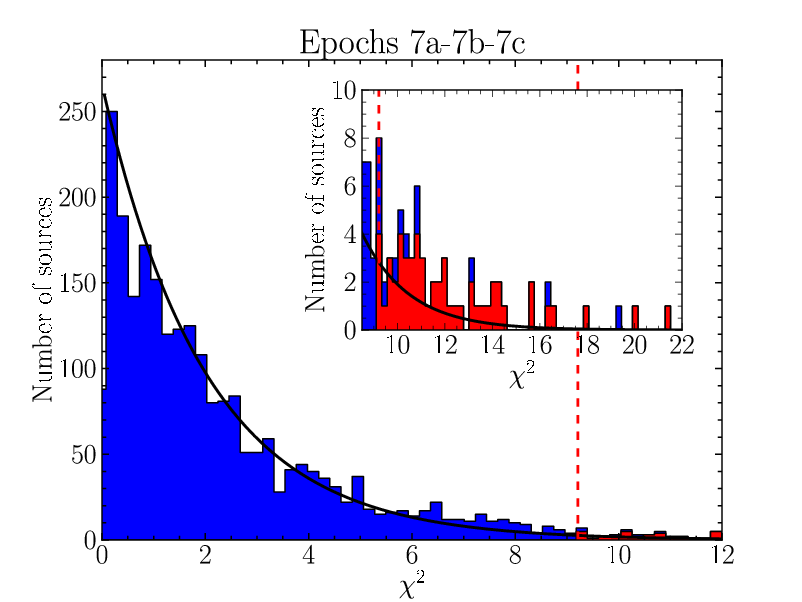
We calculated the value for each source without neighbours. We selected as variable candidates those sources above the 99th percentile of the distribution expected from photometric errors alone. That is, only 1% of non-variable sources satisfy the selection criteria. This value corresponds to for the 4 epochs sample (3 degrees of freedom) and for the 3 epochs one (2 degrees of freedom). In Figure 3 we show the observed distribution (filled histograms), the theoretical distribution (black line), and the threshold (red dashed line) for the four epochs (top panel) and three epochs (bottom panel). As can be seen from these figures, the calculated values of follow well the expected theoretical distribution for gaussian photometric errors, indicating that our estimates of the flux uncertainties are accurate (see Appendix B for more details).
Every object with a value higher than the threshold was visually inspected to remove artefacts. We also discarded objects that fell close to the edge of the mosaic. We also compared the candidates with the supernova (SN) catalog of (2004) and found that none of our candidates was in the SN catalog. The original number of selected variable sources before the removal of artefacts/objects close to the edge of mosaics was 52 and 64 for long-term and short-term variable sources. In the insets of Figure 3 the red histogram shows the distribution for the final candidates. After discarding problematic objects, our final sample contains 39 MIPS m long-term variable sources (0.03 sources arcmin-2) and 55 MIPS m short-term variable sources (0.03 sources arcmin-2). Only two sources are identified as having both, long and short-term variability. The spatial distribution of the MIPS m variable sources in the GOODS-South field is shown in Figure 4.

The cut means that we would expect that 1% of the parent samples of MIPS m sources would be incorrectly identified as variable (i.e., false positives). The expected numbers of false positives are then 23 and 25 sources for long and short-term variable sources. Taking the original number of selected variable sources before the removal into account we expect that the fraction of false positives in our final sample of variable sources would be 44% for long-term and 39% for short-term. We detect many more variable source candidates than expected by random errors, so our selection is statistically meaningful.
The selected MIPS m long-term and short-term variable sources represent 1.7 and 2.2% of the original parent samples, respectively. After removing the expected number of false positives, the estimated percentages are 1.0% and 1.4%. These fractions of variable sources at 24 m are similar to those found in the same cosmological field at other wavelengths, mostly optical and near IR (e.g. 2006; Villforth et al. 2010; 2011; 2010). The higher fraction of short-term variable sources is due to the presence of a deeper region in Subepochs 7a, 7b, and 7c (shown as the area enclosed by the solid line in Figure 4). This means that the photometric errors of sources in this region are smaller and then if variable, they present higher values of than sources in shallower areas.
We note that the presence of intense (obscured) star-formation in the host galaxy would impair the detection of AGN variability at 24 m, so only sources with the highest variability might be detected. We refer the reader to Sections 6.1 and 6.3 for further discussion on this issue.
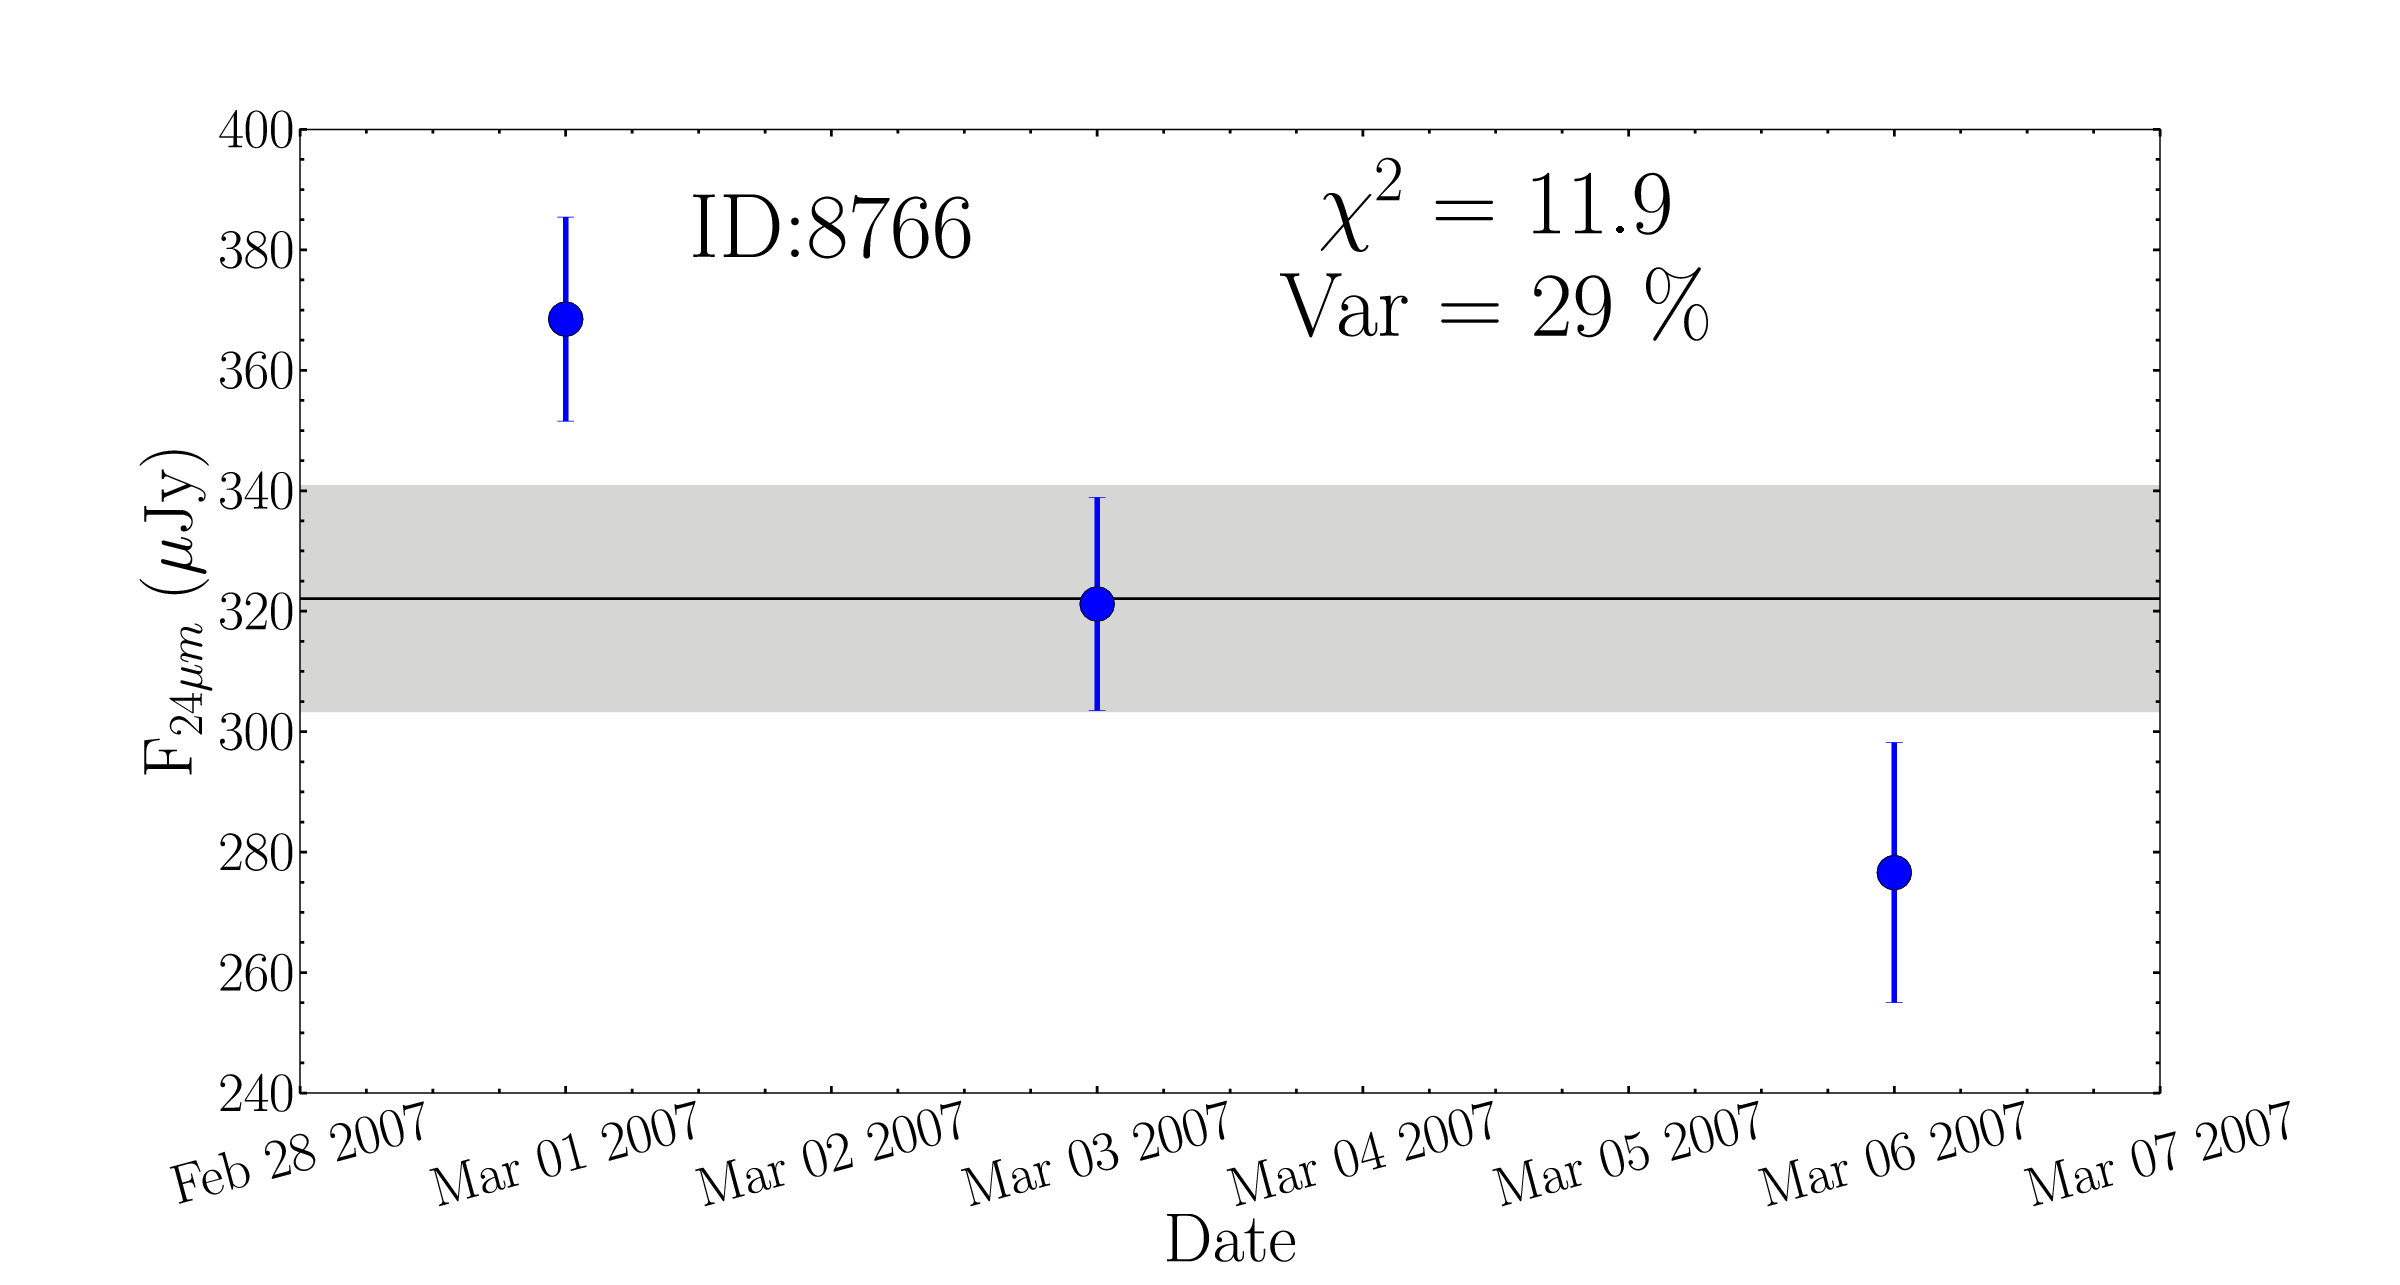
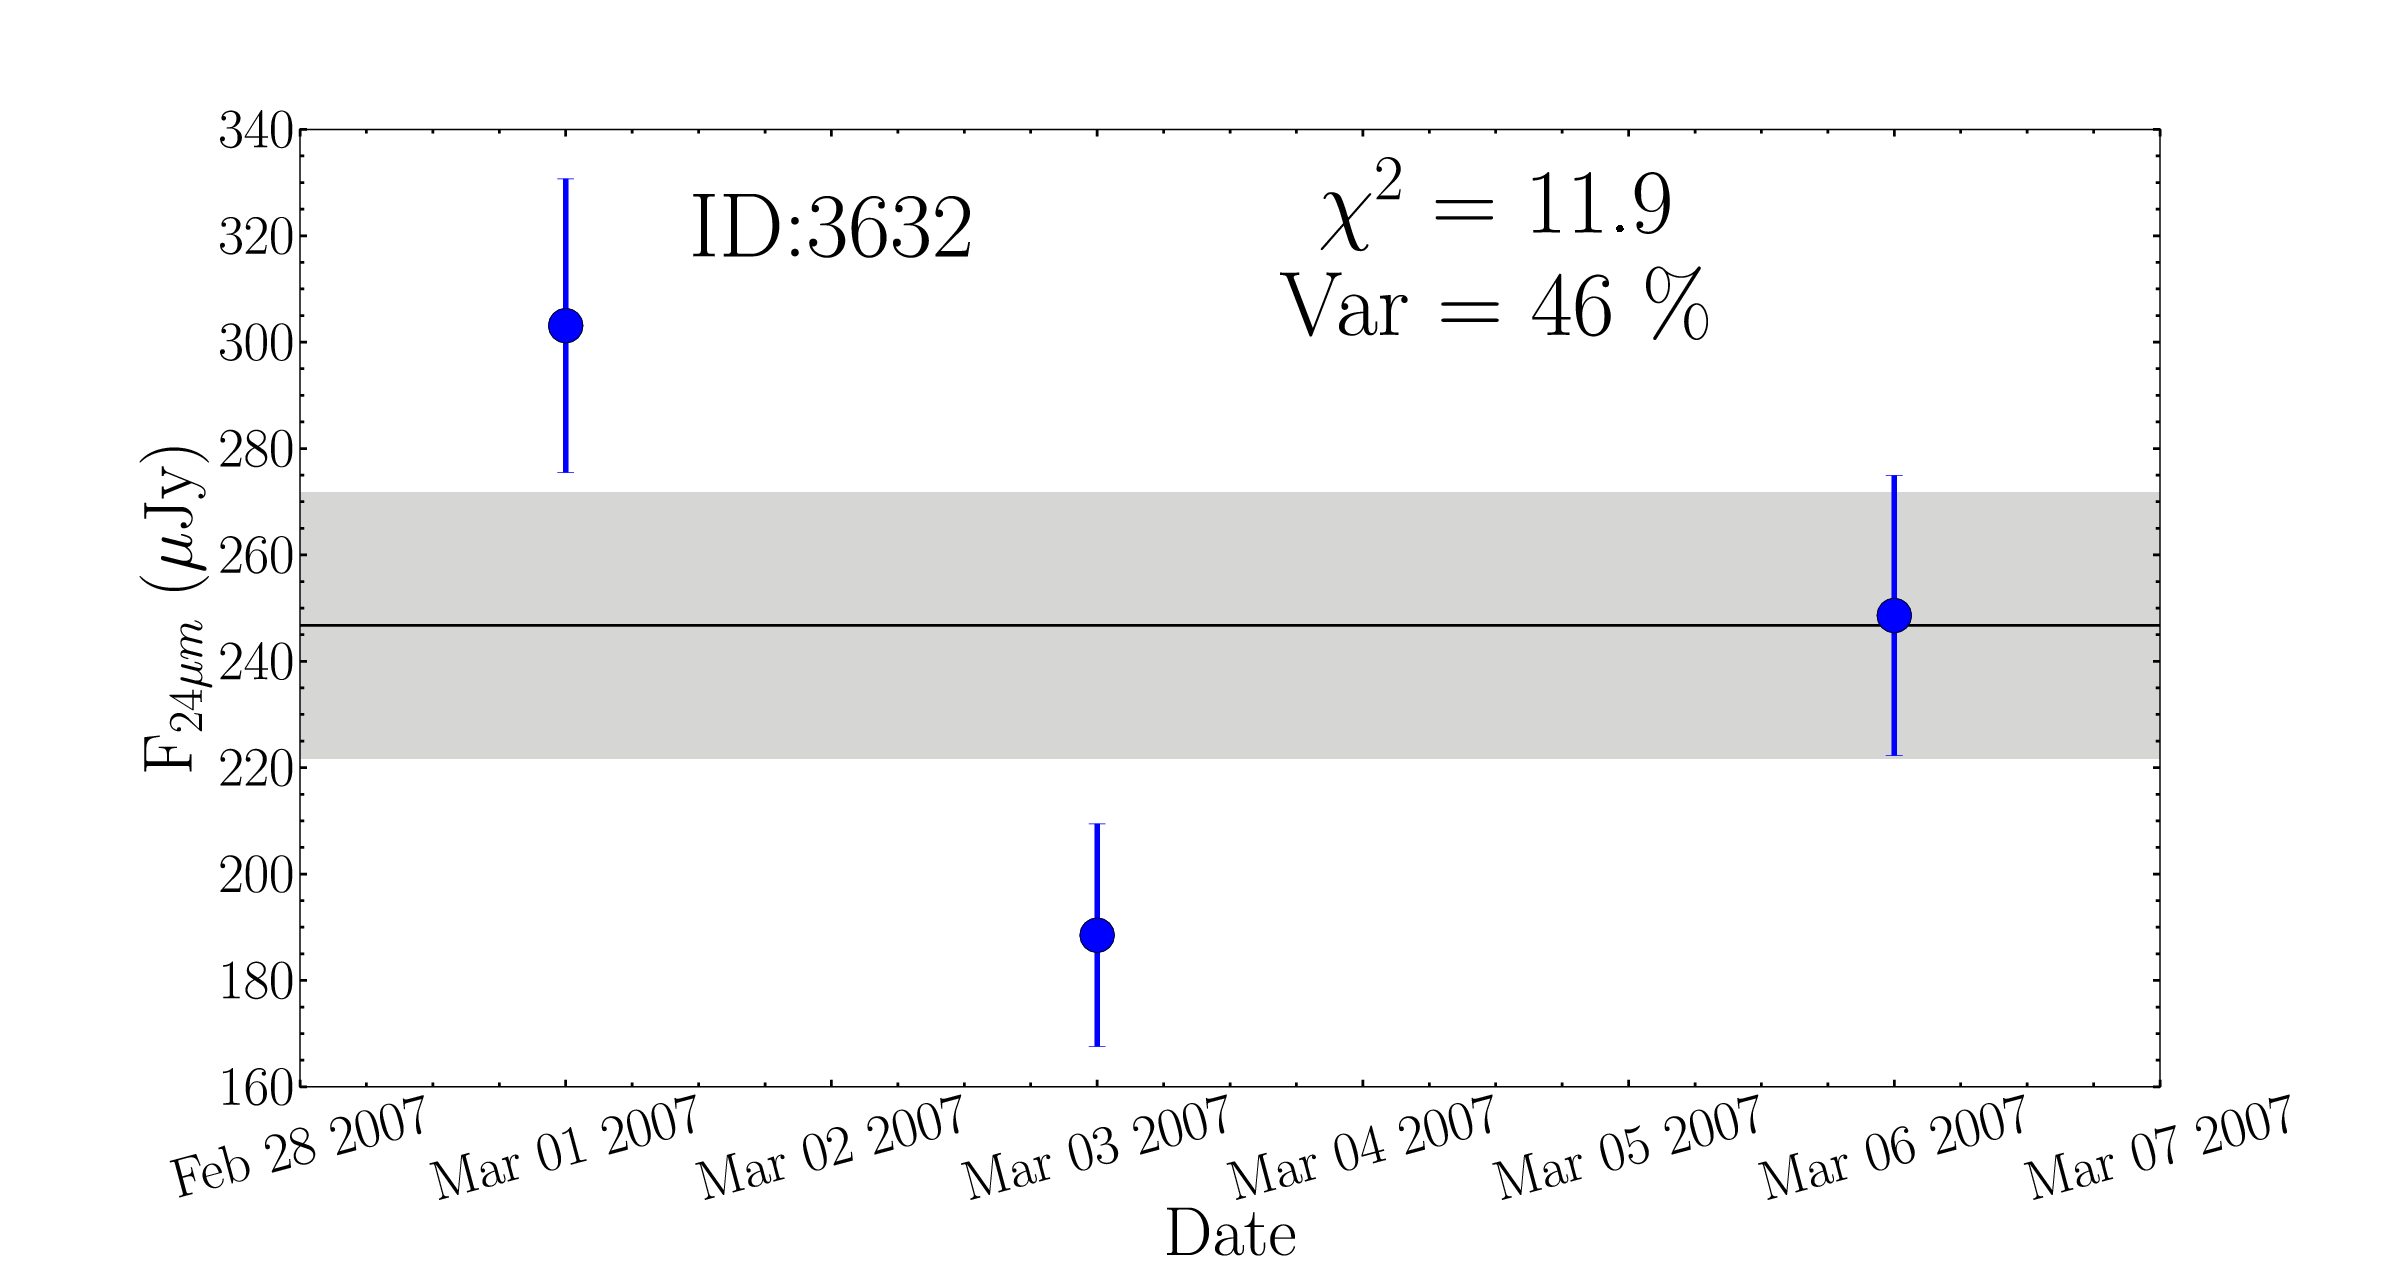
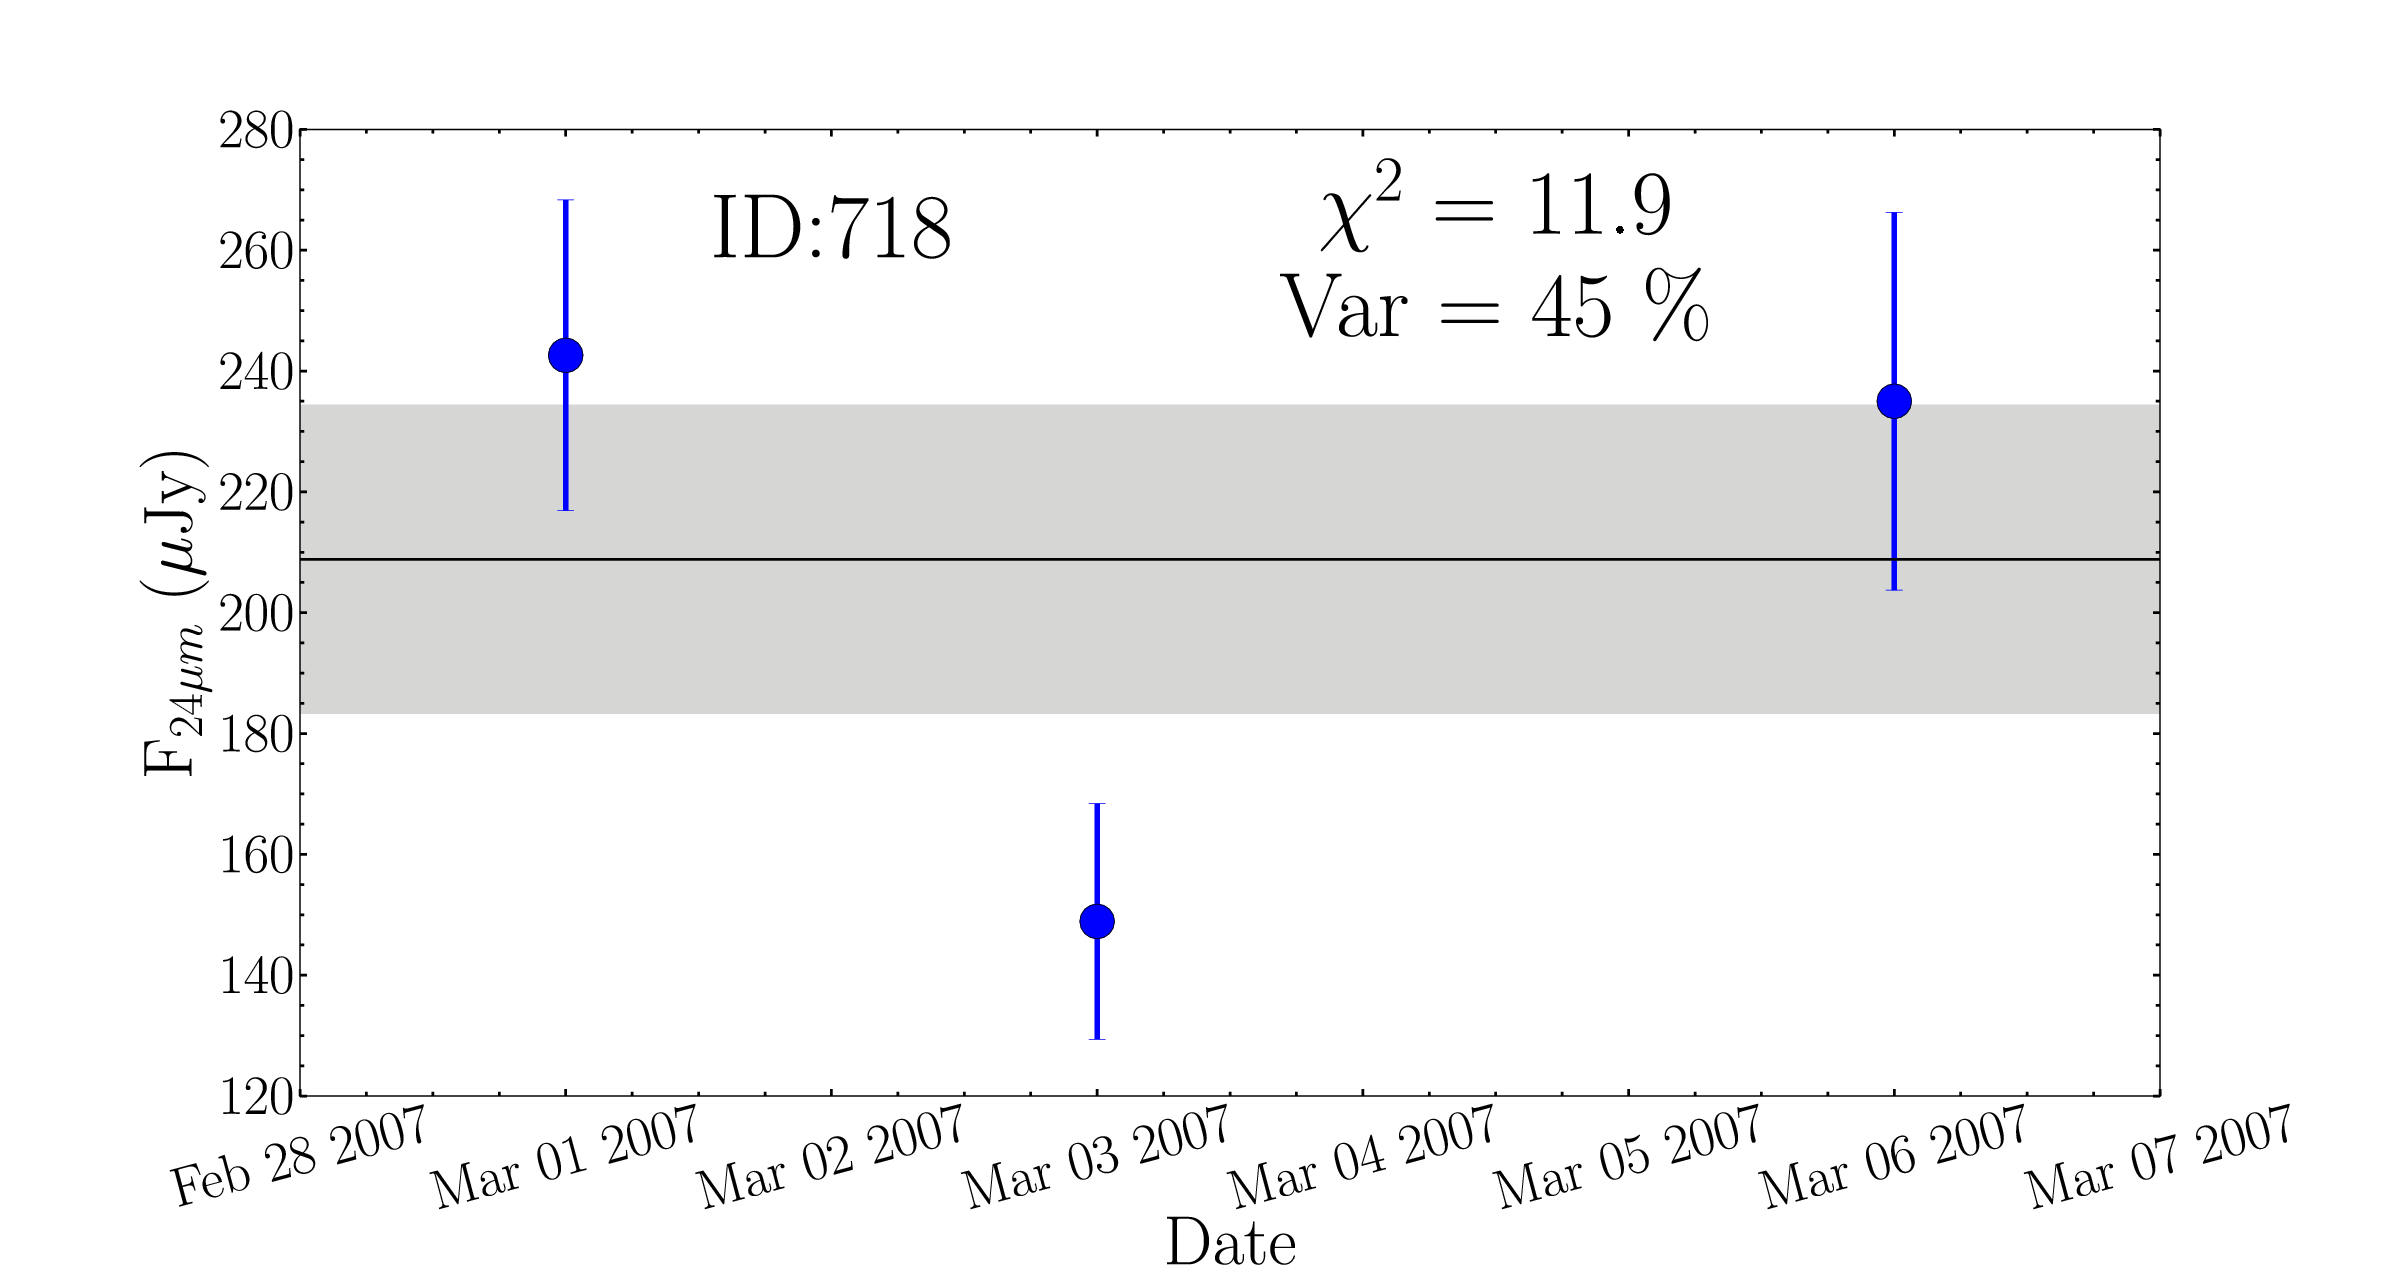
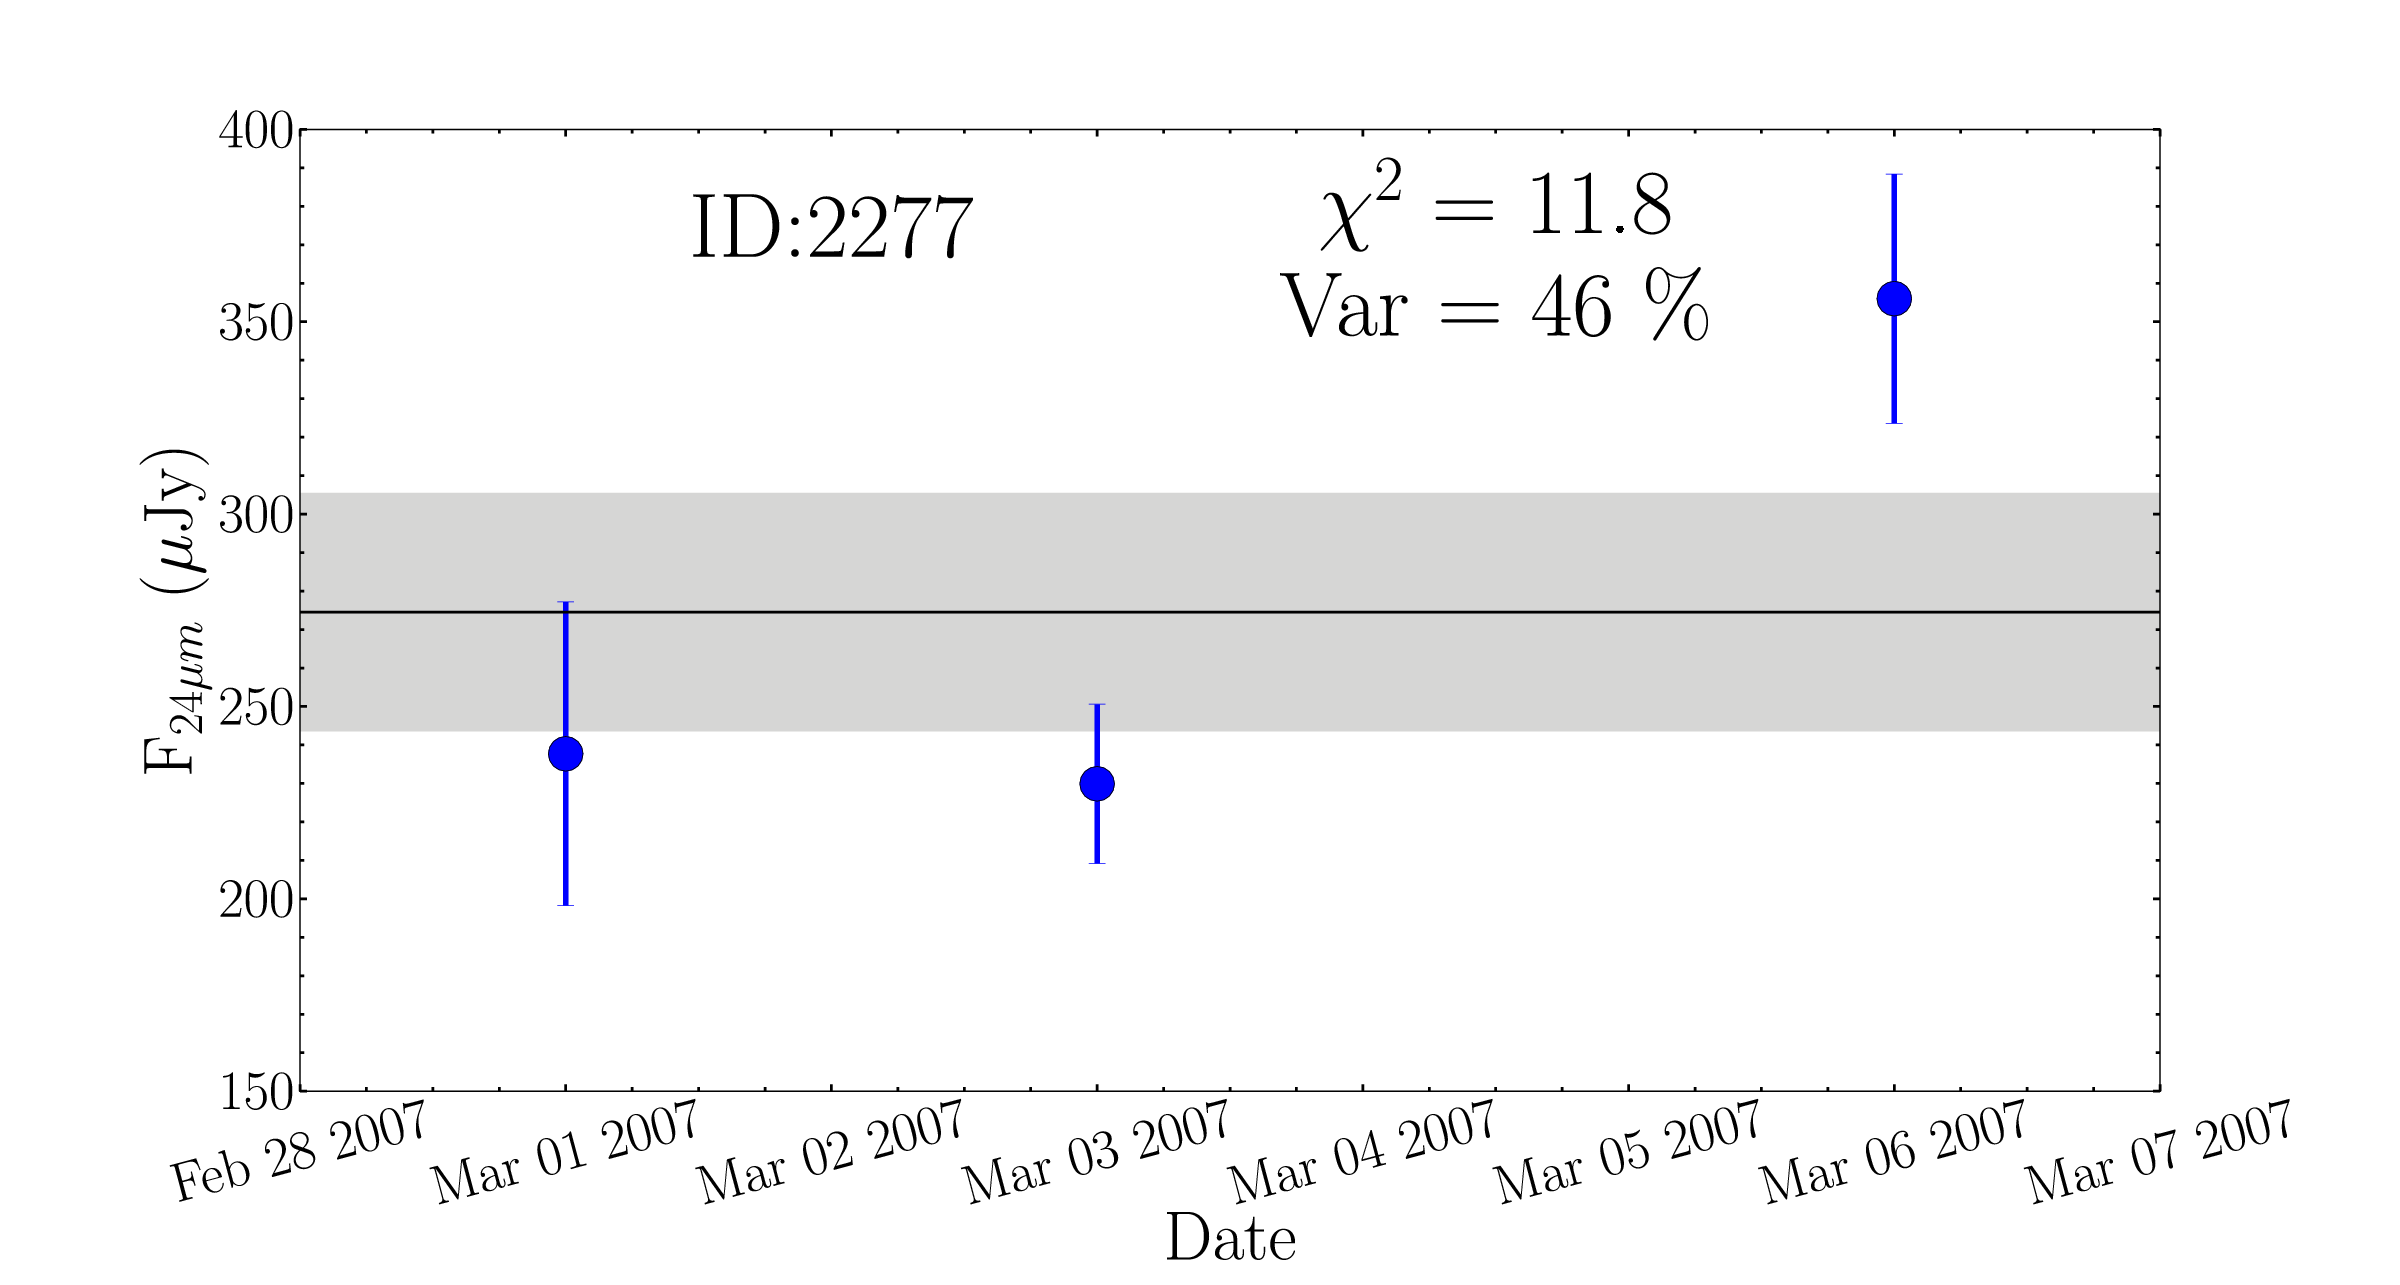
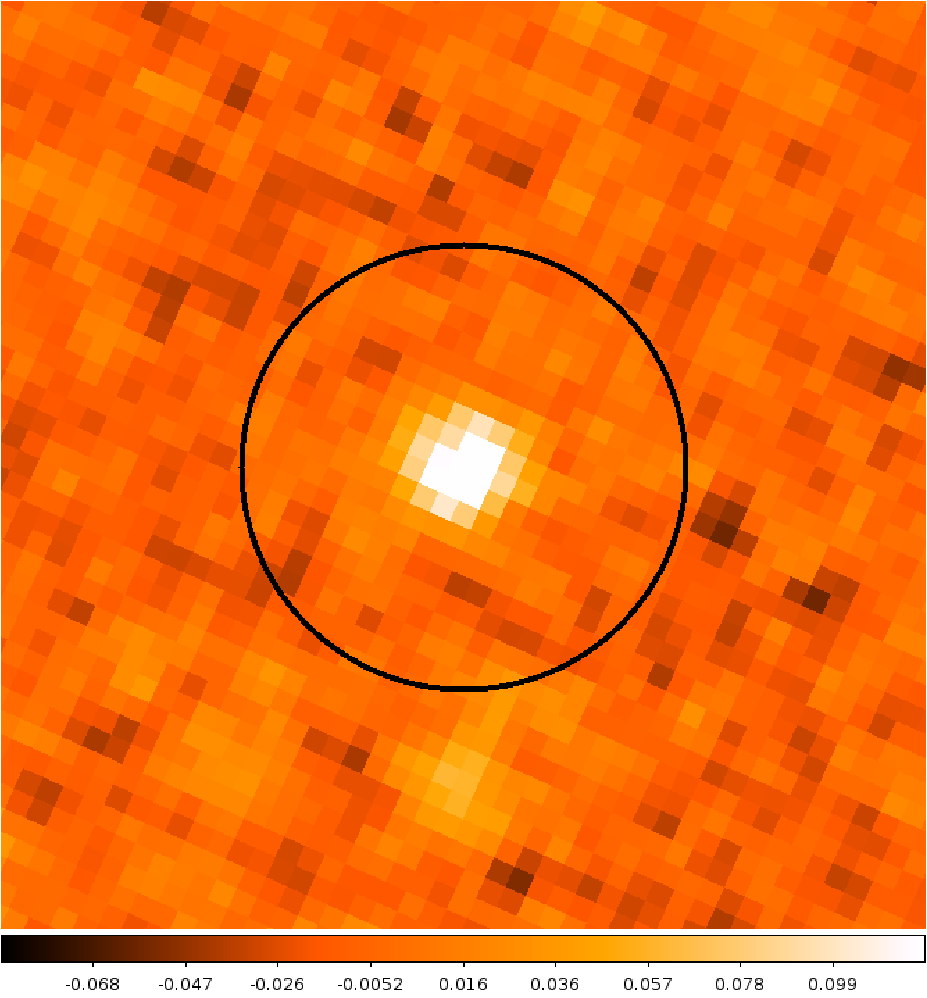
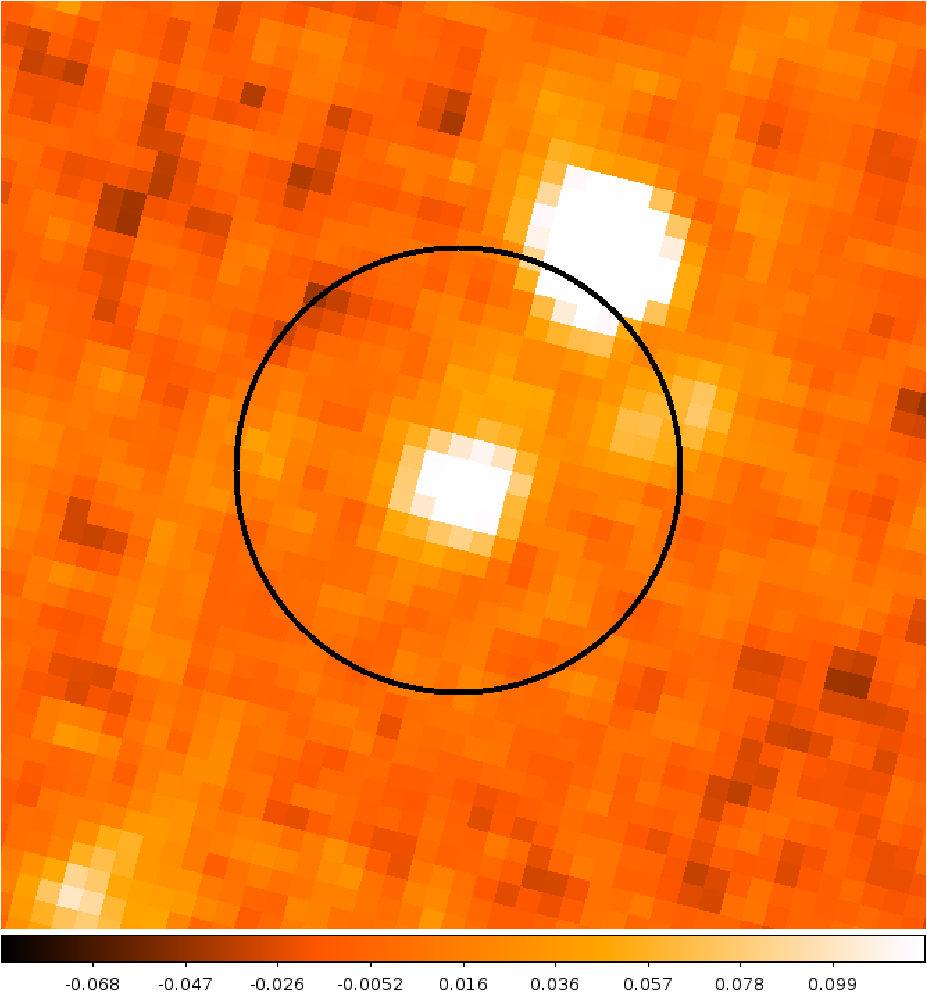
In Appendix C we show an example of the MIPS 24 m images of four variable sources, two long-term and two short-term, in each of the epochs of our study. In Tables D1 and E1 in the Appendices we list the flux and corresponding error at each epoch, median flux, and value, for the long-term and short-term MIPS m variable sources, respectively.
5 Properties of the MIPS m variable sources
In this section we analyze the different properties of the 24 m variable sources, such as their median 24 m fluxes, variability properties, and their IRAC colours.
5.1 MIPS 24 m properties
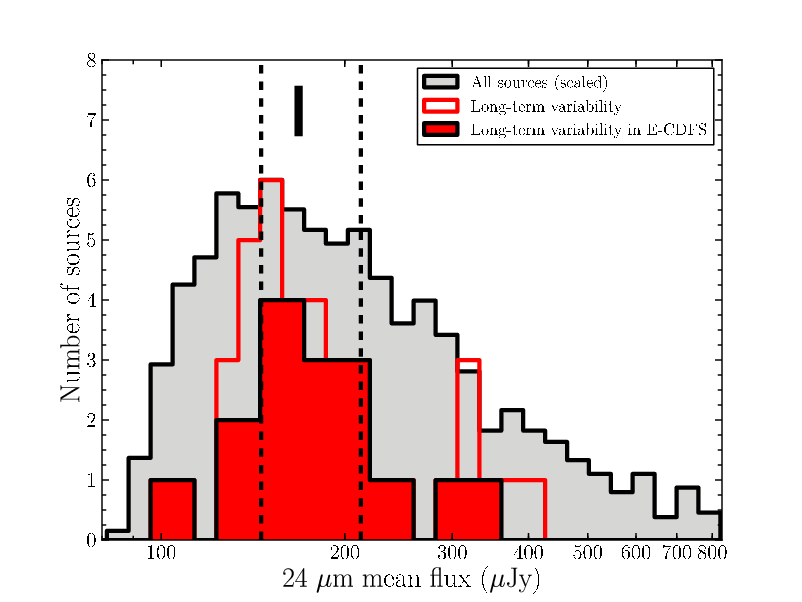
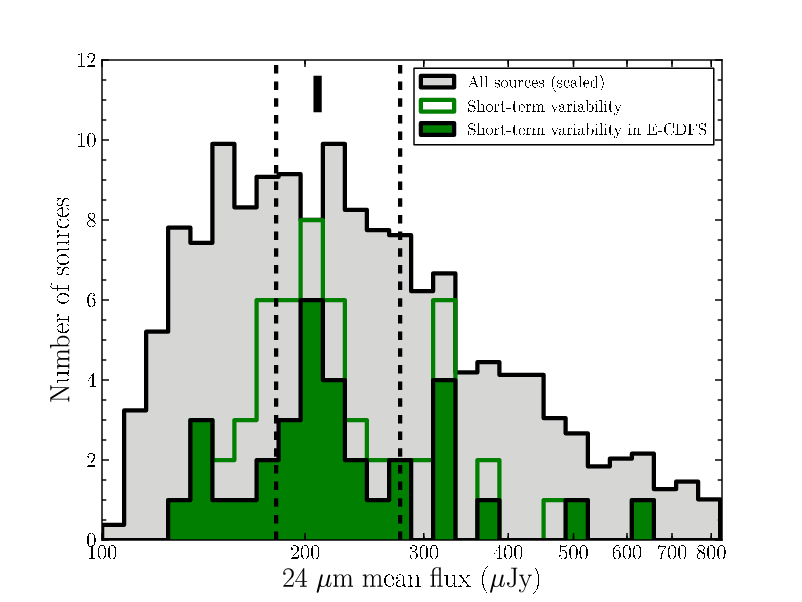
In Figure 5 we show the distribution of the mean flux (over the 3 or 4 different epochs) at 24 m for the long-term variable sources (top panel) and short-term variable sources (bottom panel) compared with the corresponding flux distribution of the parent sample for detections. In both cases, the m fluxes of the variable sources are dominated by sources with mean fluxes below 300 Jy. The median 24 m flux is 168 Jy for the long-term variable sources and 209 Jy for the short-term variable sources (see Table 3). This slight difference in the median values of the 24 m fluxes for long and short-term variability is likely reflecting the different depths (i.e., 5 detection limits) of the epochs rather than different intrinsic properties of the sources (see Section 6).
We cross-correlated our parent MIPS 24 m catalogs with the (2011) deep X-ray catalog of AGN and galaxies using a search radius of 2.5(see Section 6.2). There are 211 X-ray sources that are not stars in (2011) catalog detected in 24 m satisfying our criteria, that is, they have 24 m fluxes over our 5 limit and have no neighbours within 10. Of the 211 sources, 149 are classified as AGN in the (2011) catalog. These X-ray selected AGN in our parent catalogs have a 24 m median flux of 240 Jy. This implies that our selected 24 m variable sources are typically fainter at 24 m than X-ray selected AGN. Since the redshift distributions are similar (see Section 6.1), this may indicate that the 24 m variable sources, if they were AGN, are less luminous, as predicted by (1994).
5.2 Variability Properties
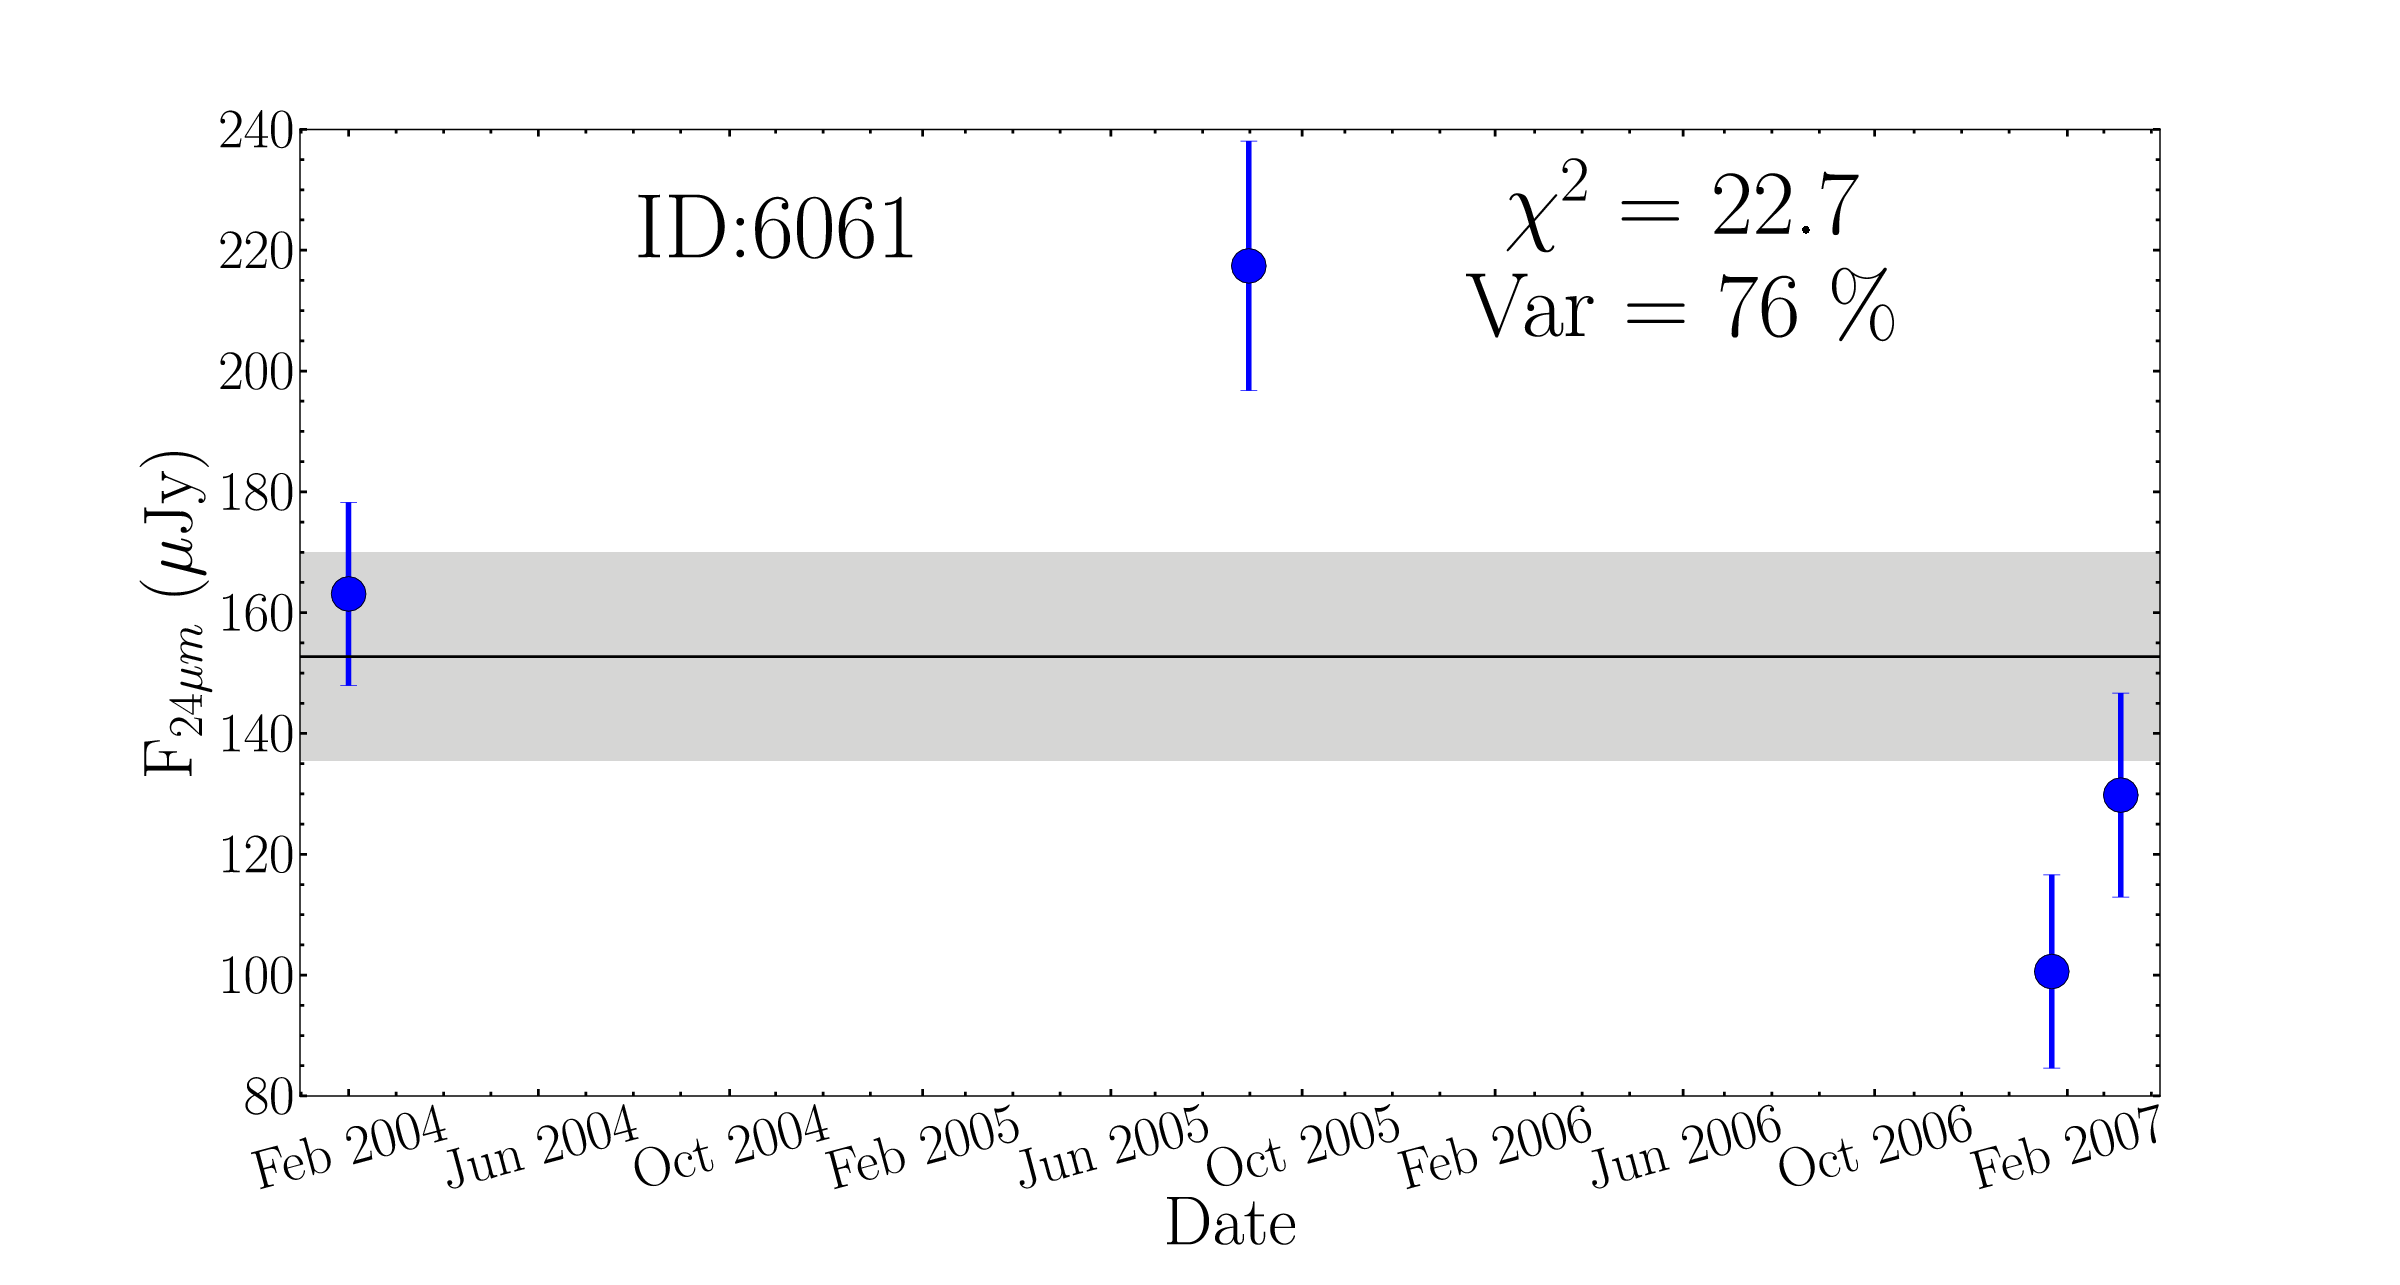
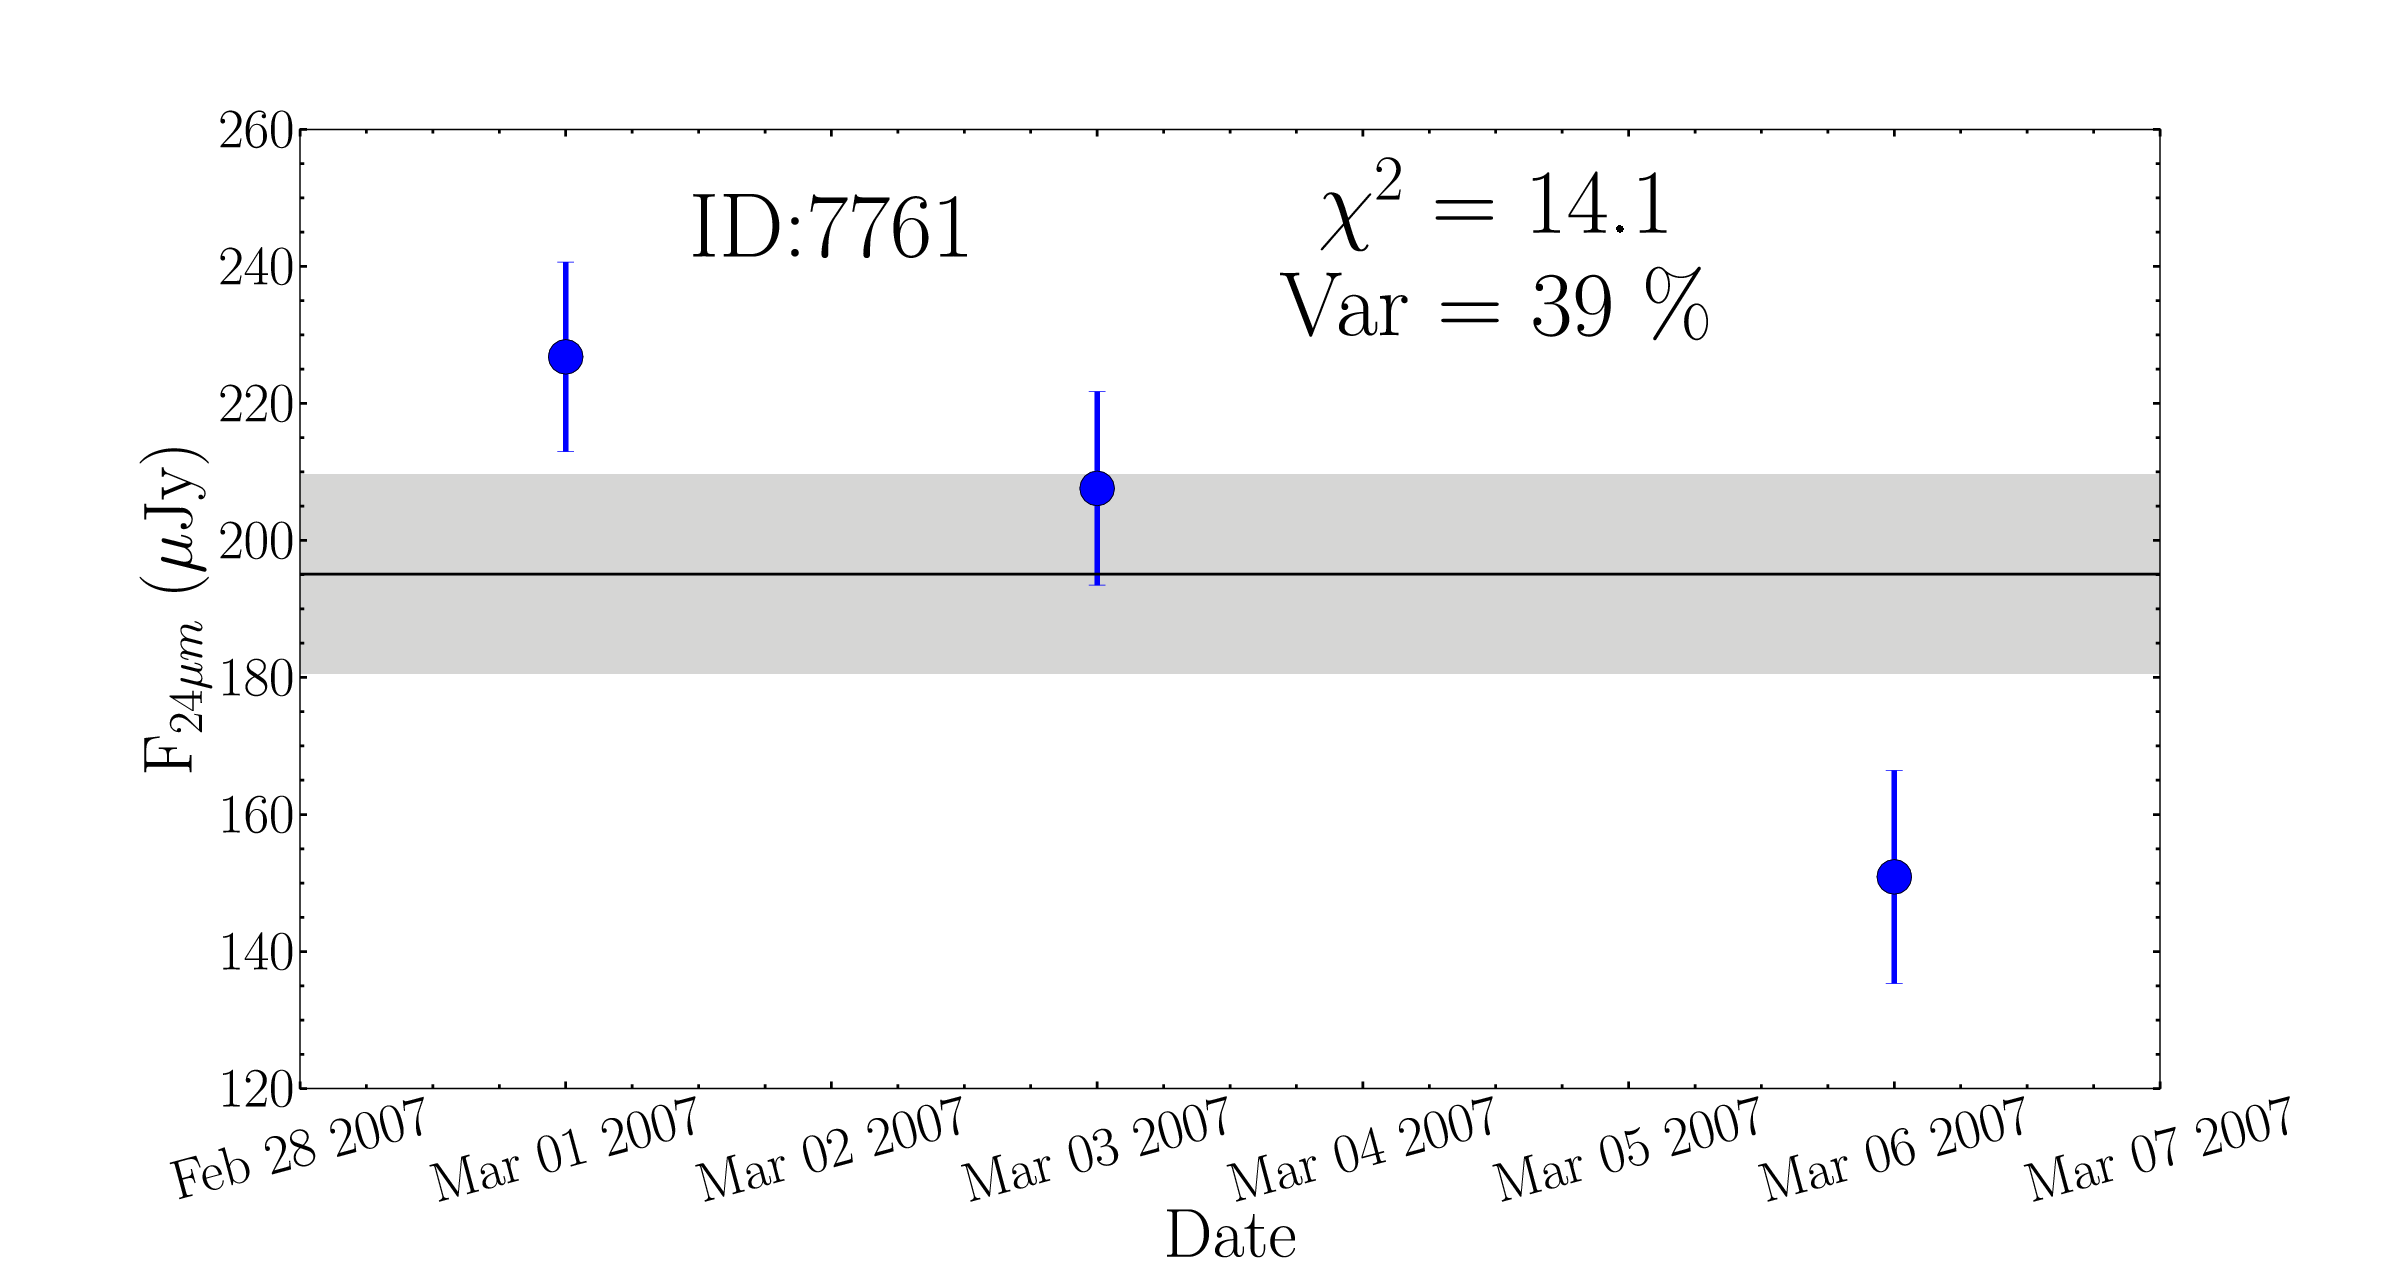
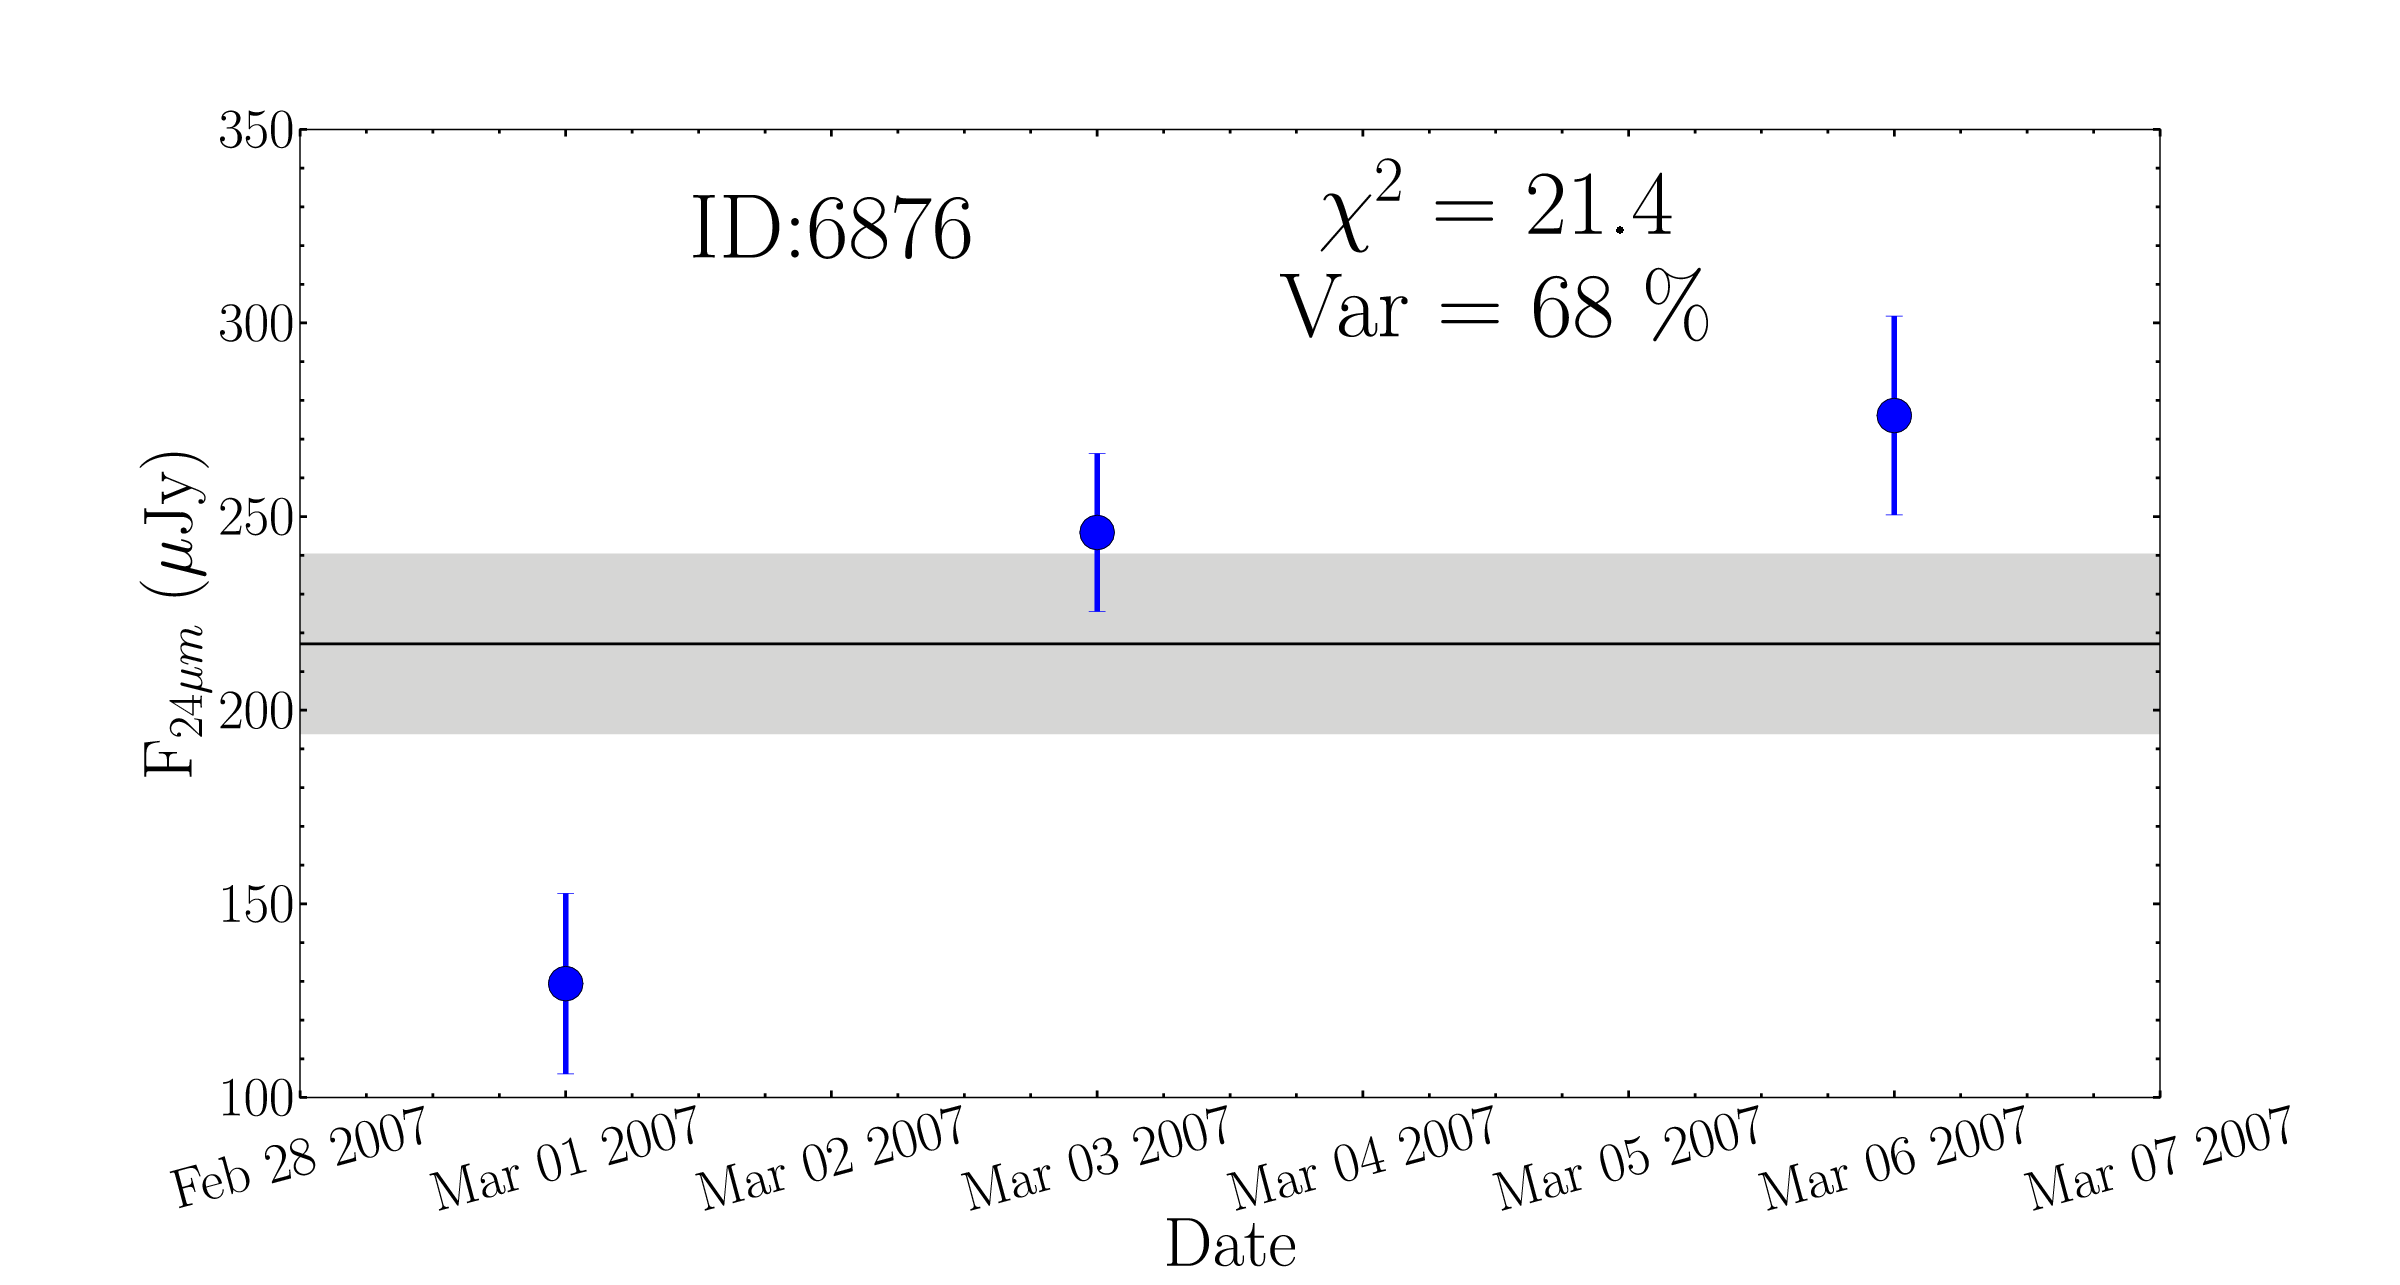
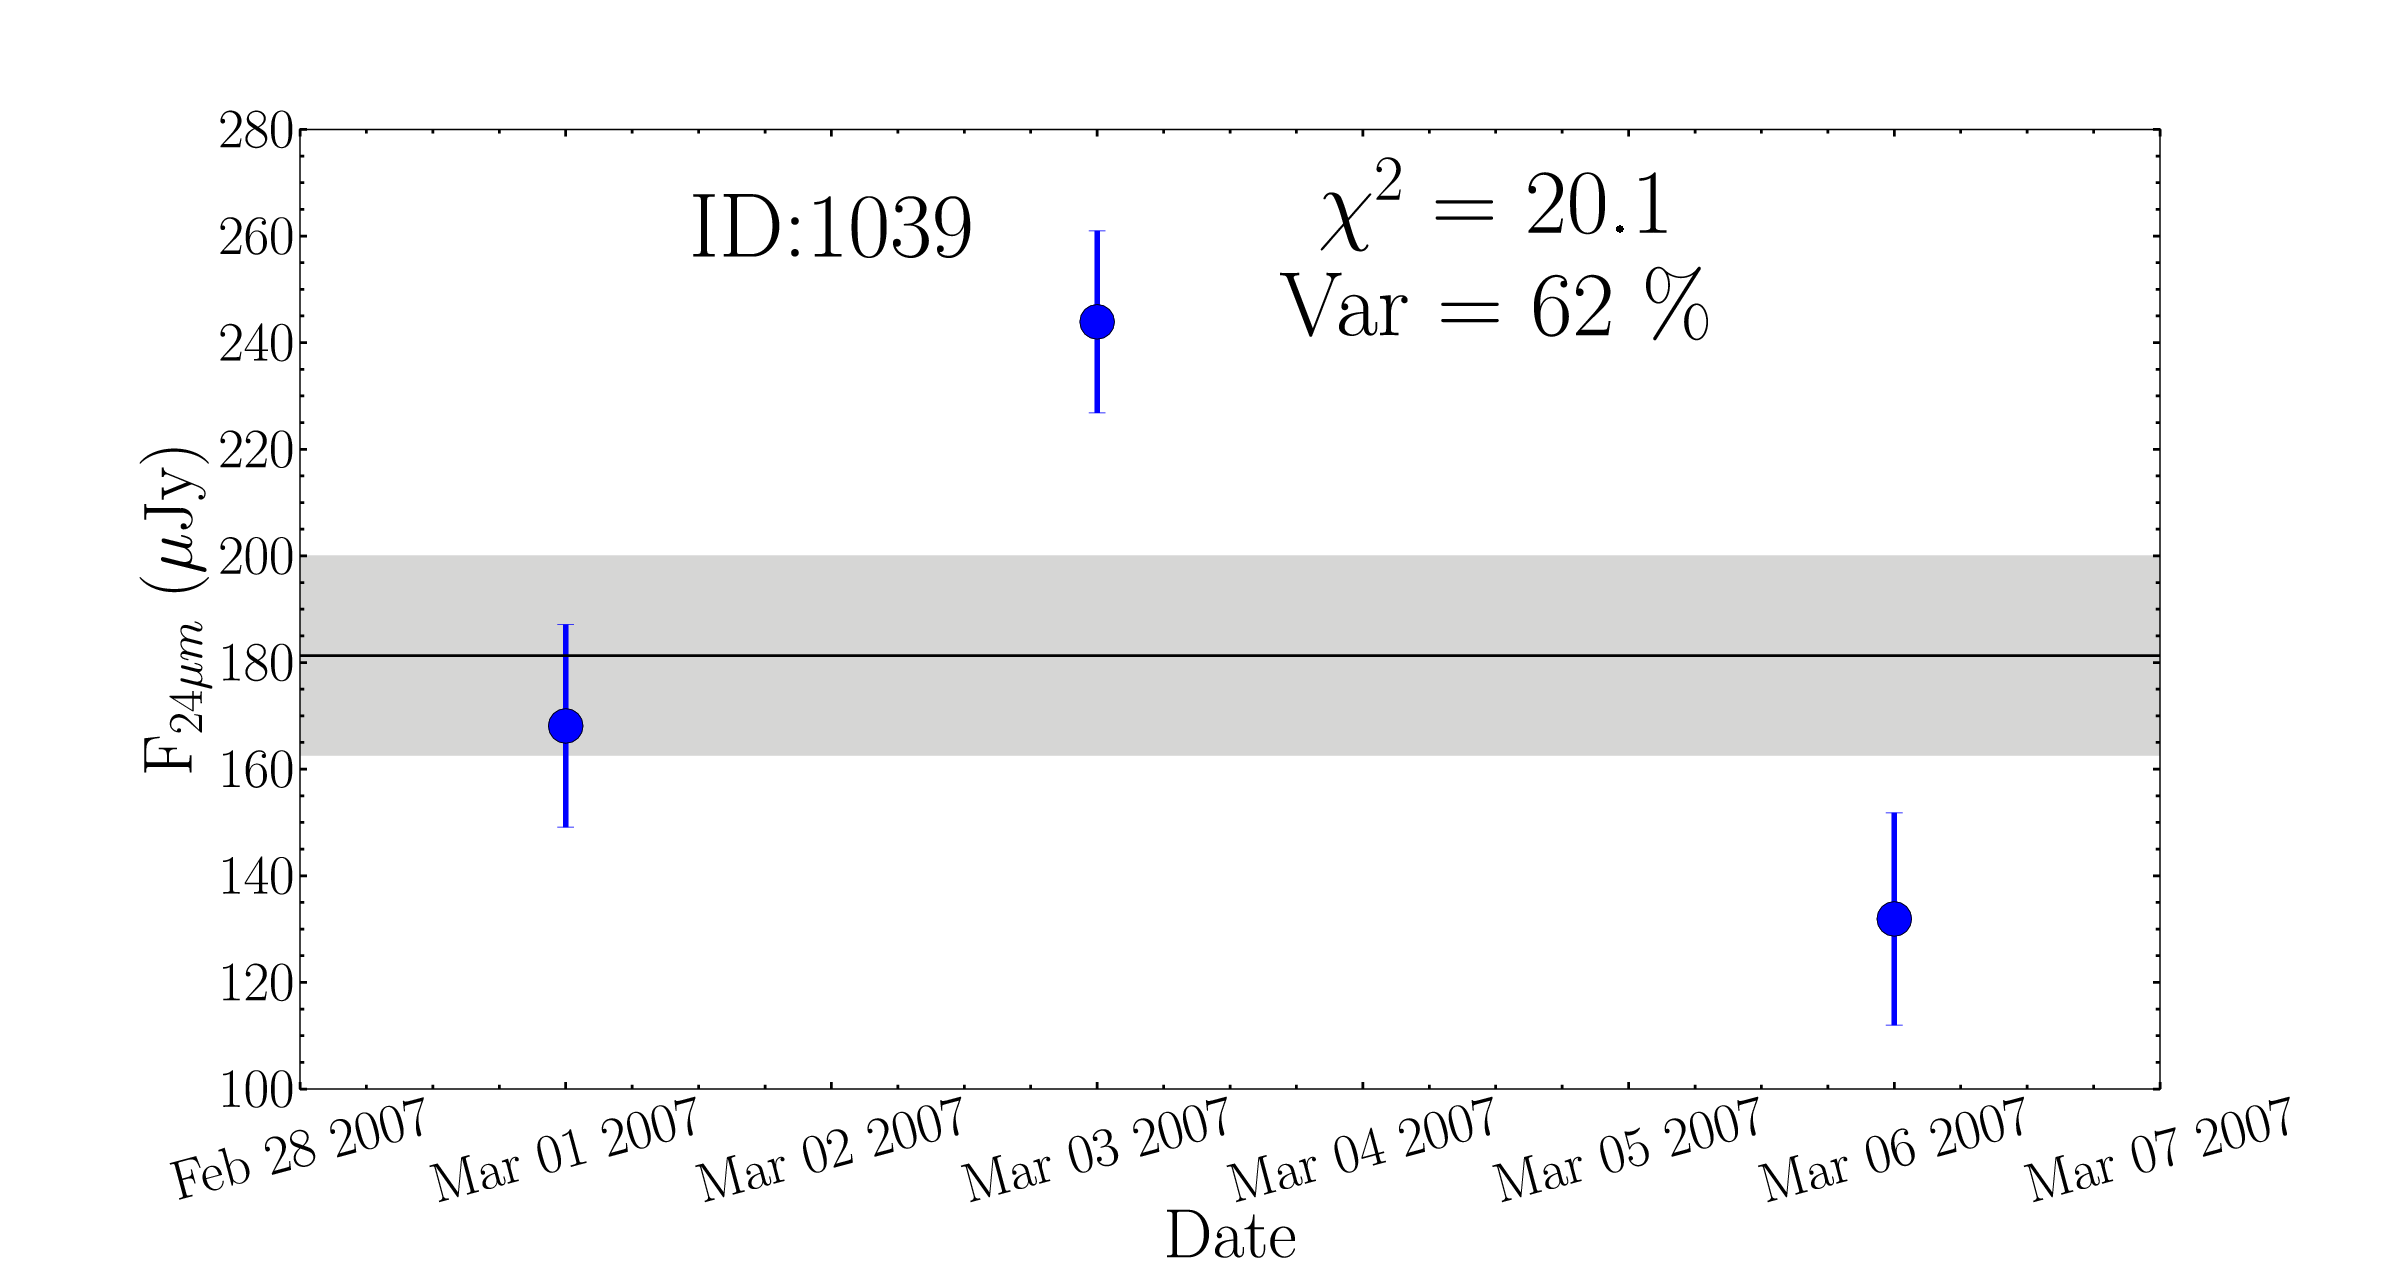
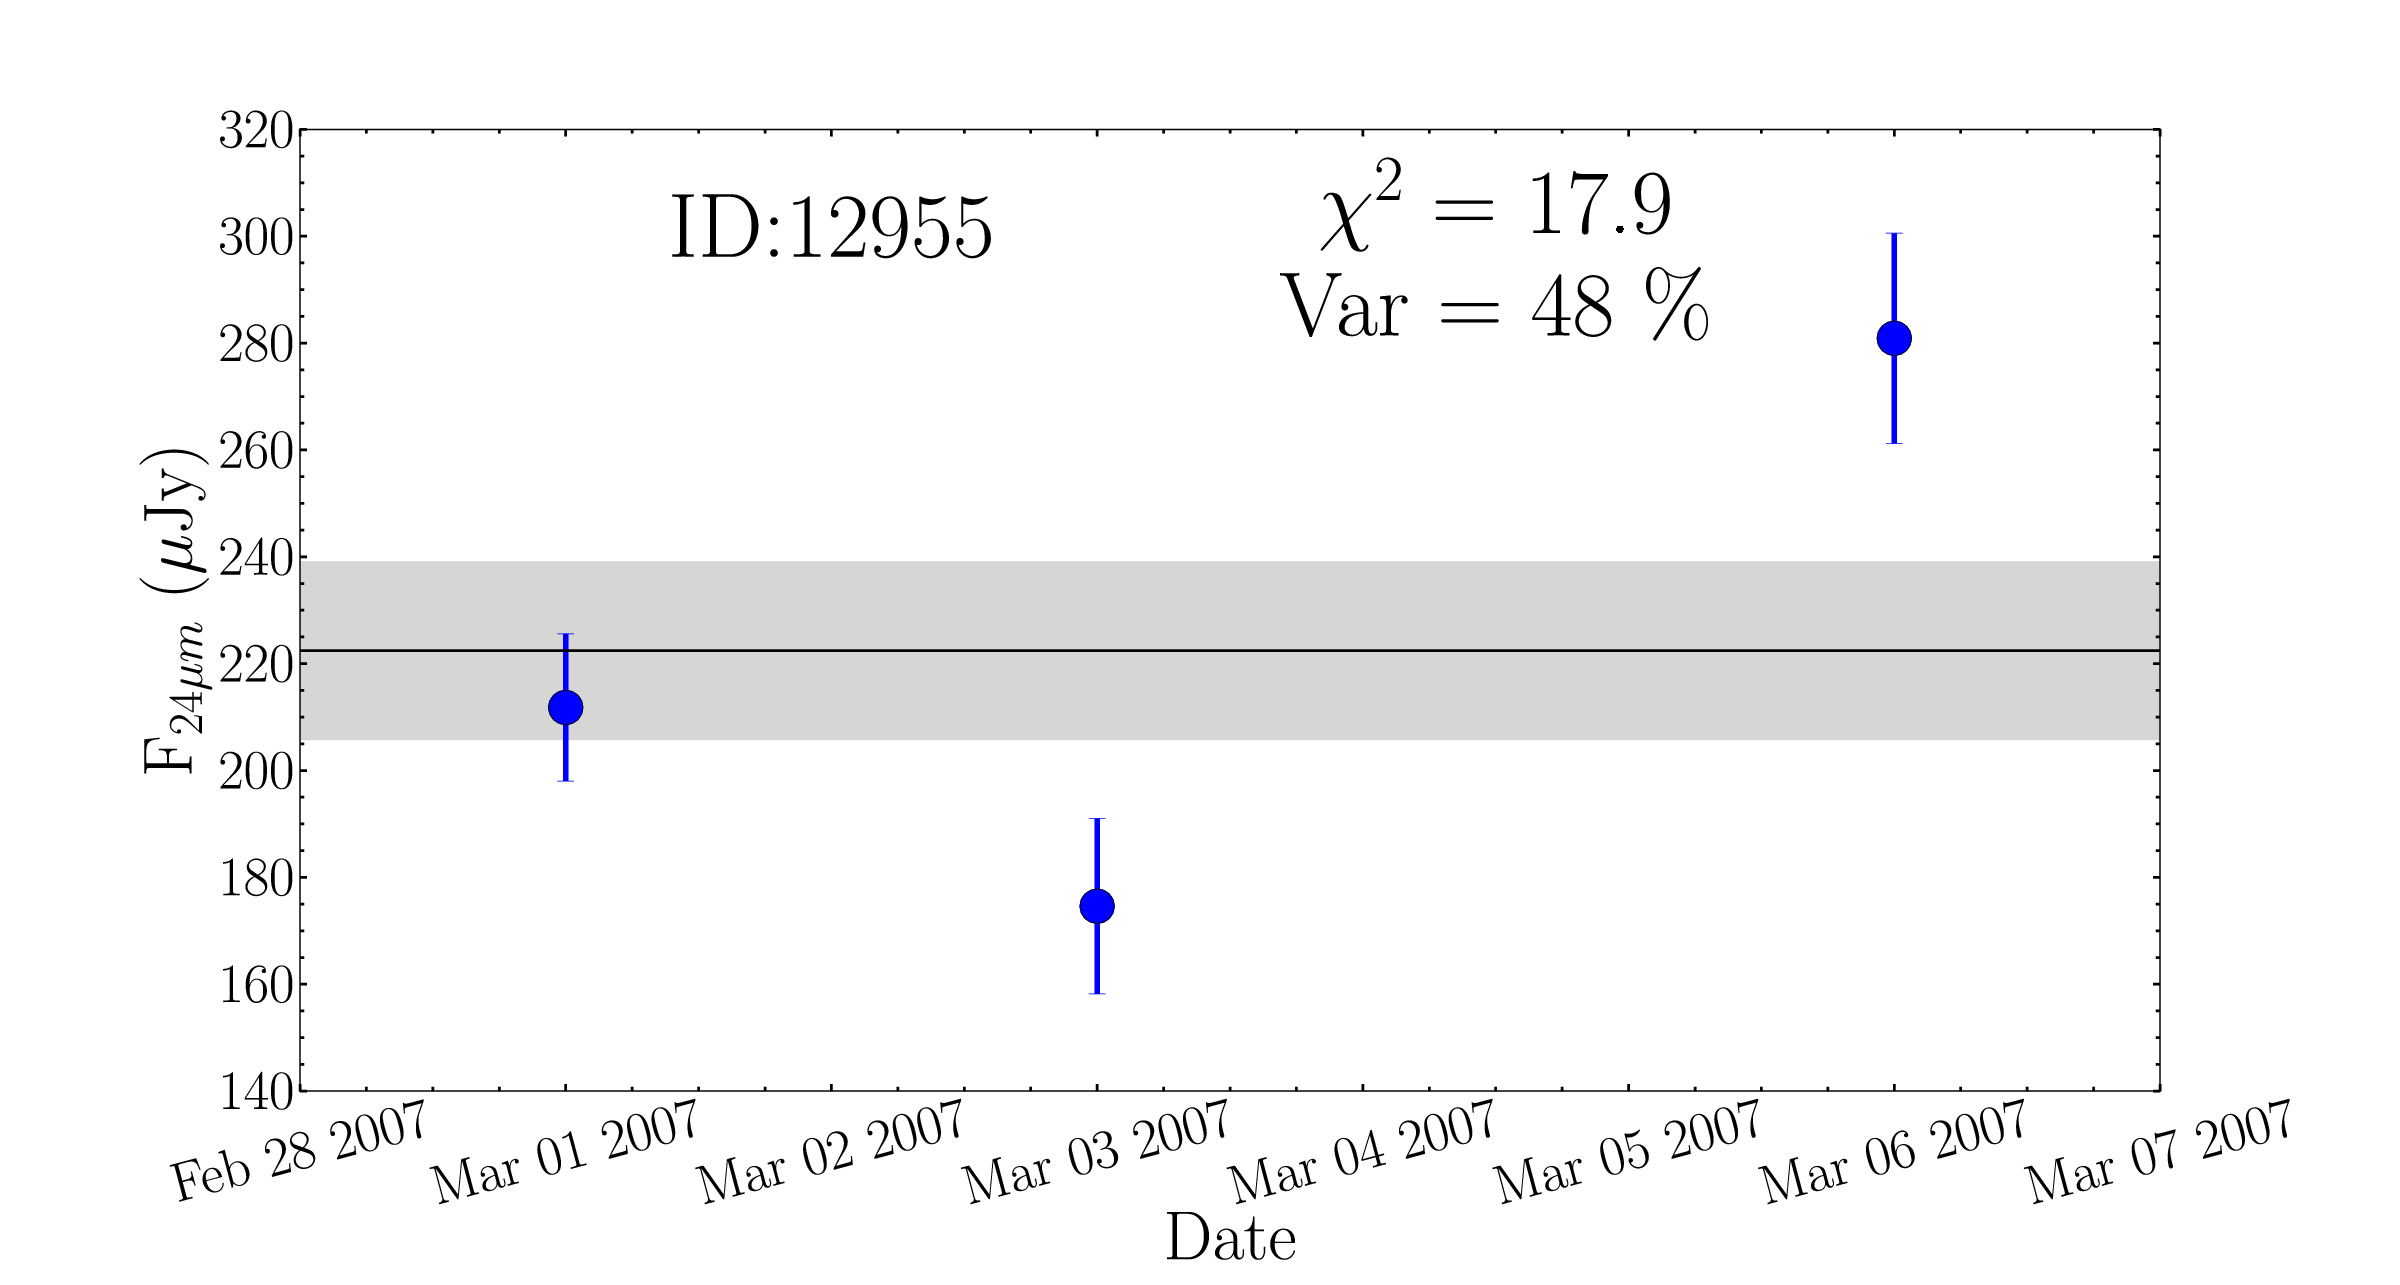
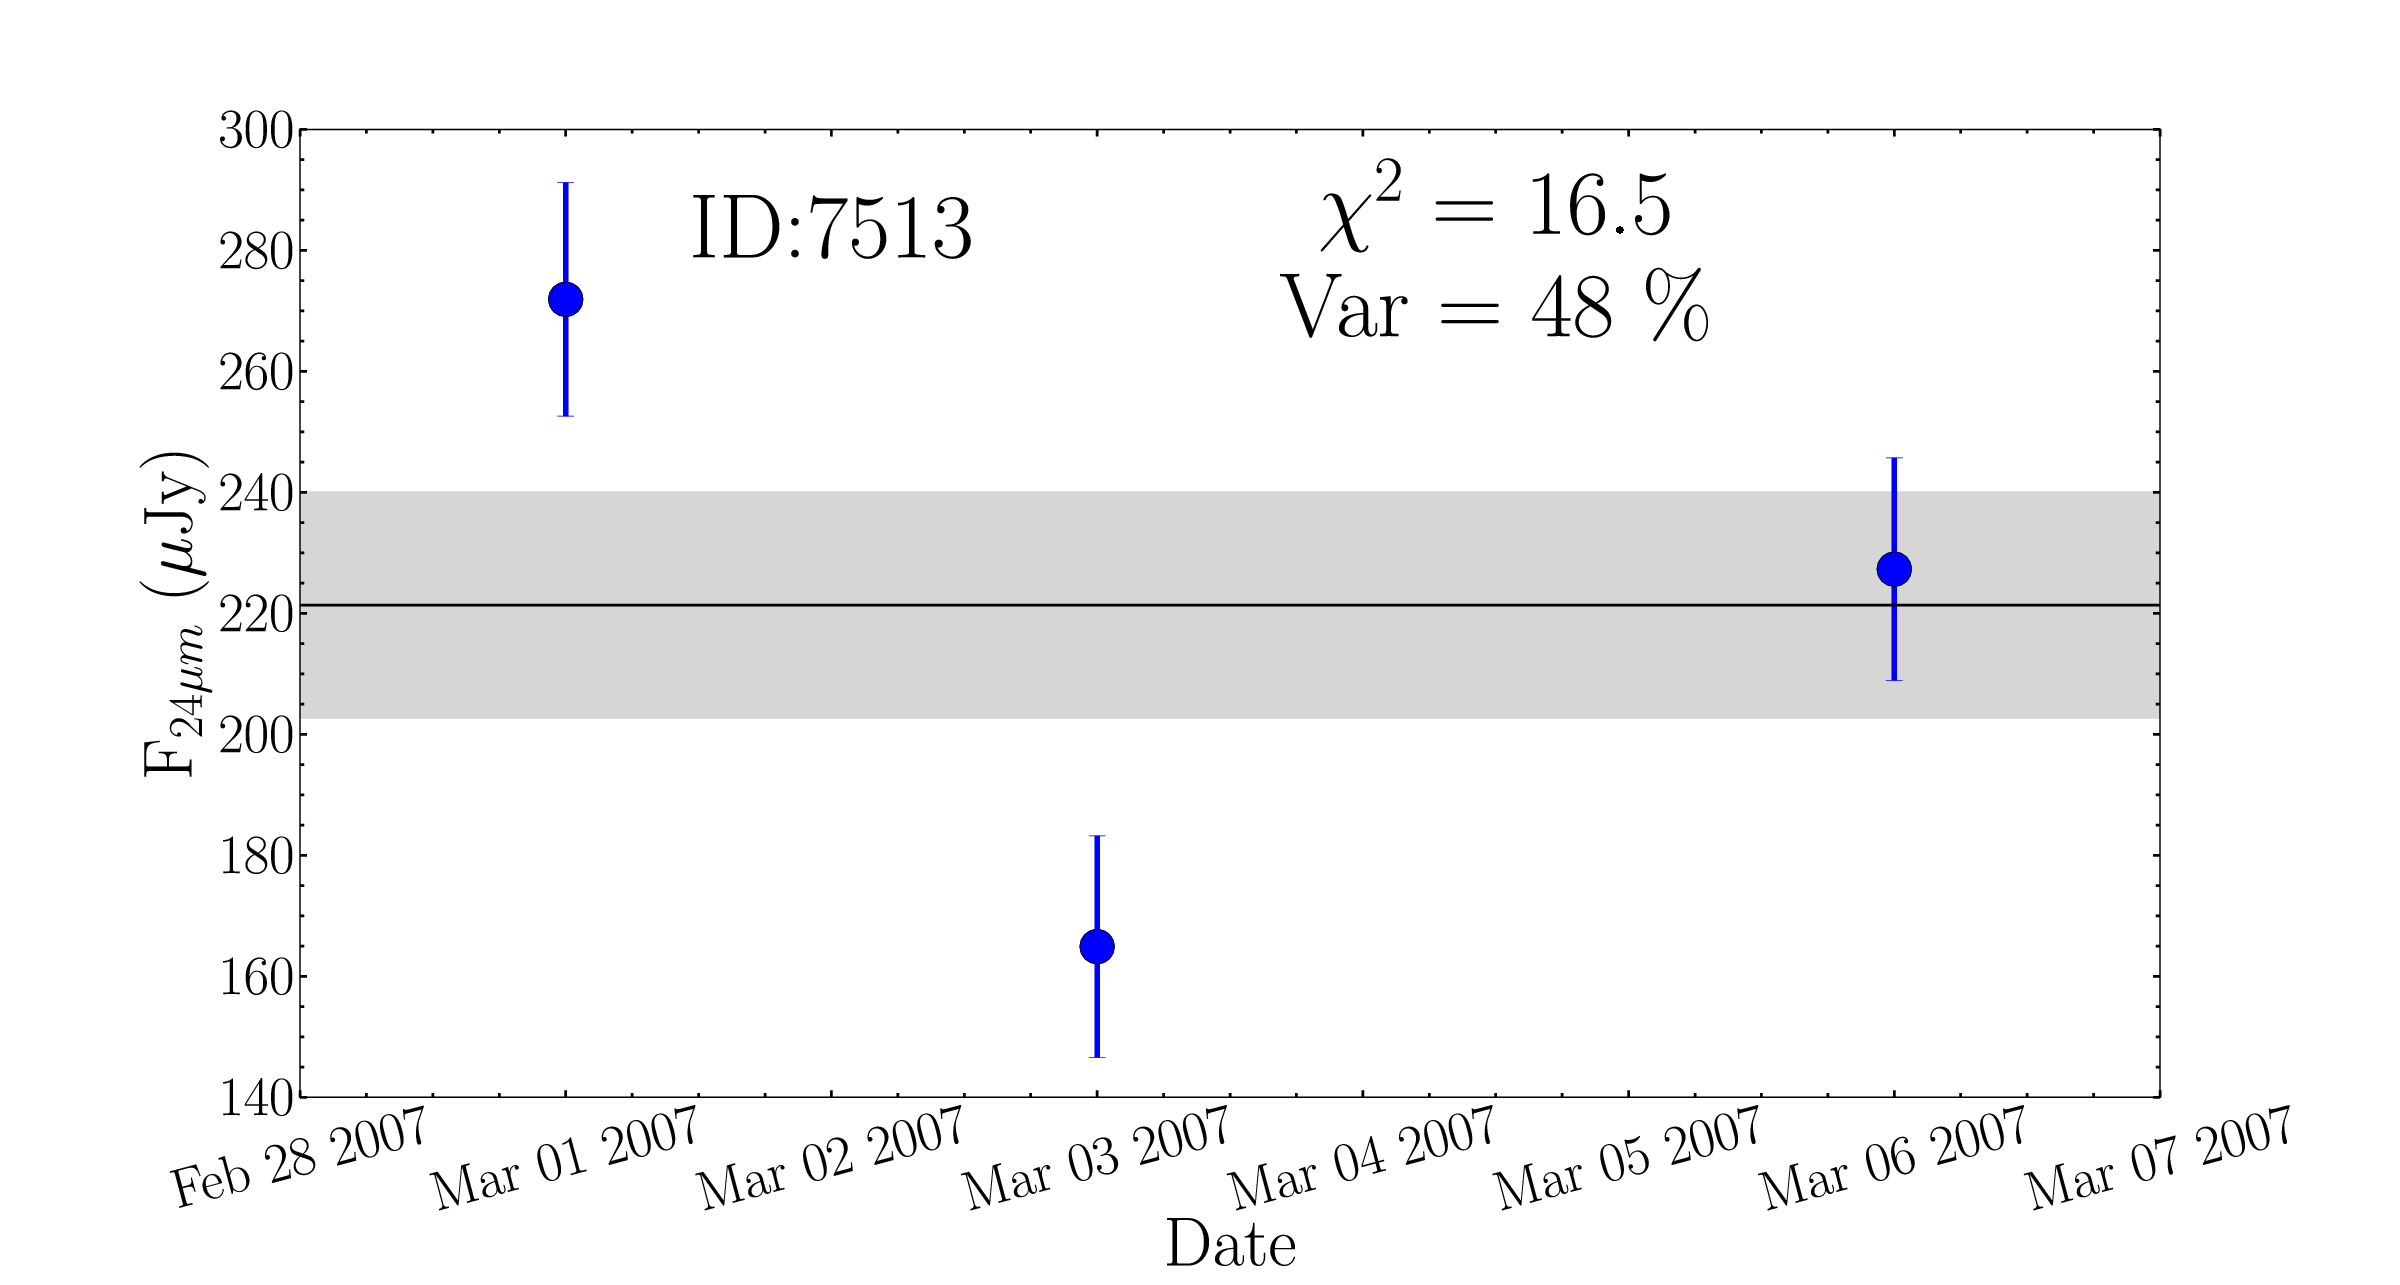
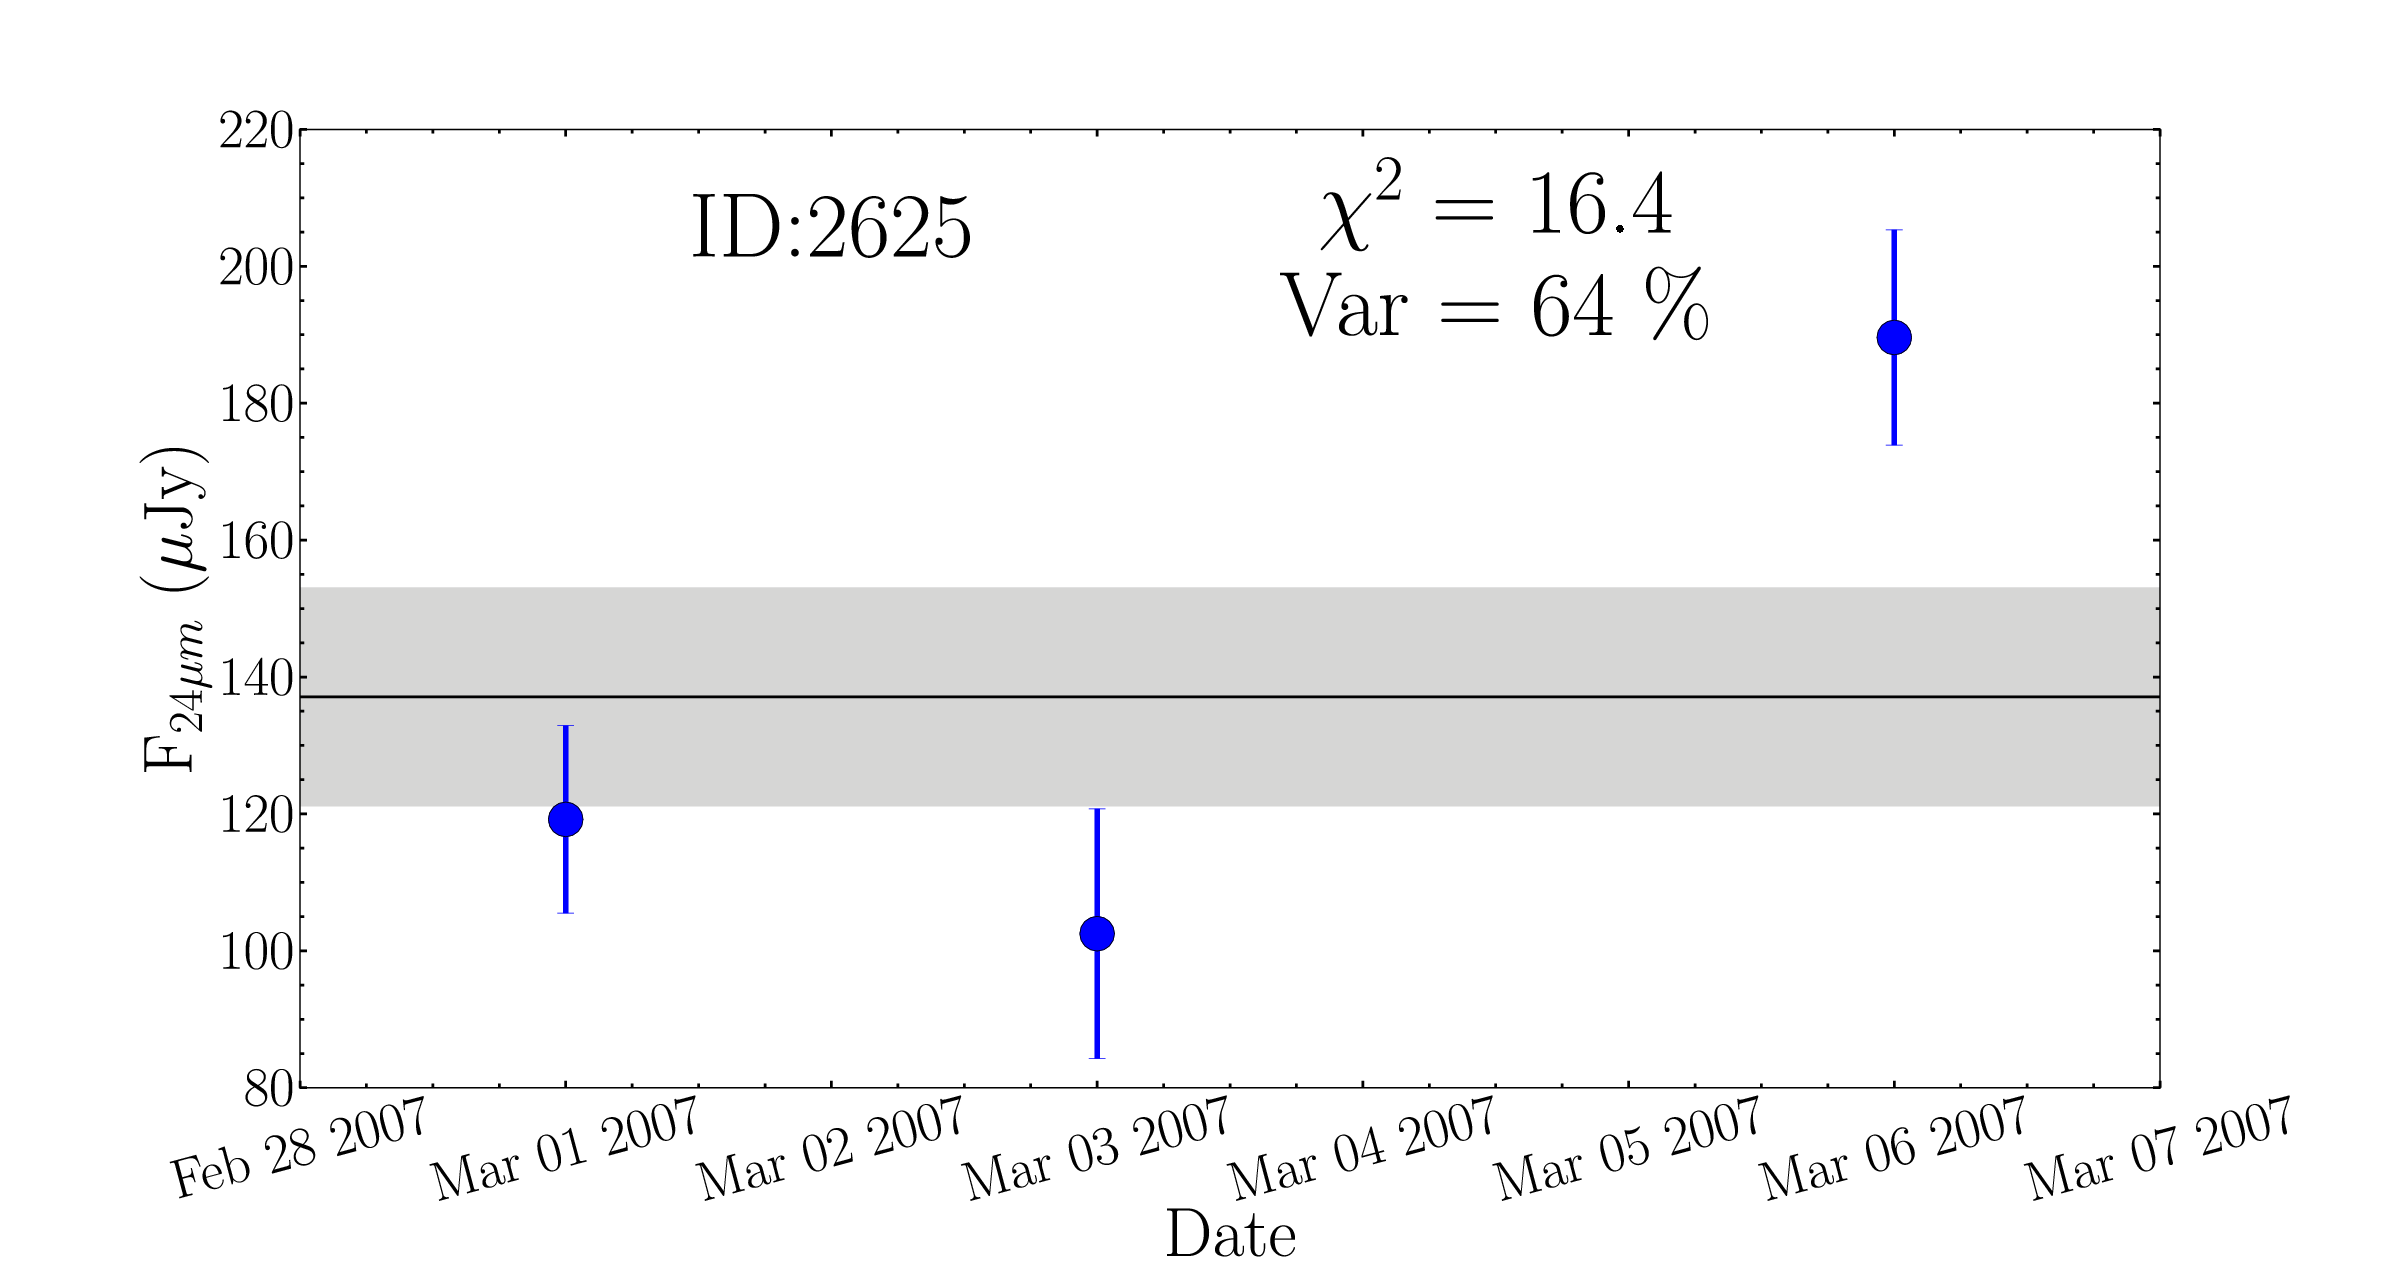
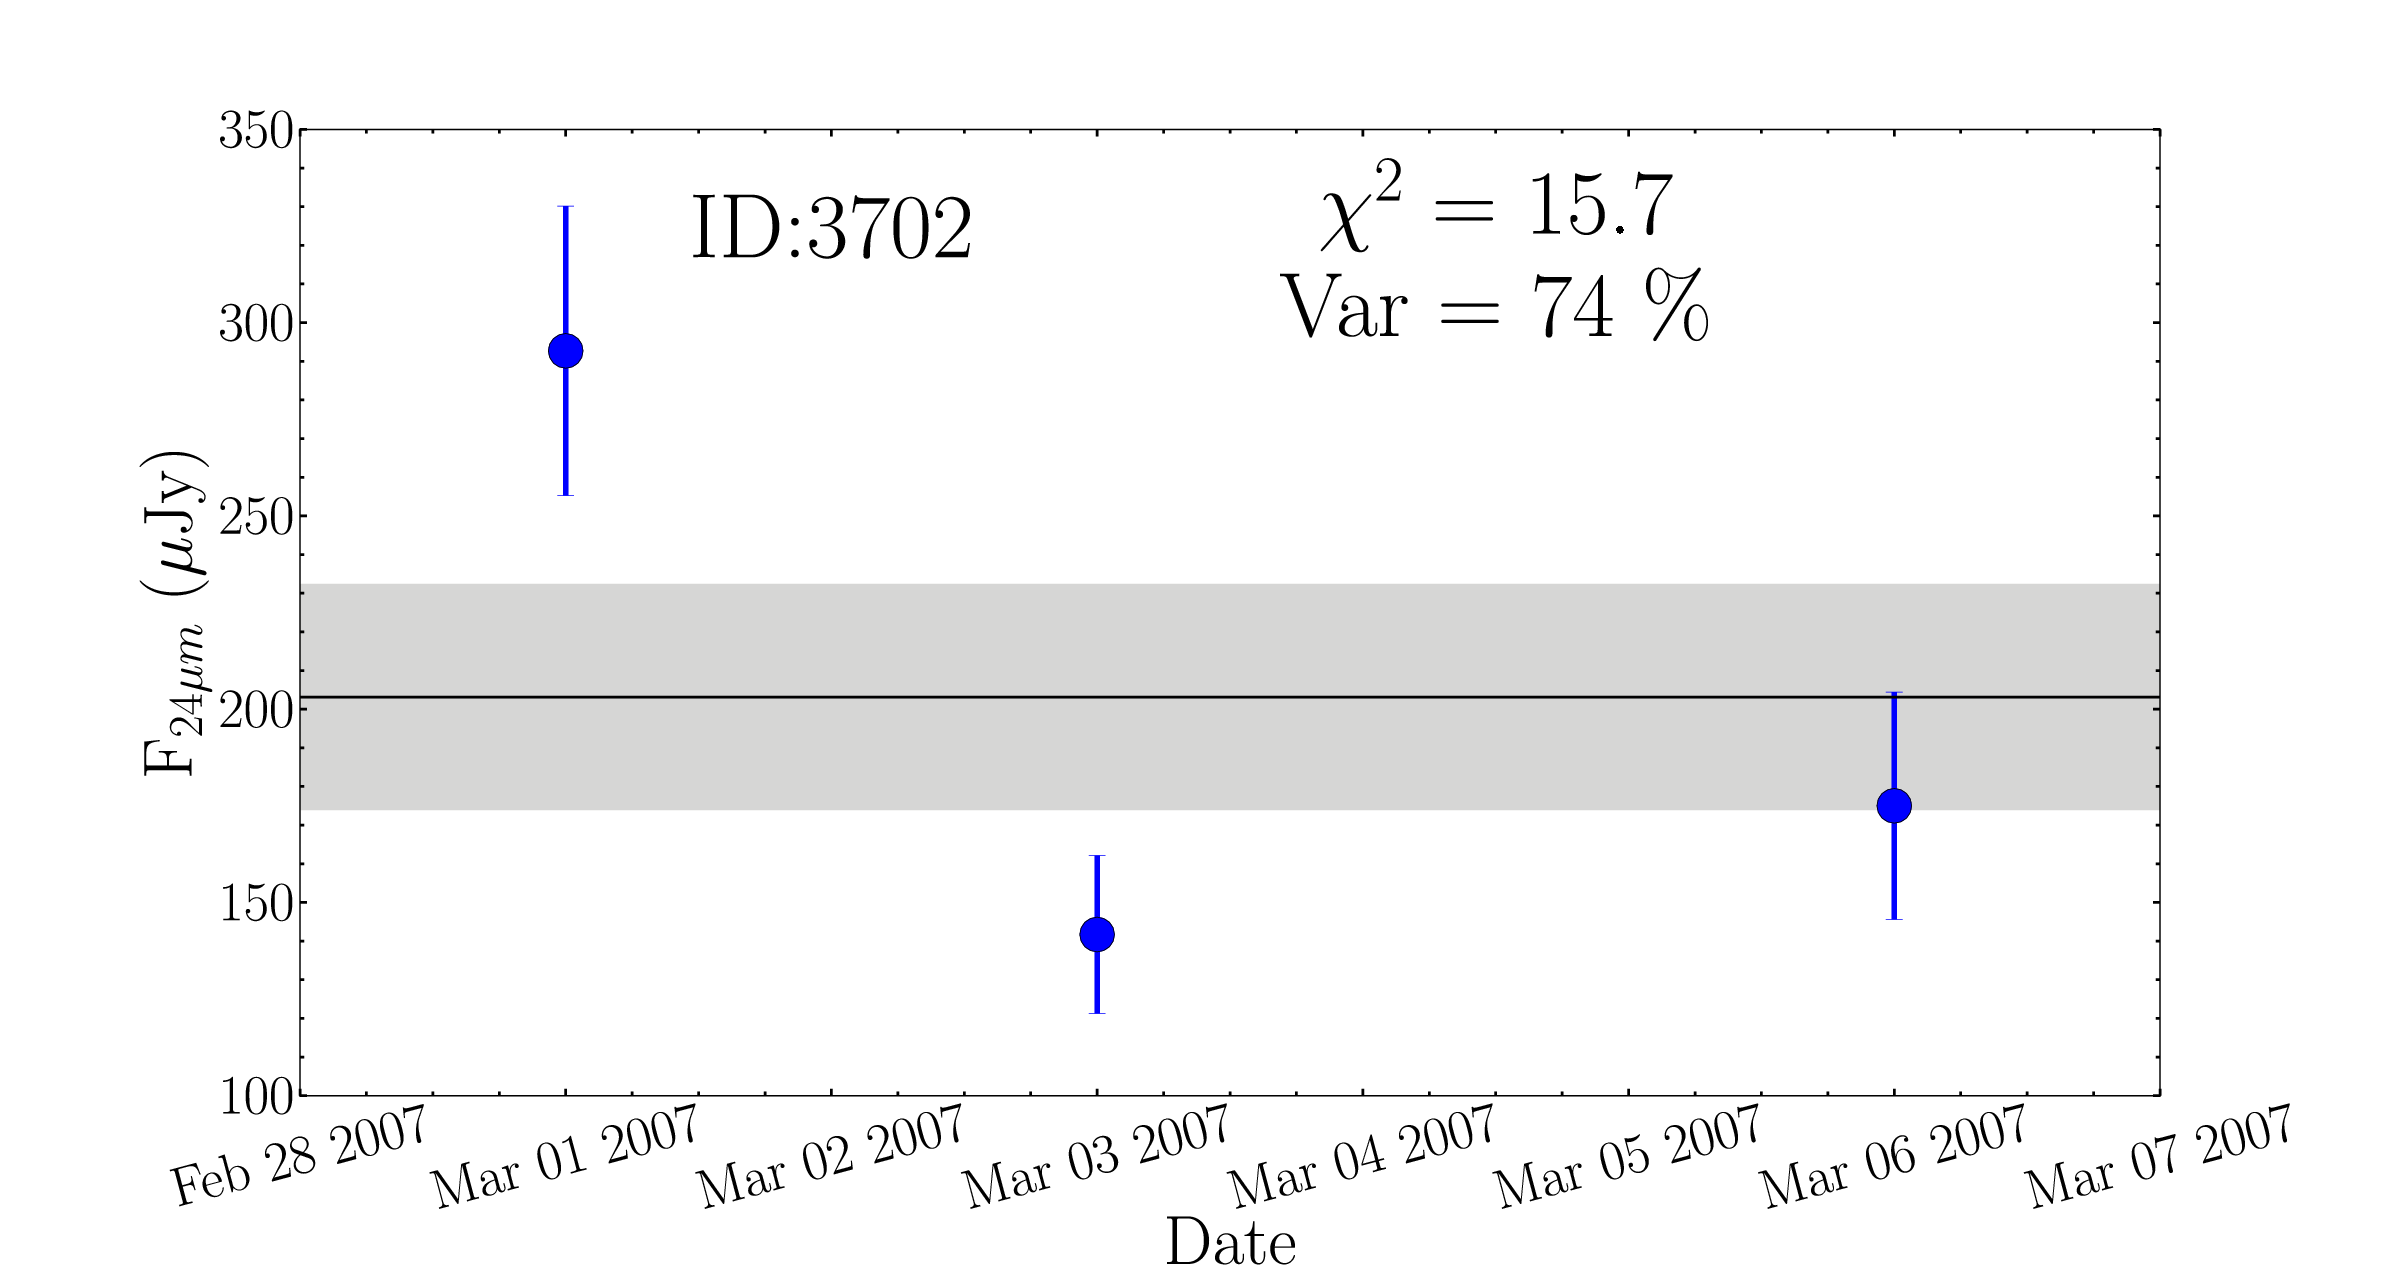
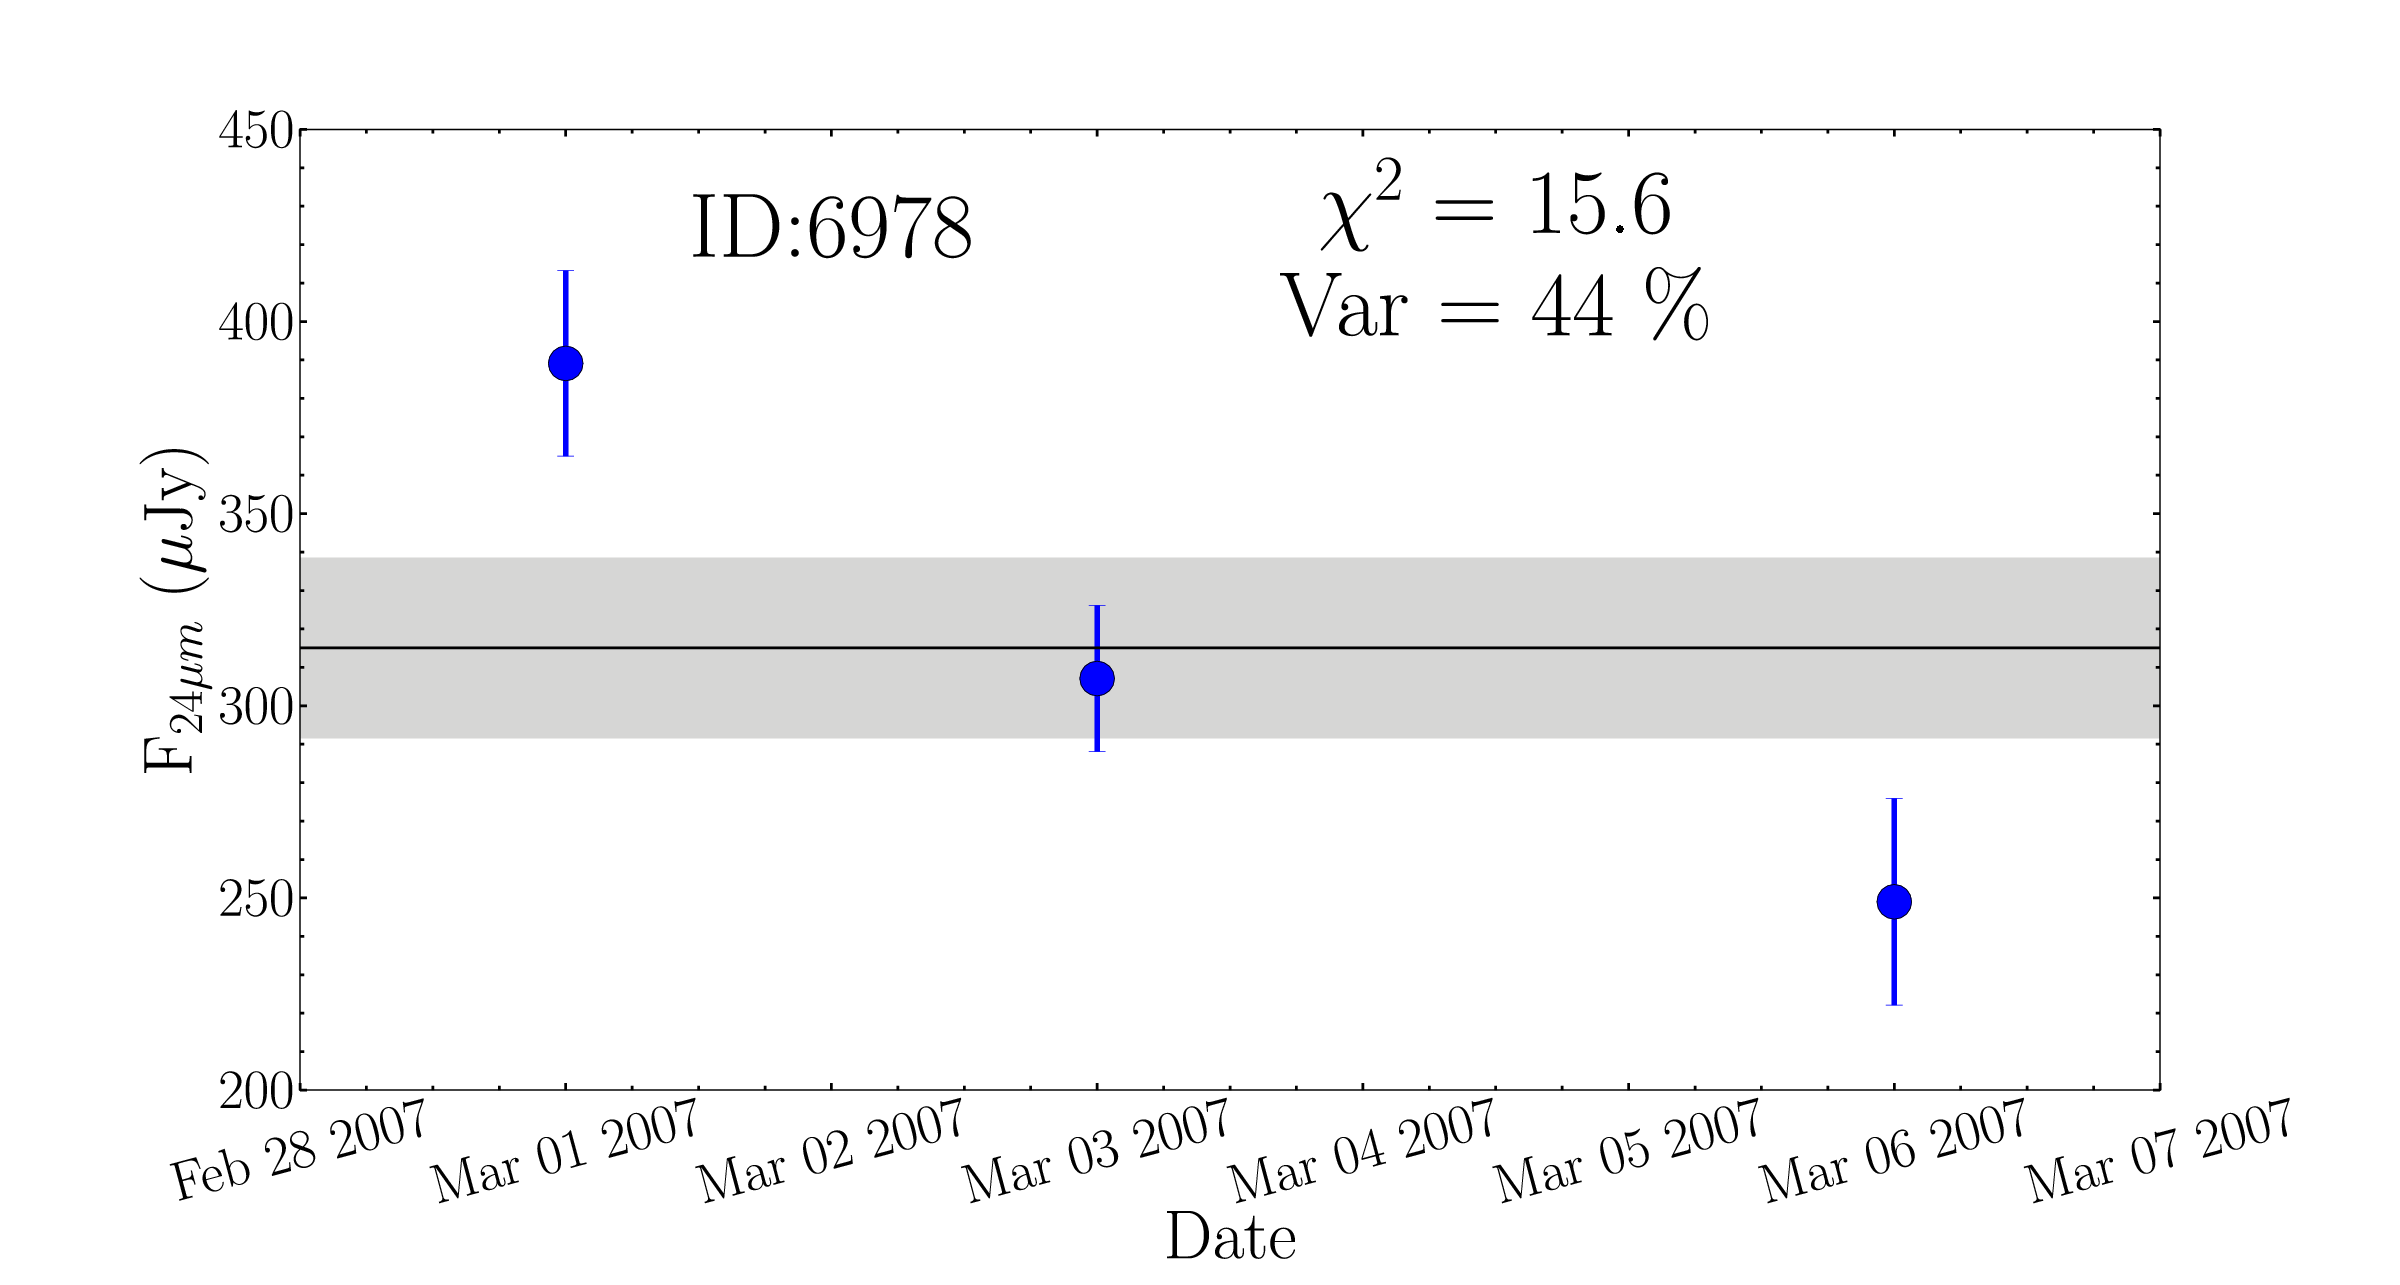
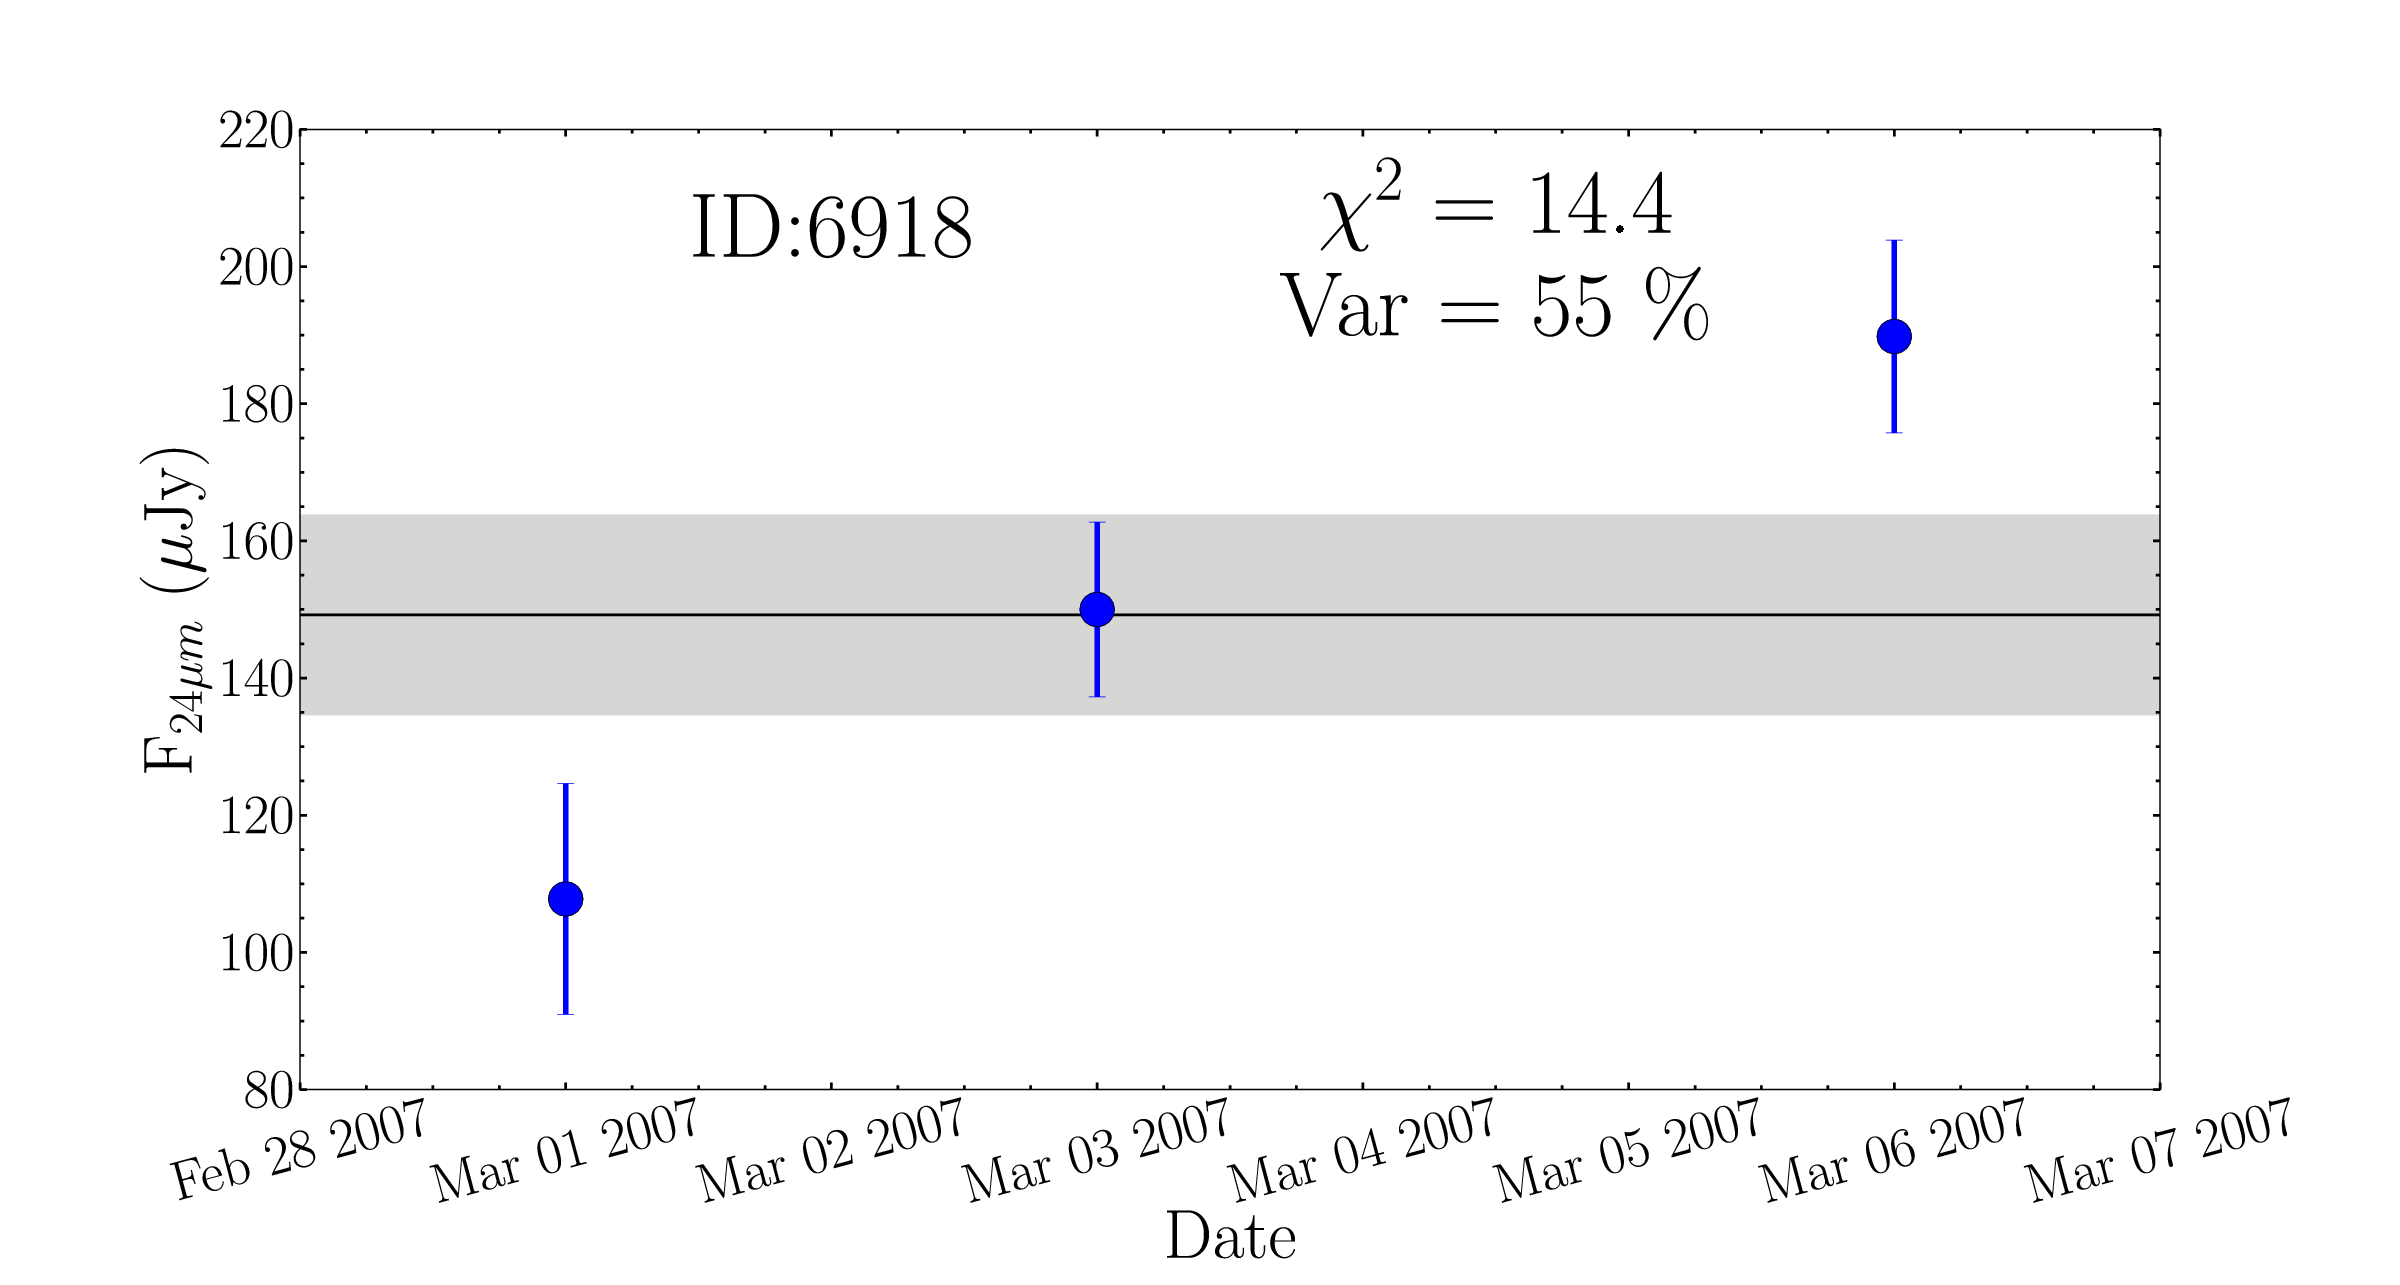
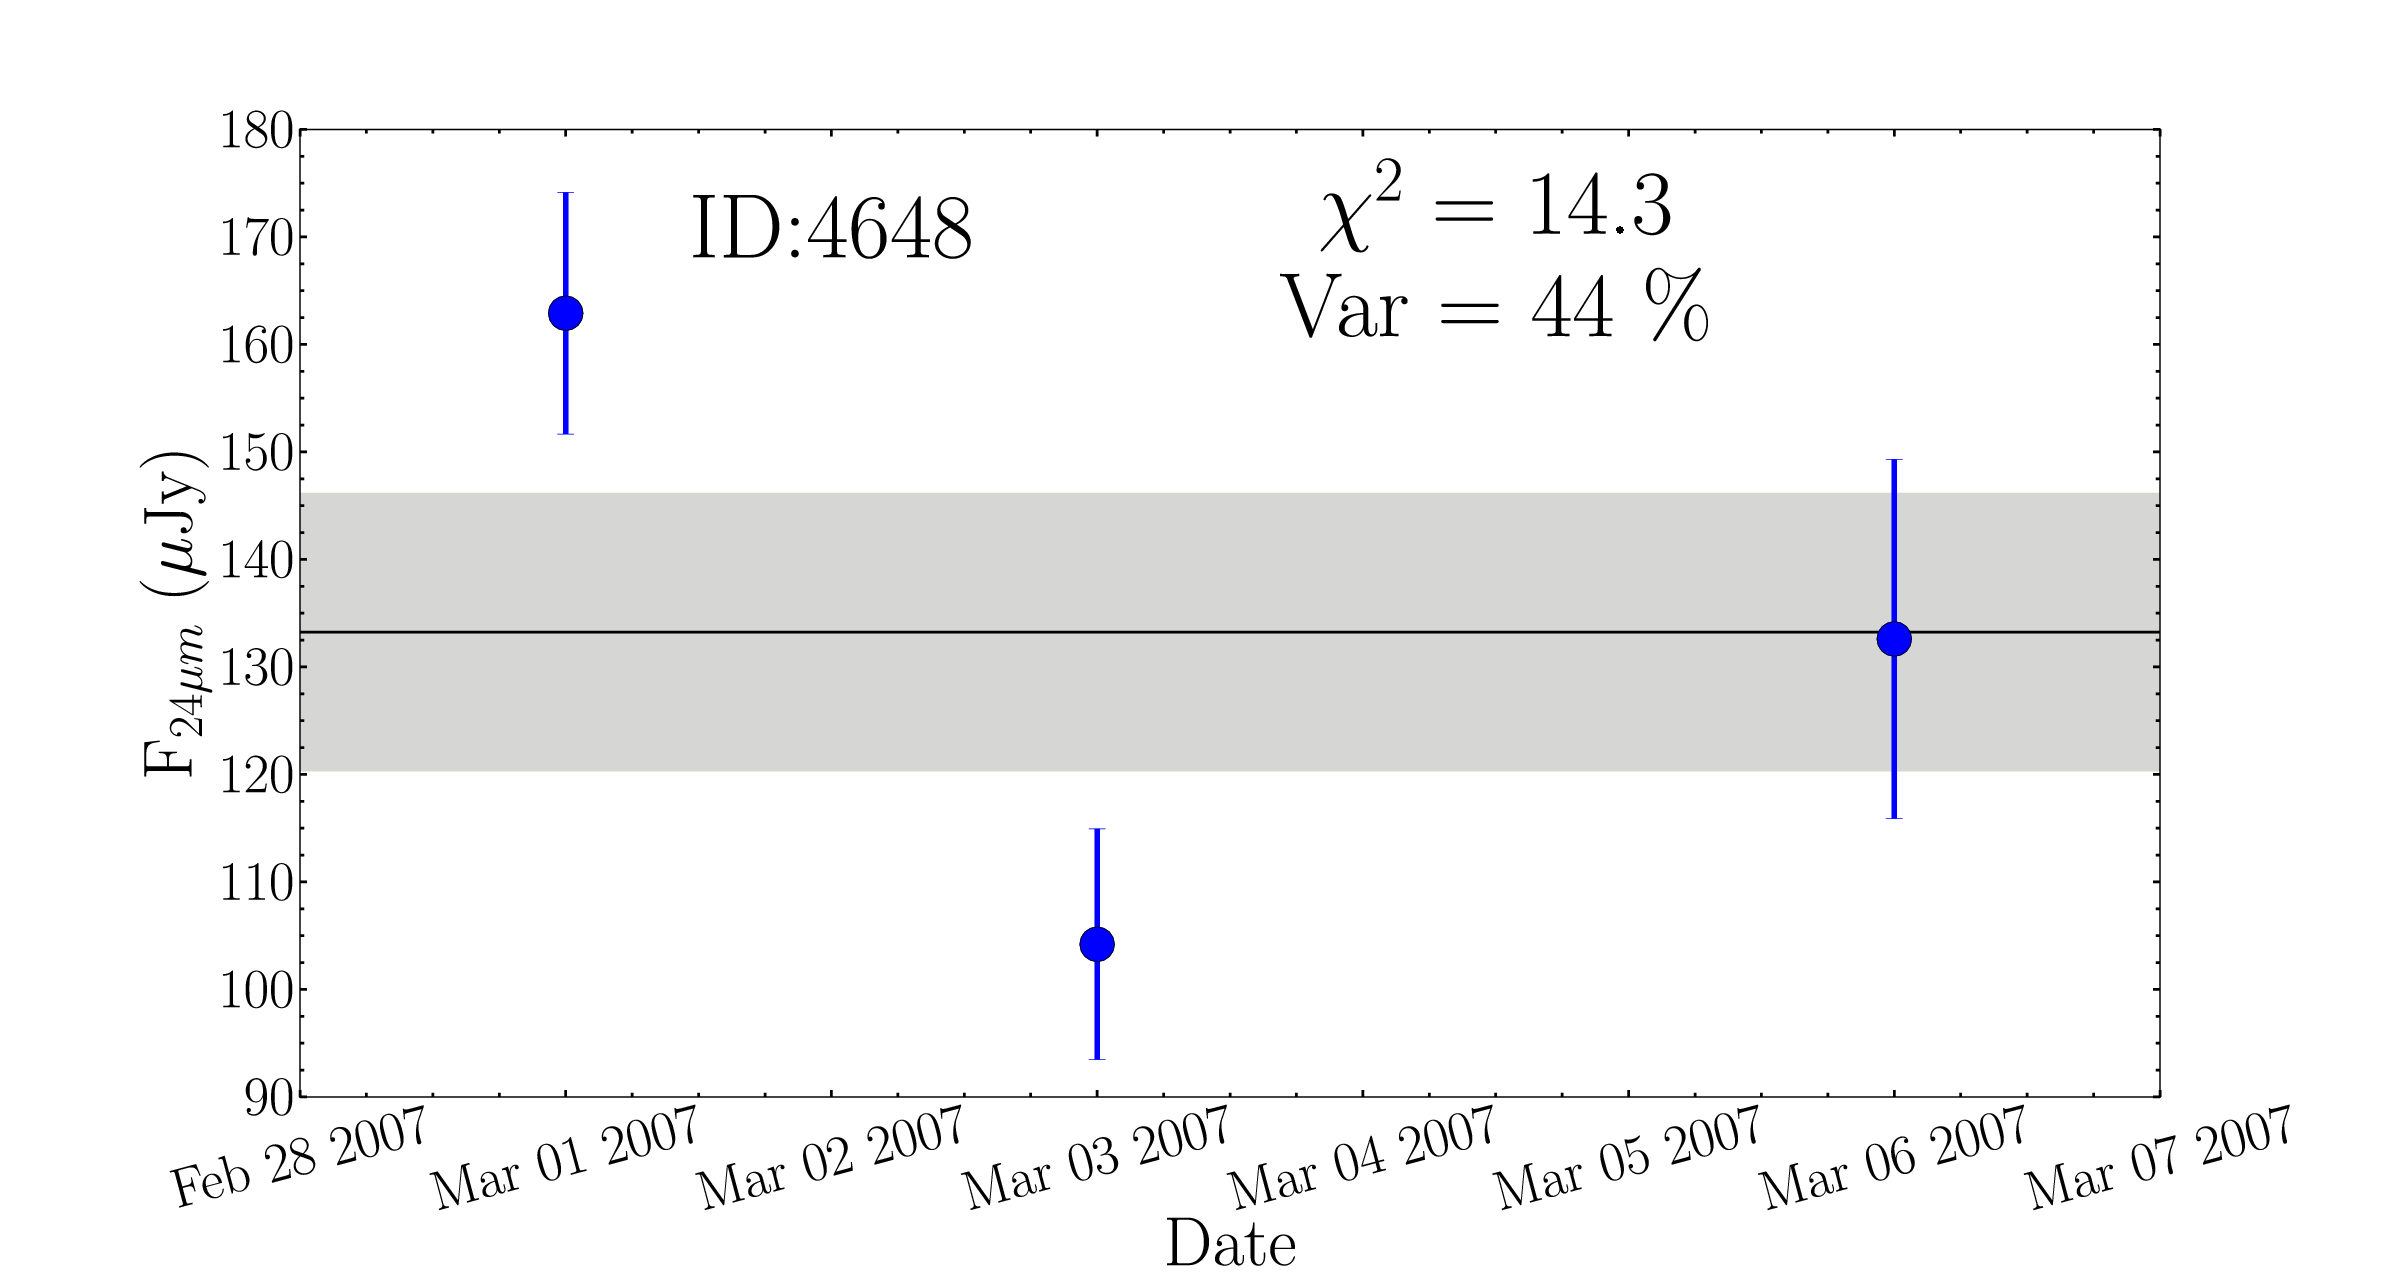
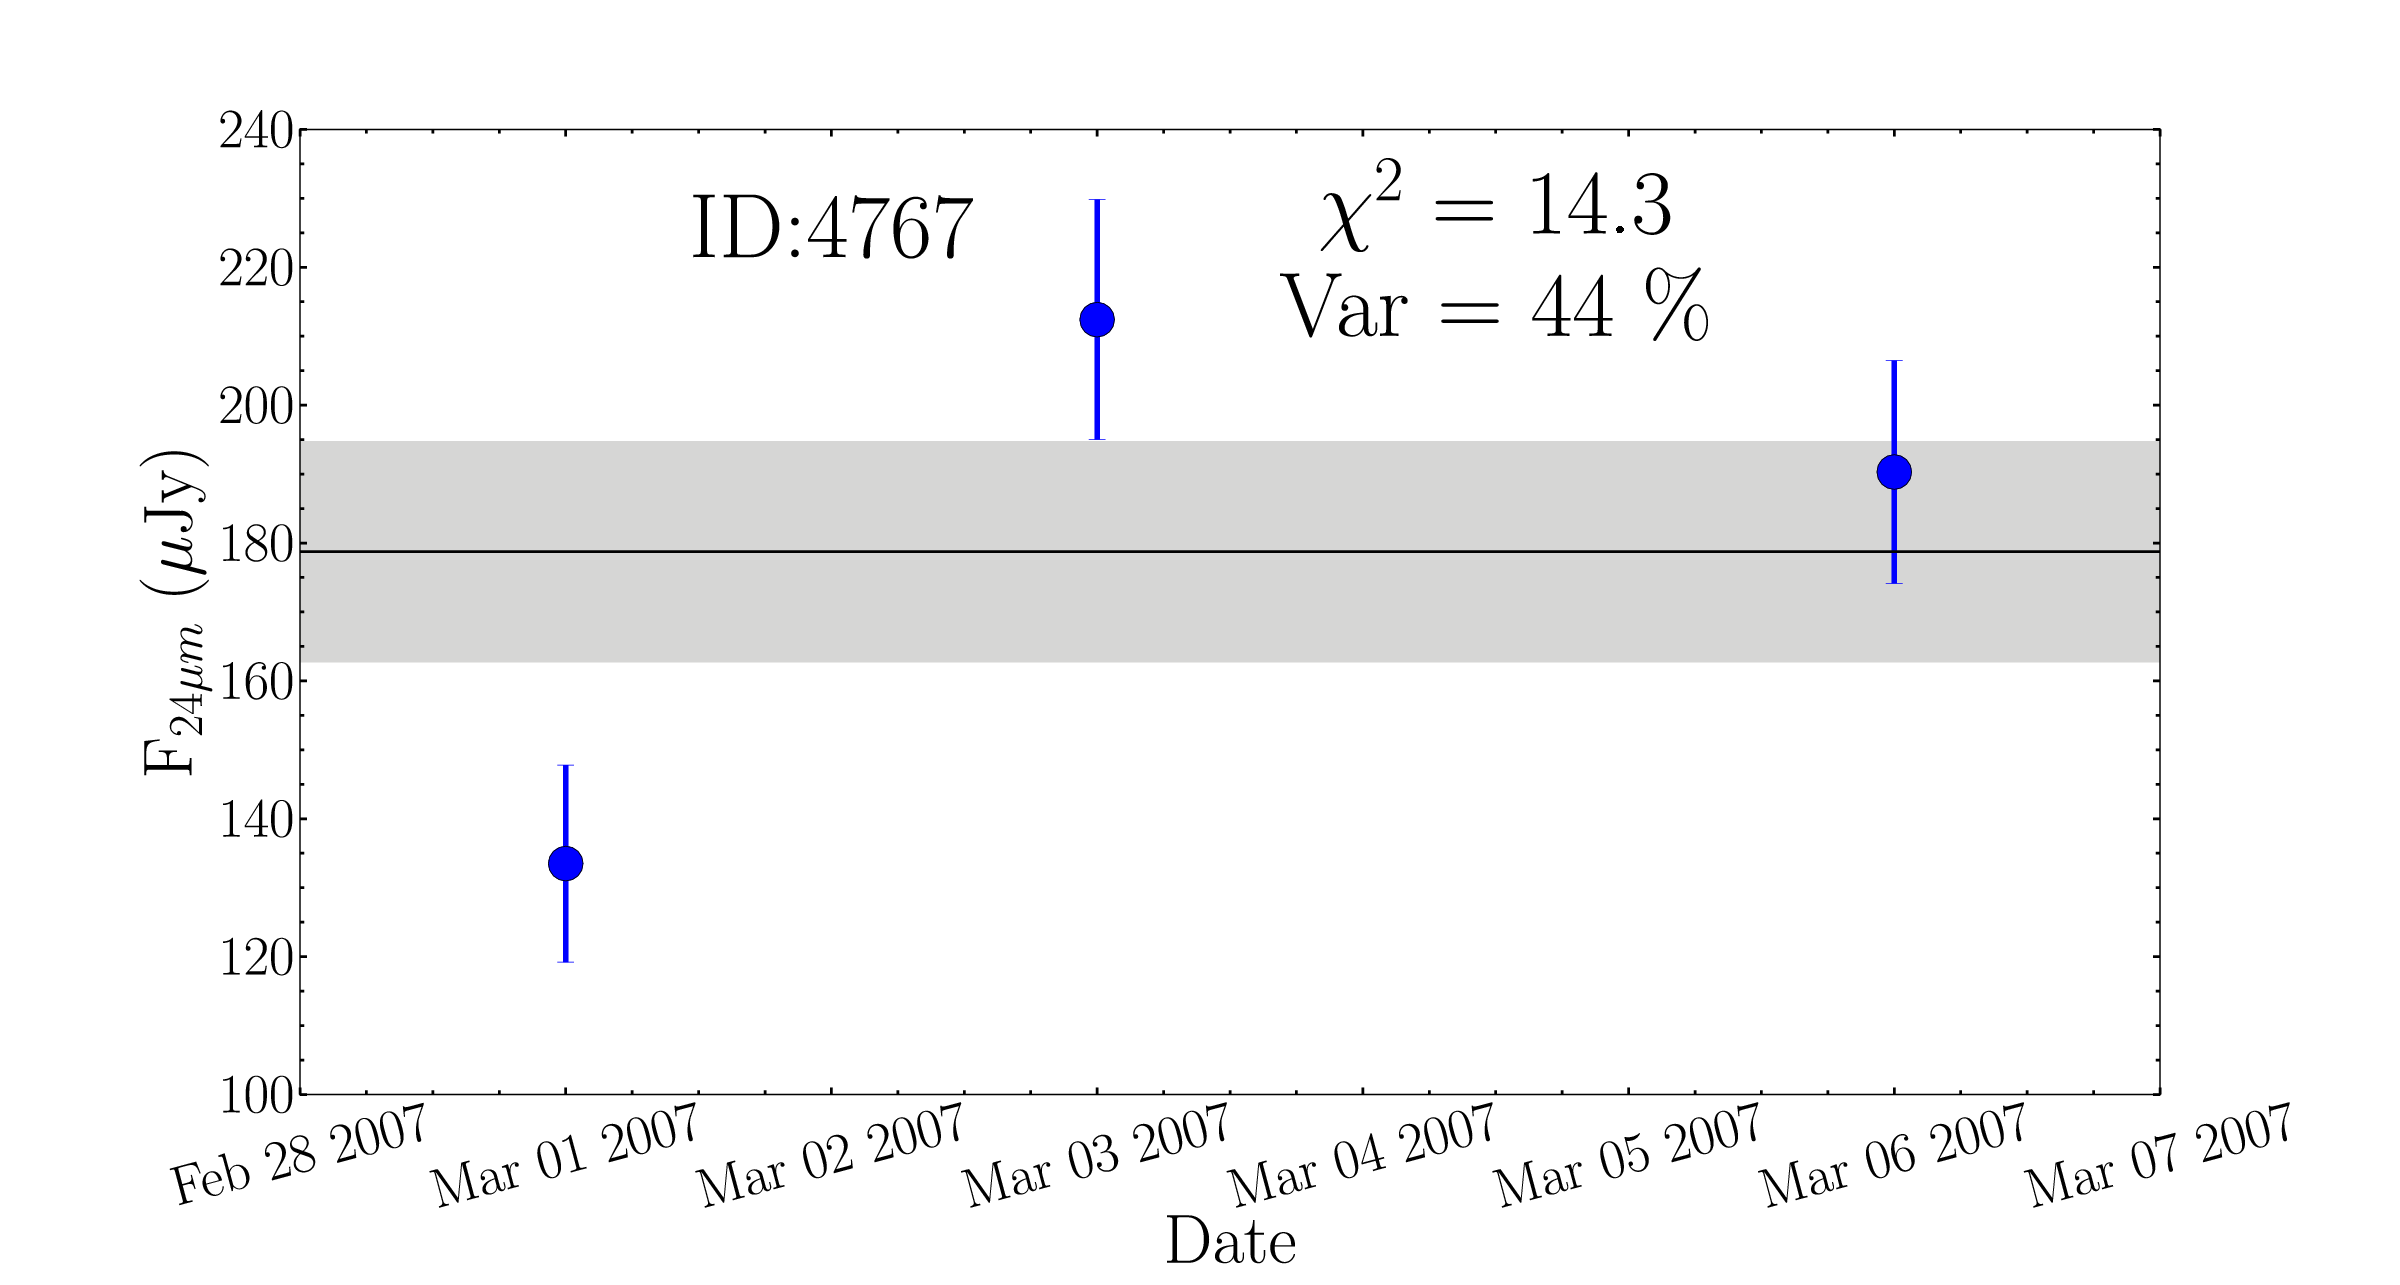
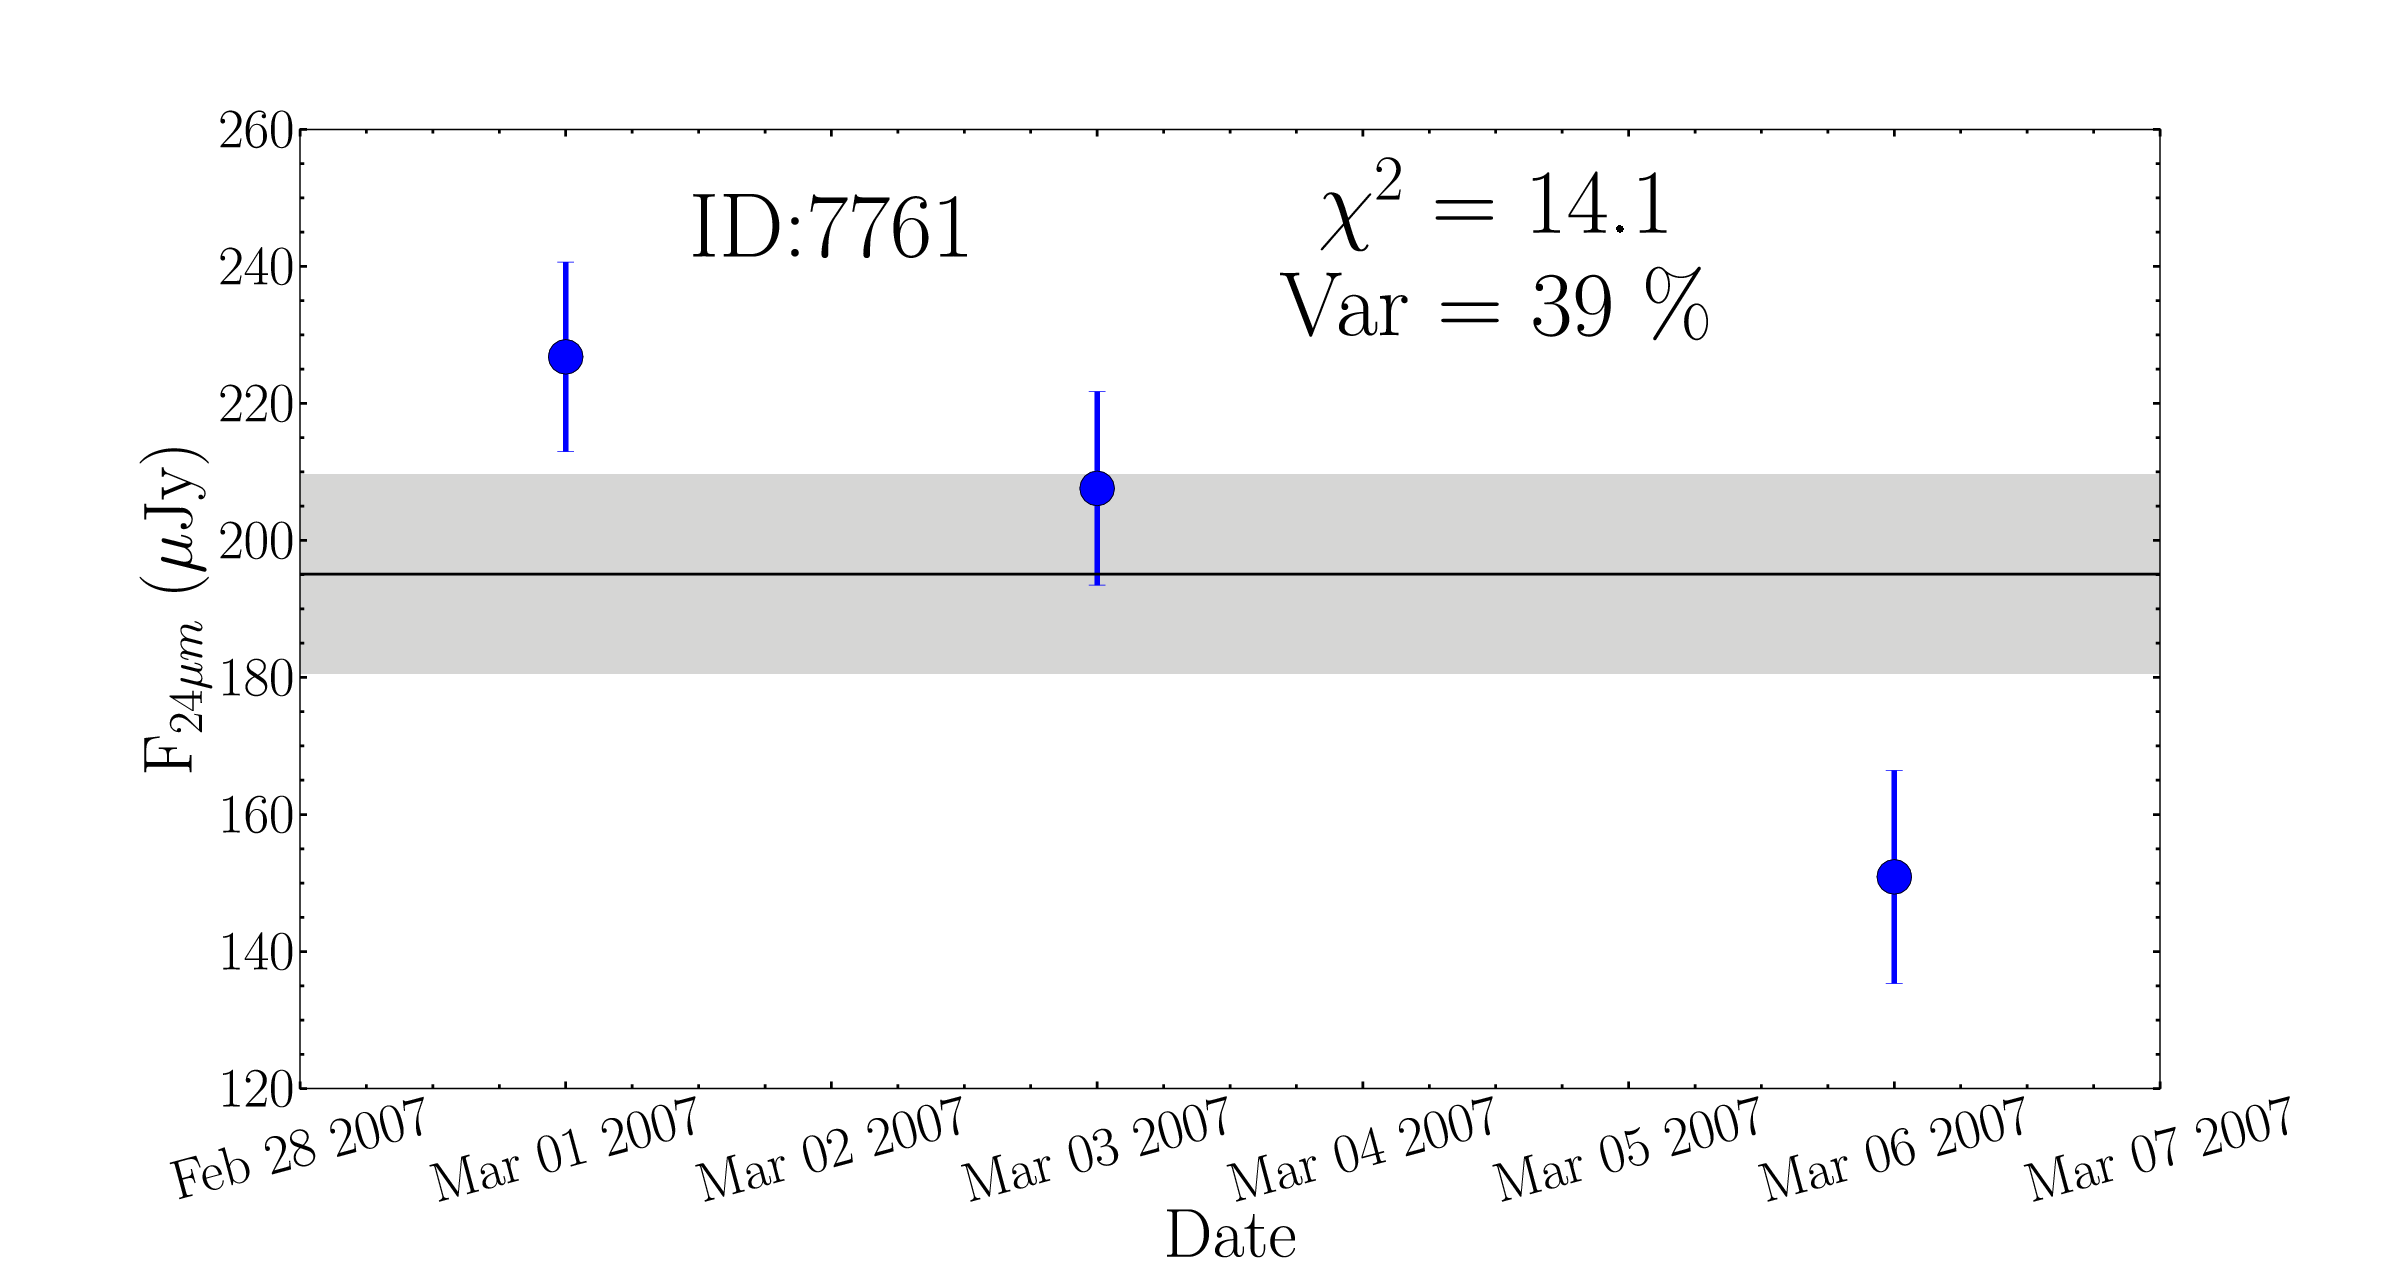
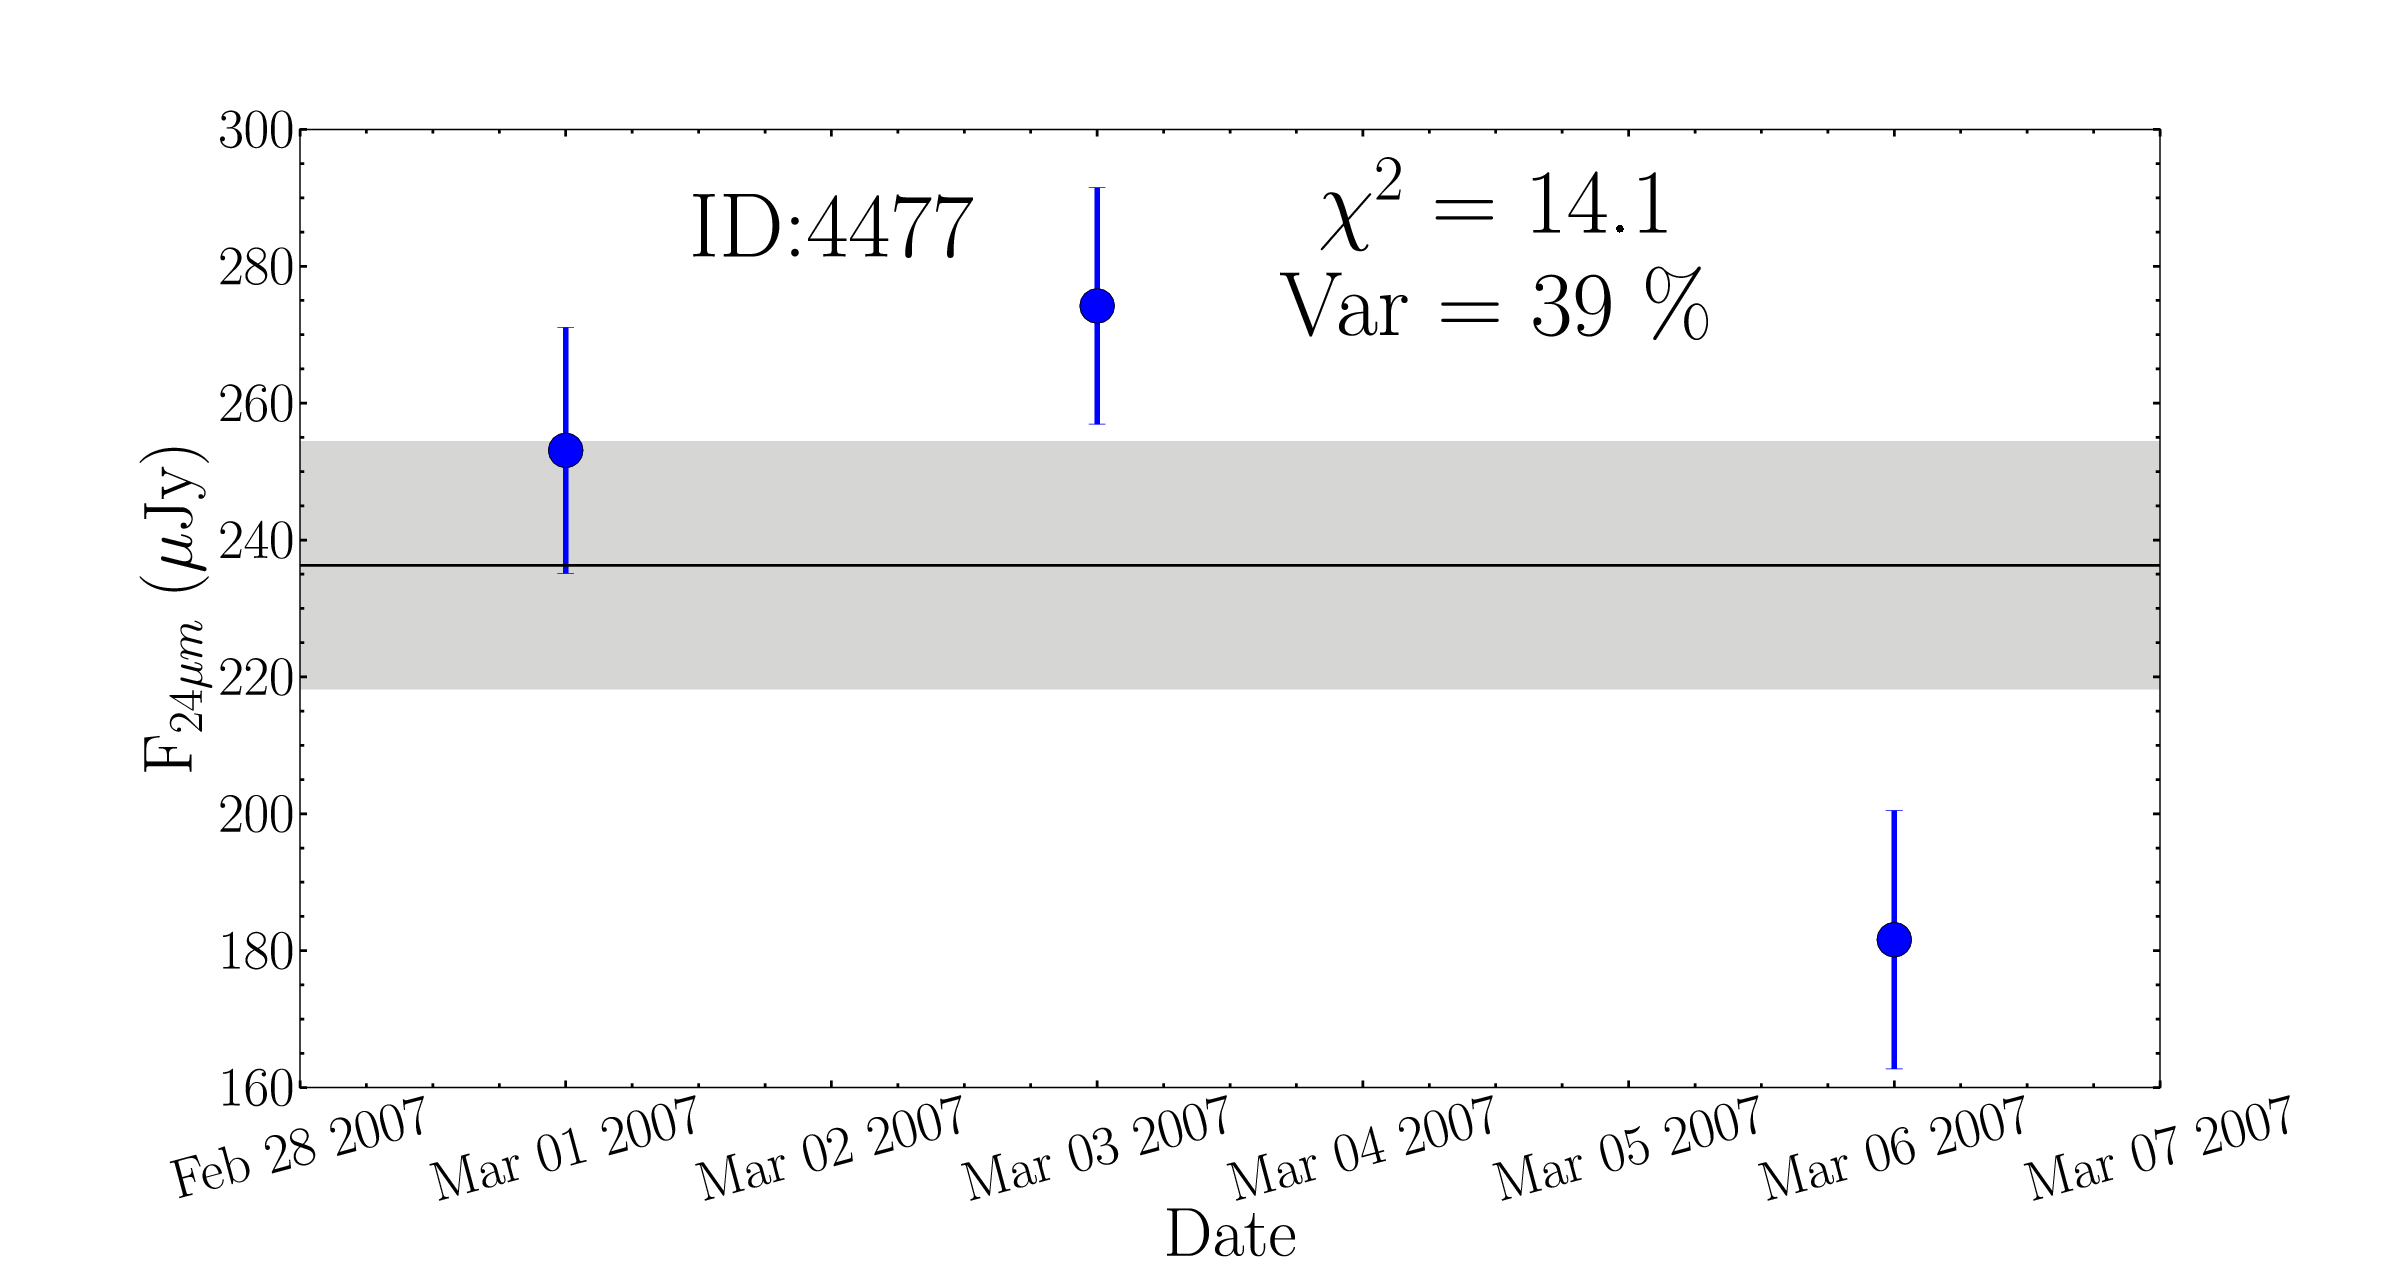
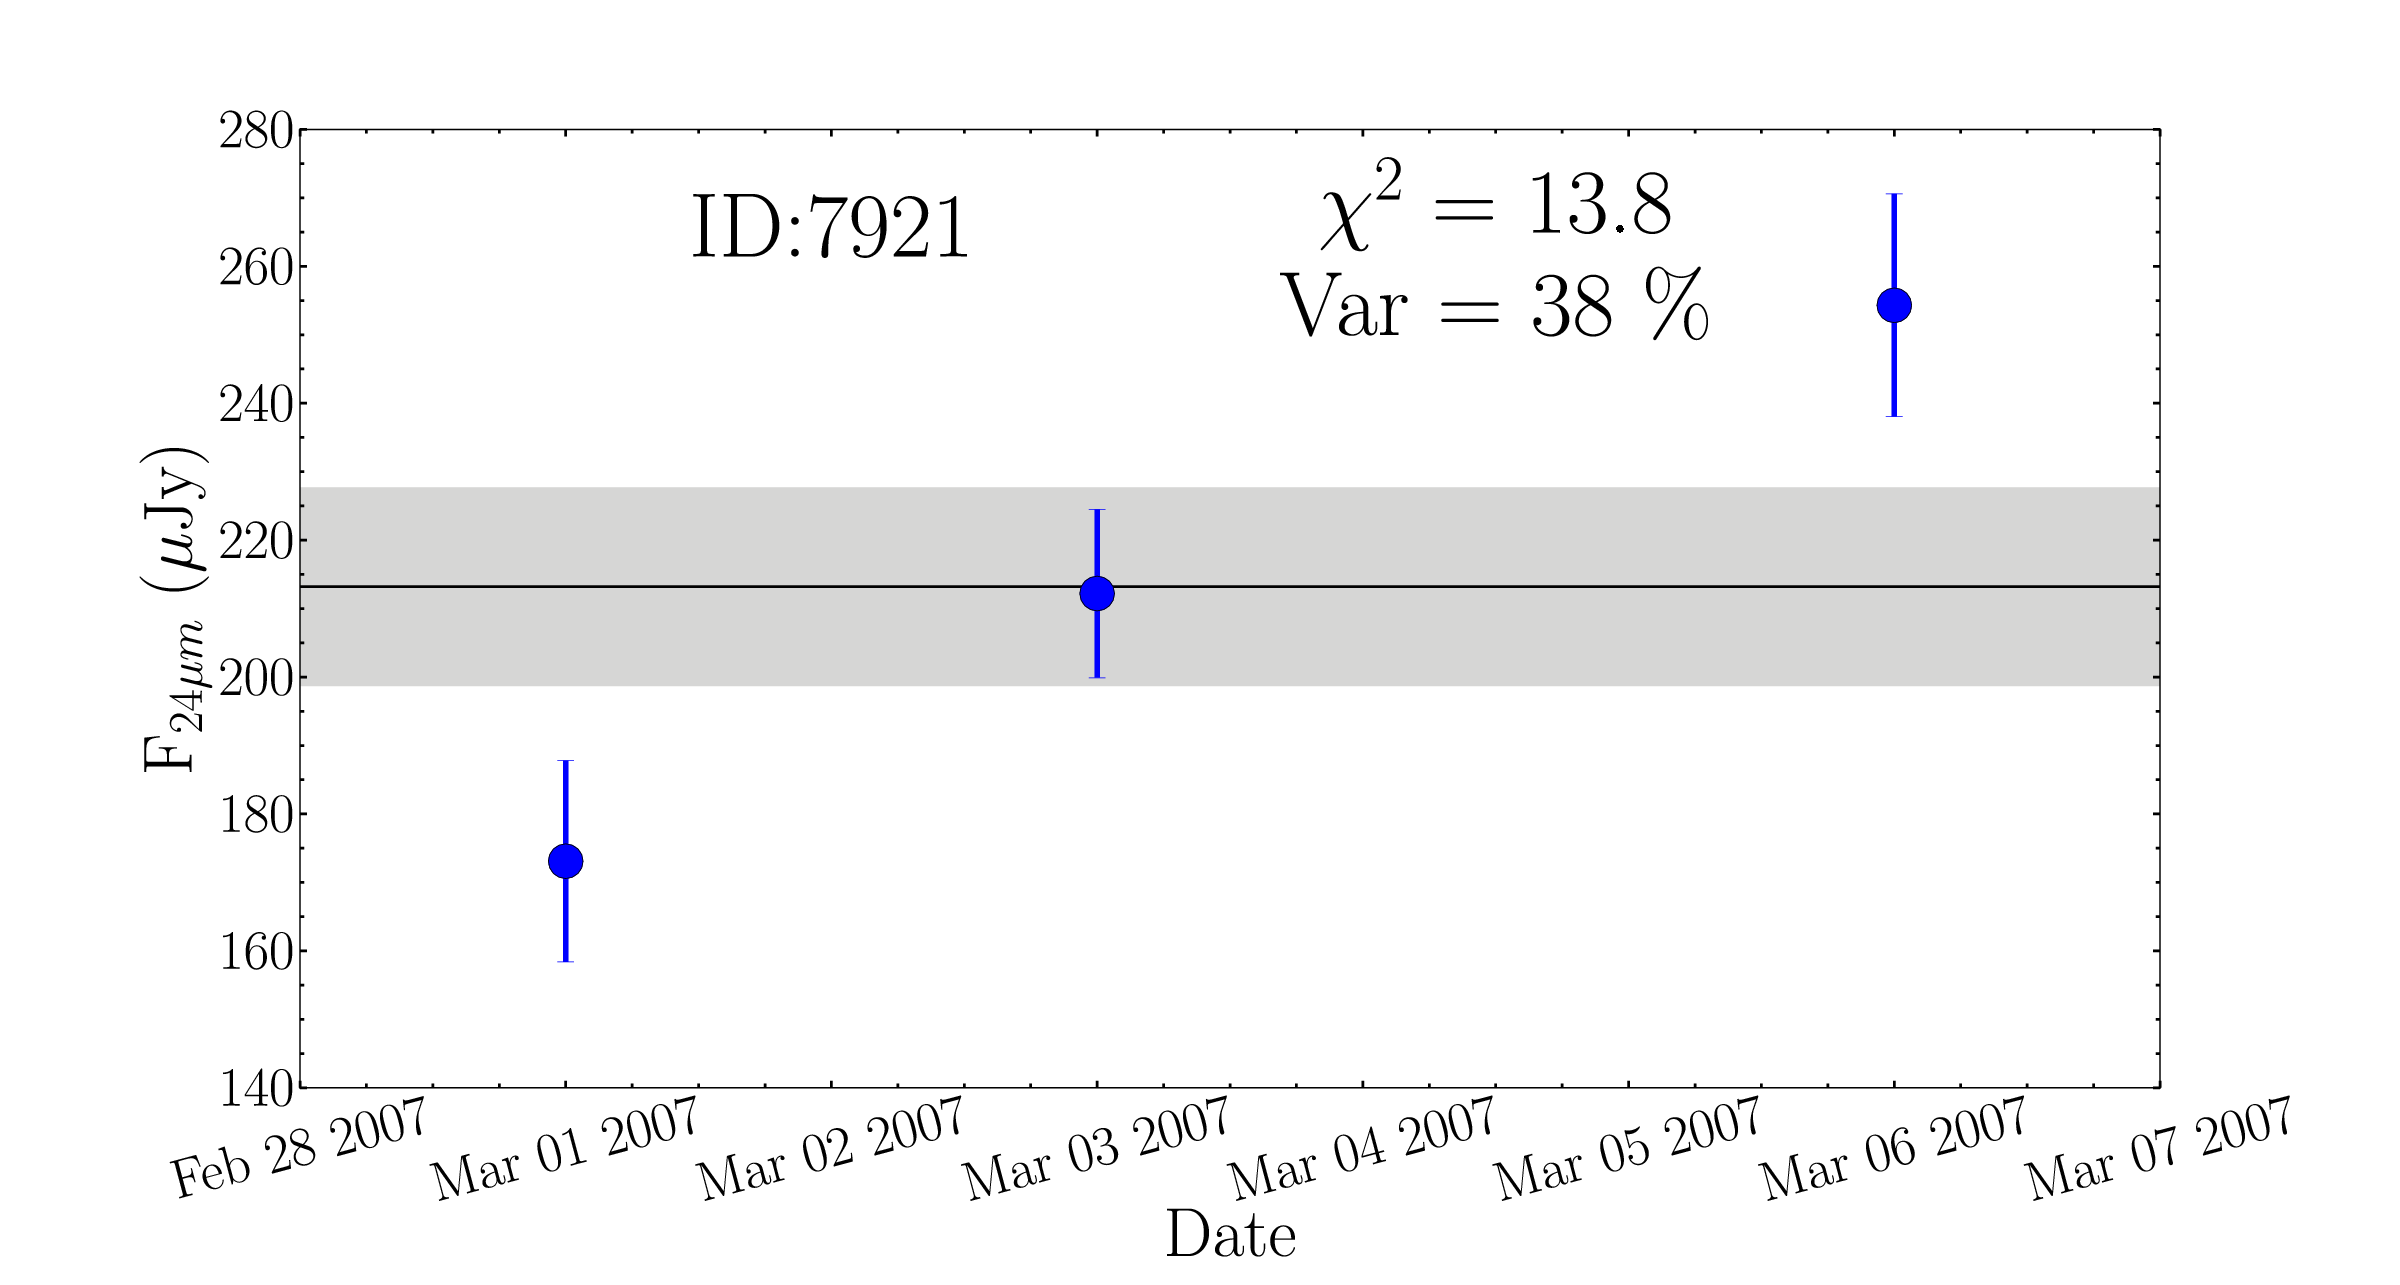
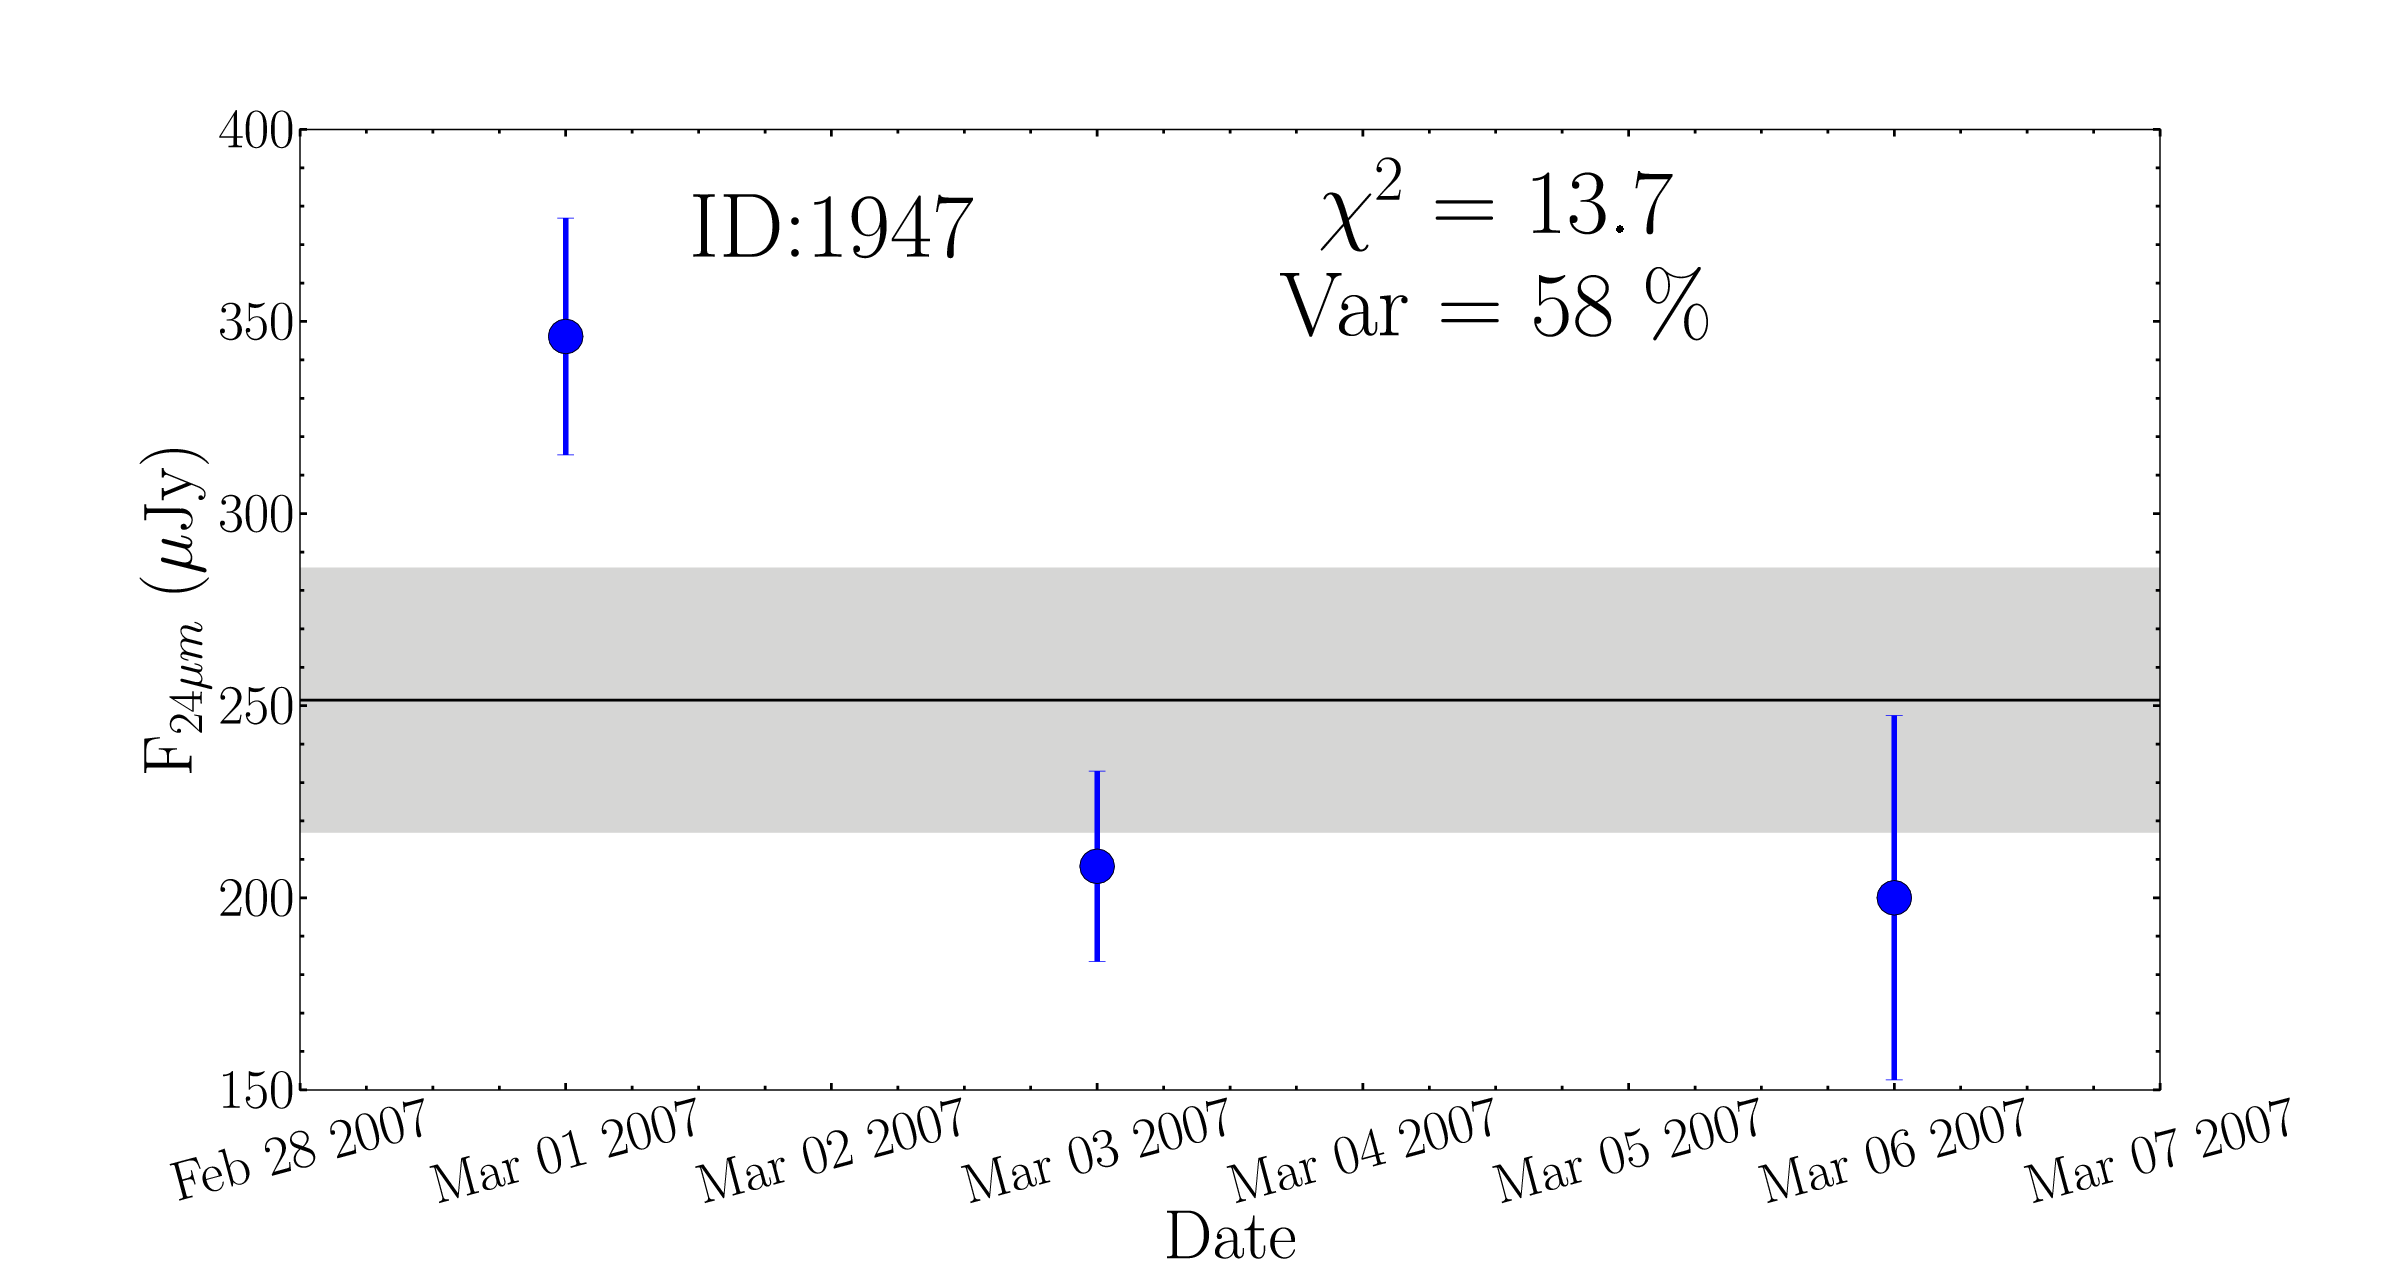
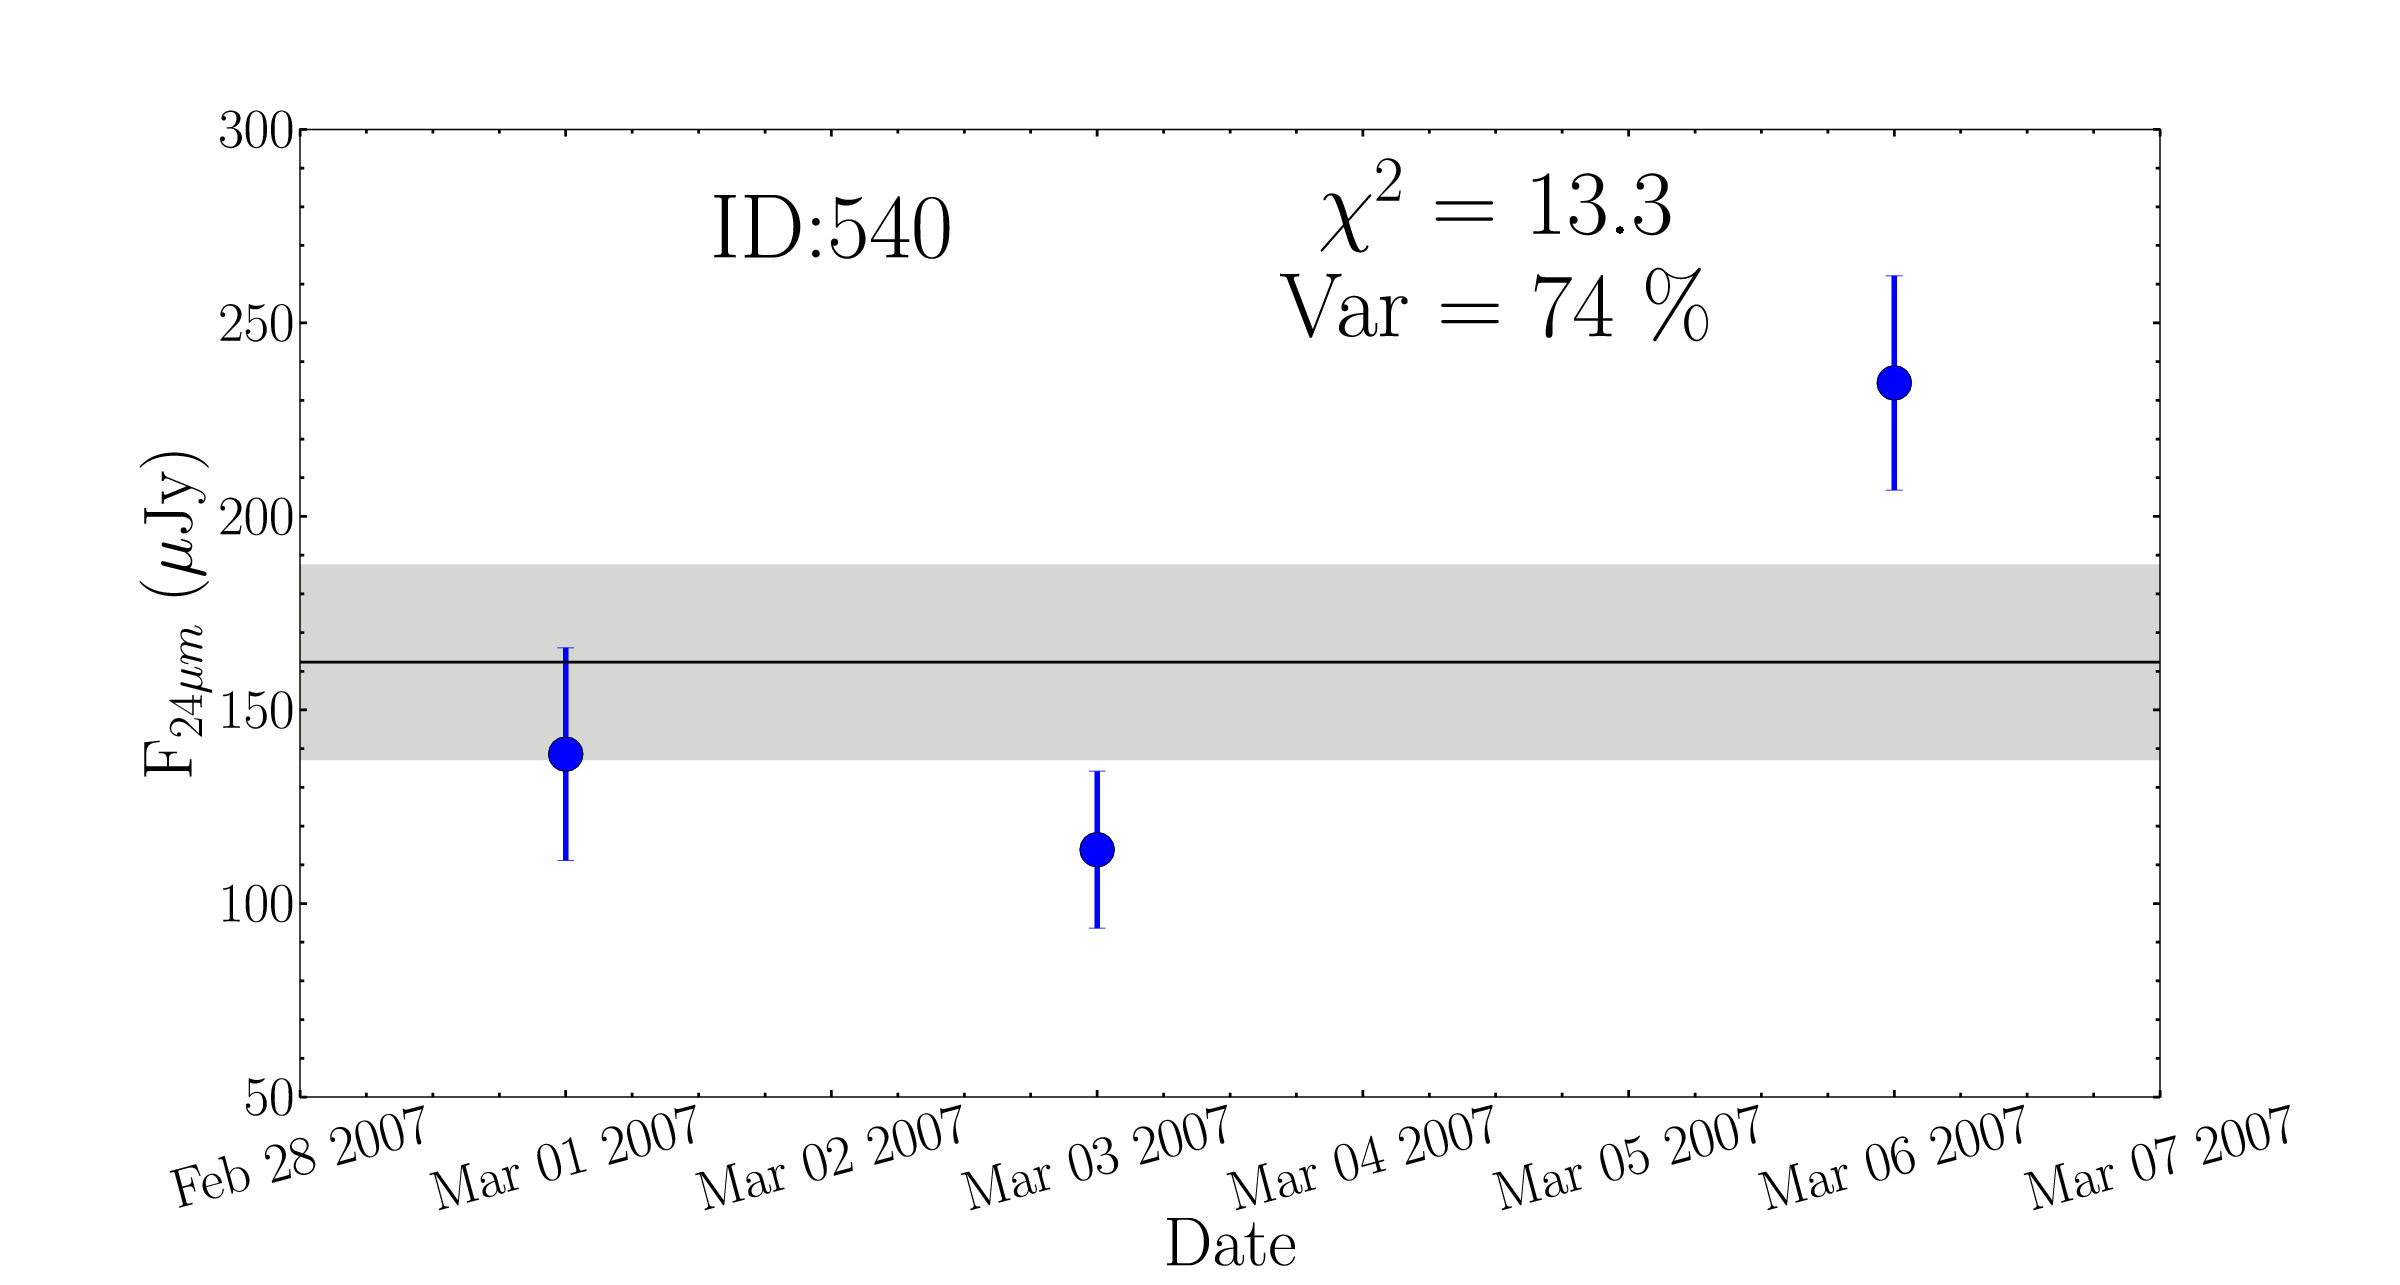
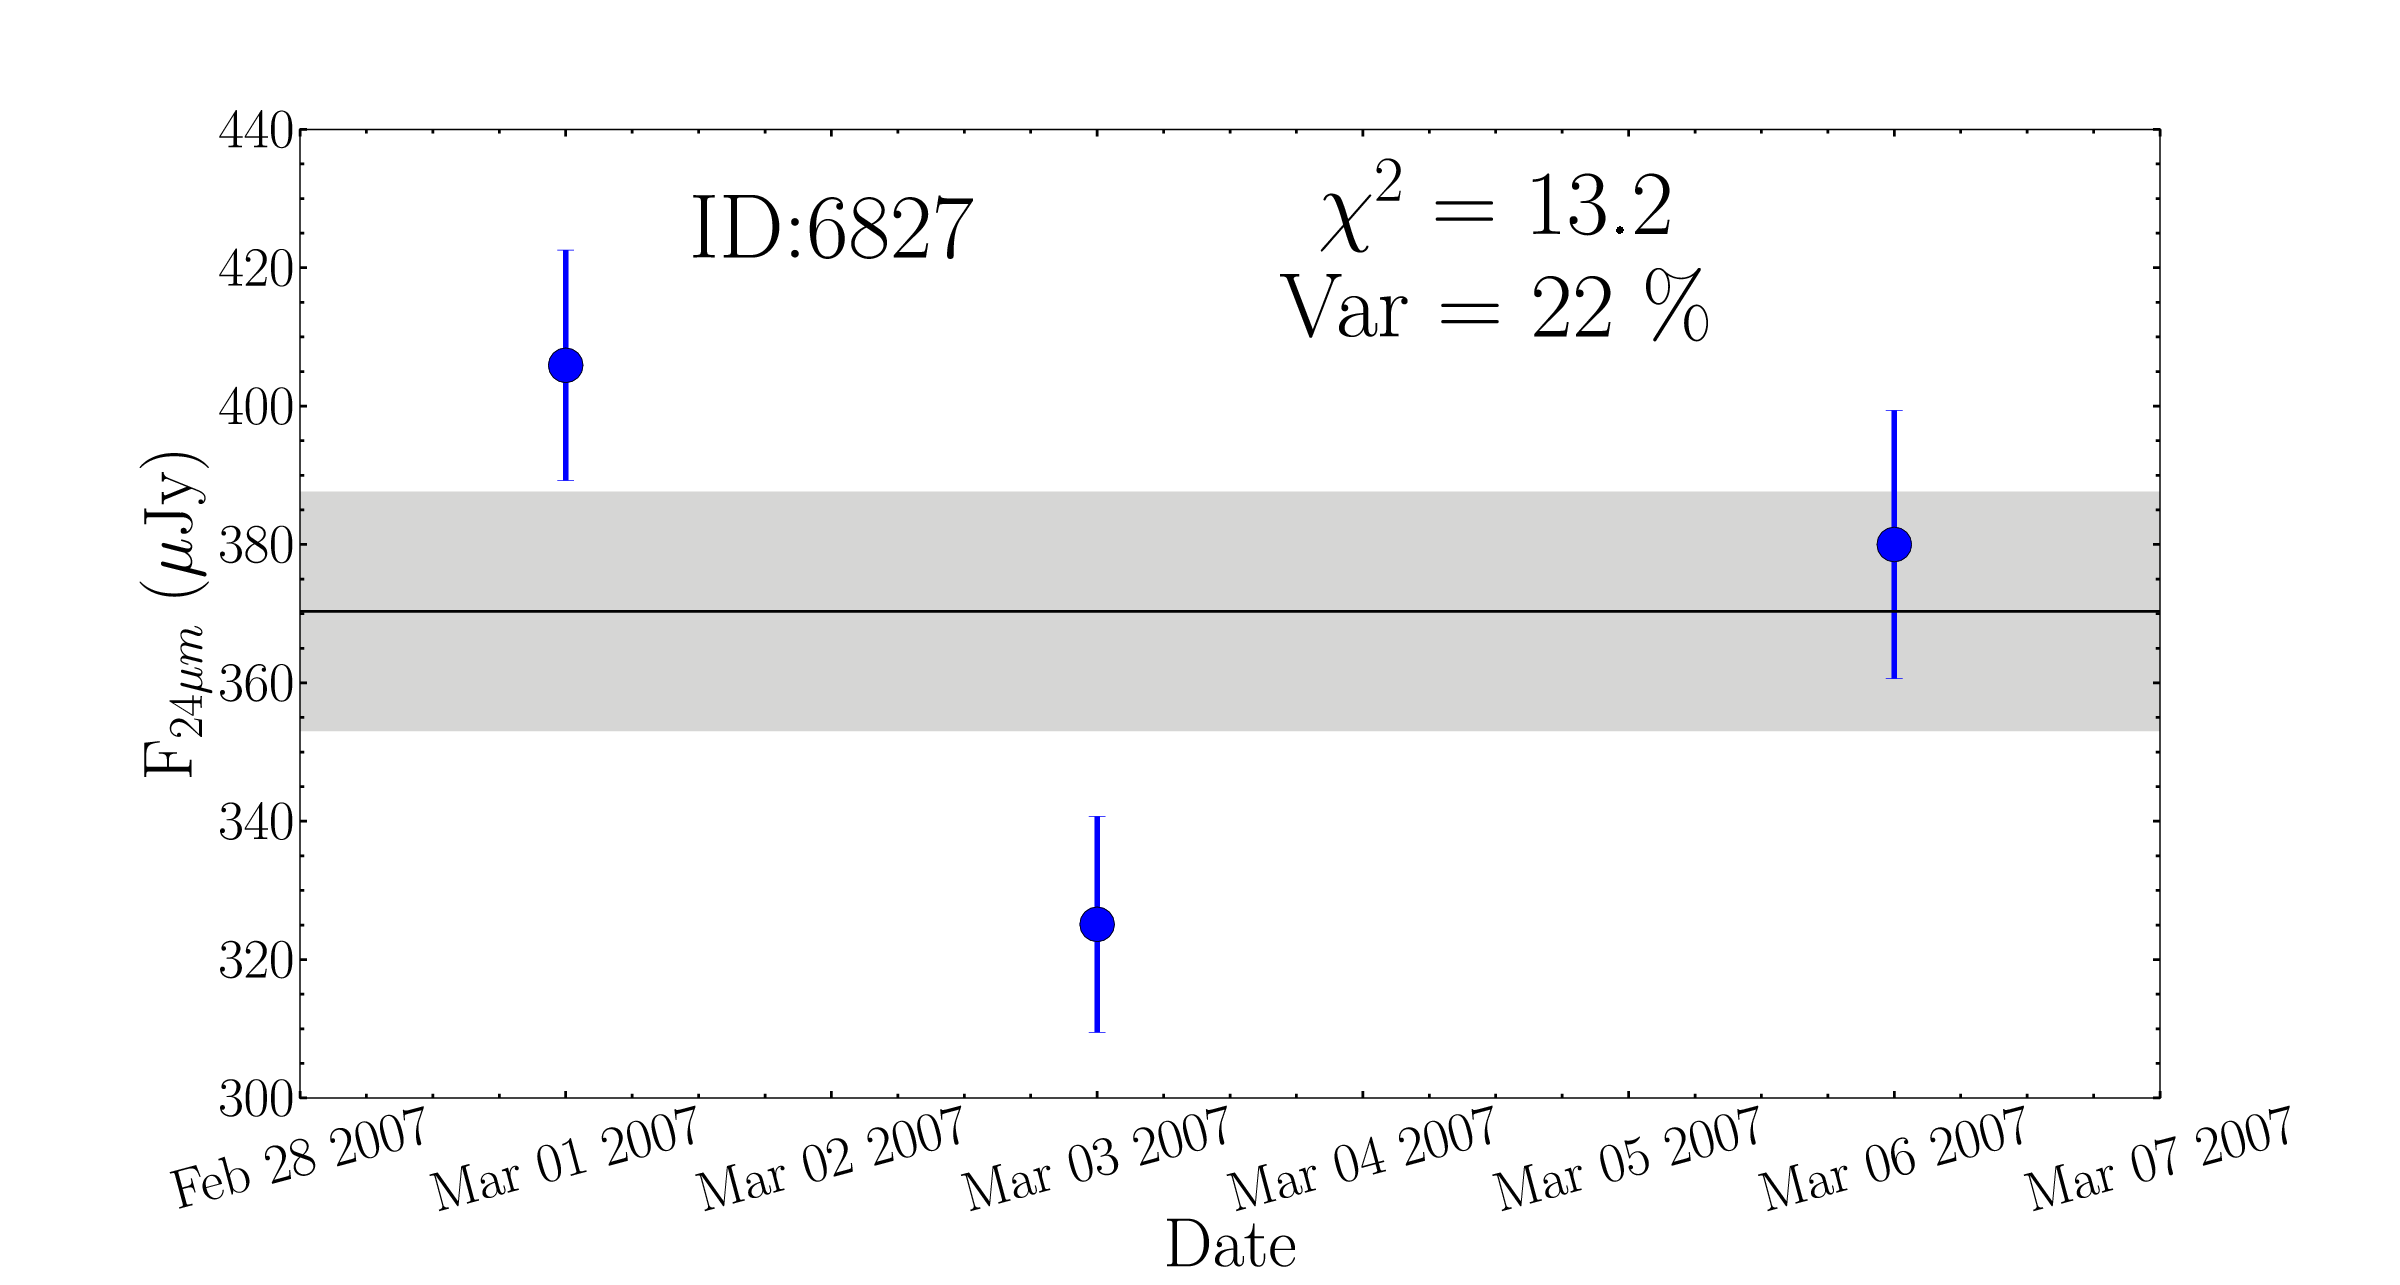
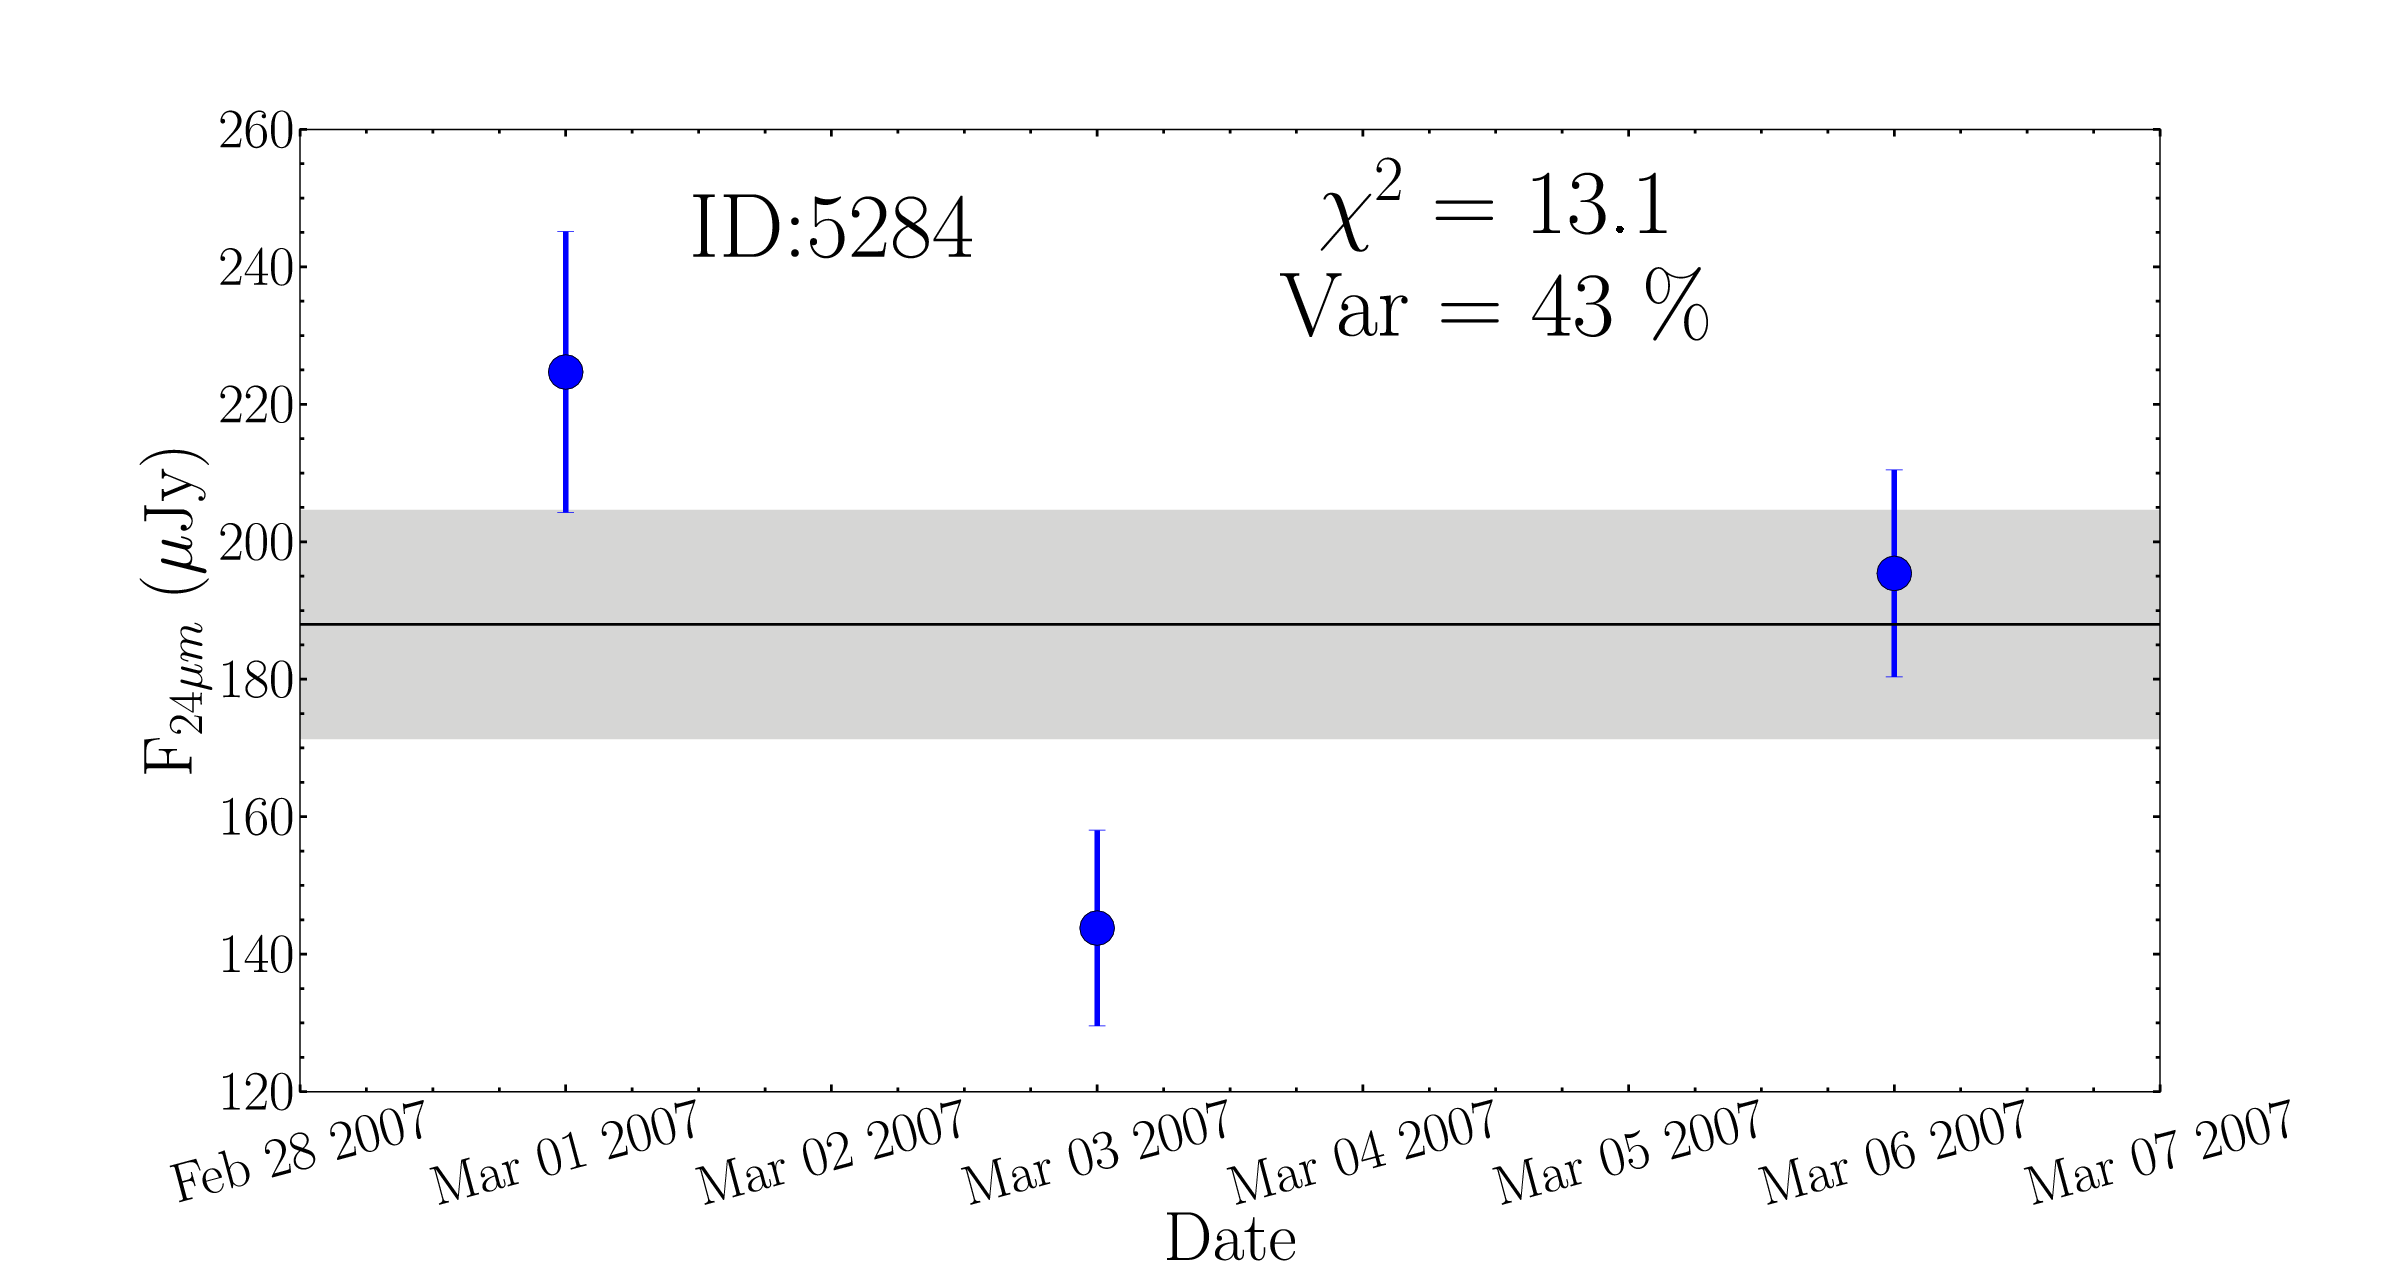
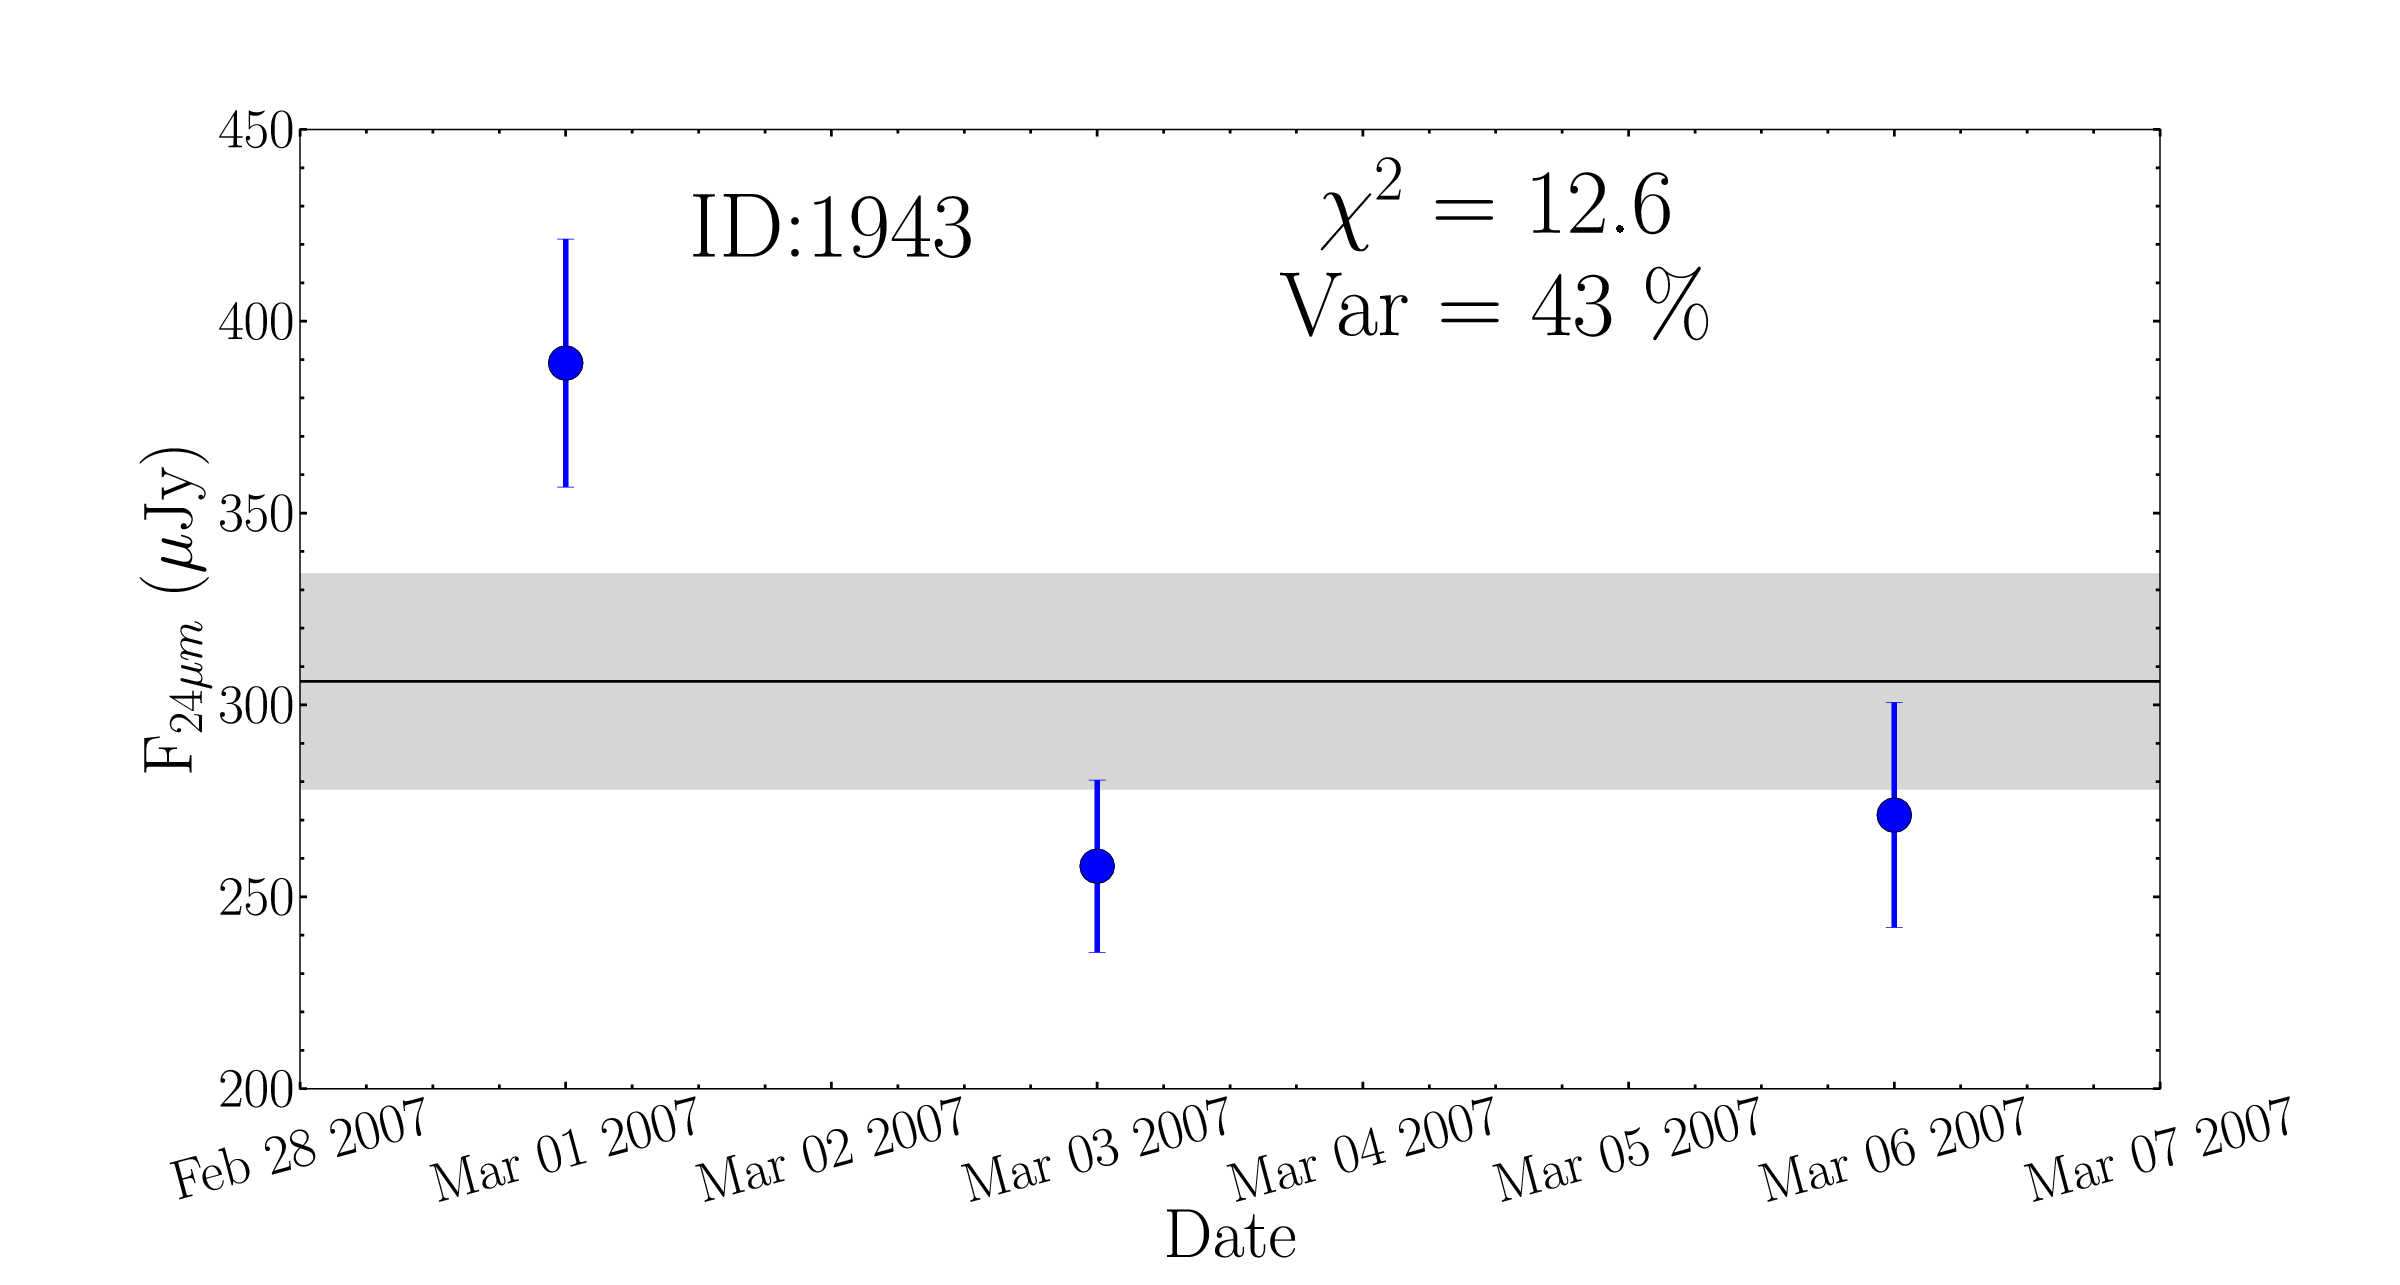
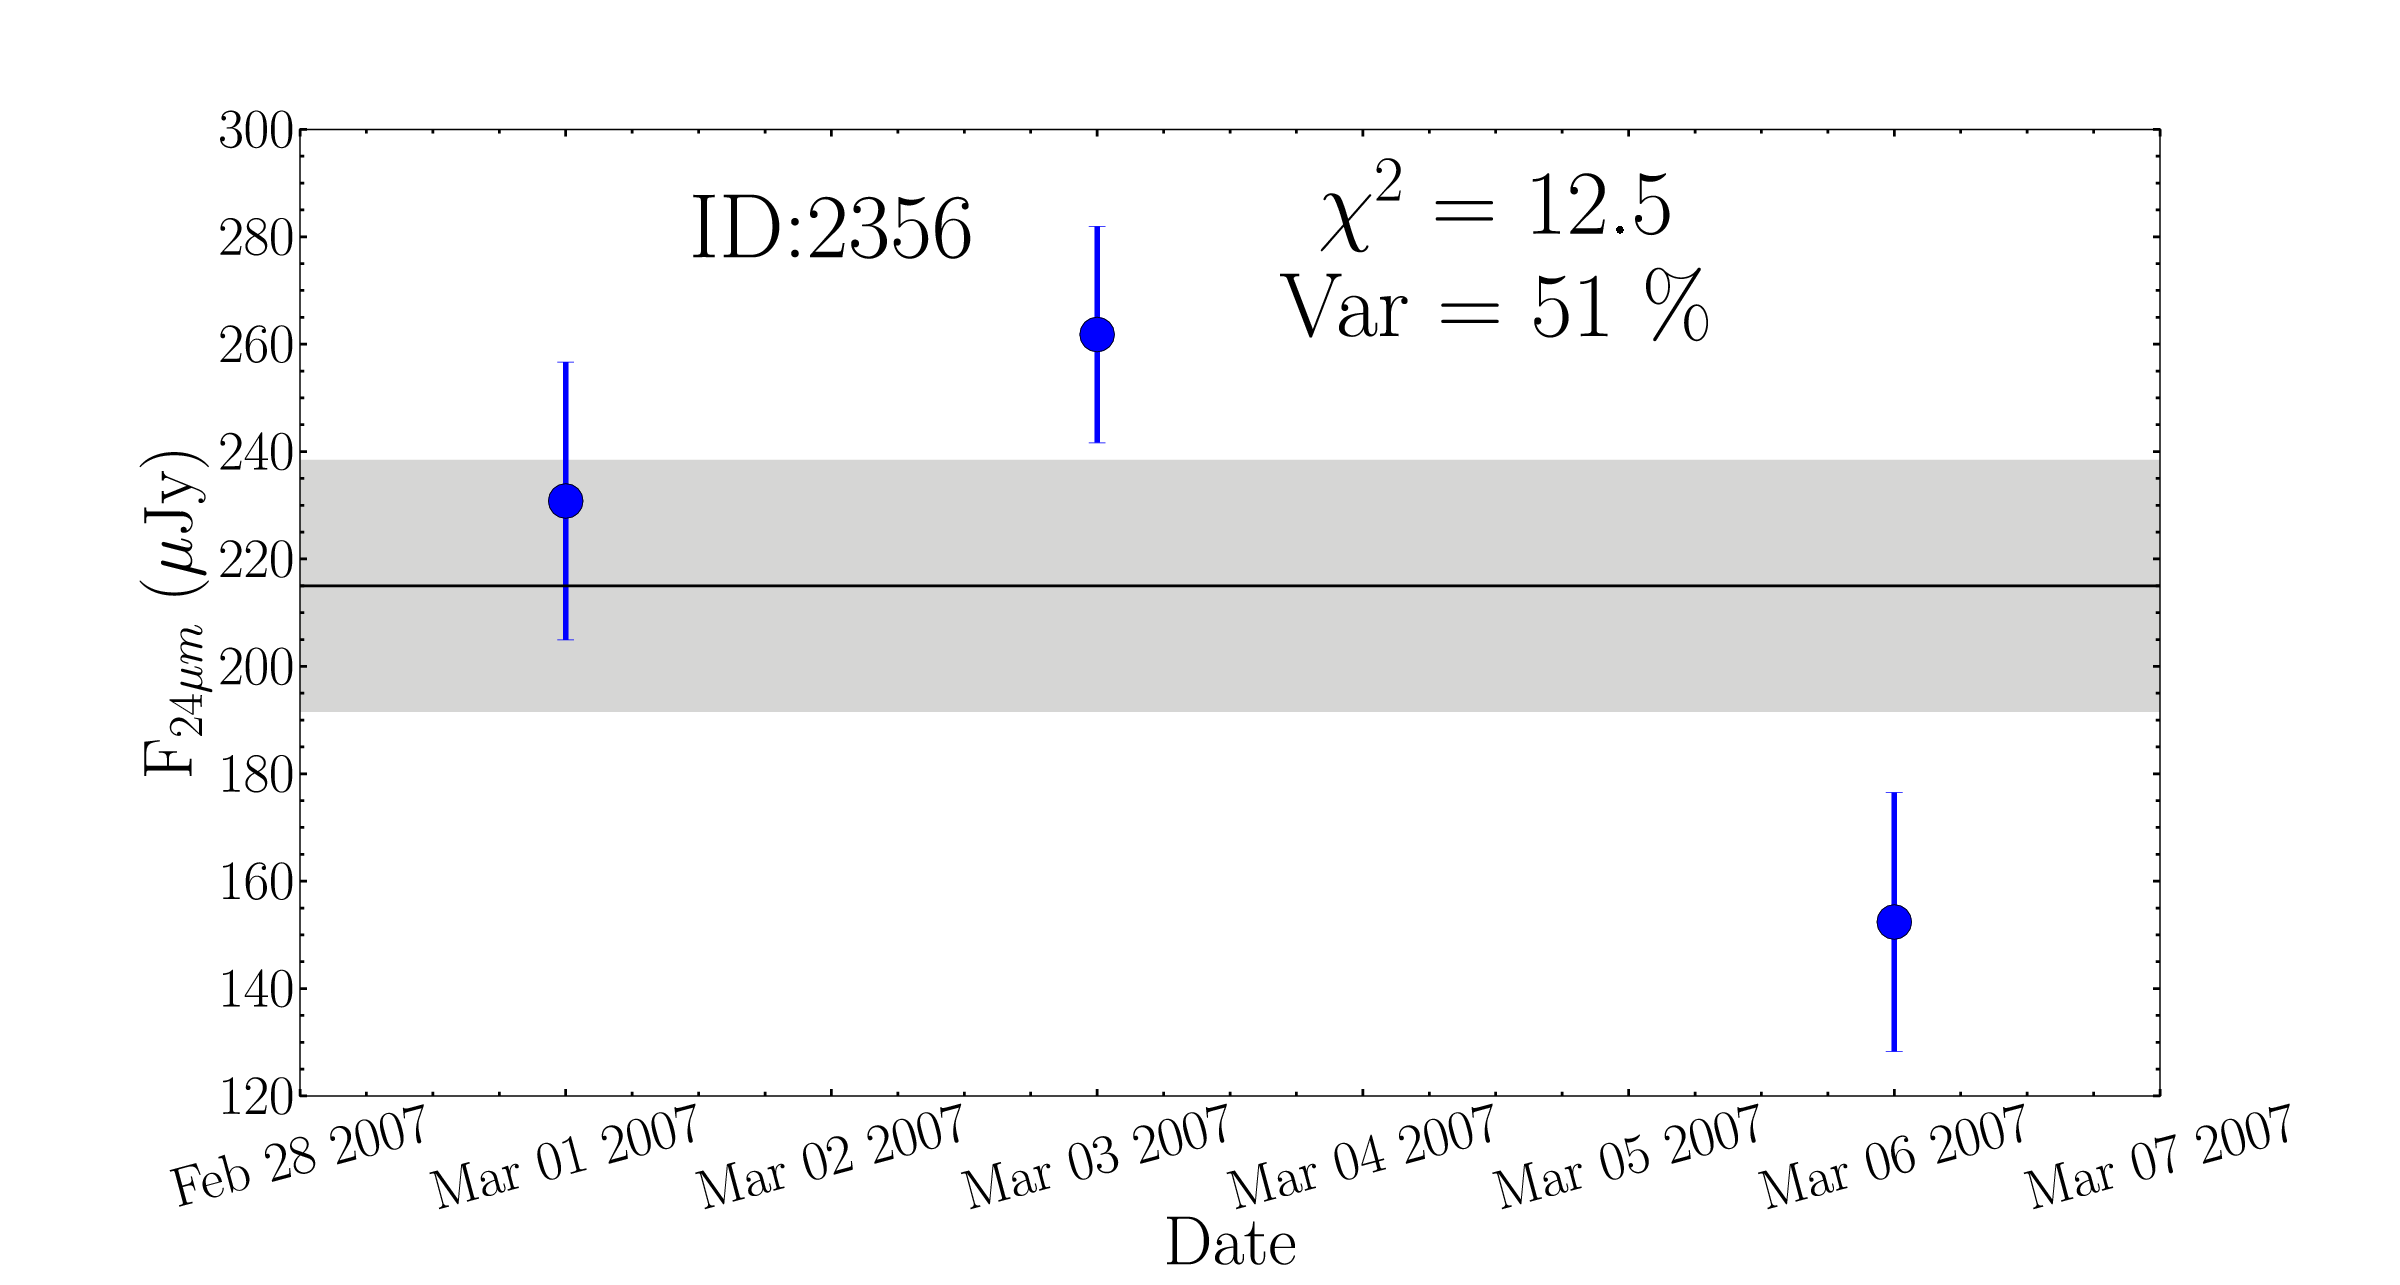
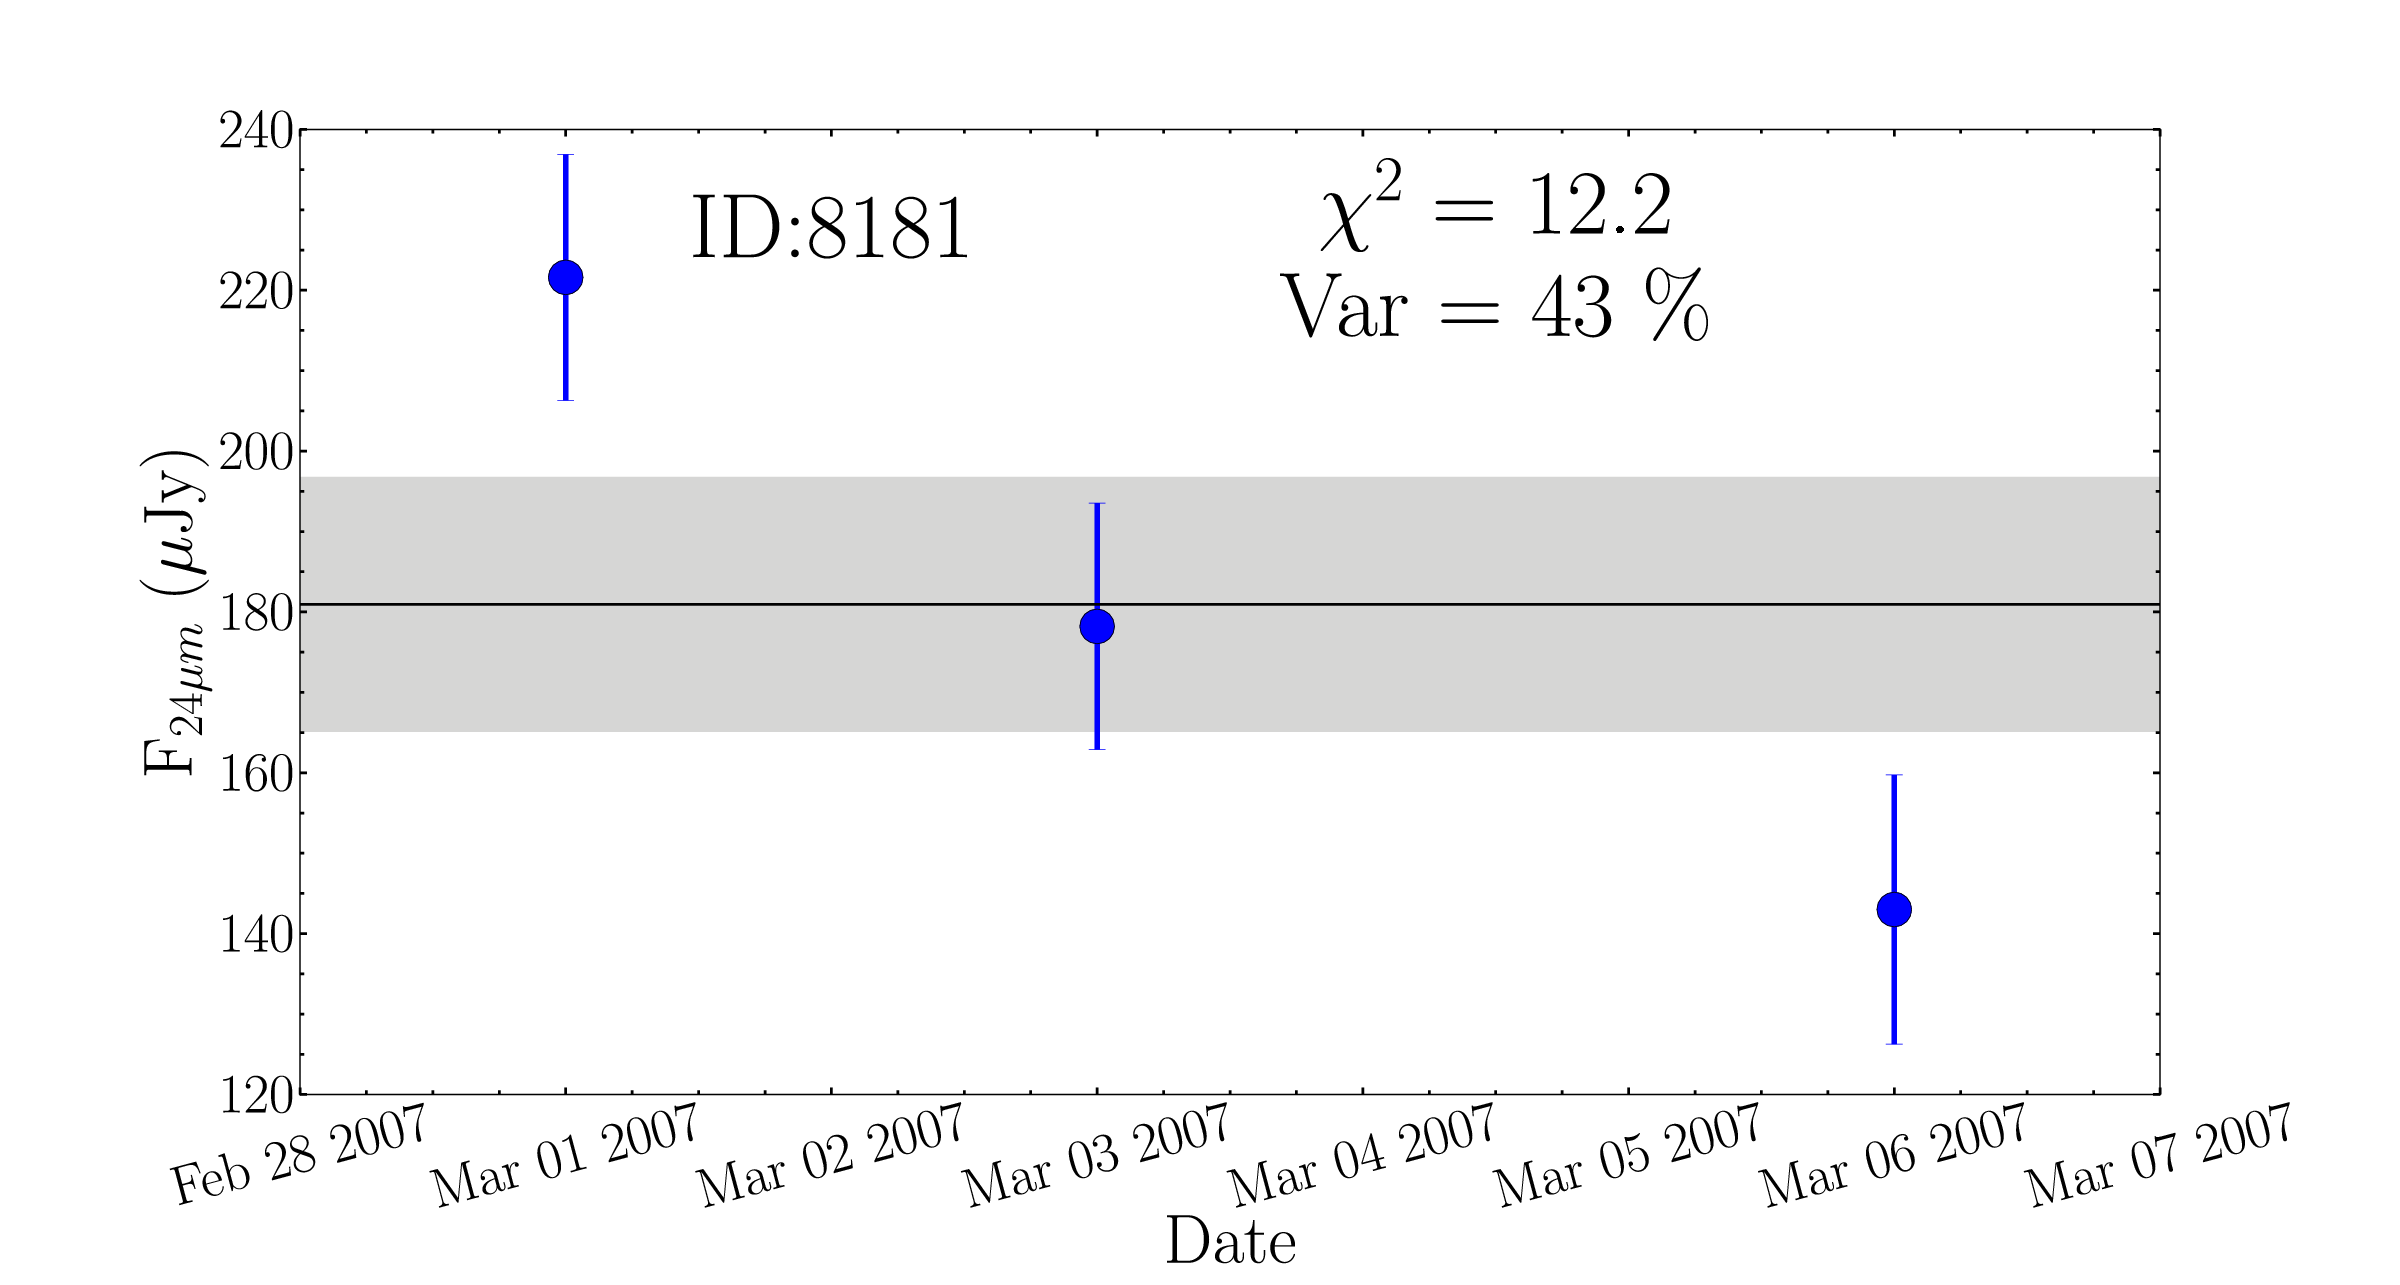
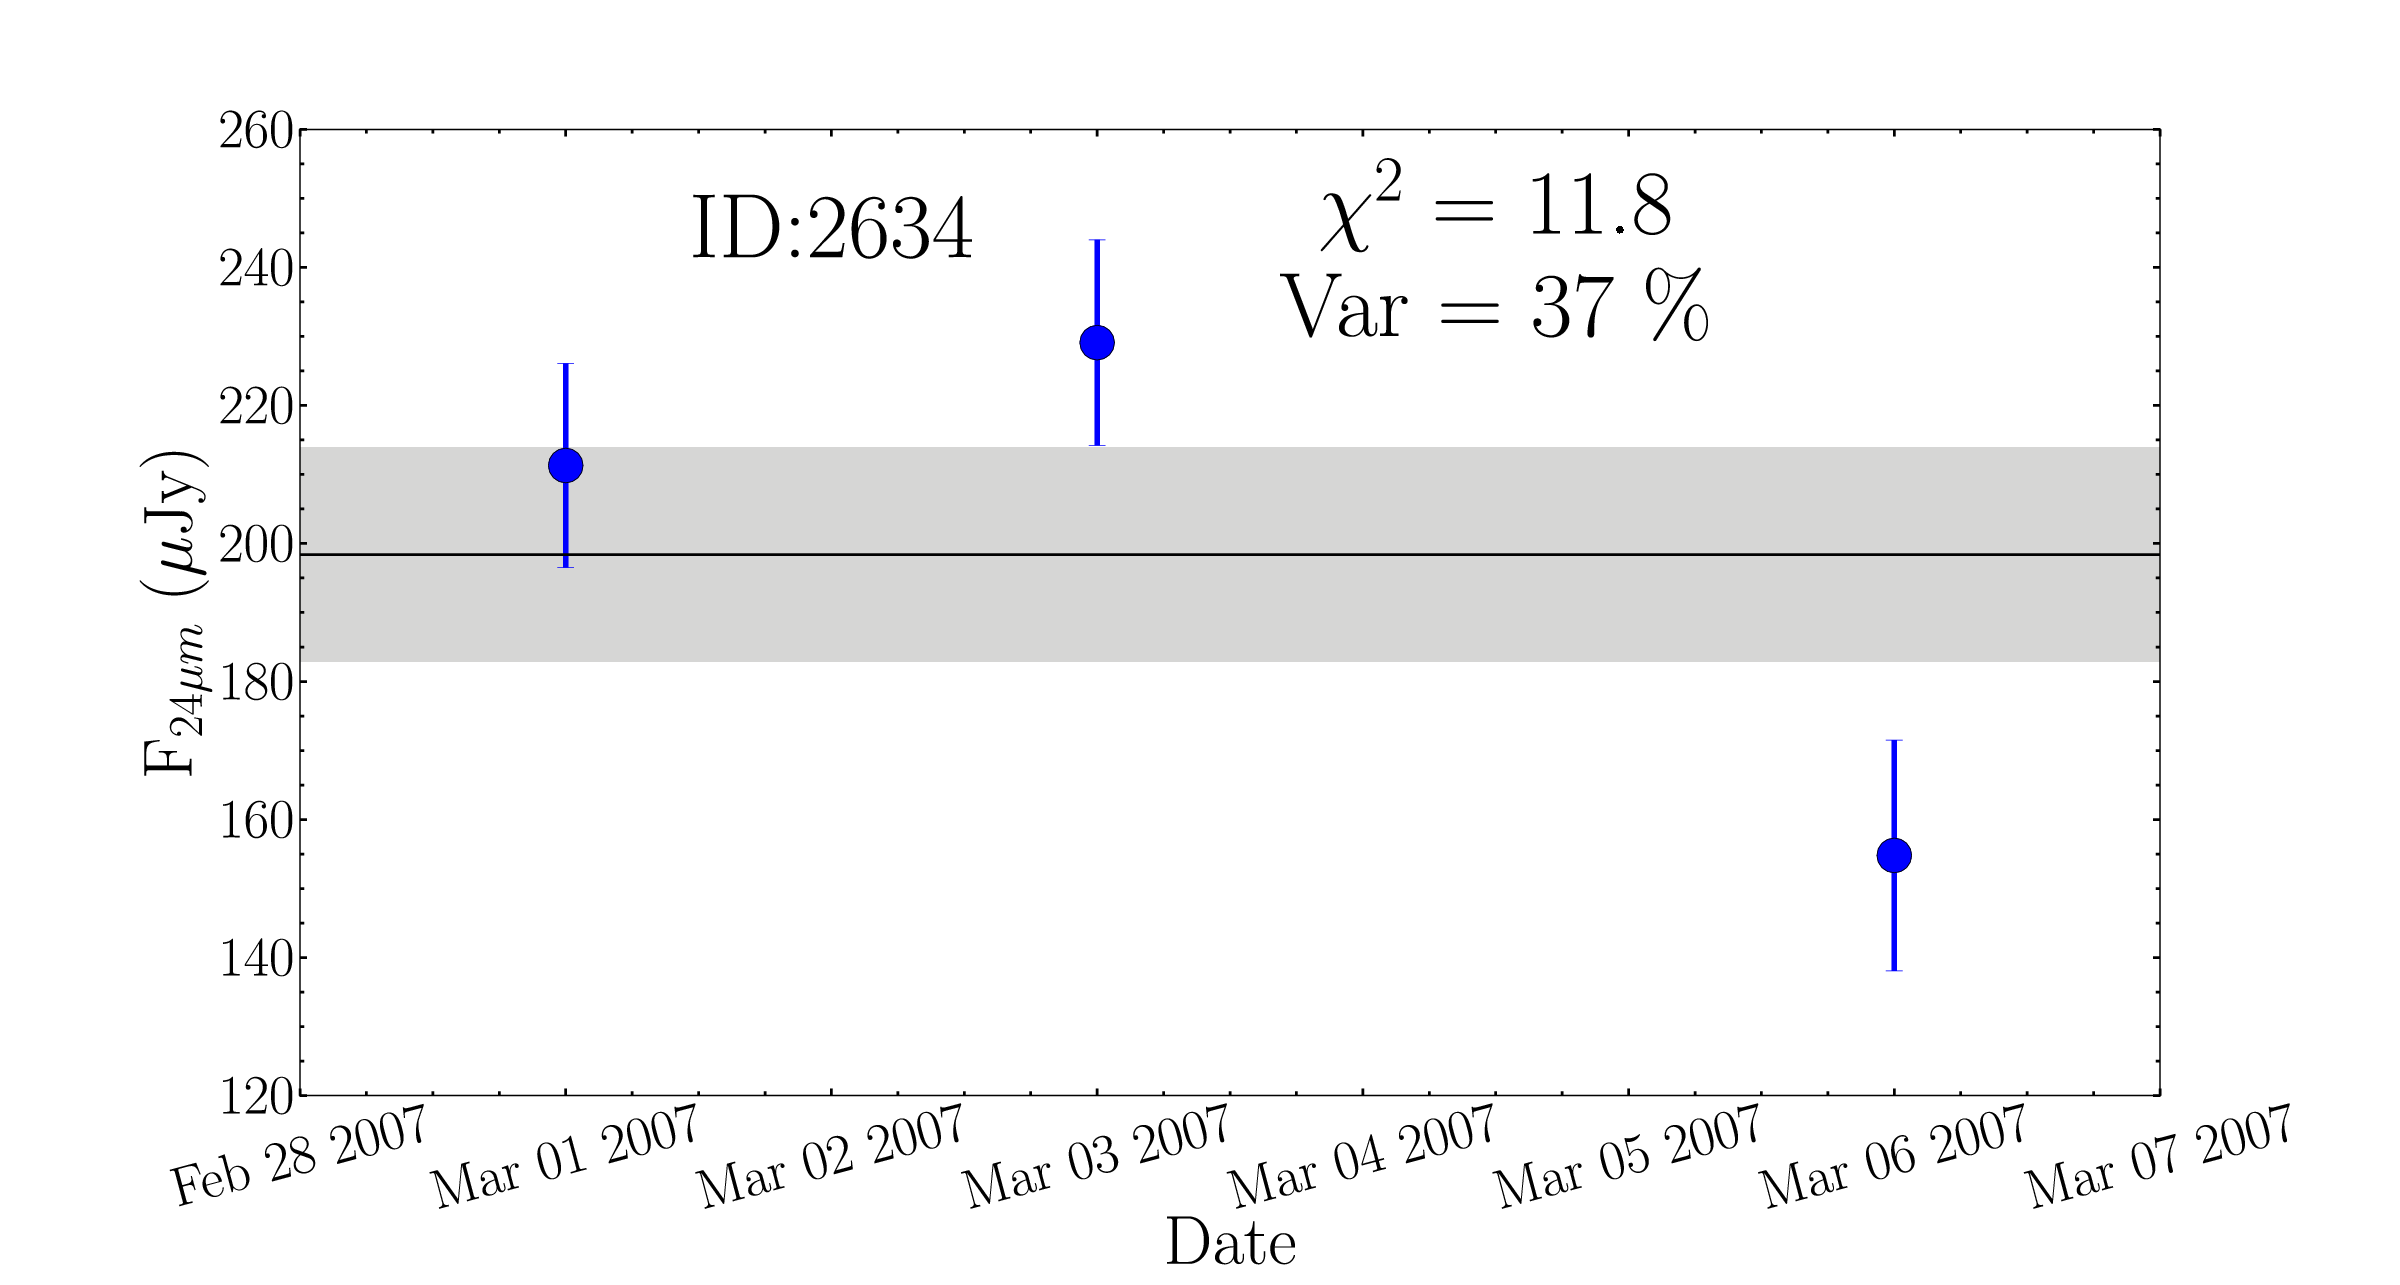
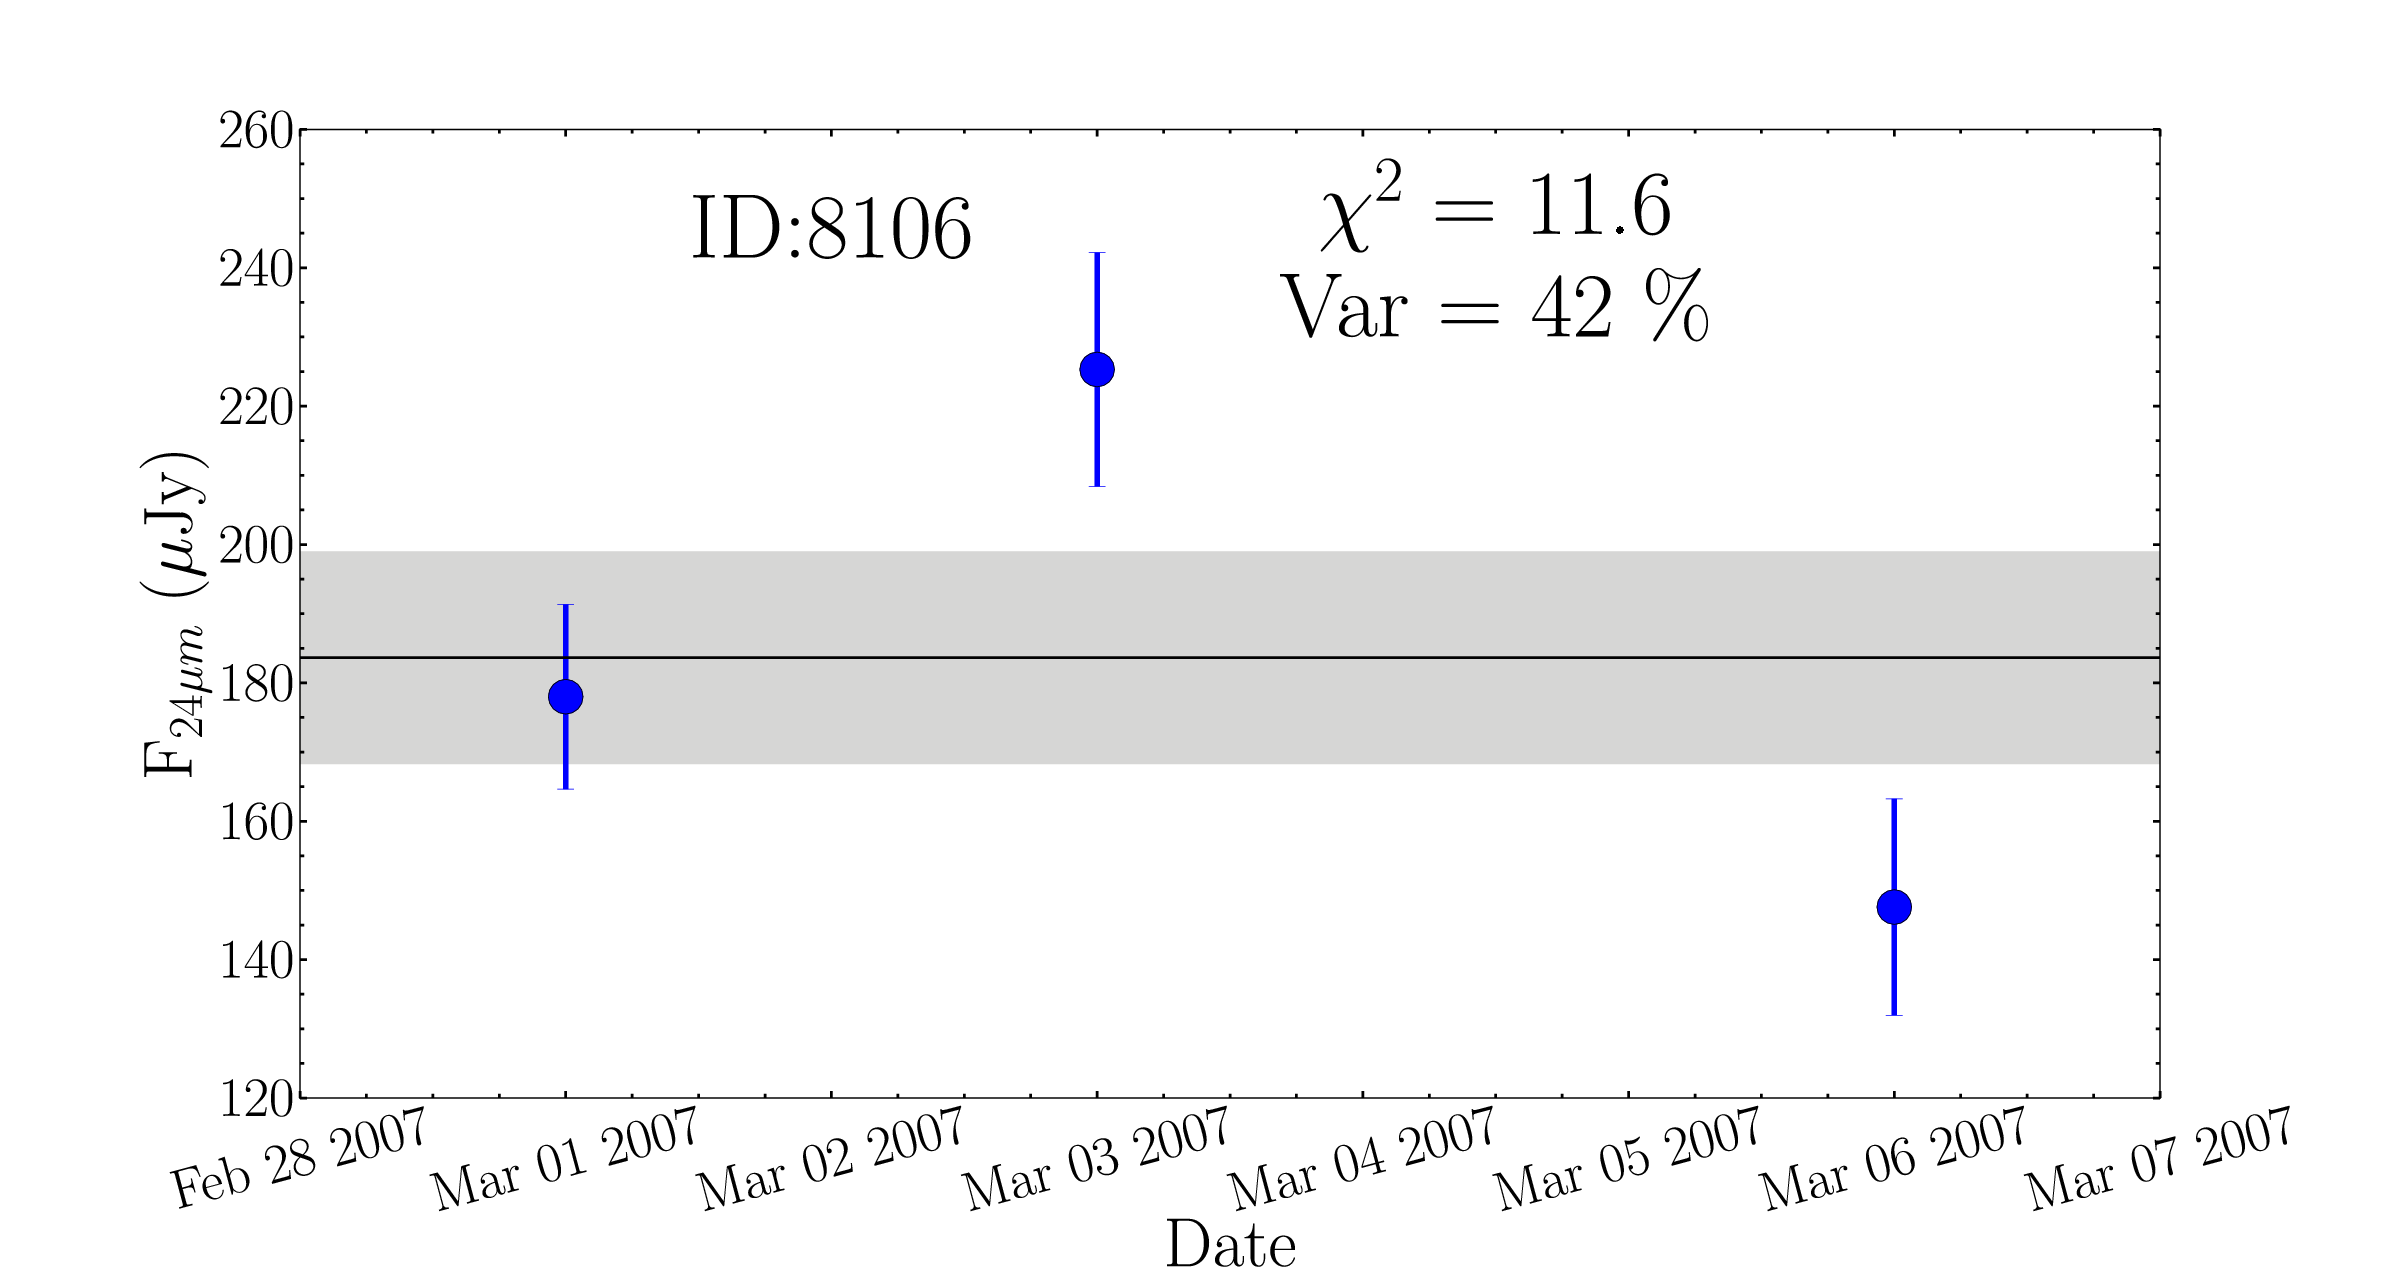
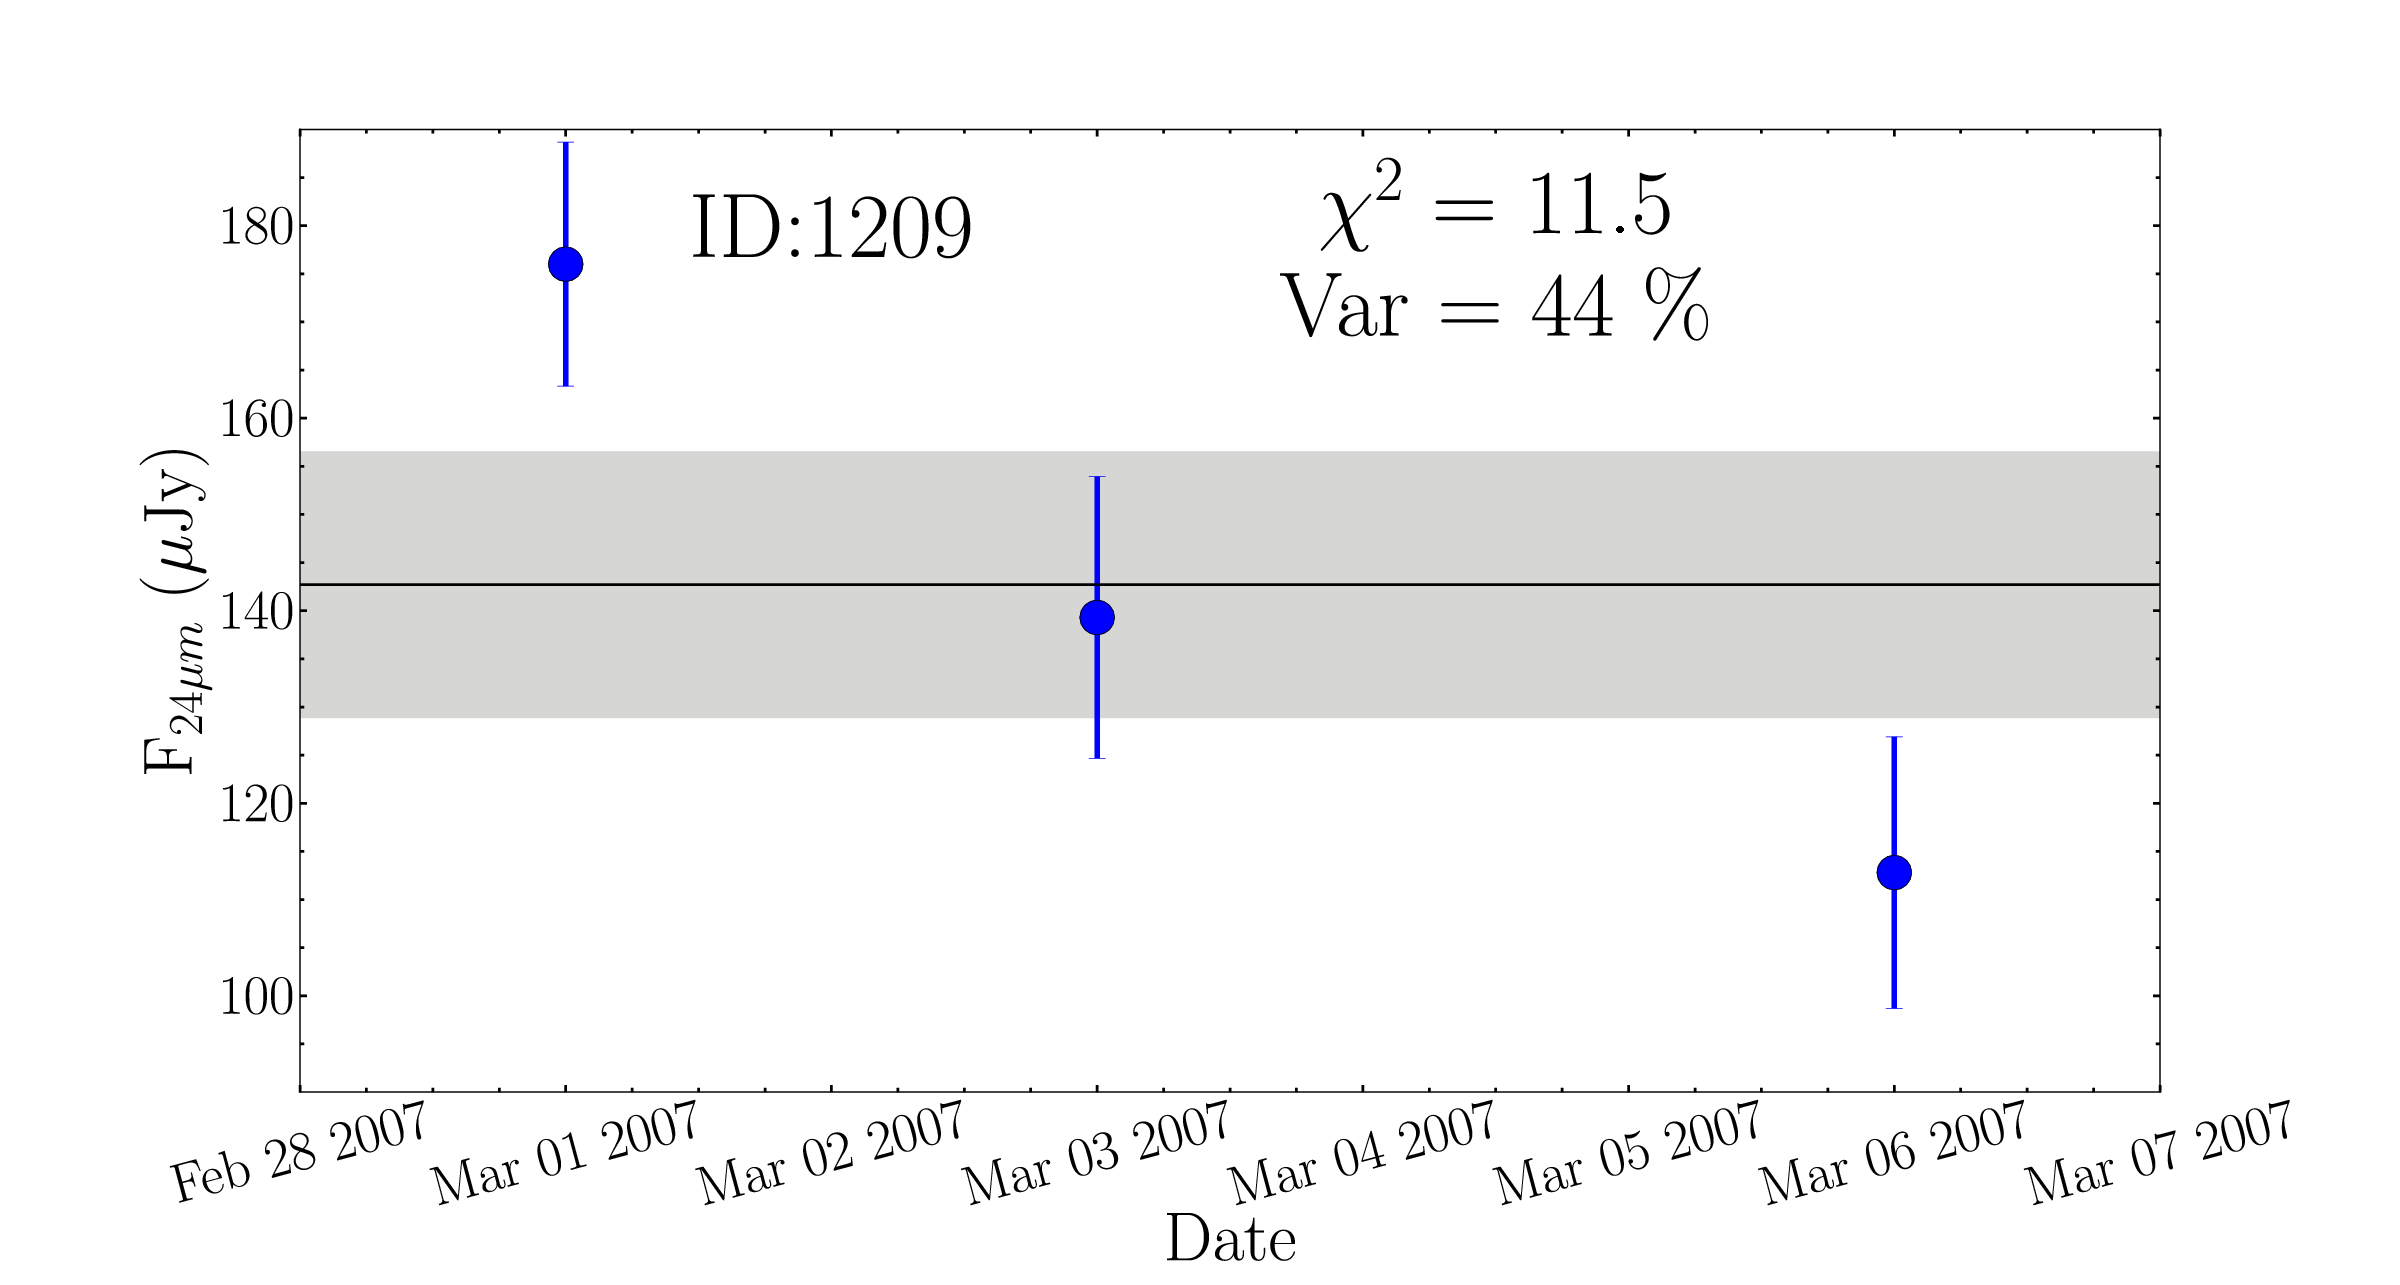
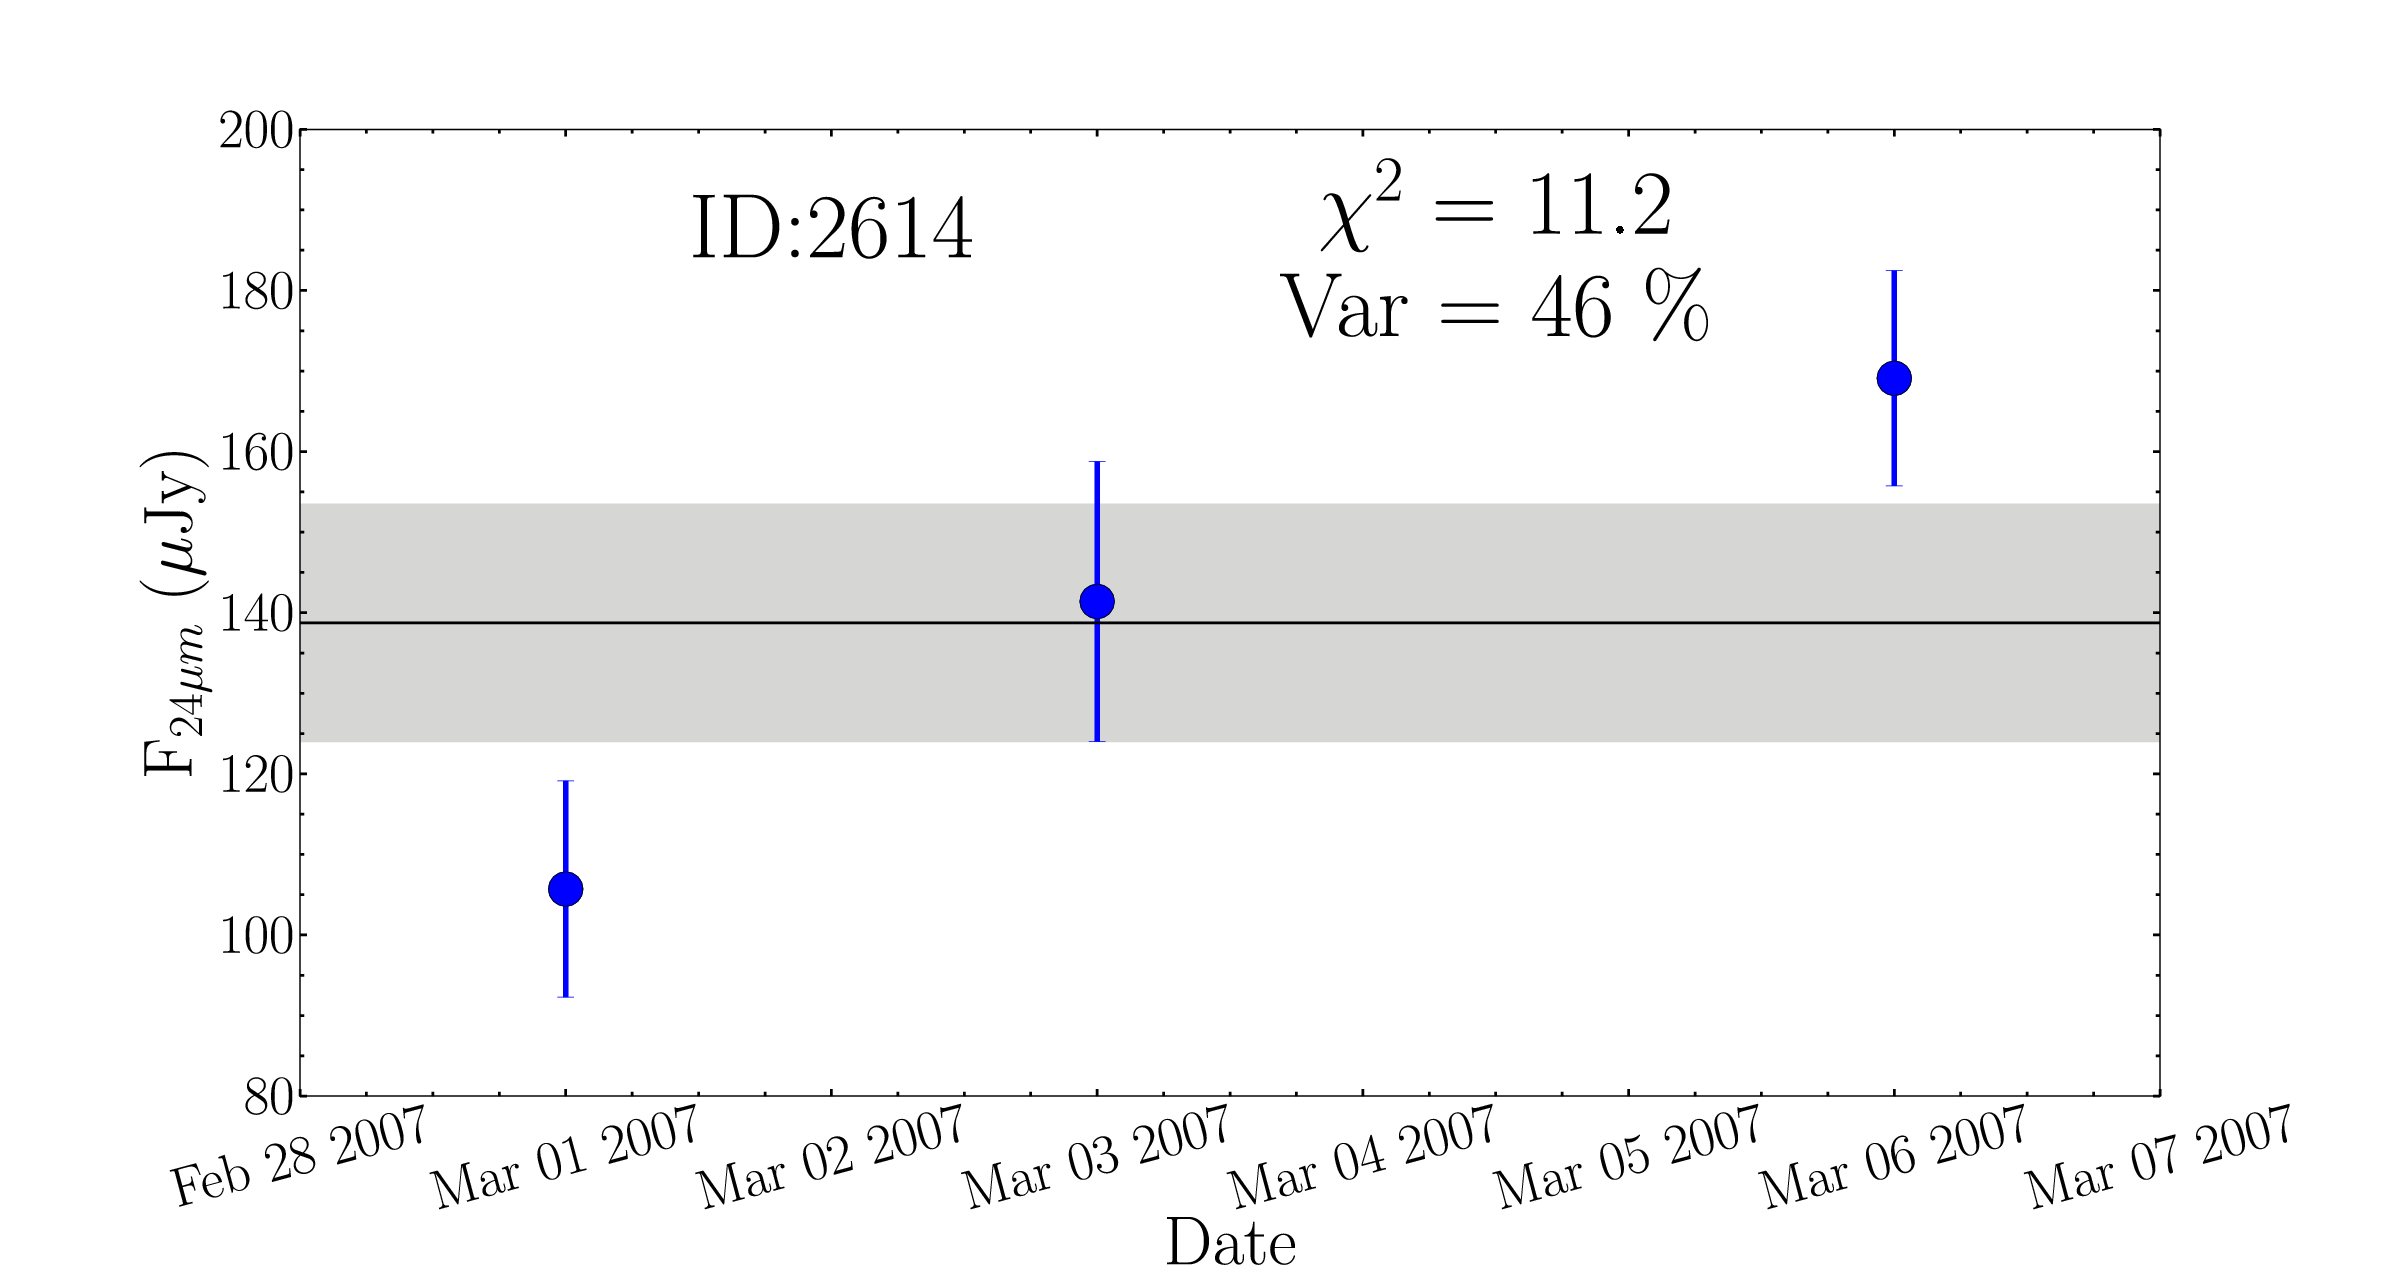
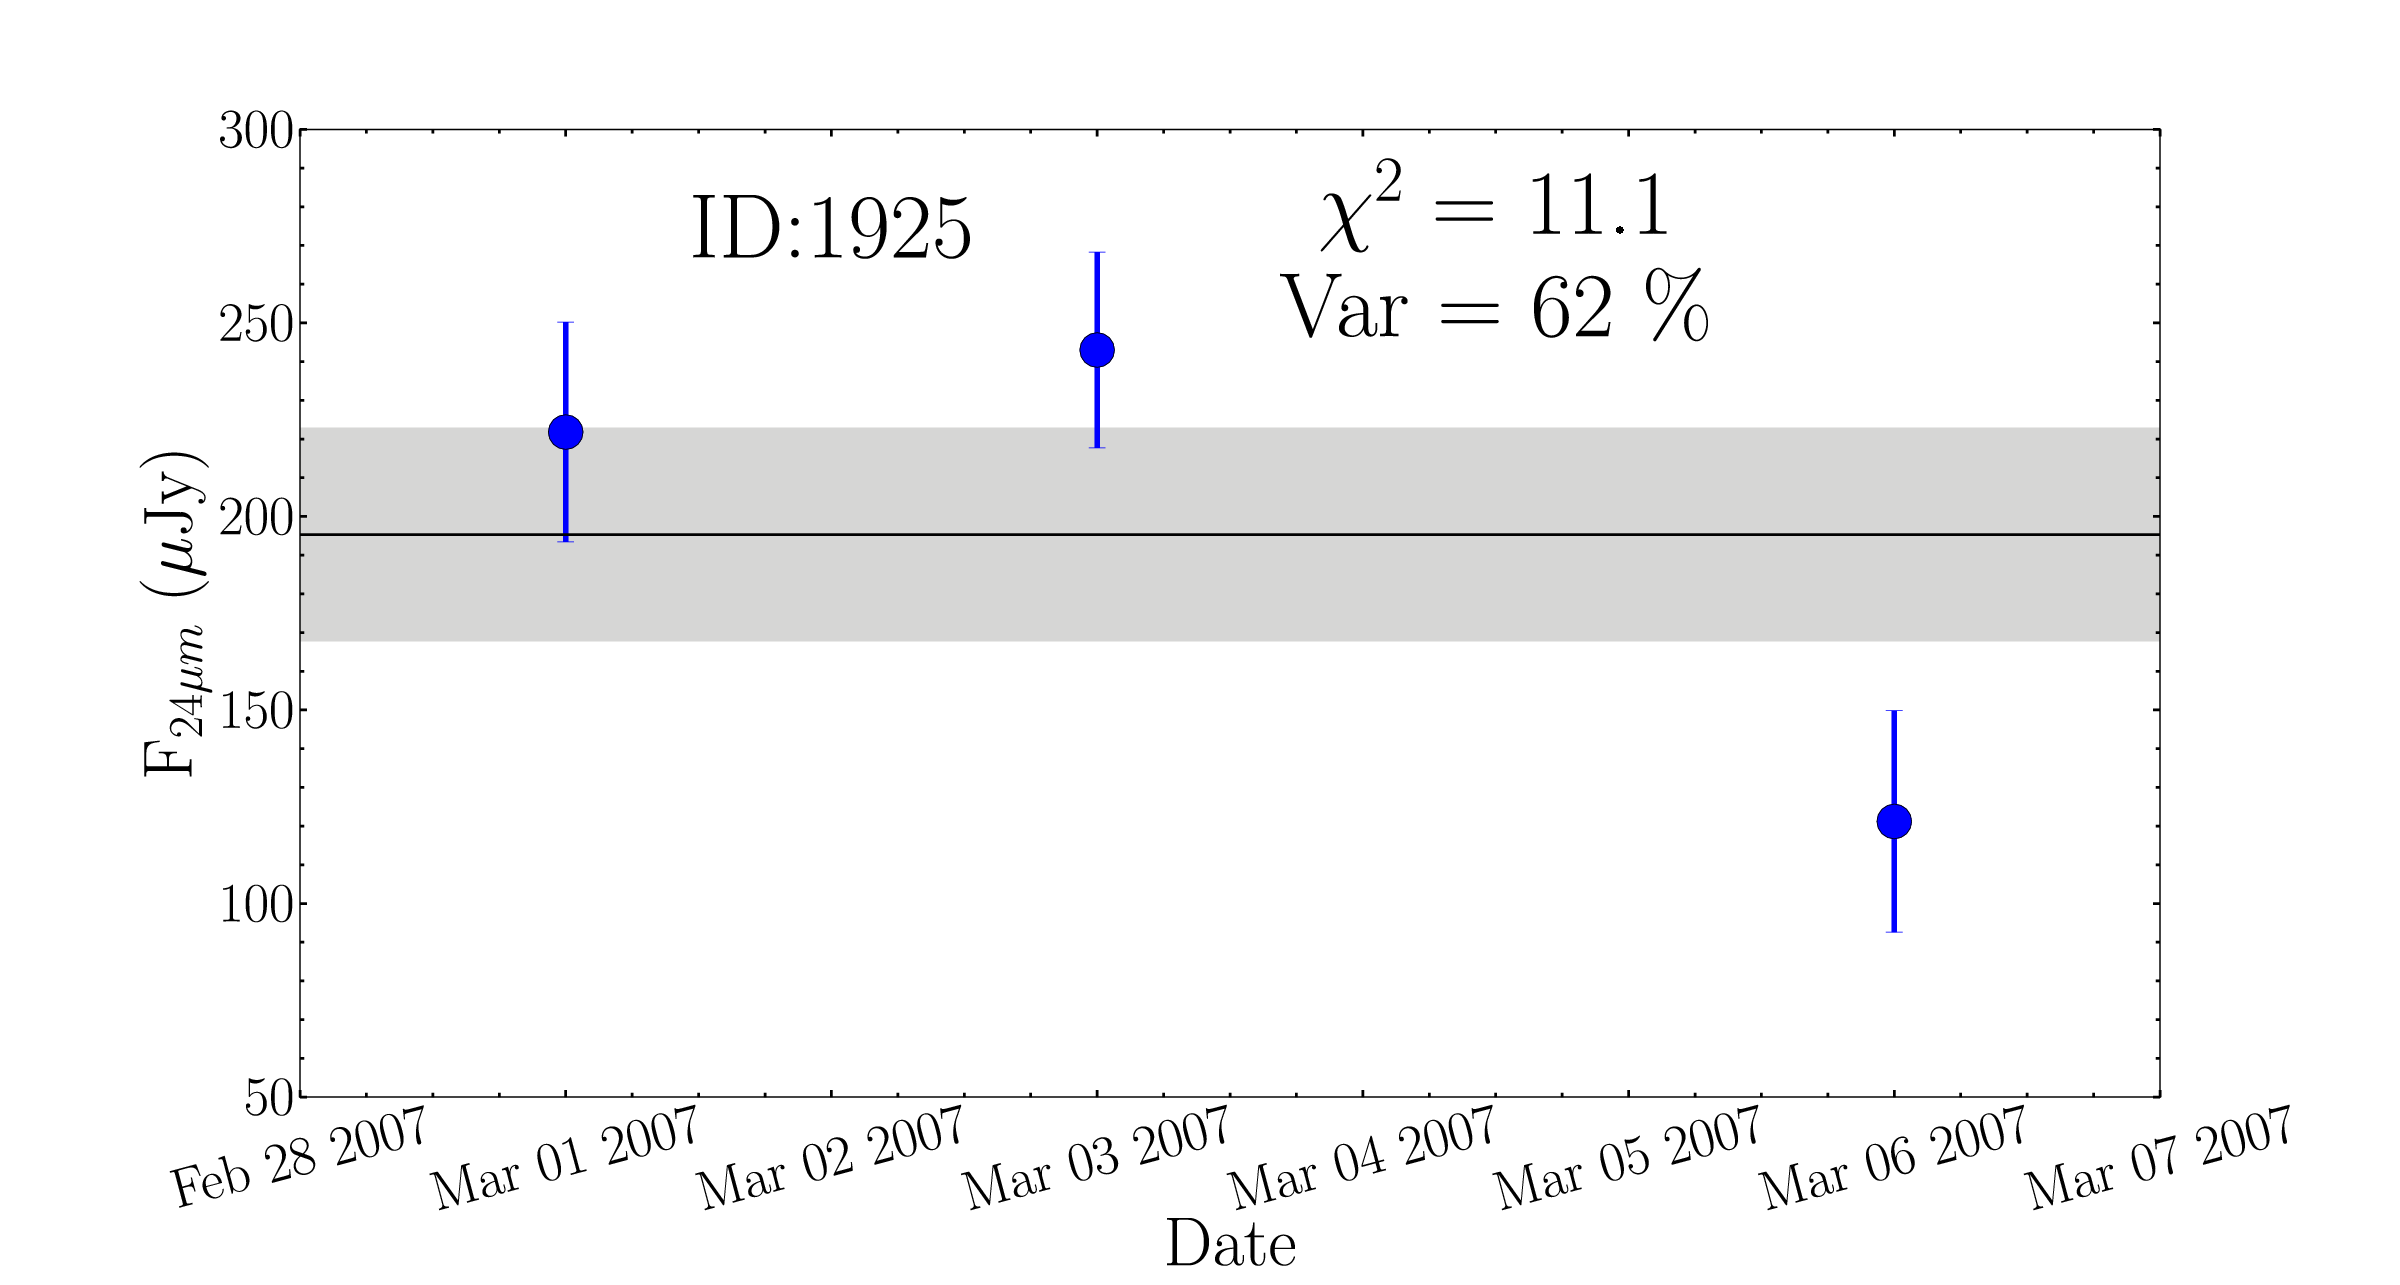
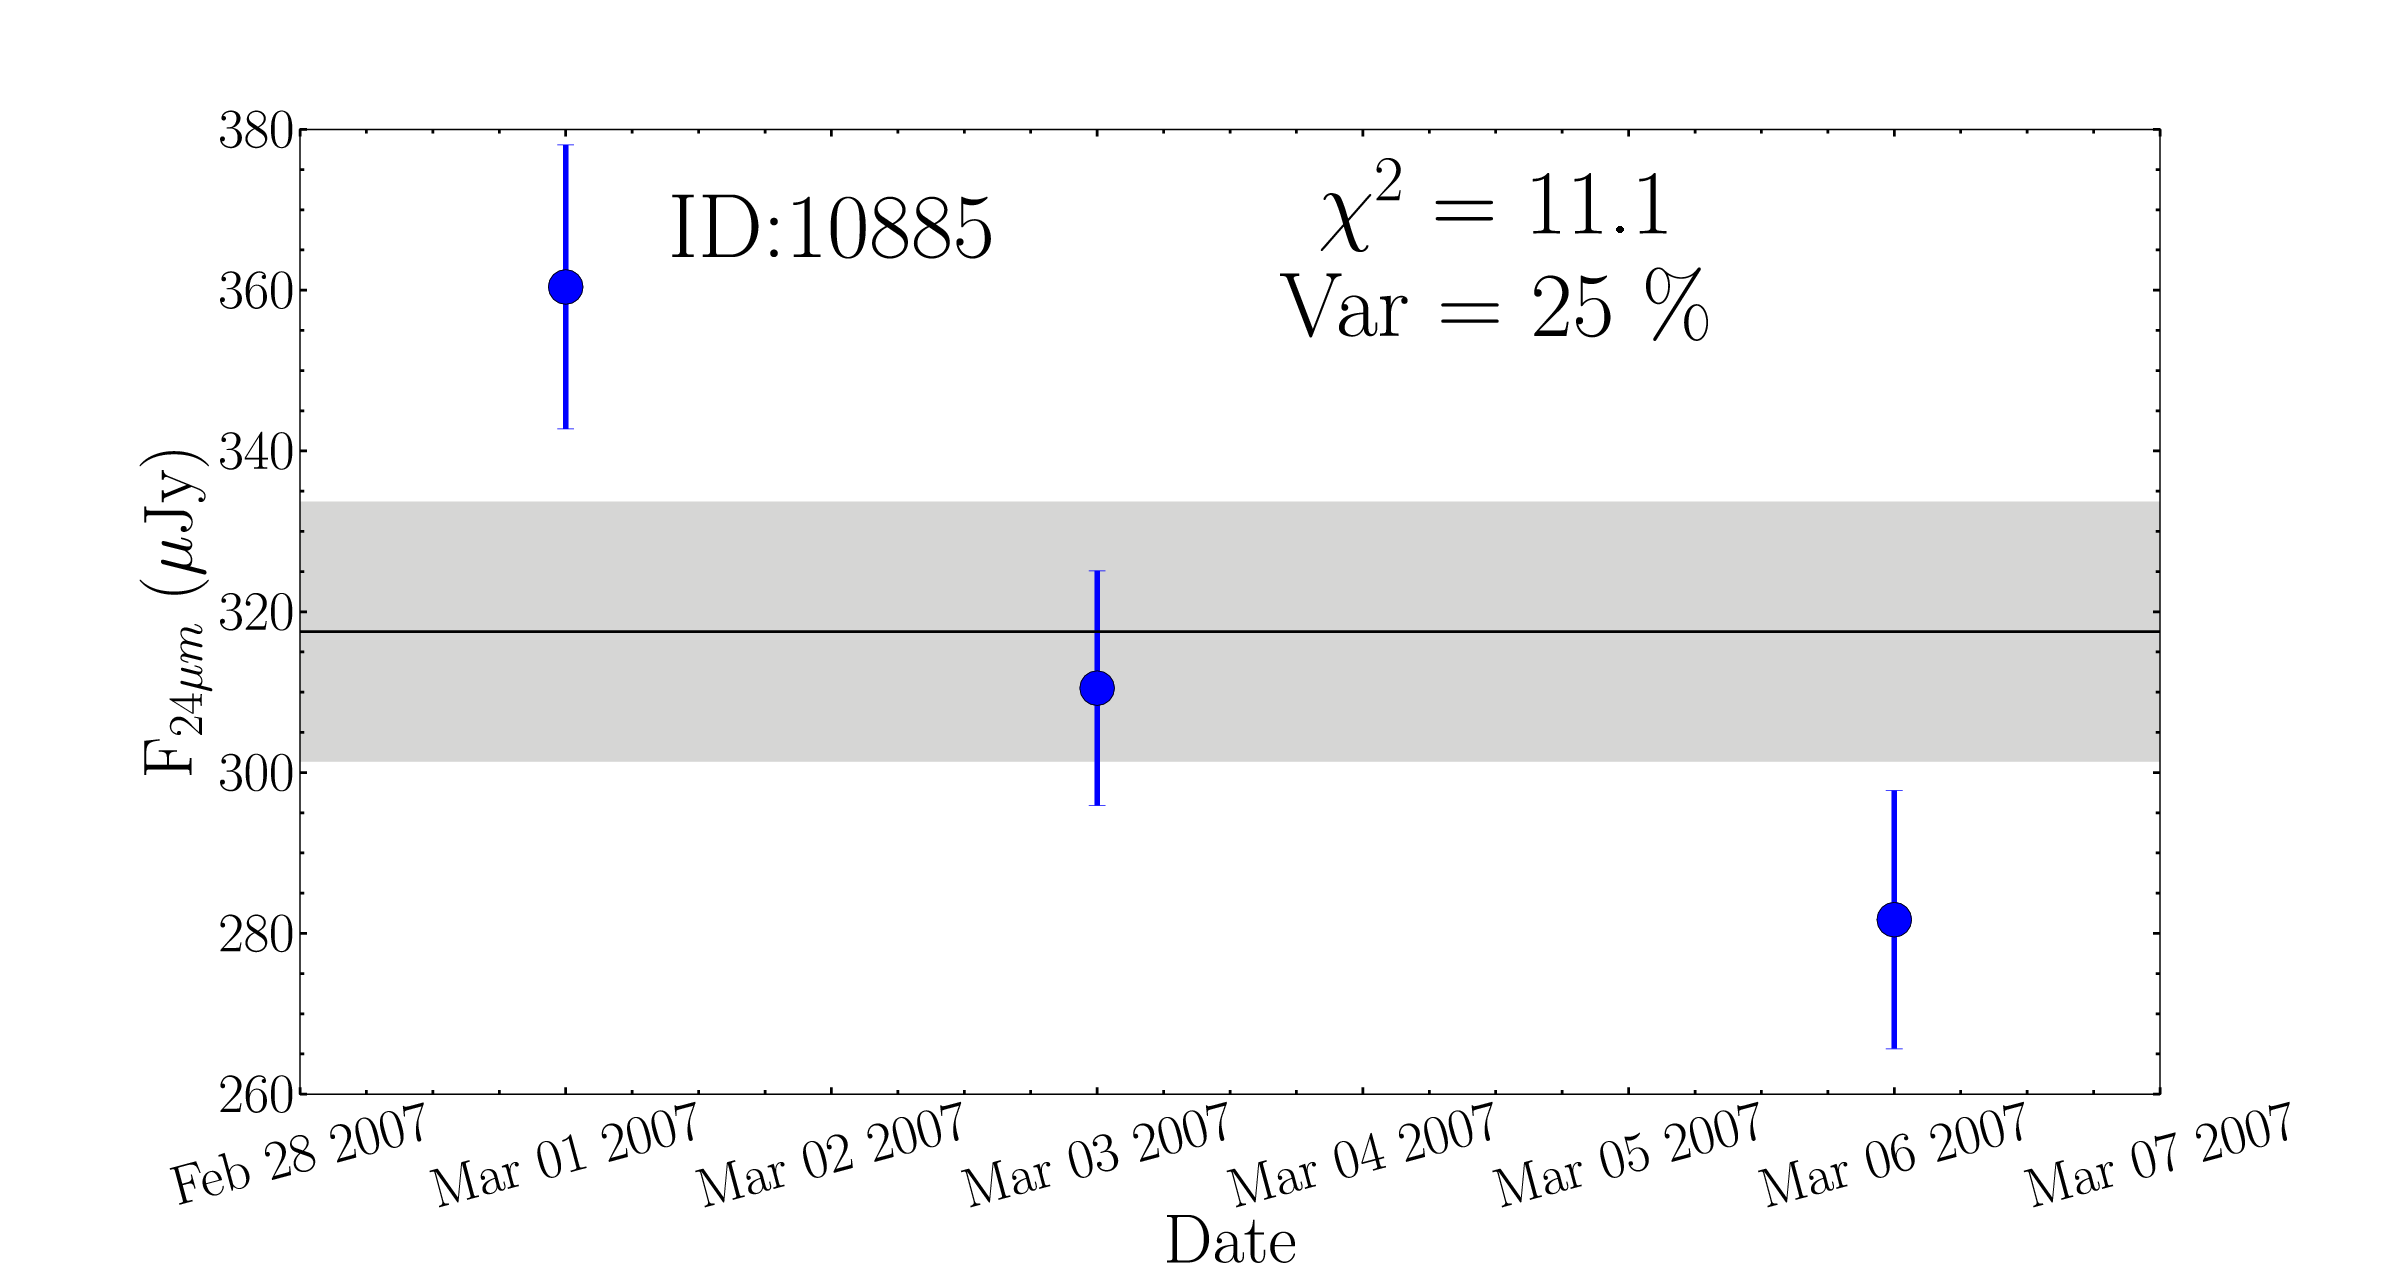
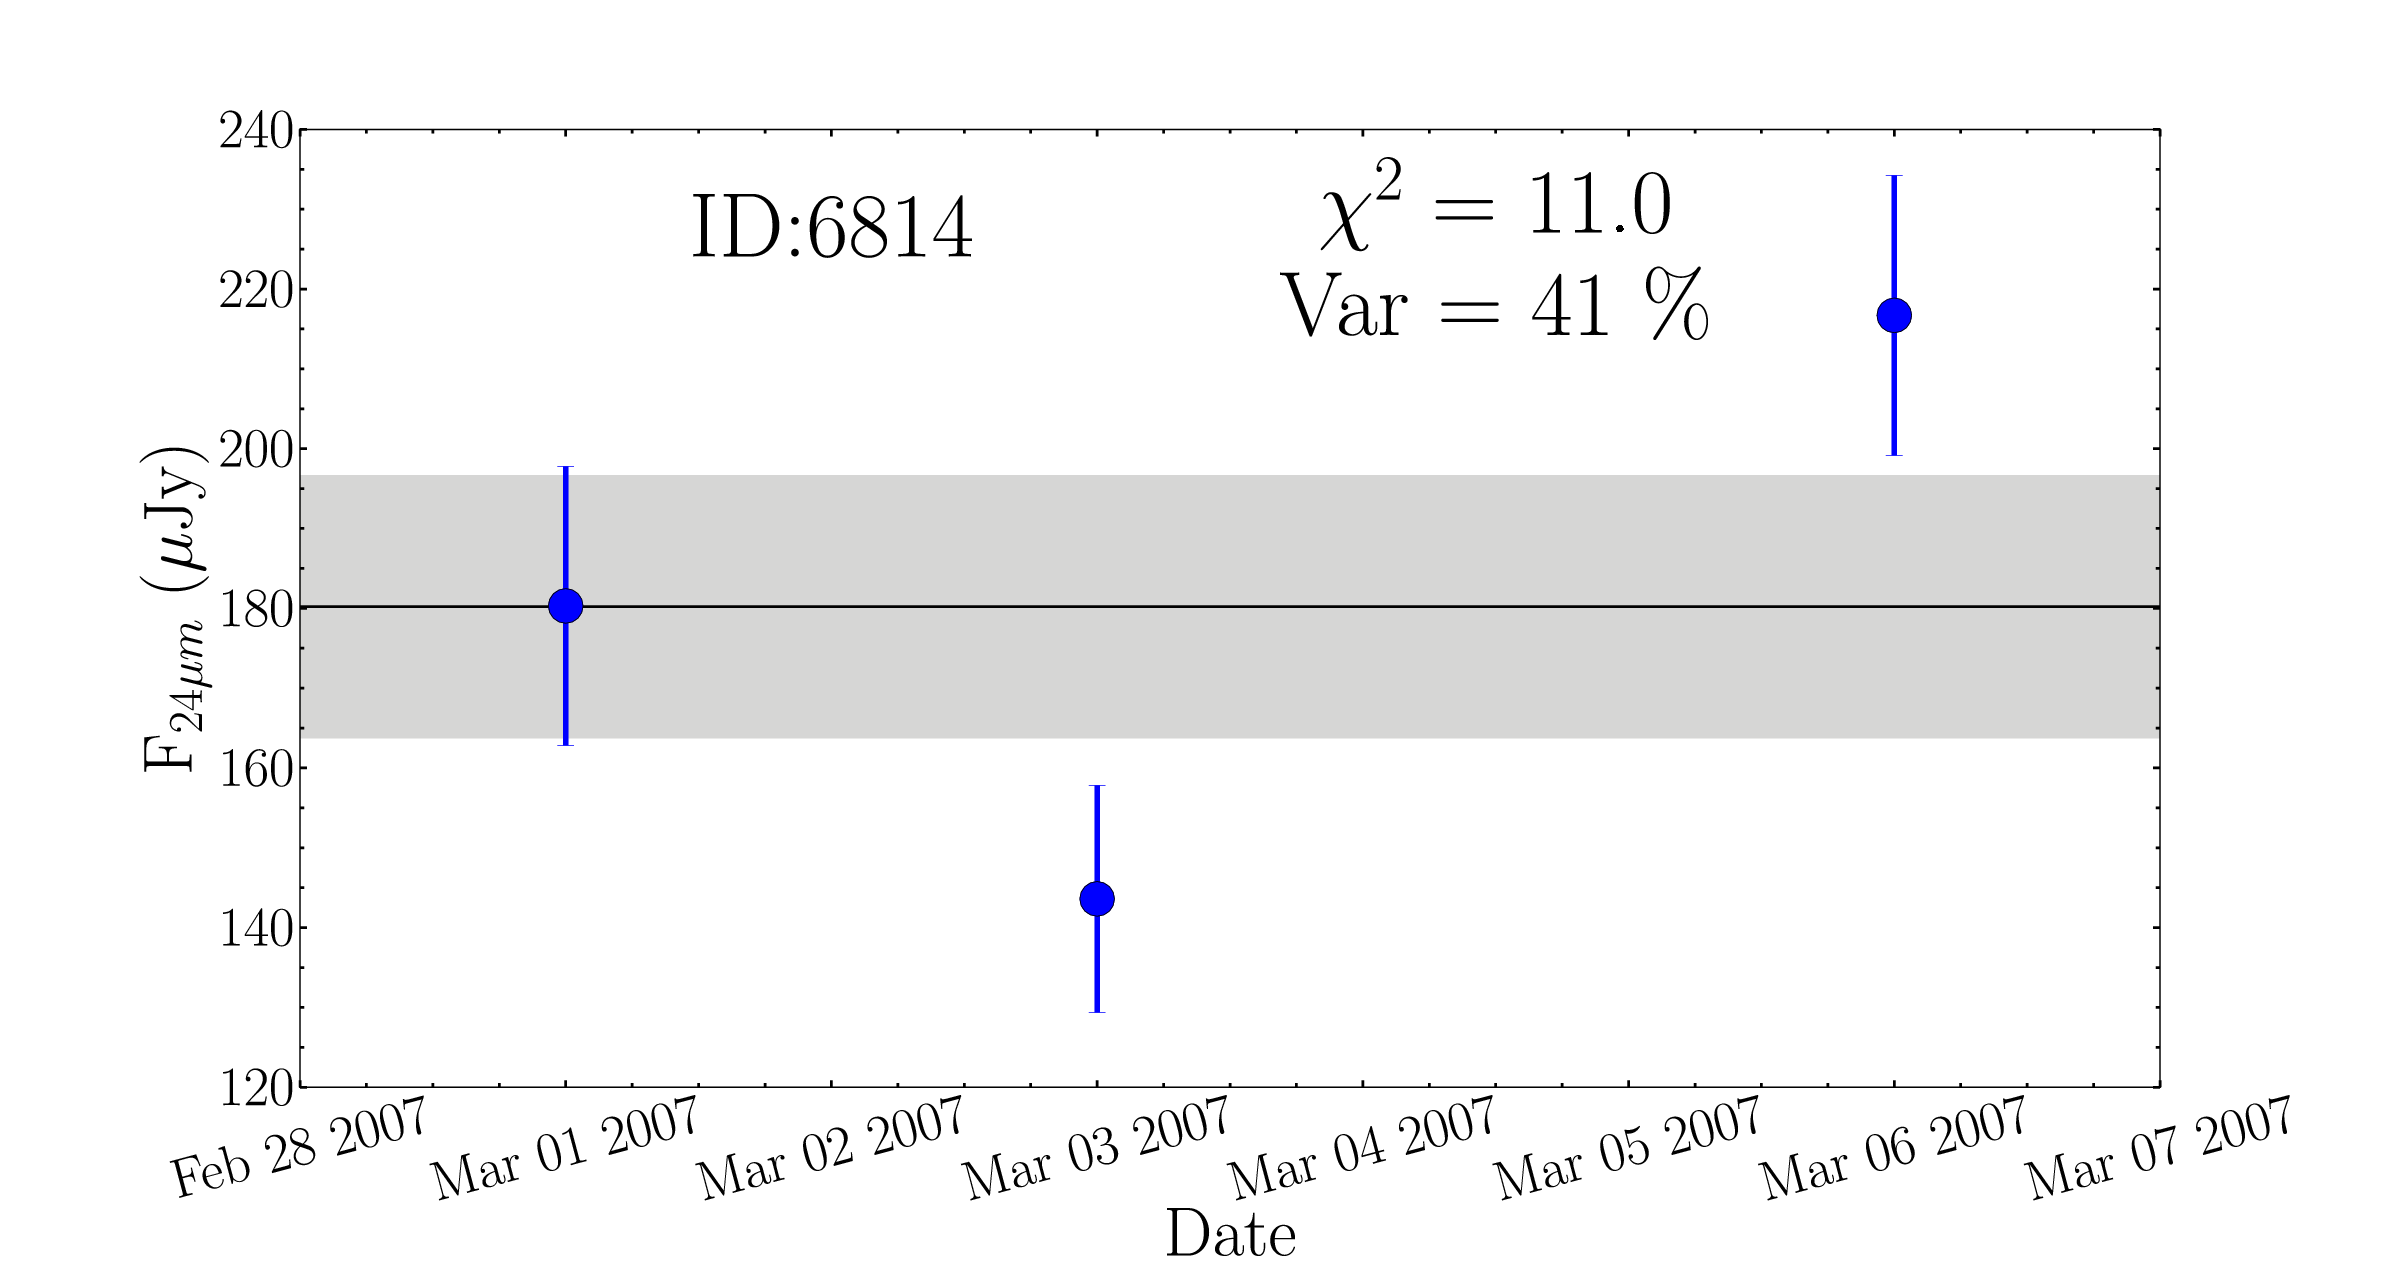
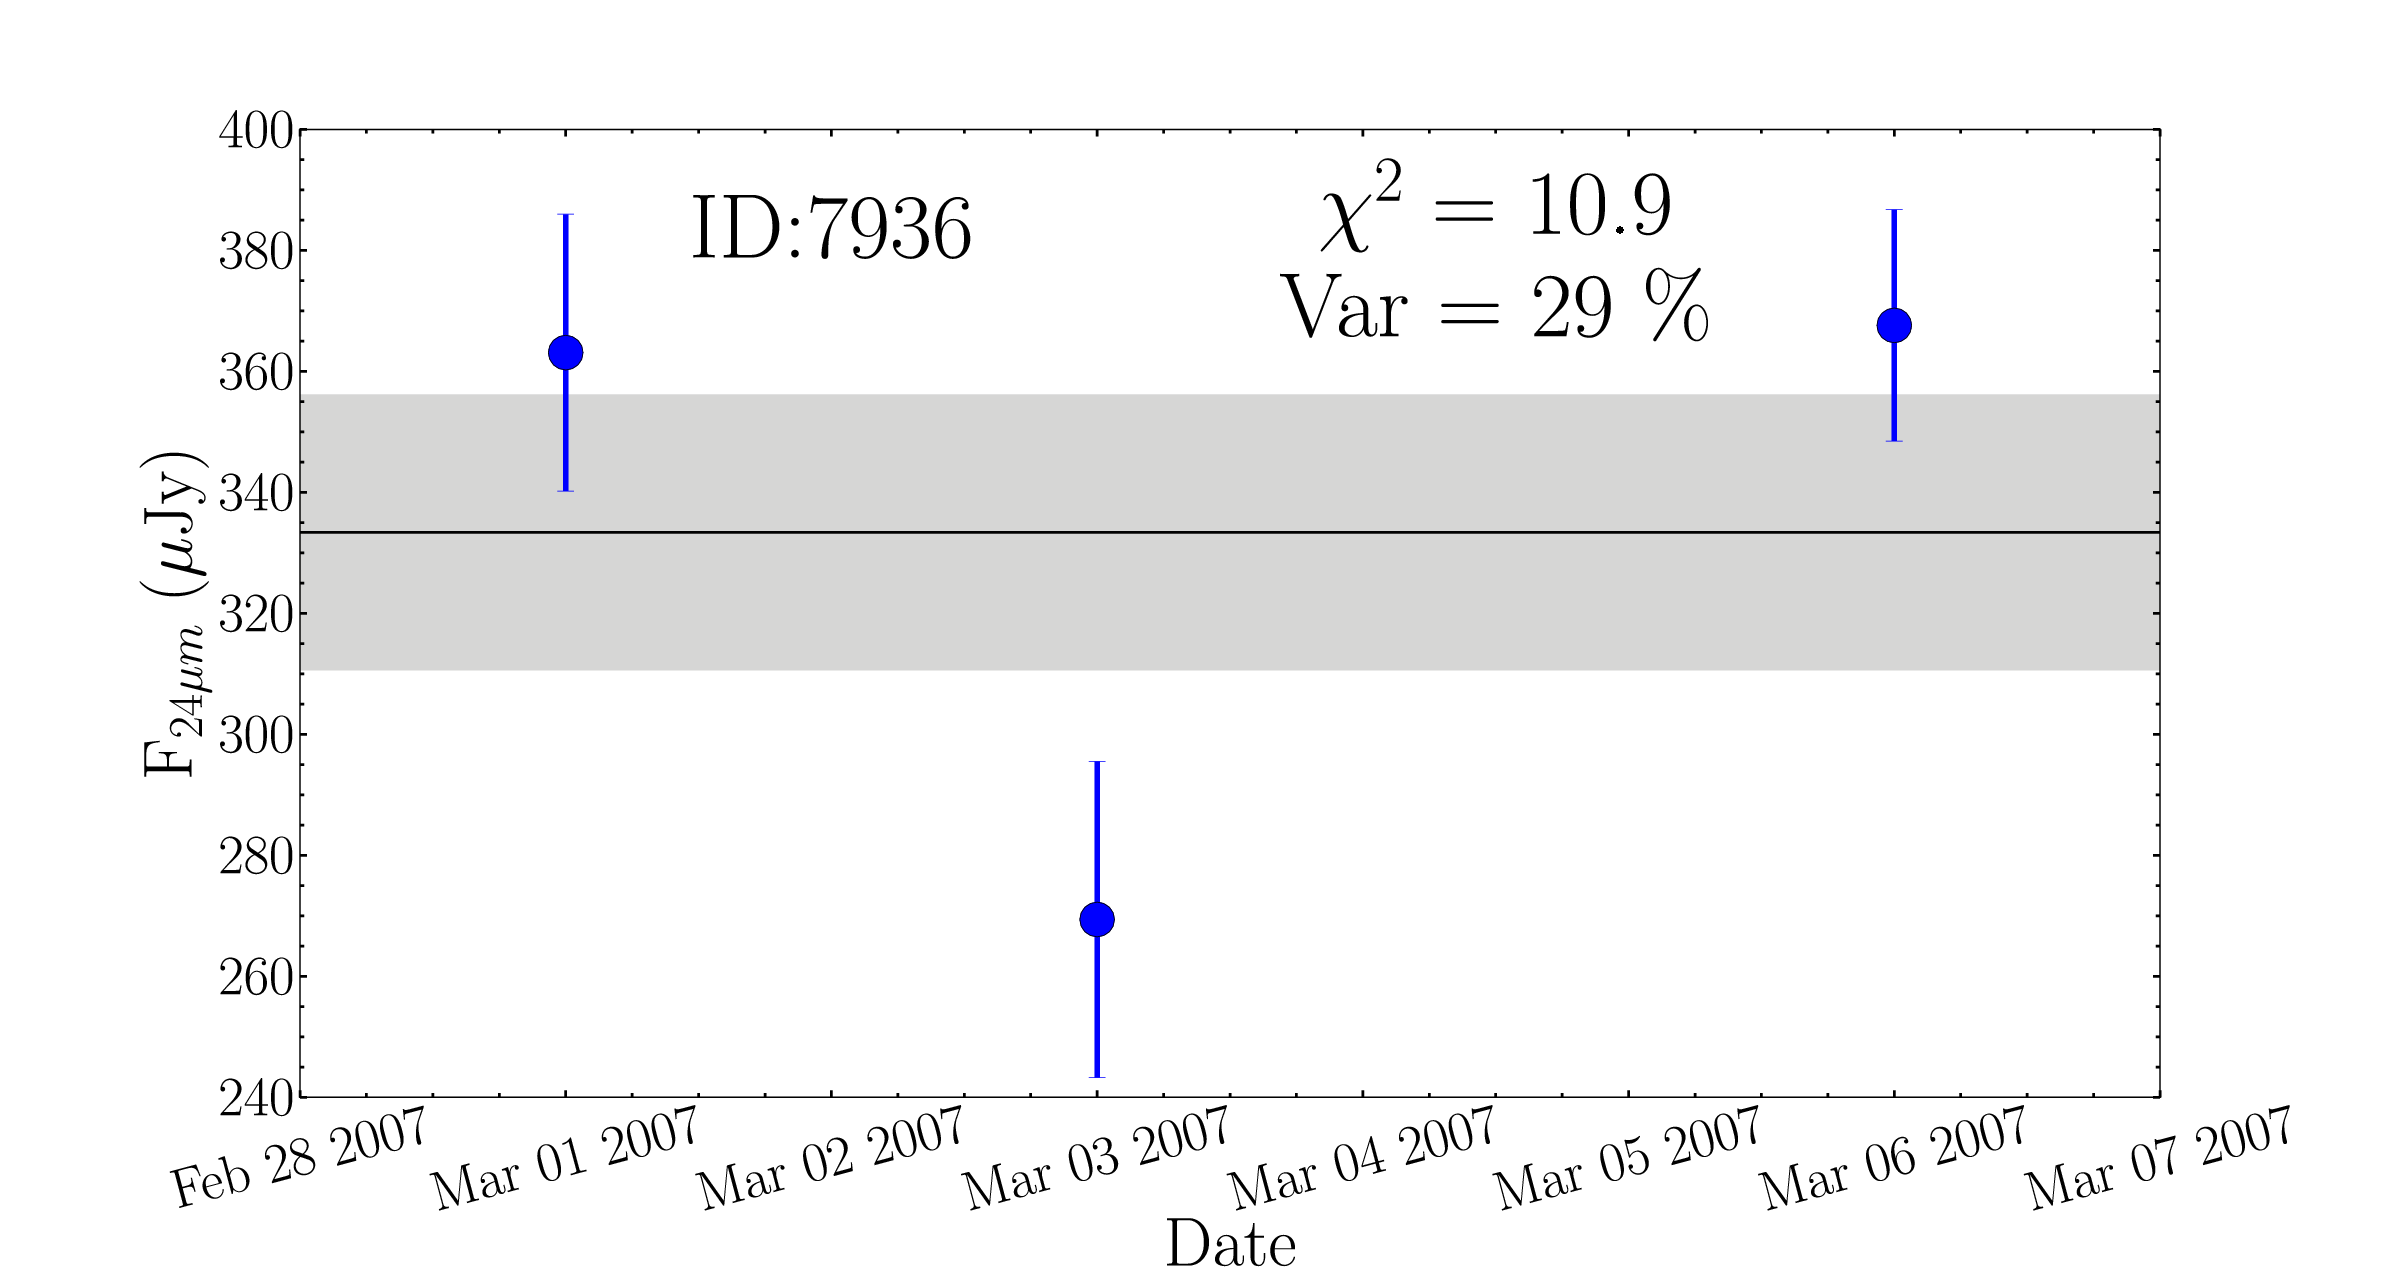
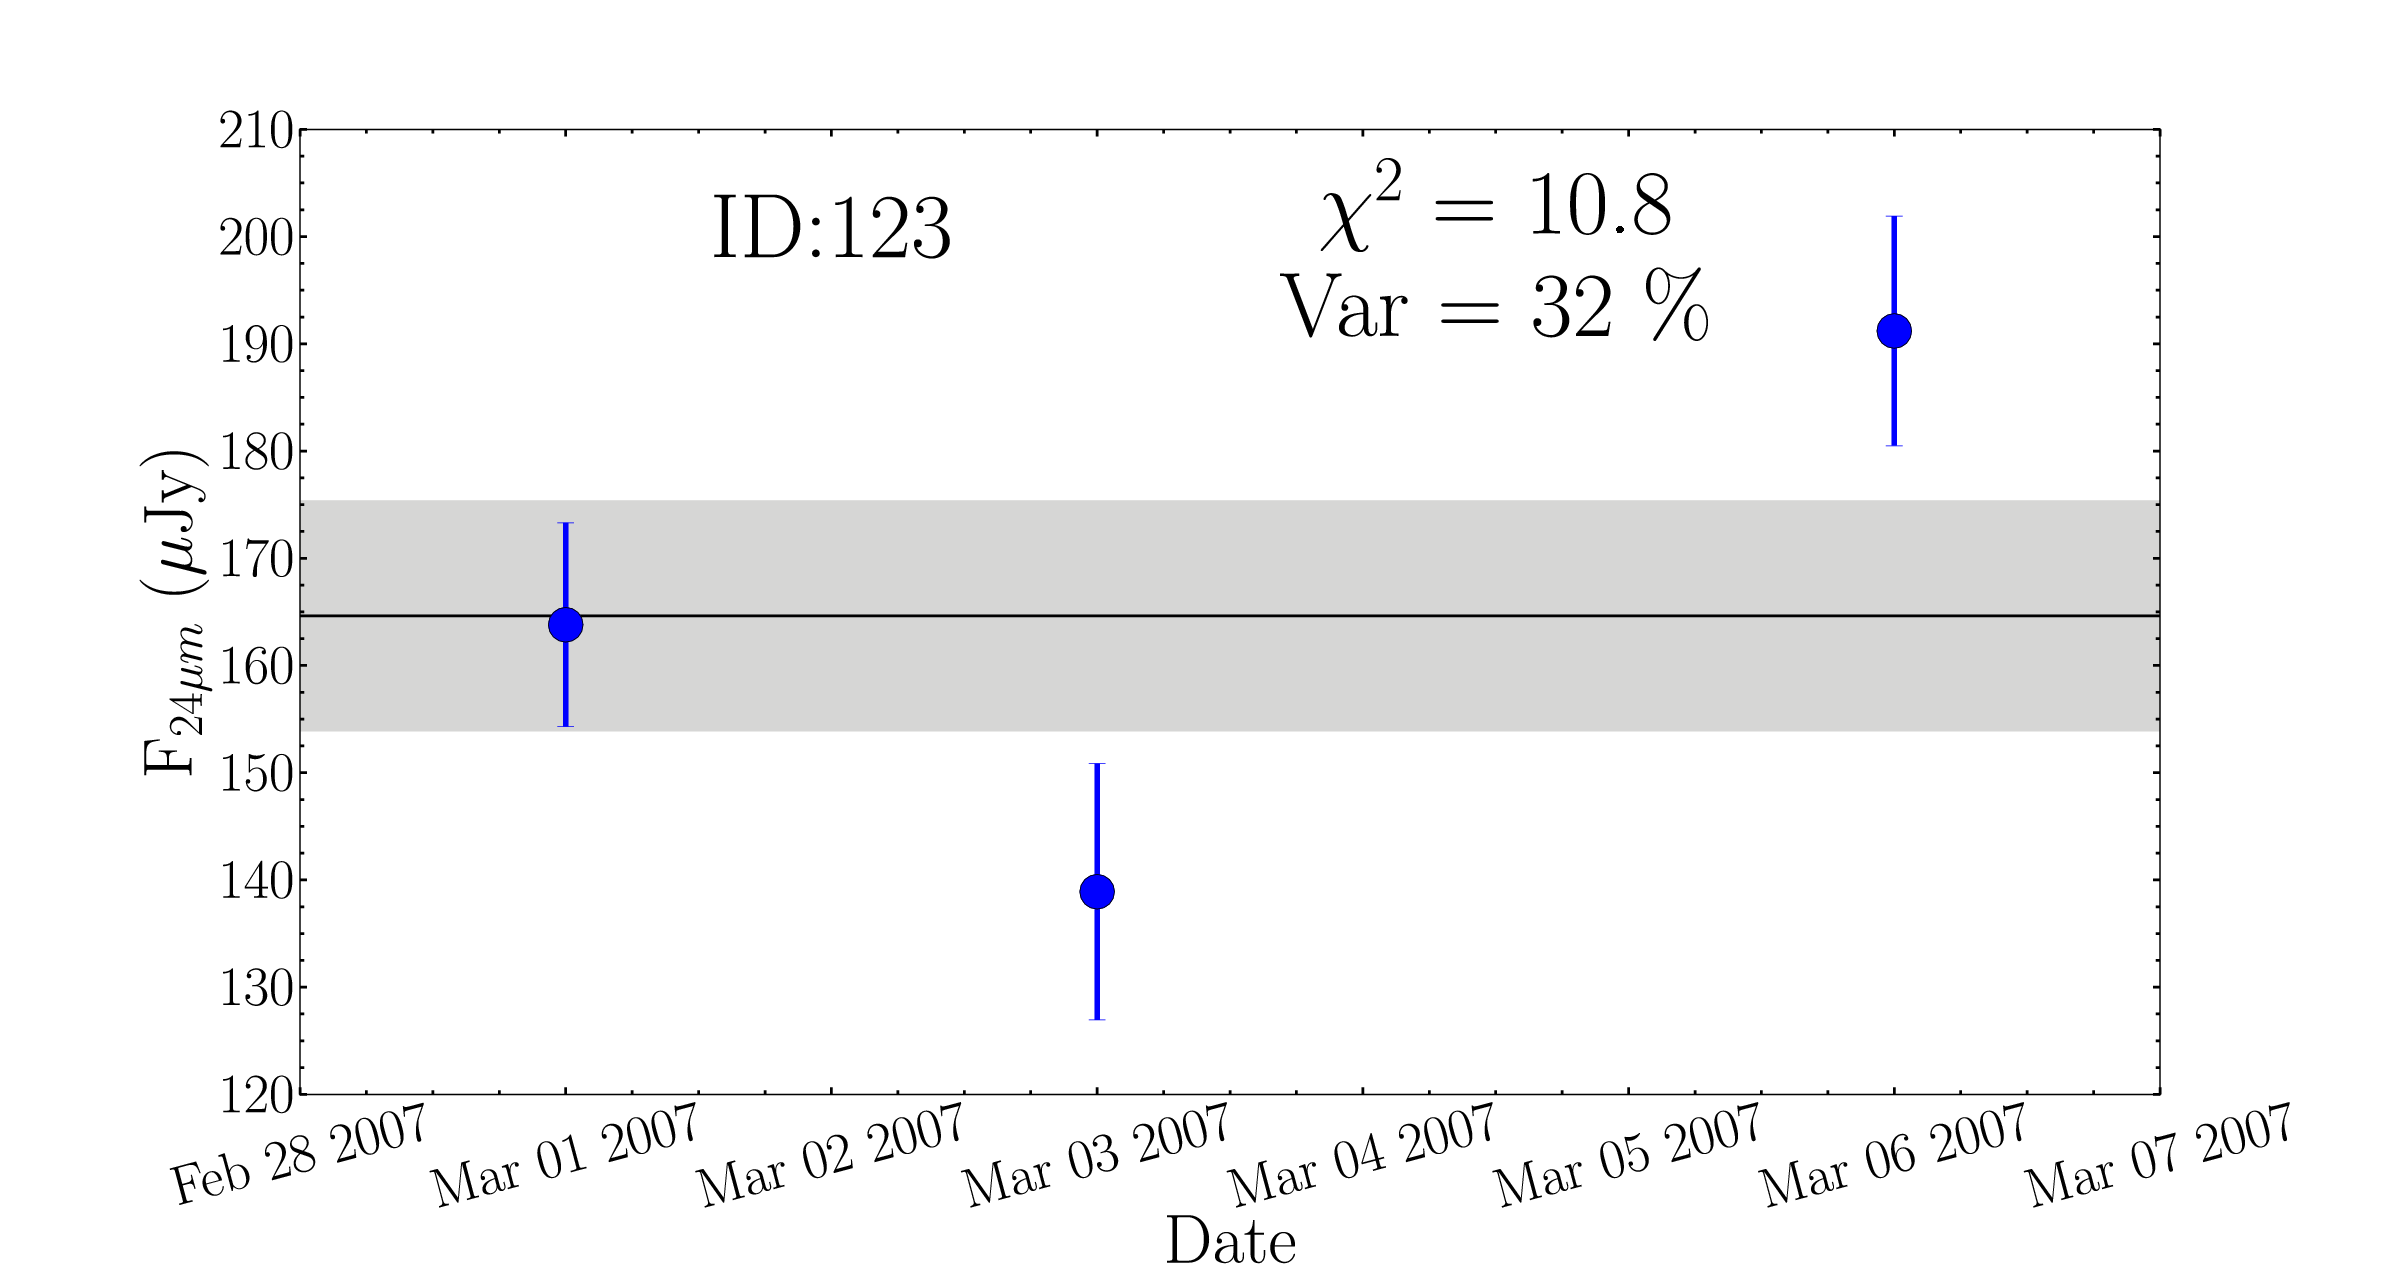
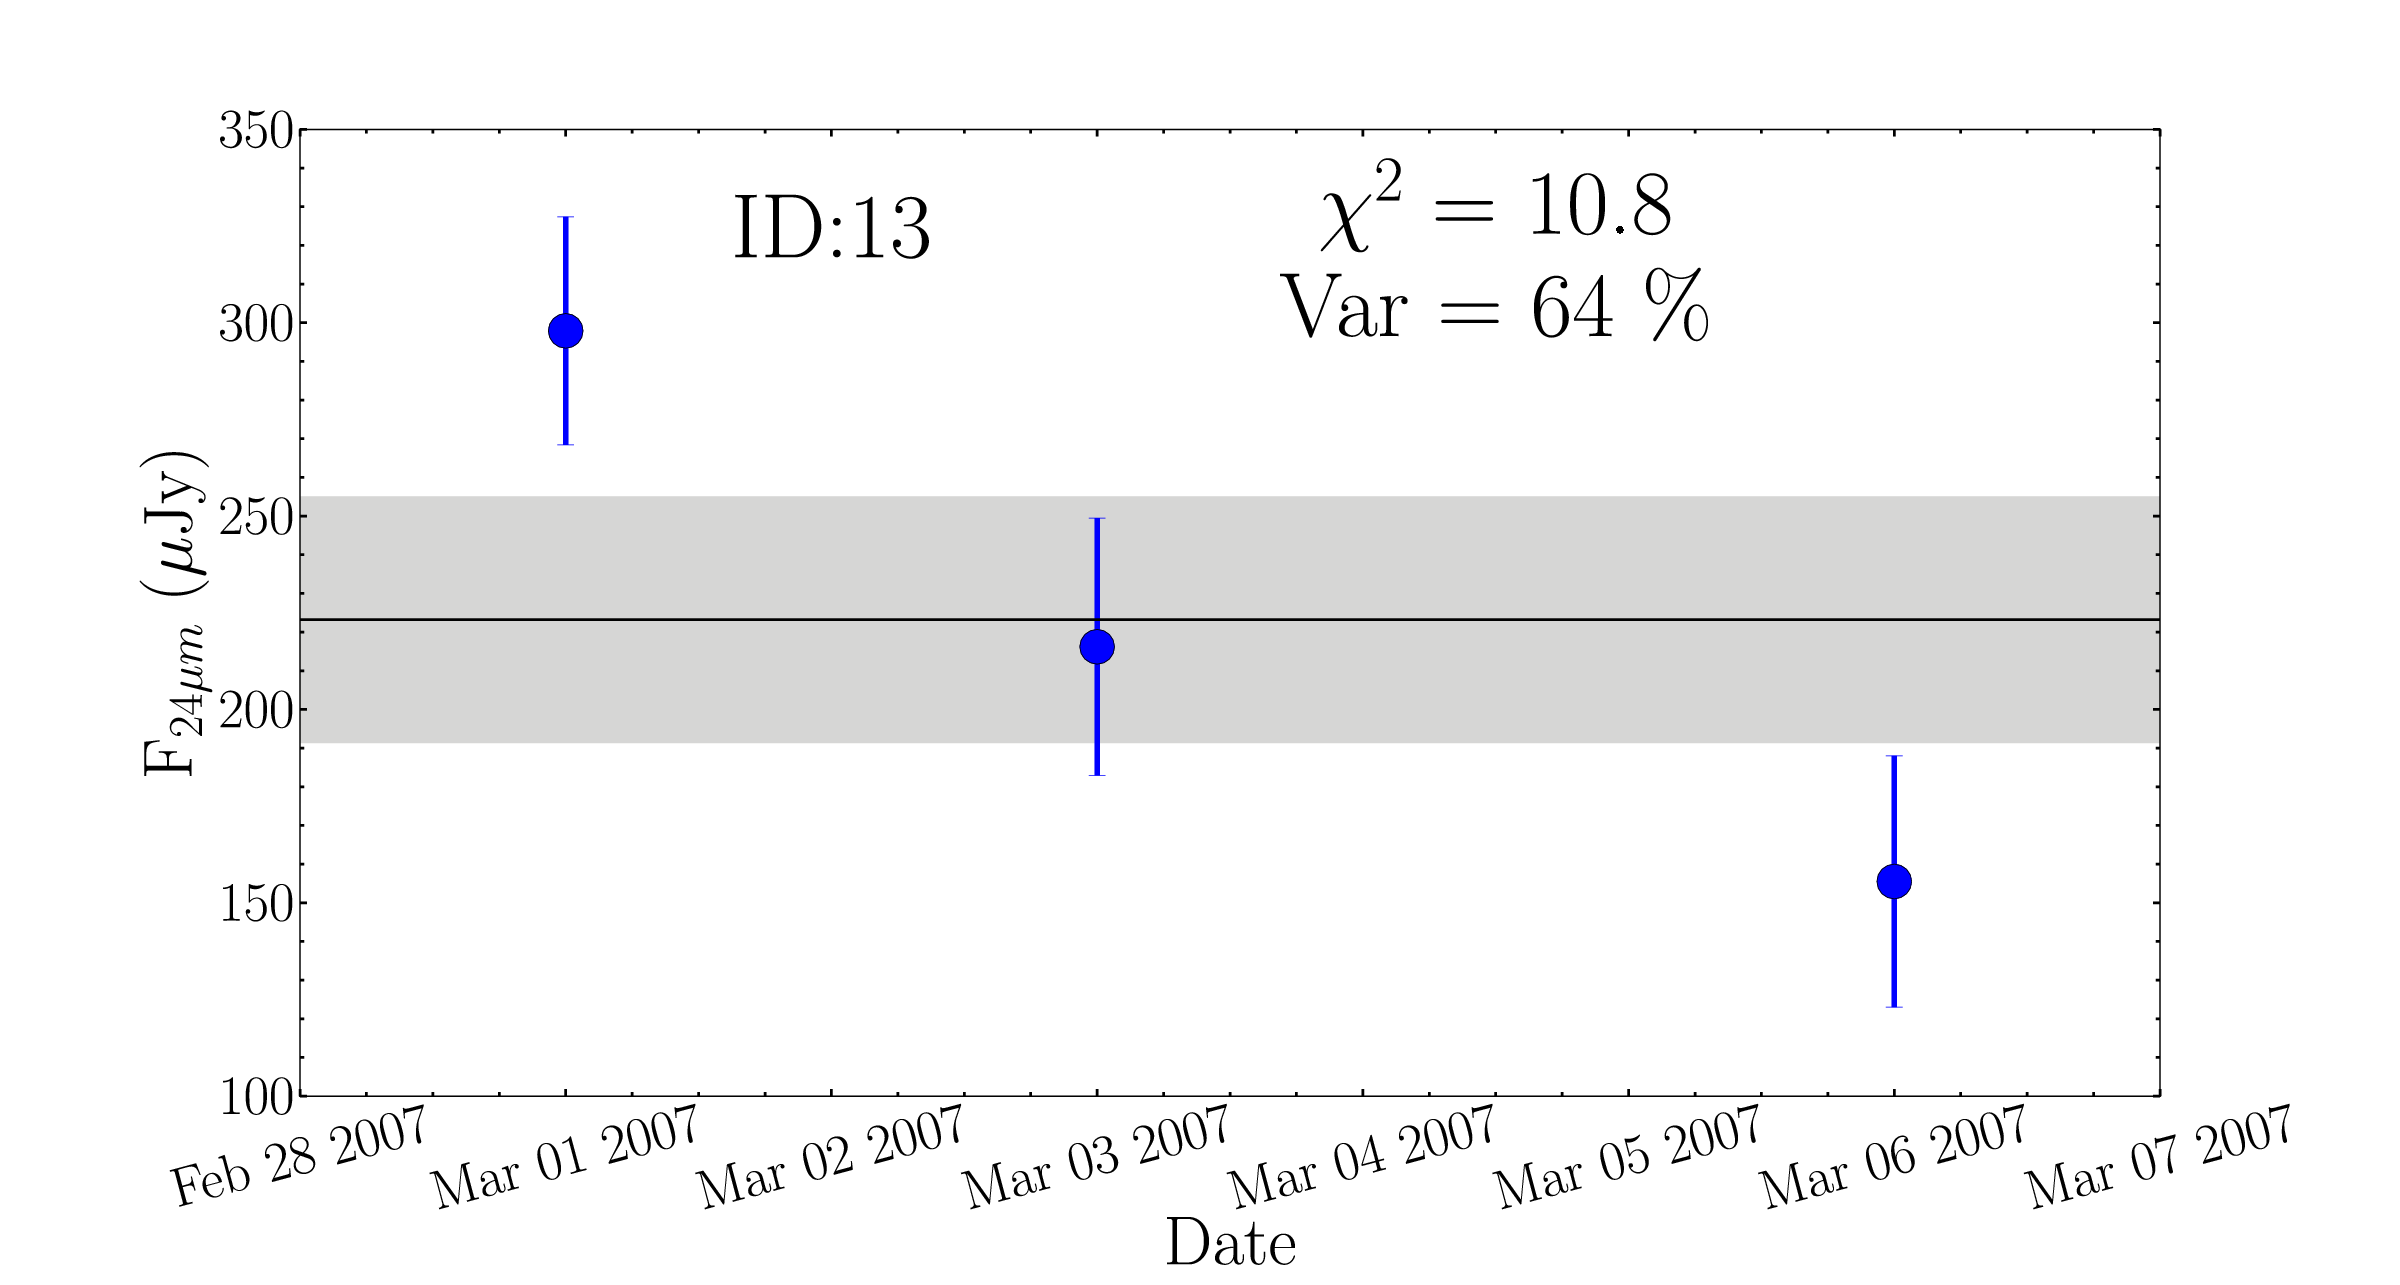
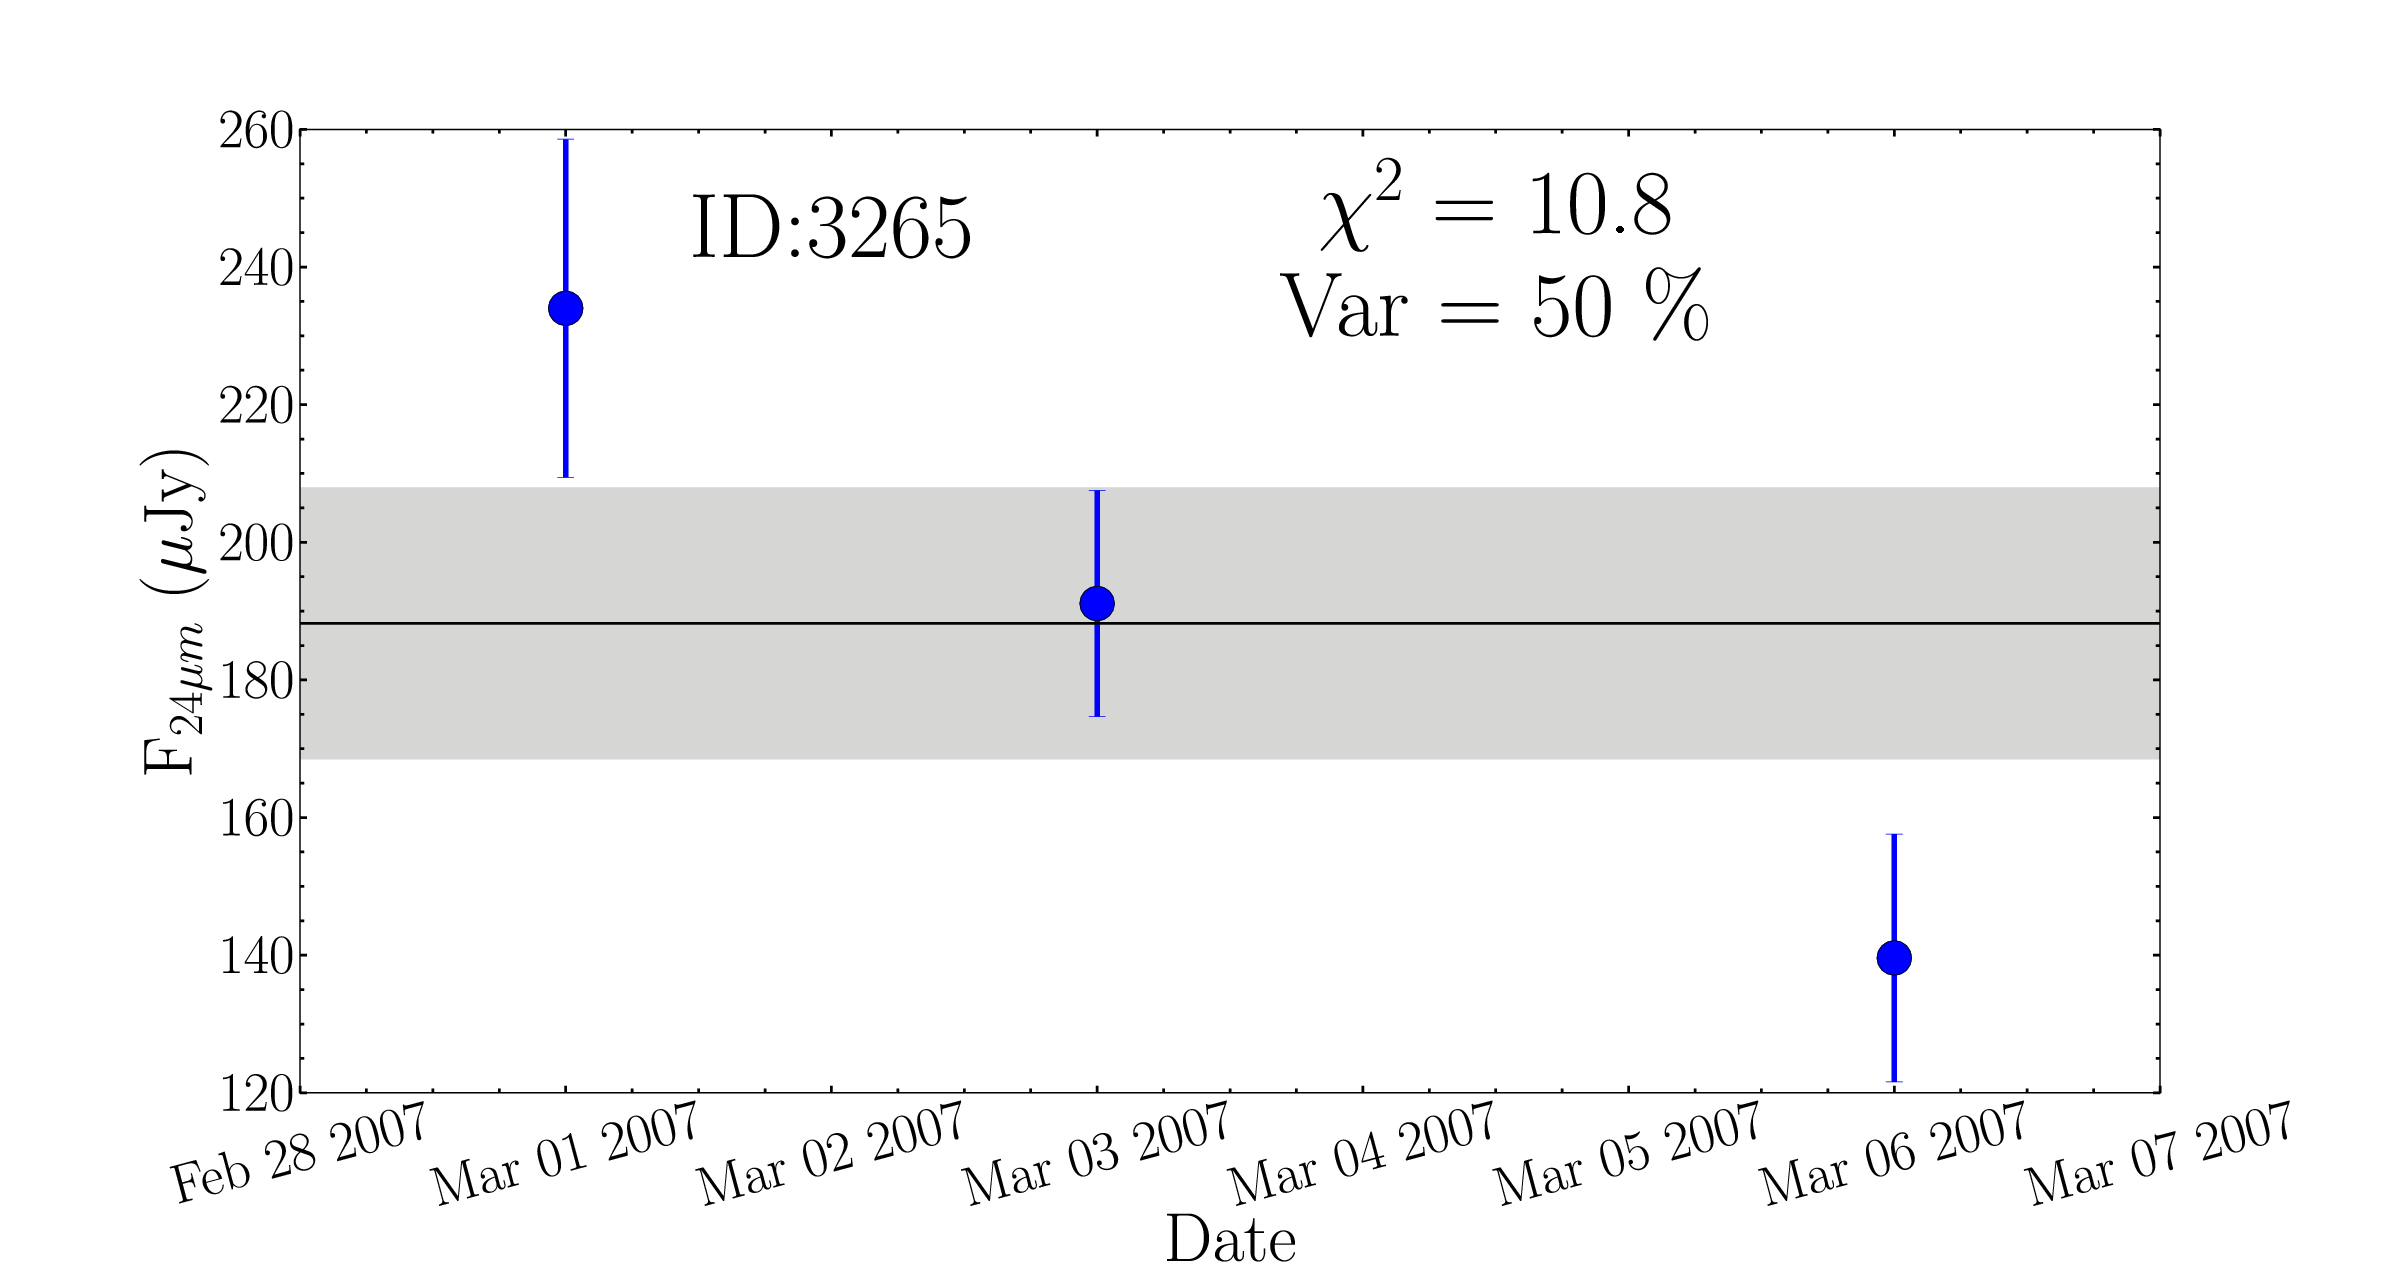
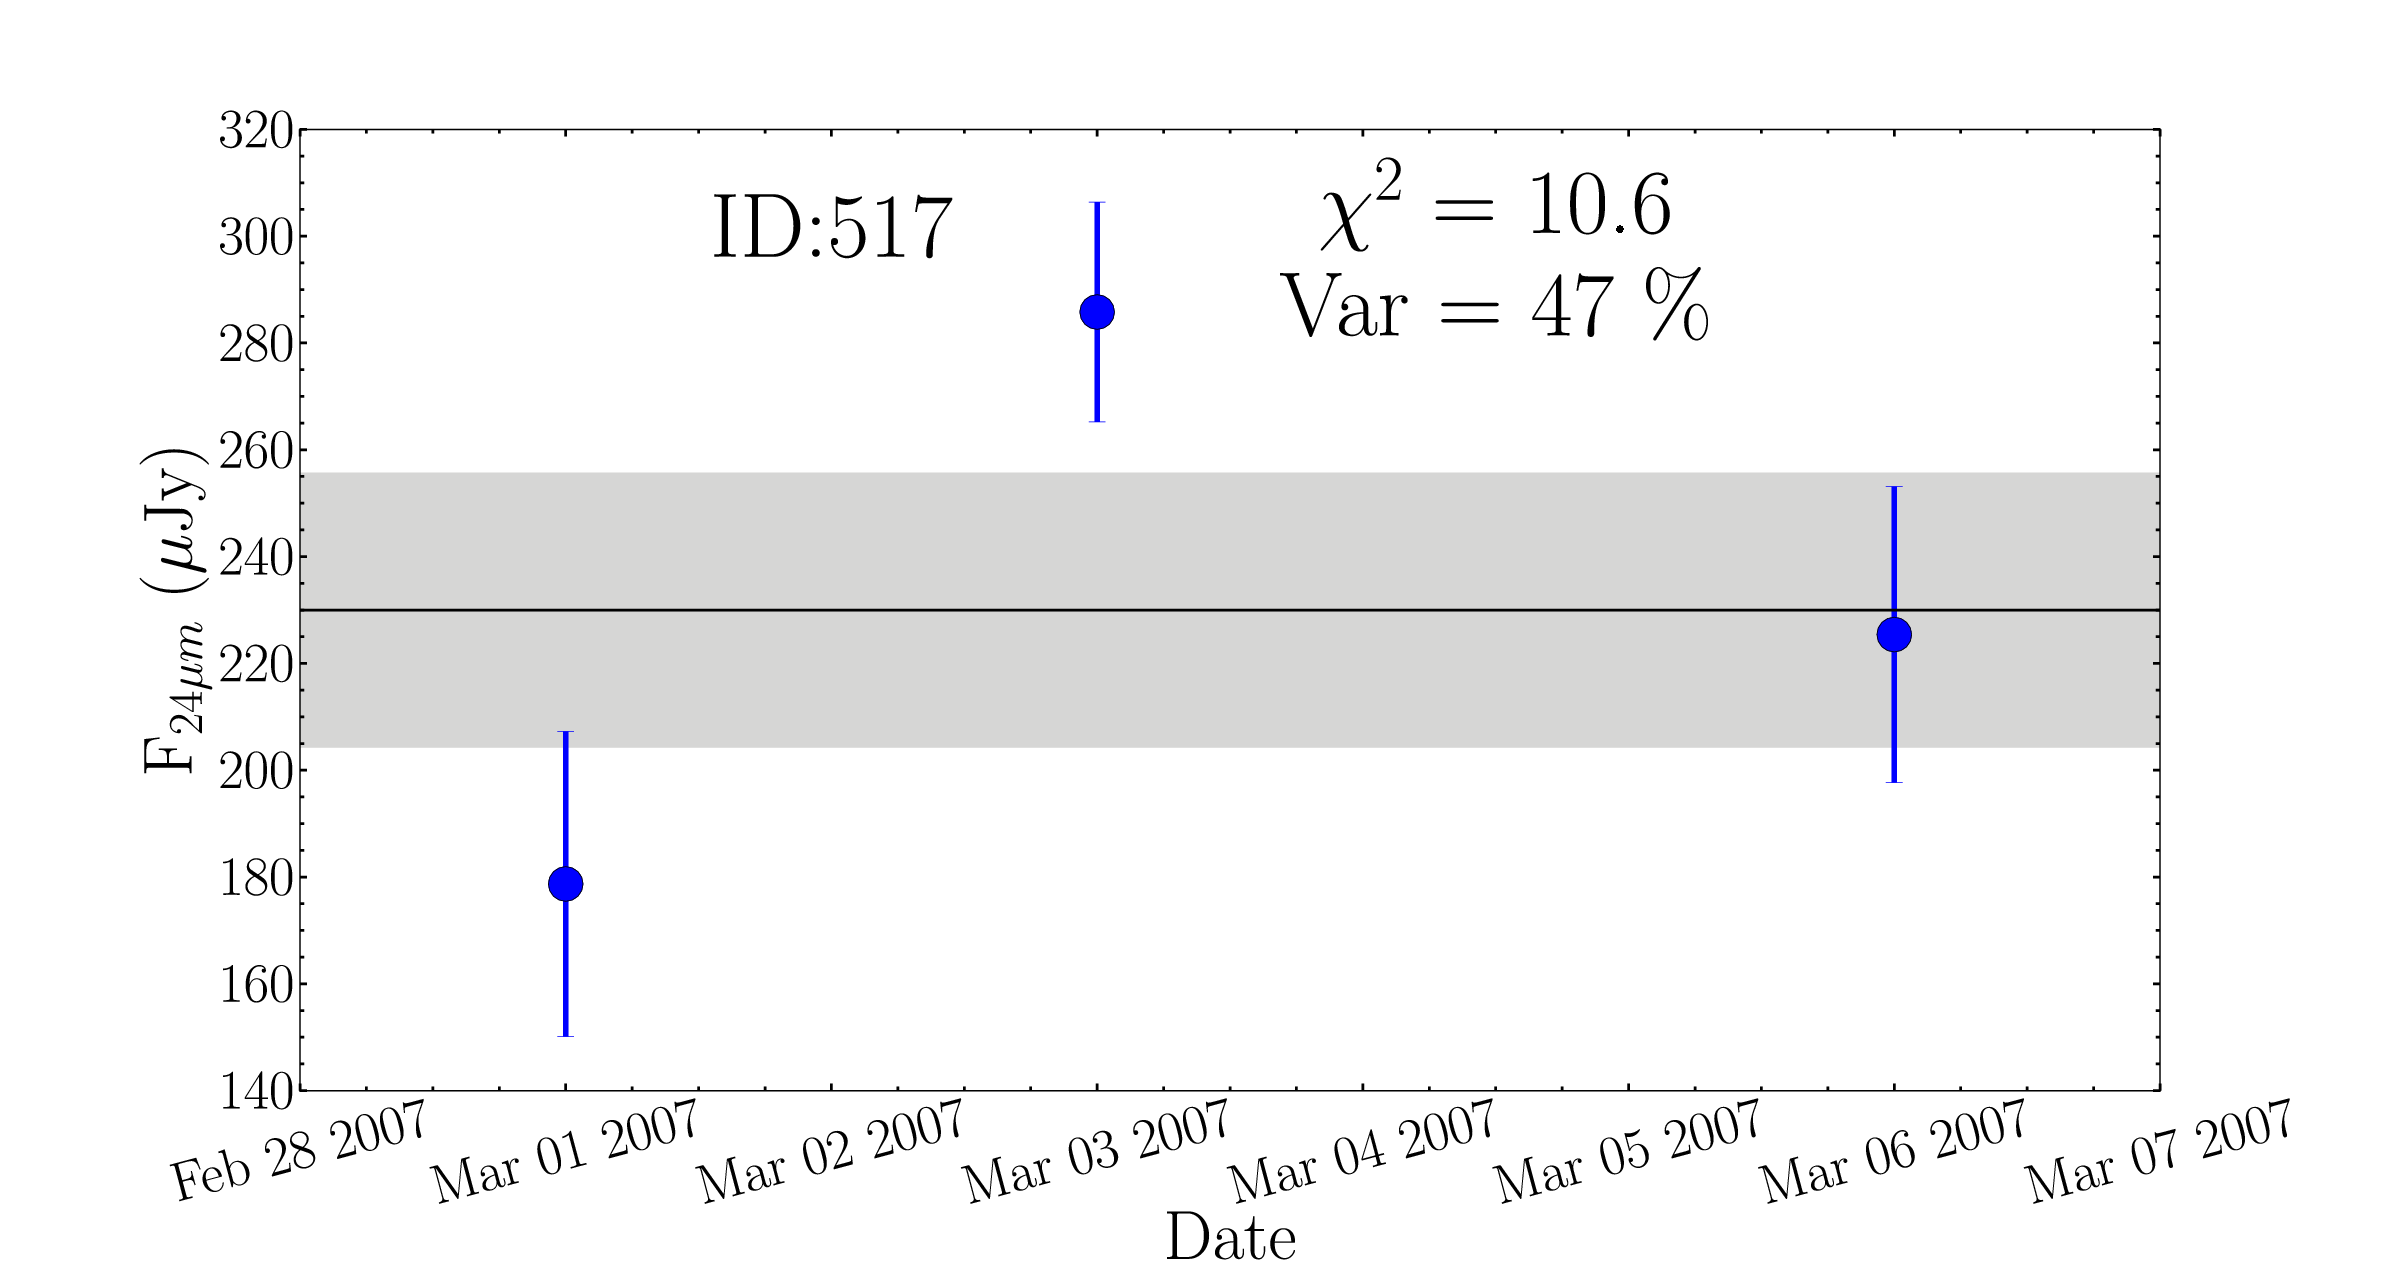
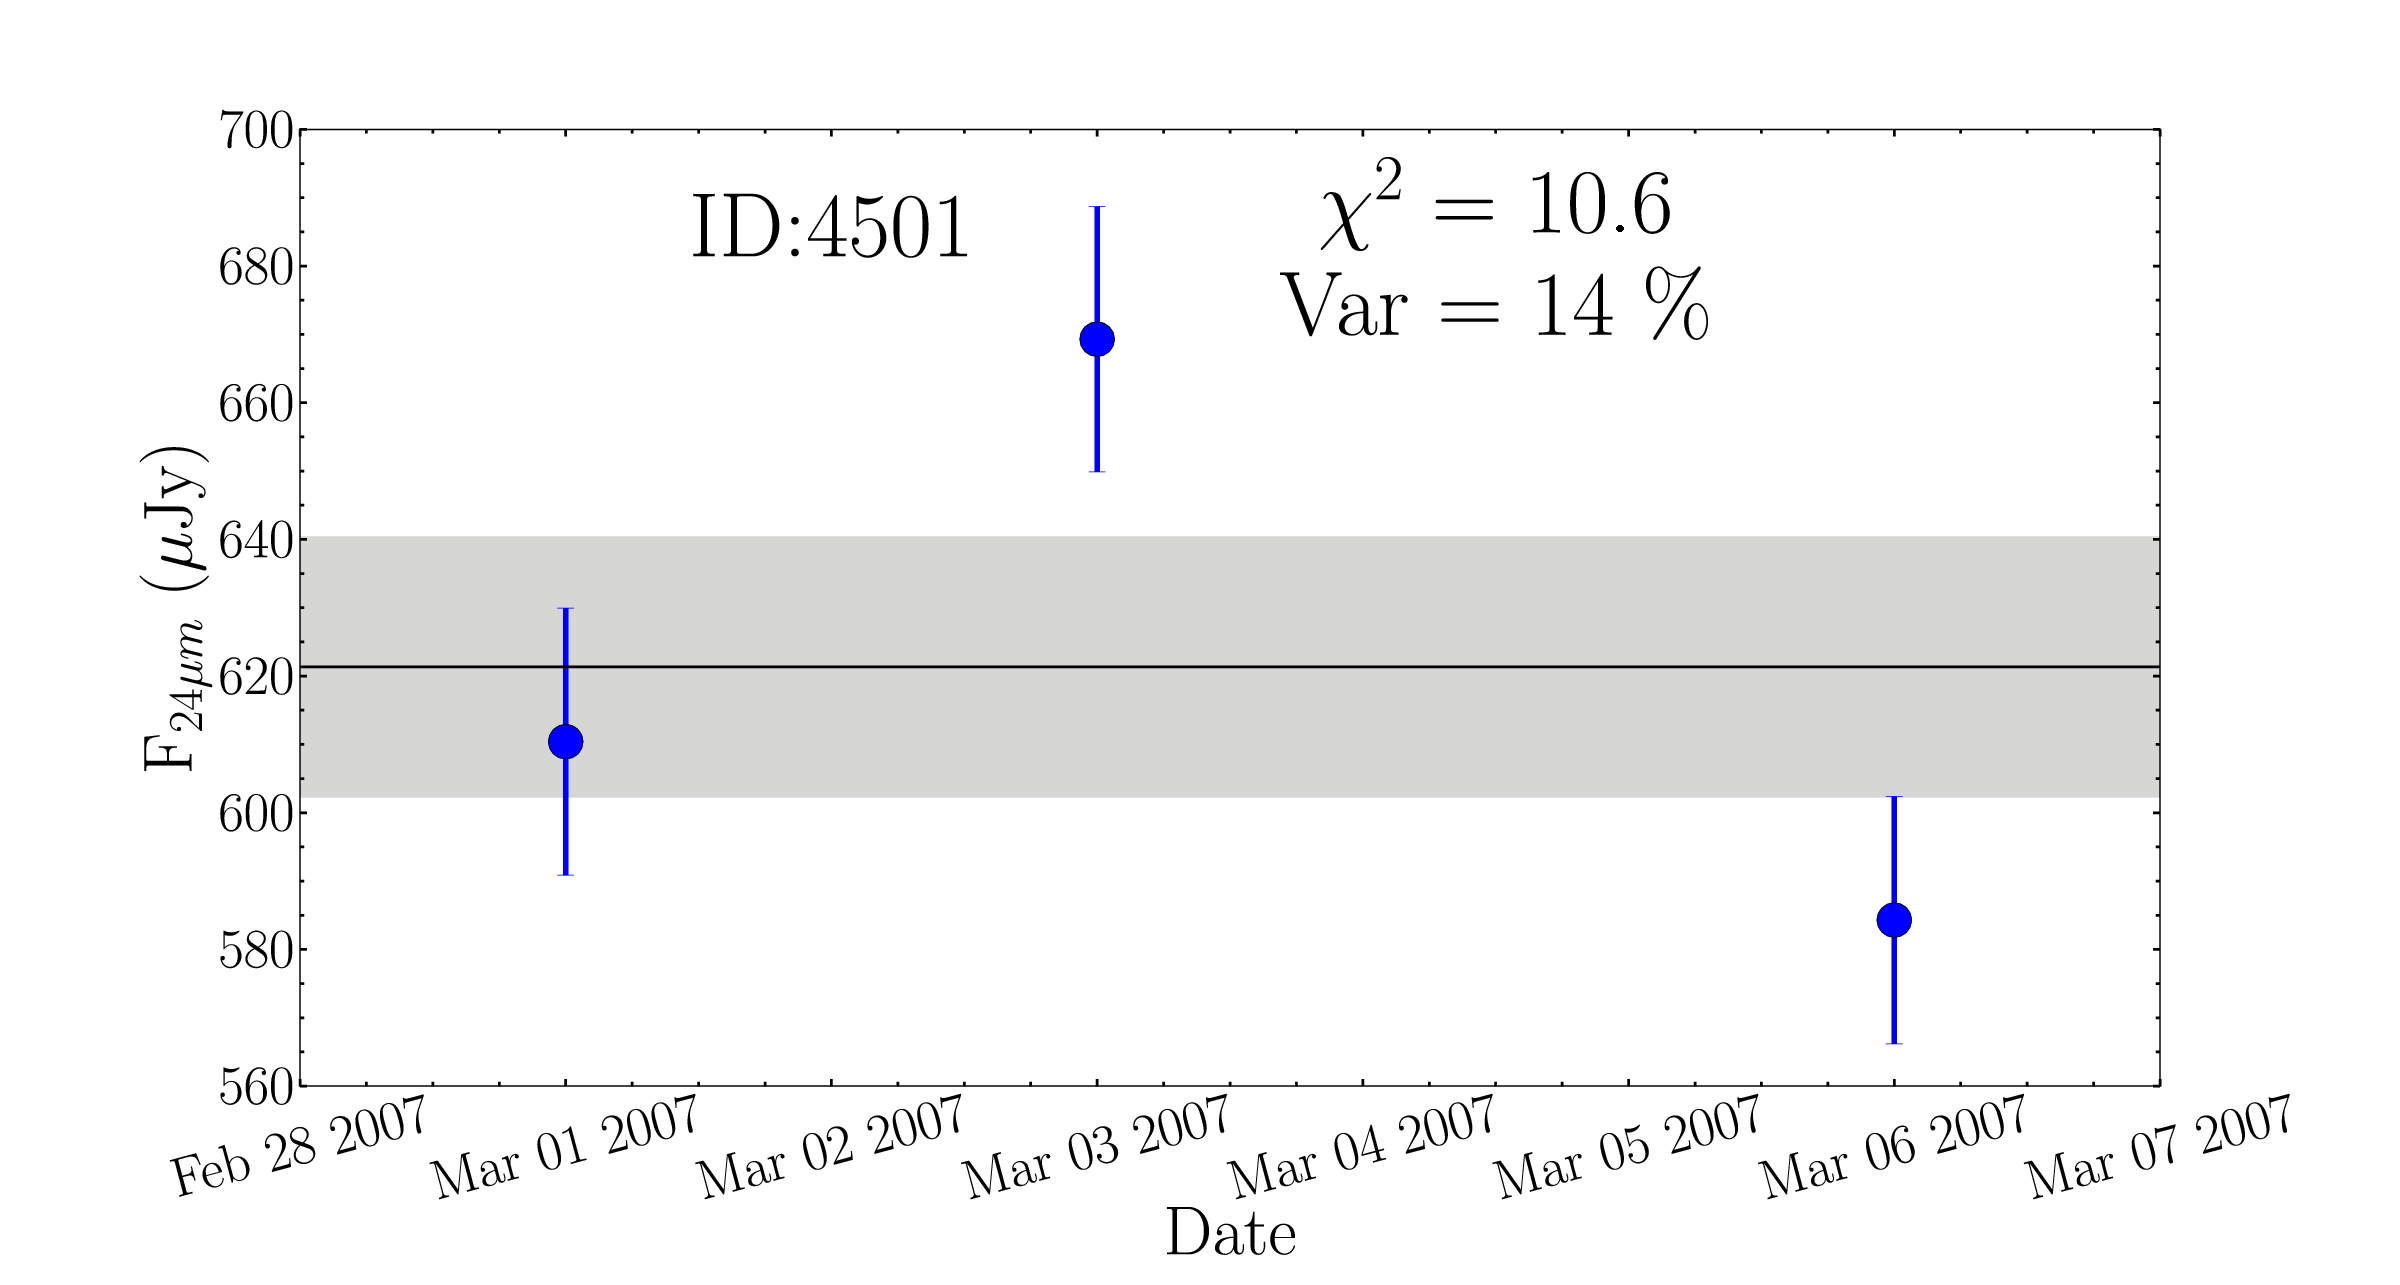
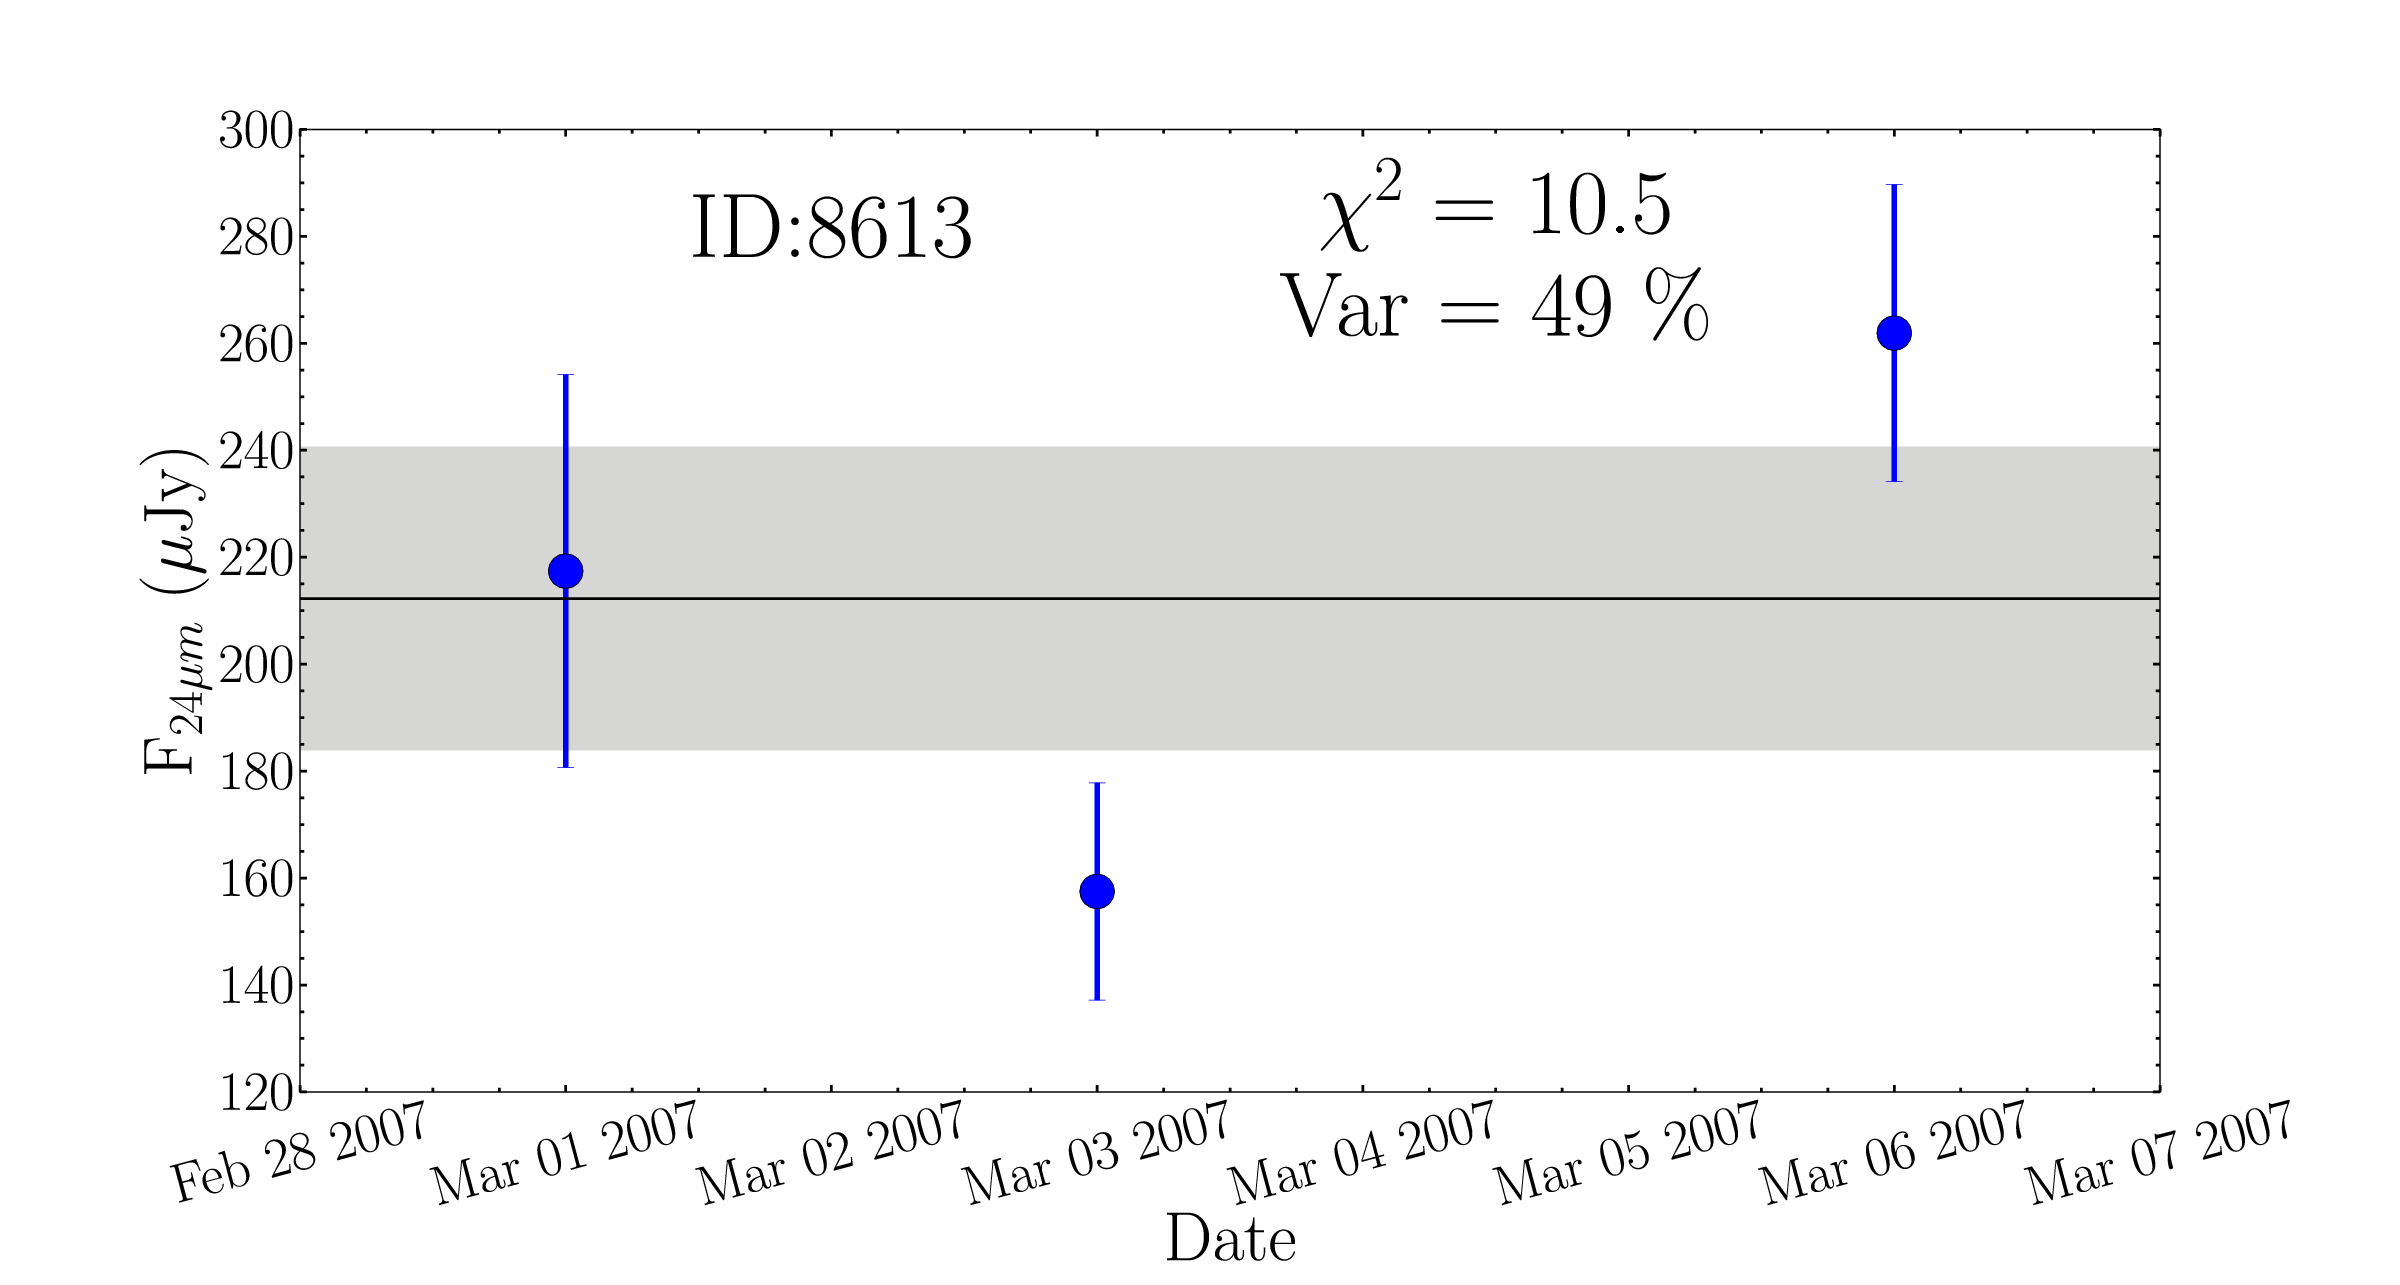
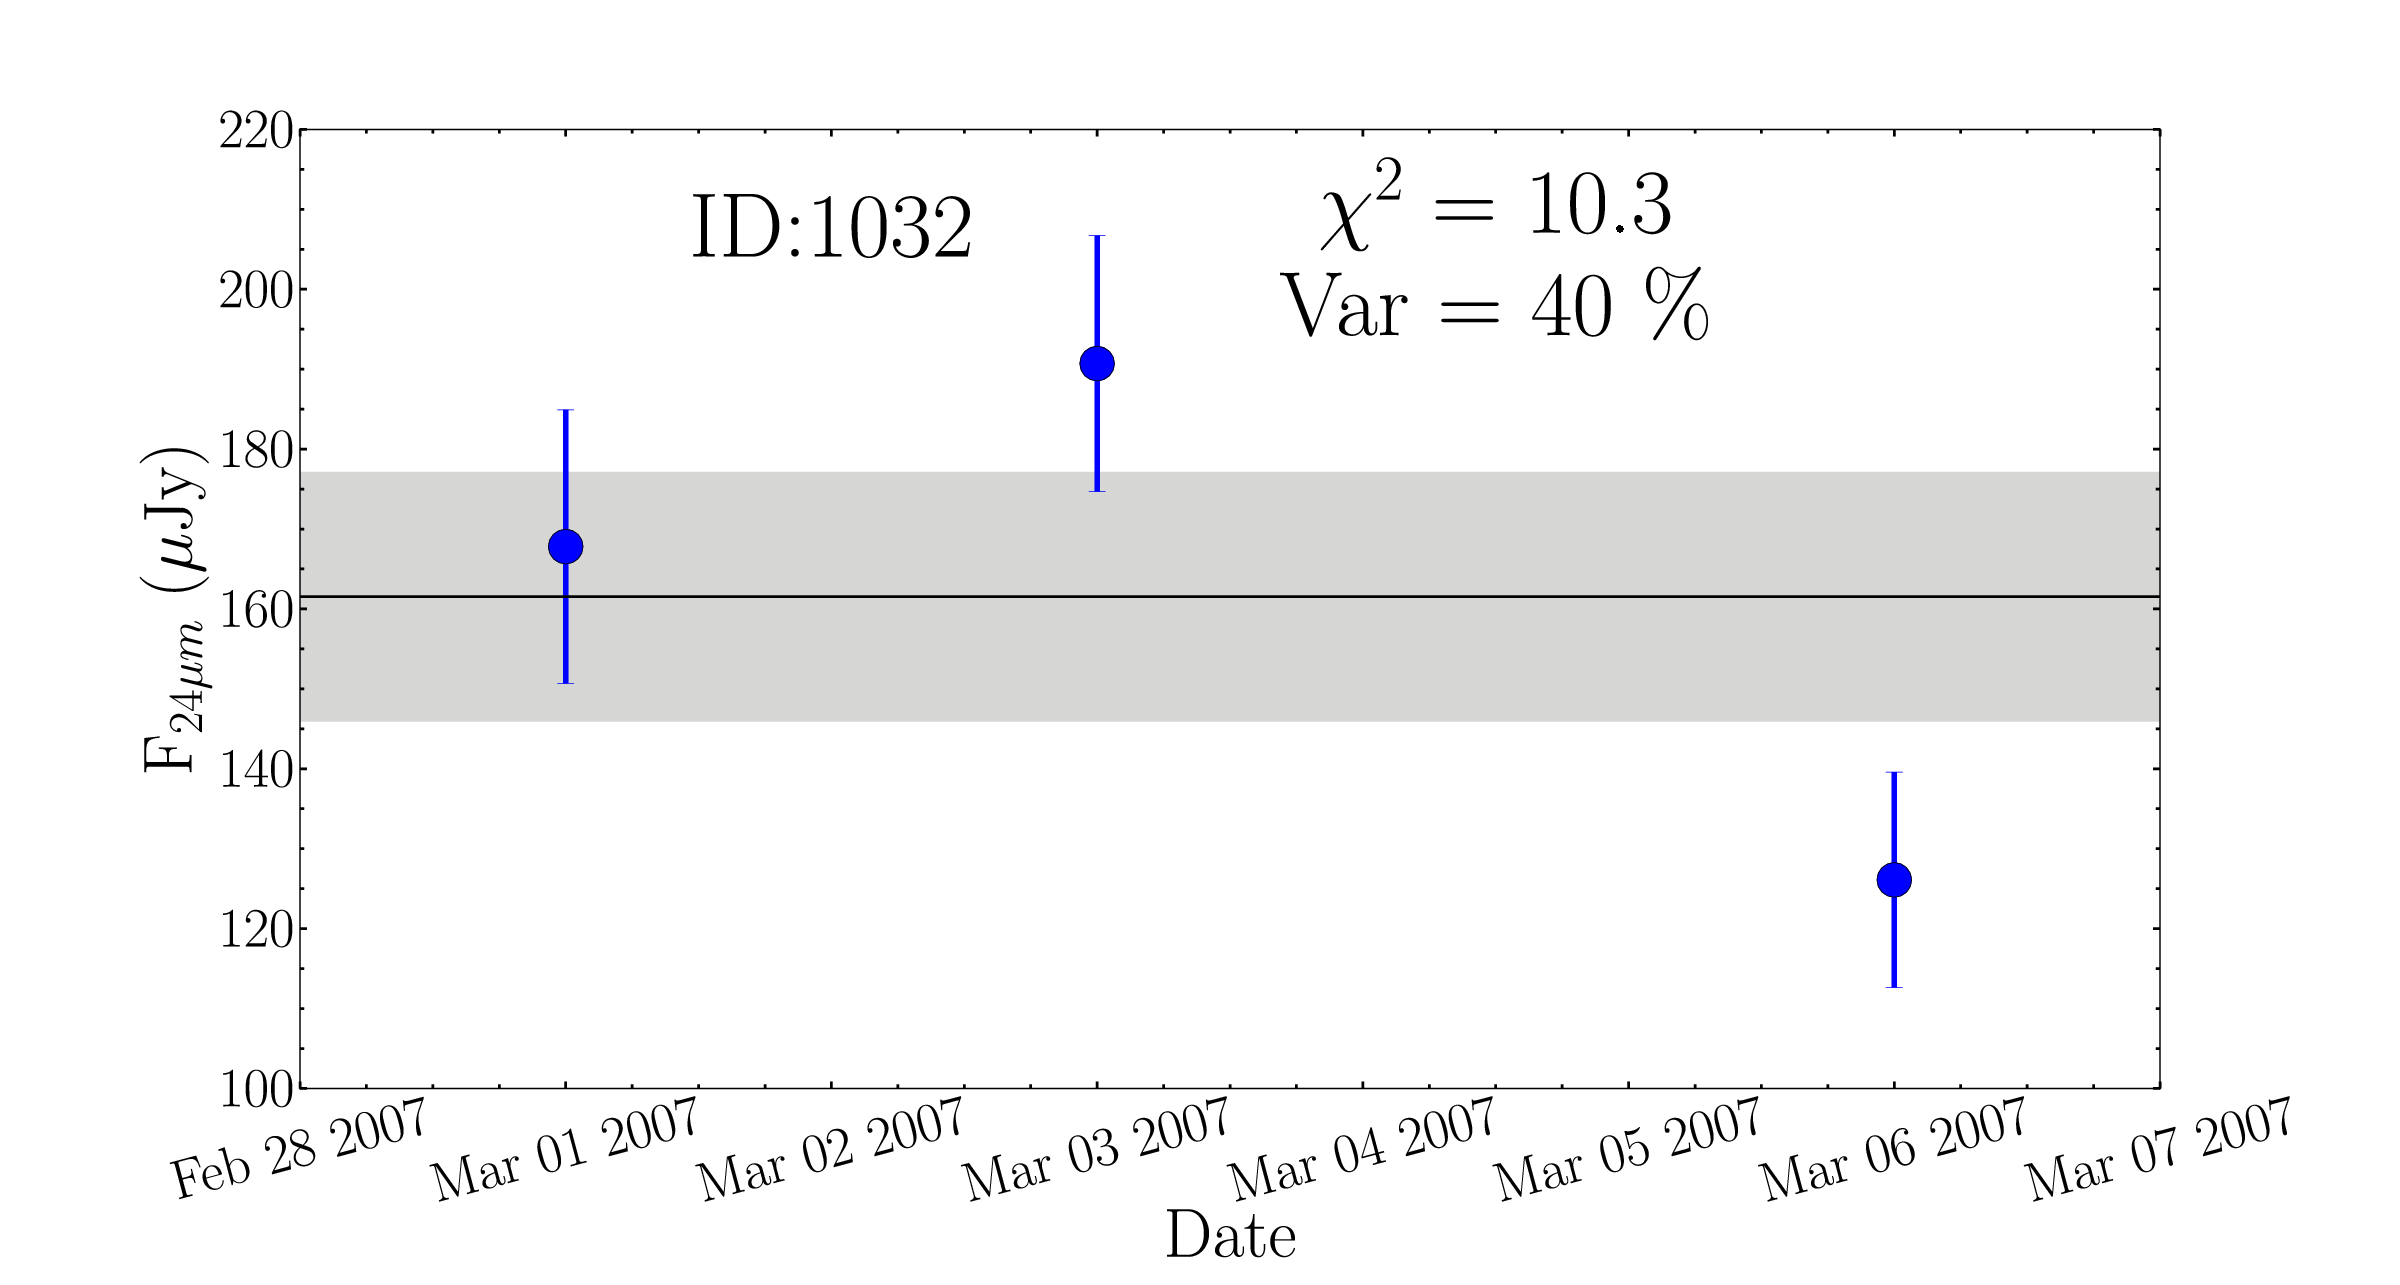
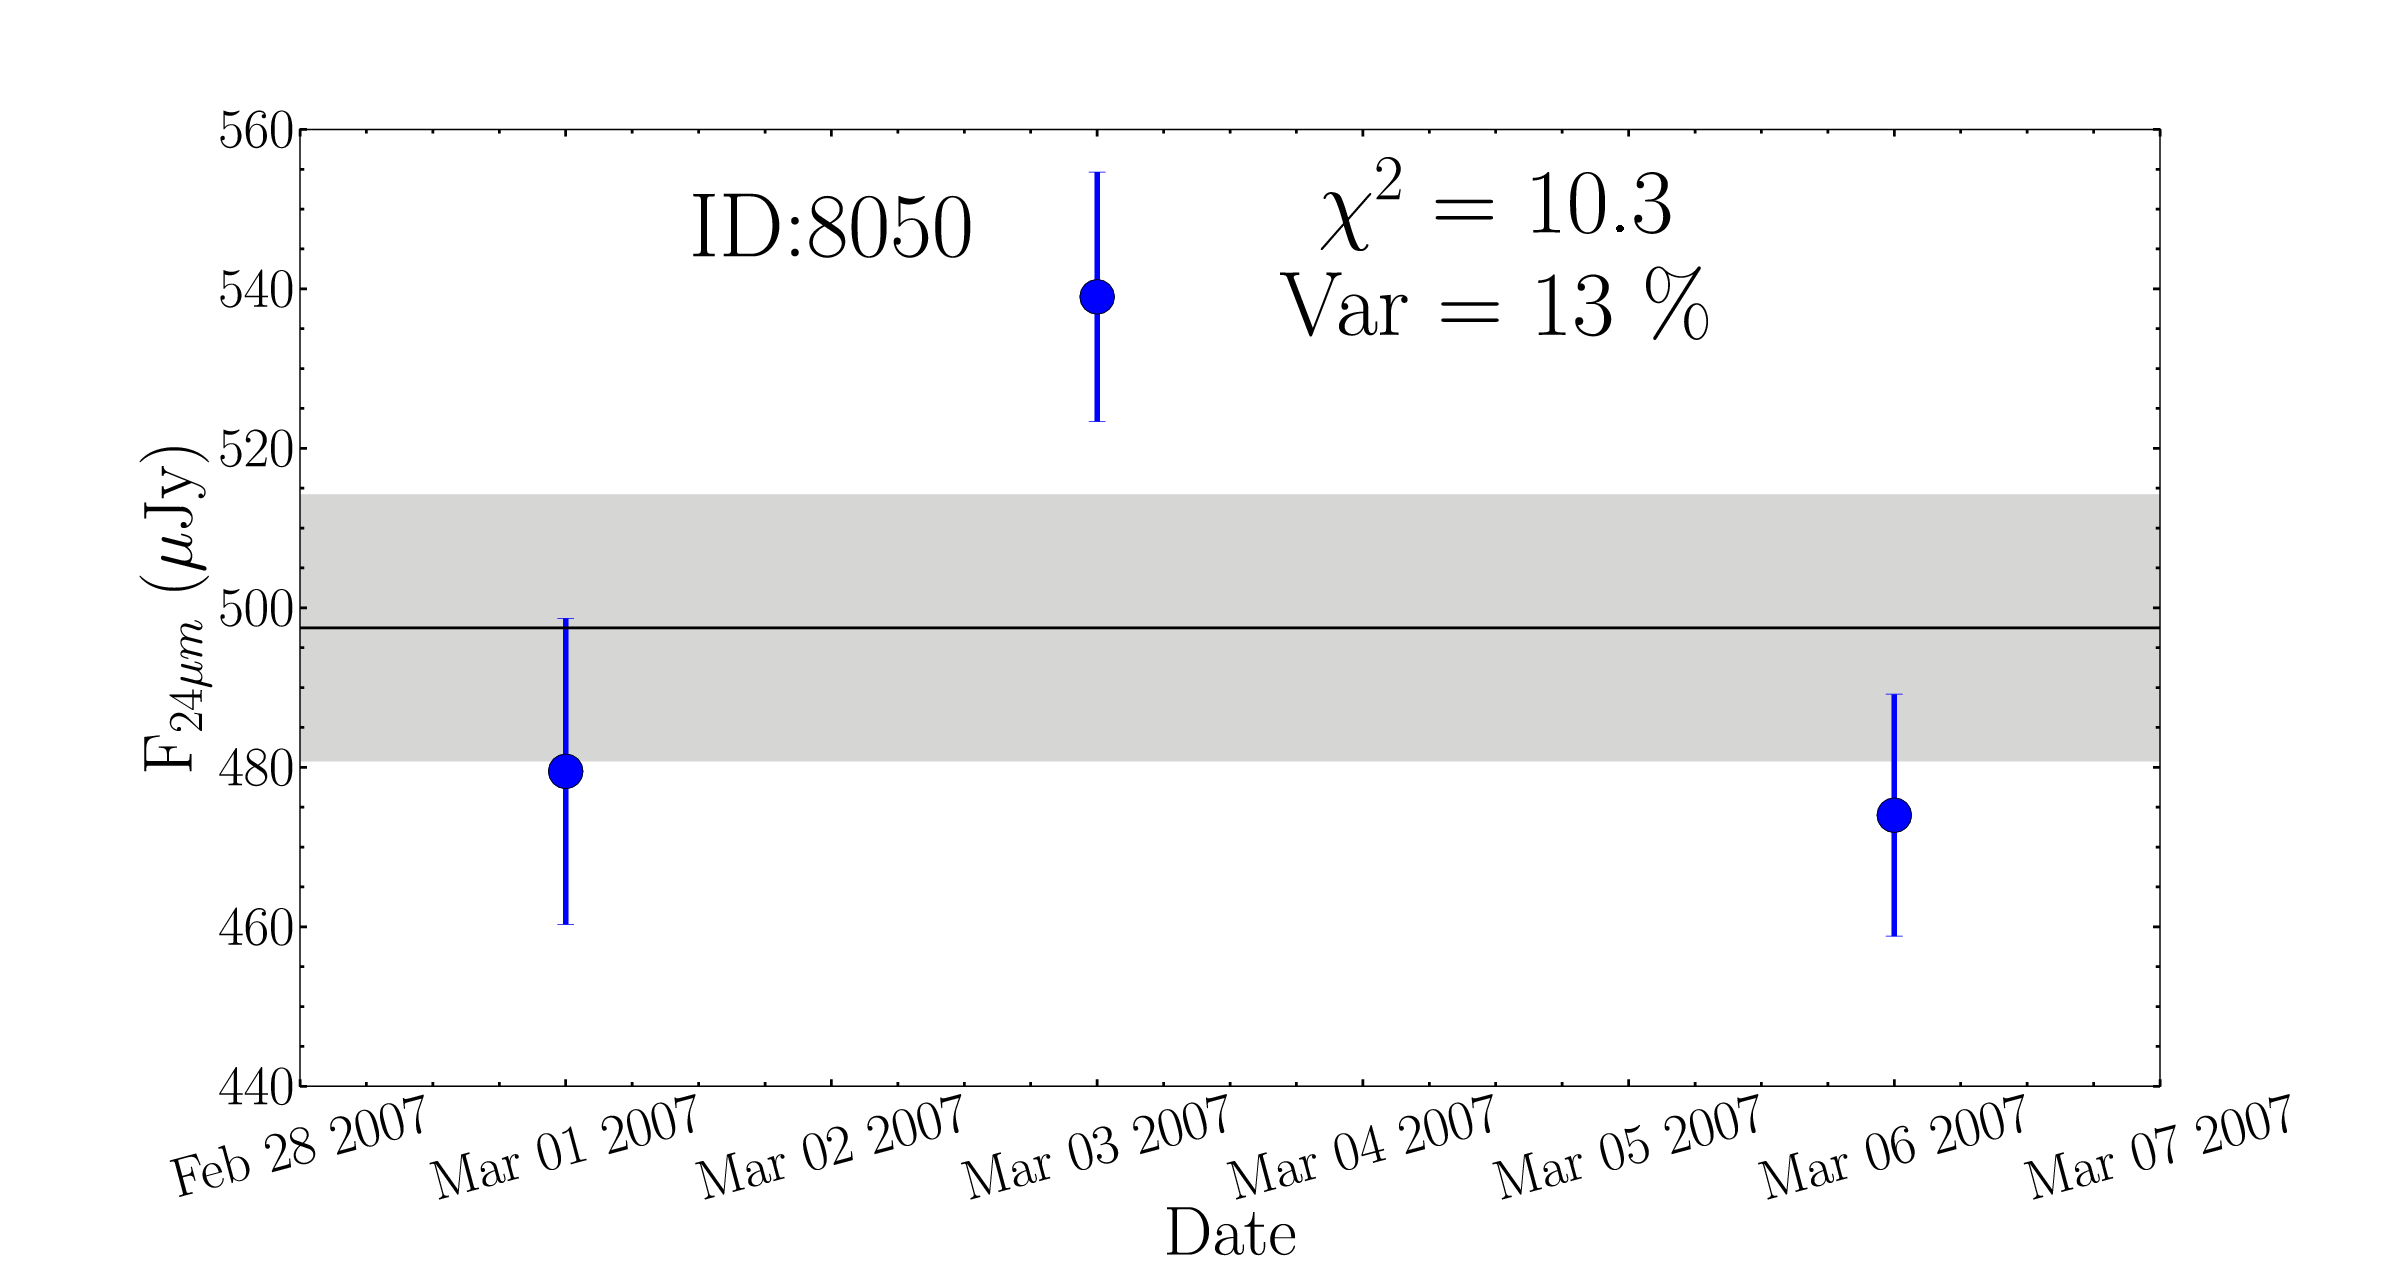
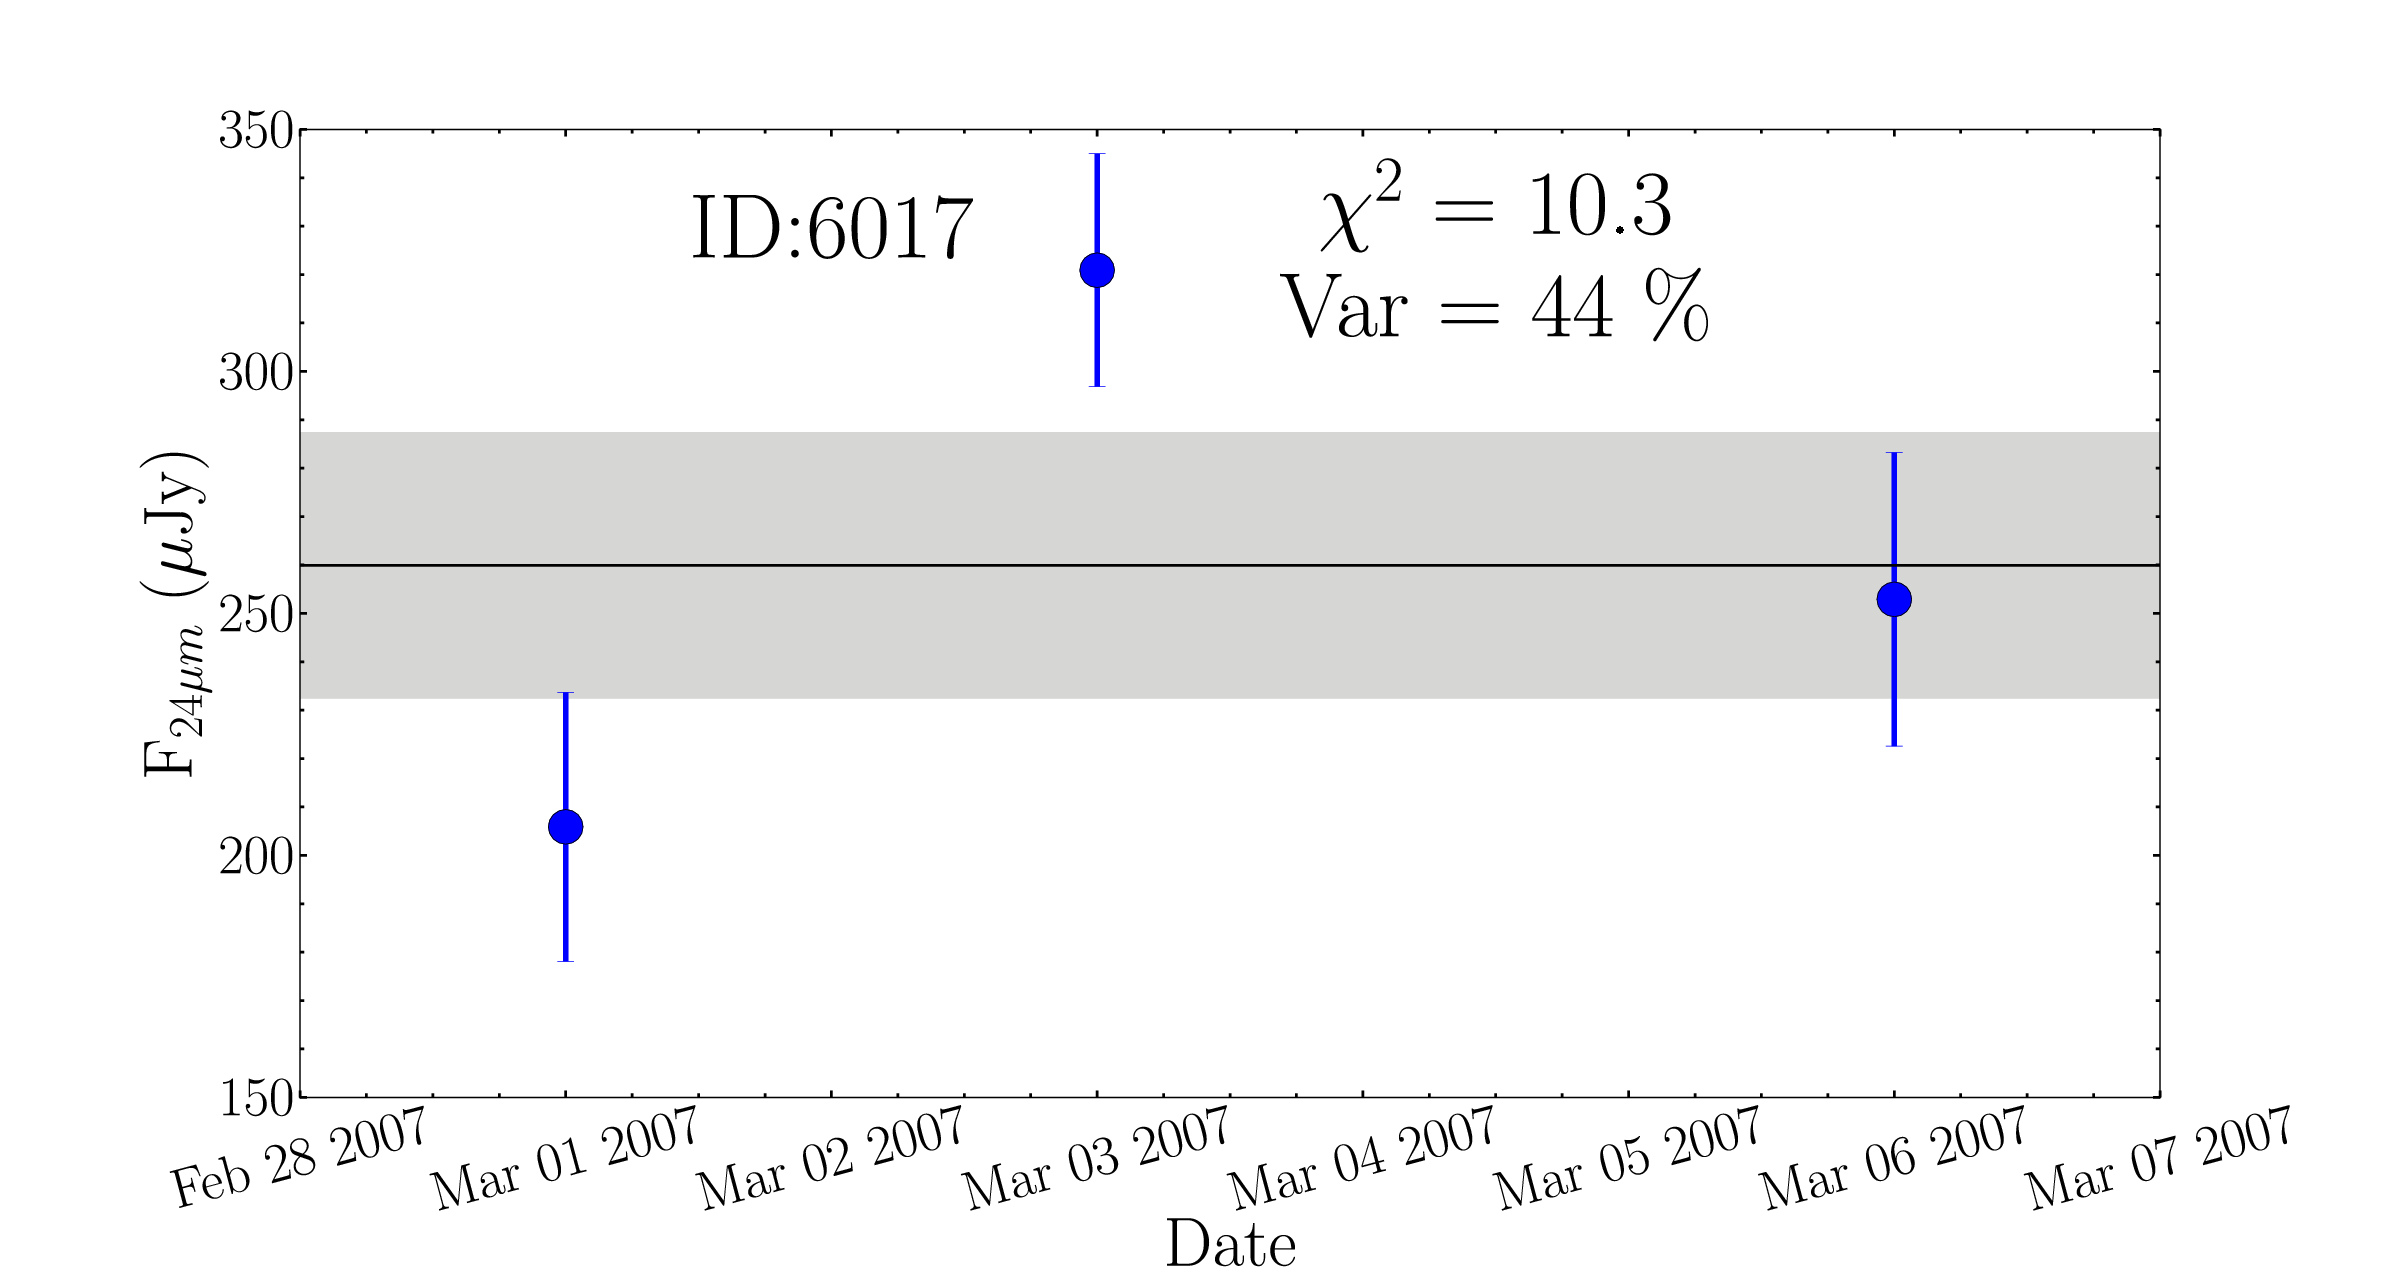
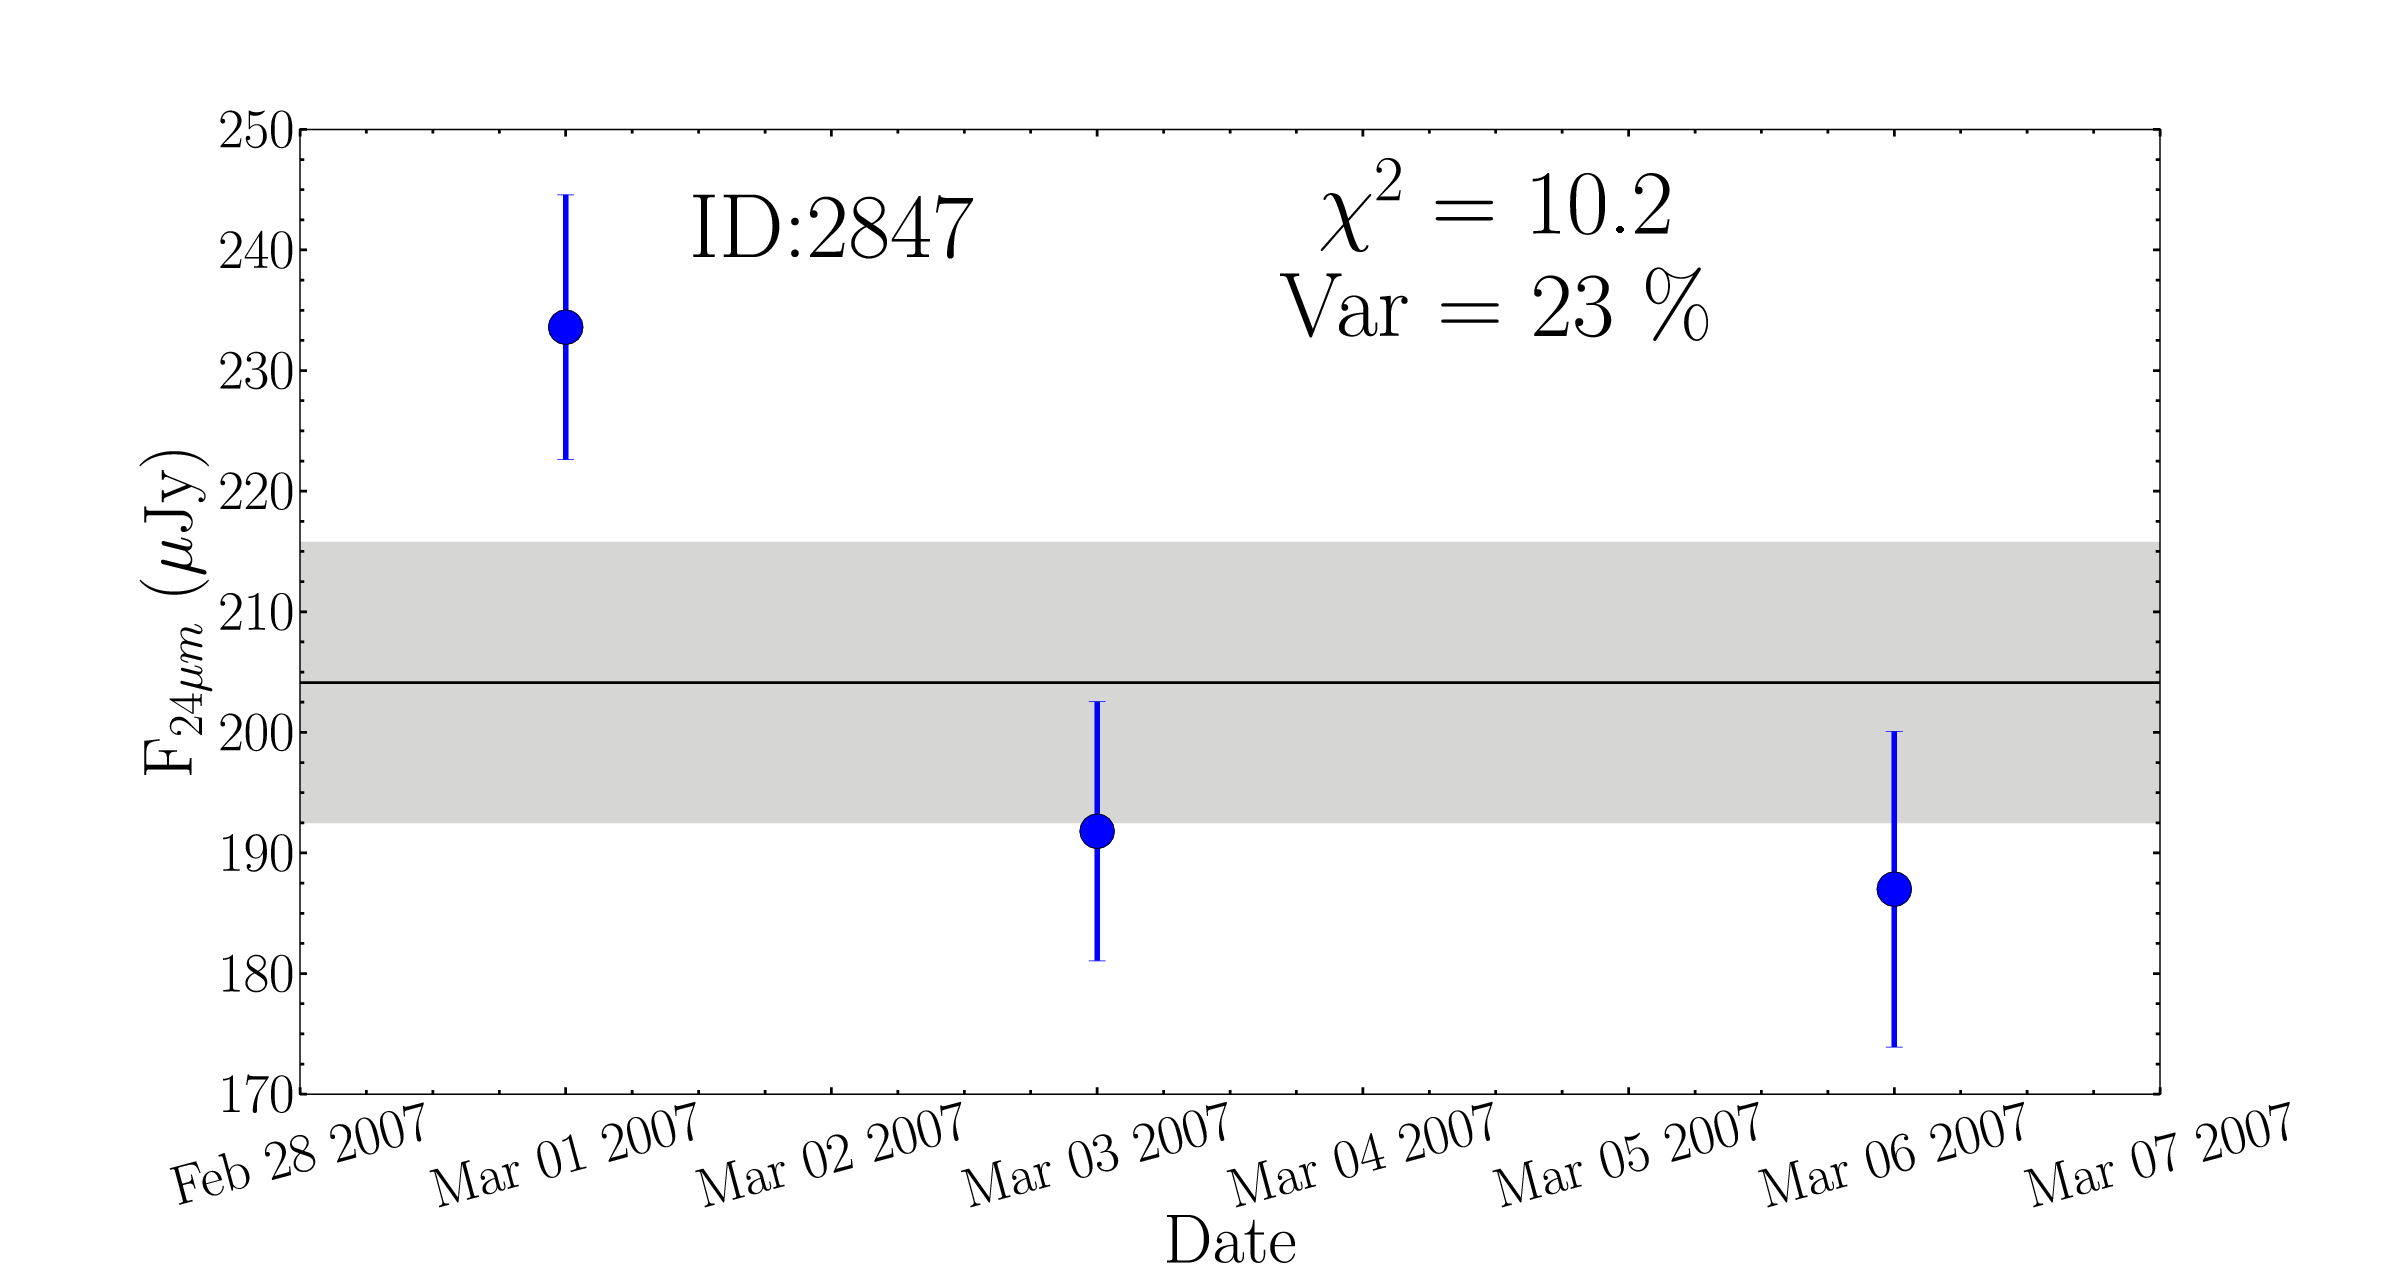
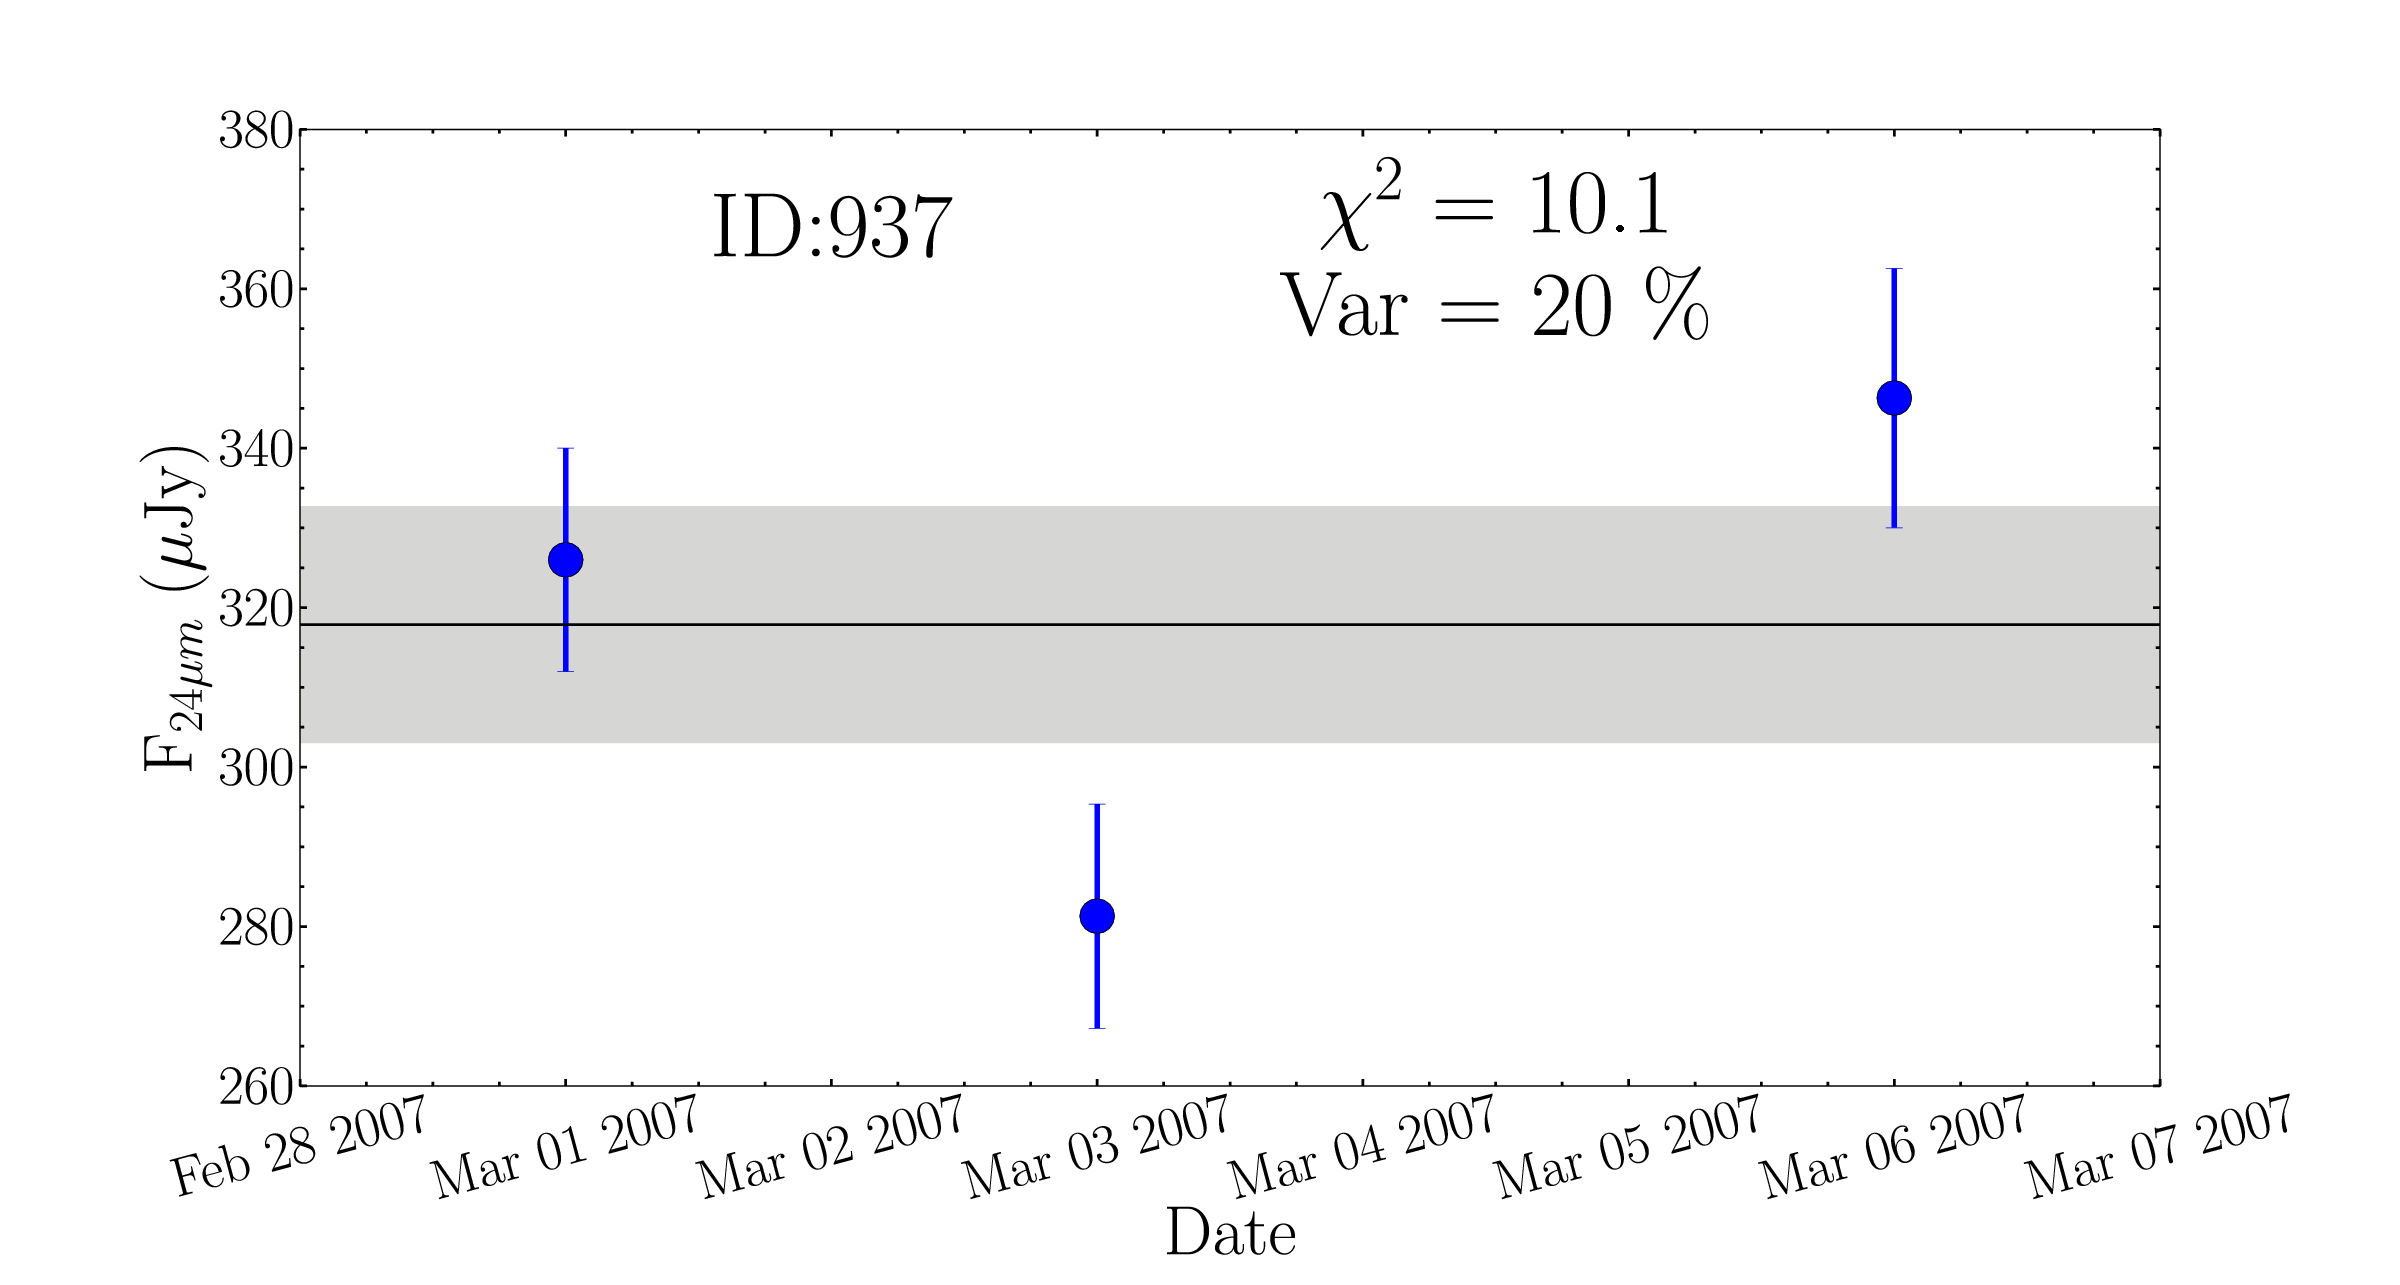
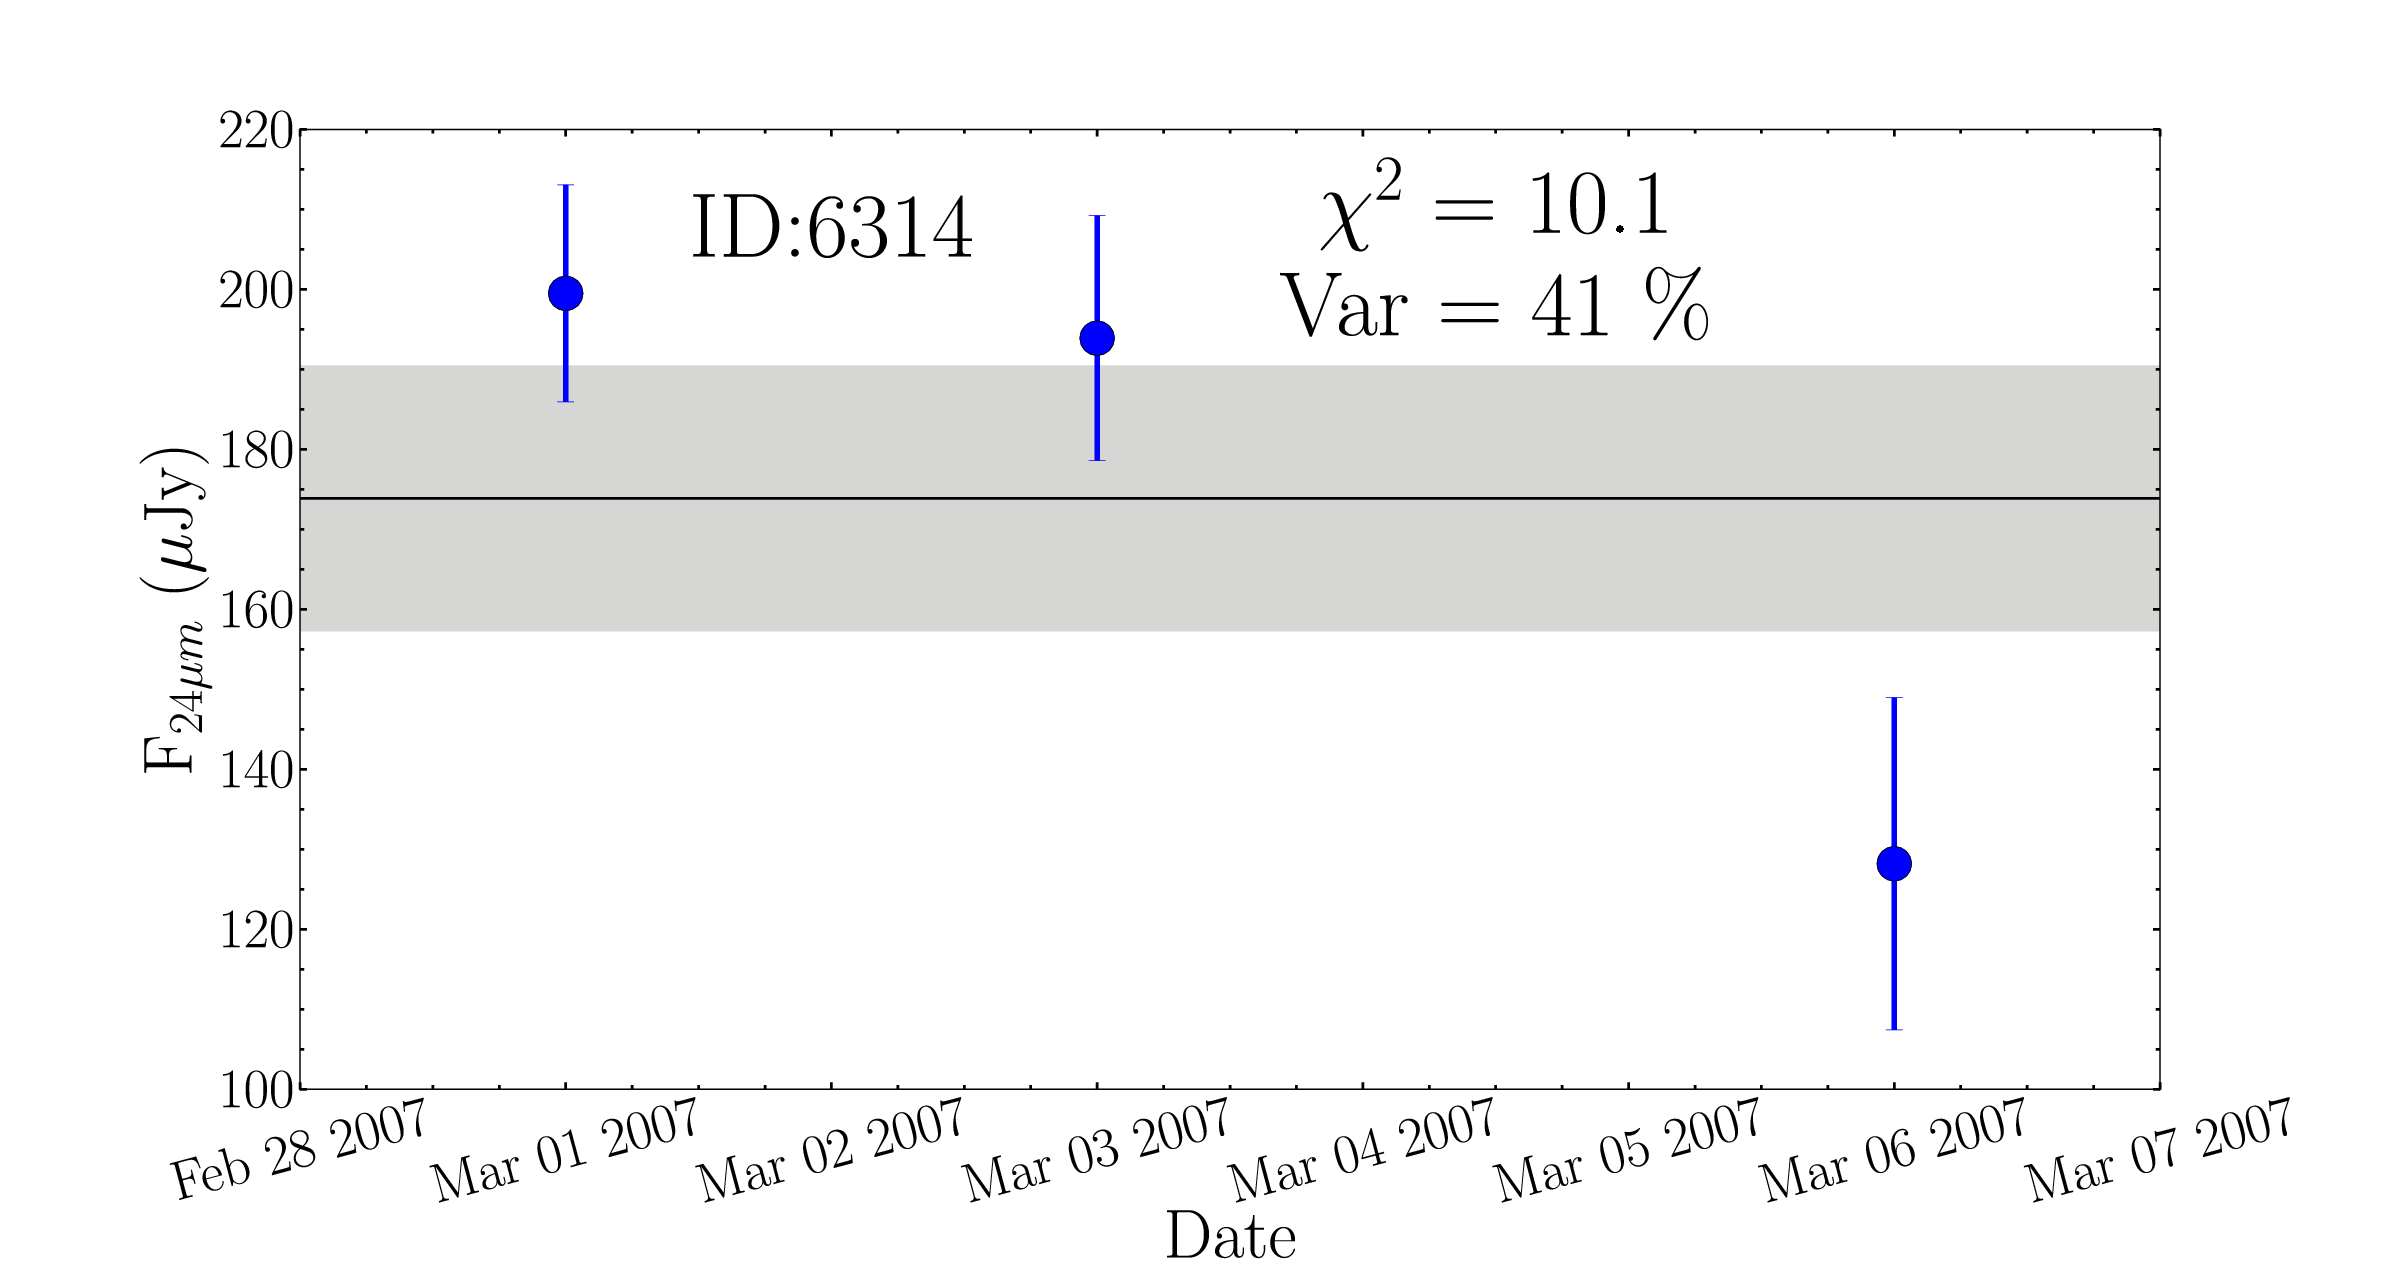
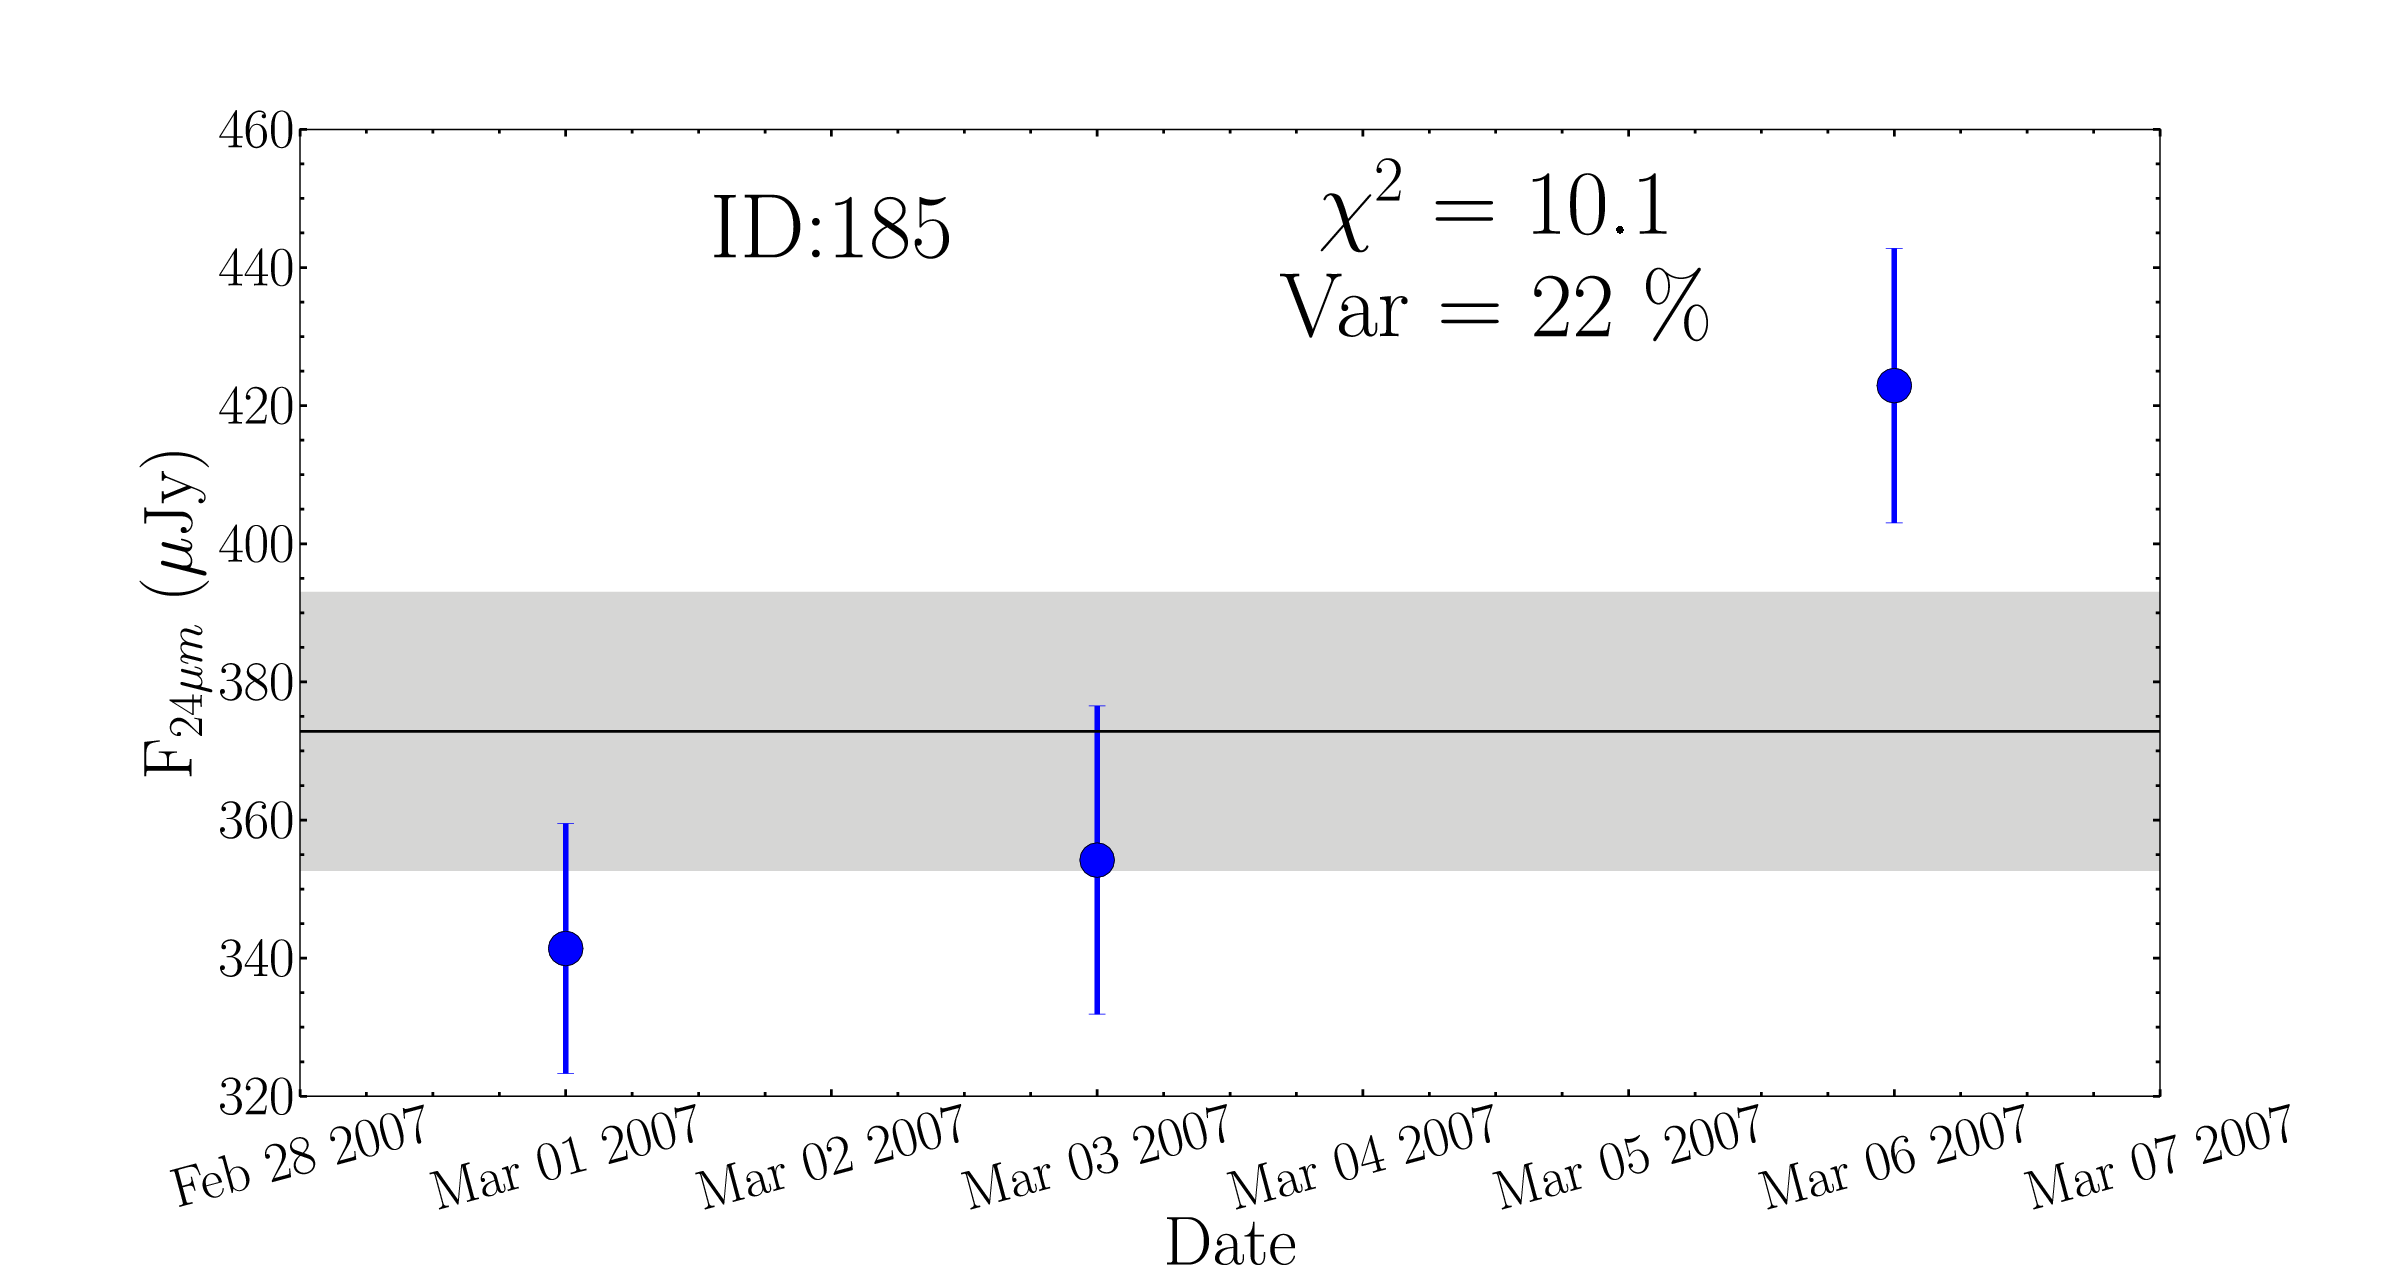
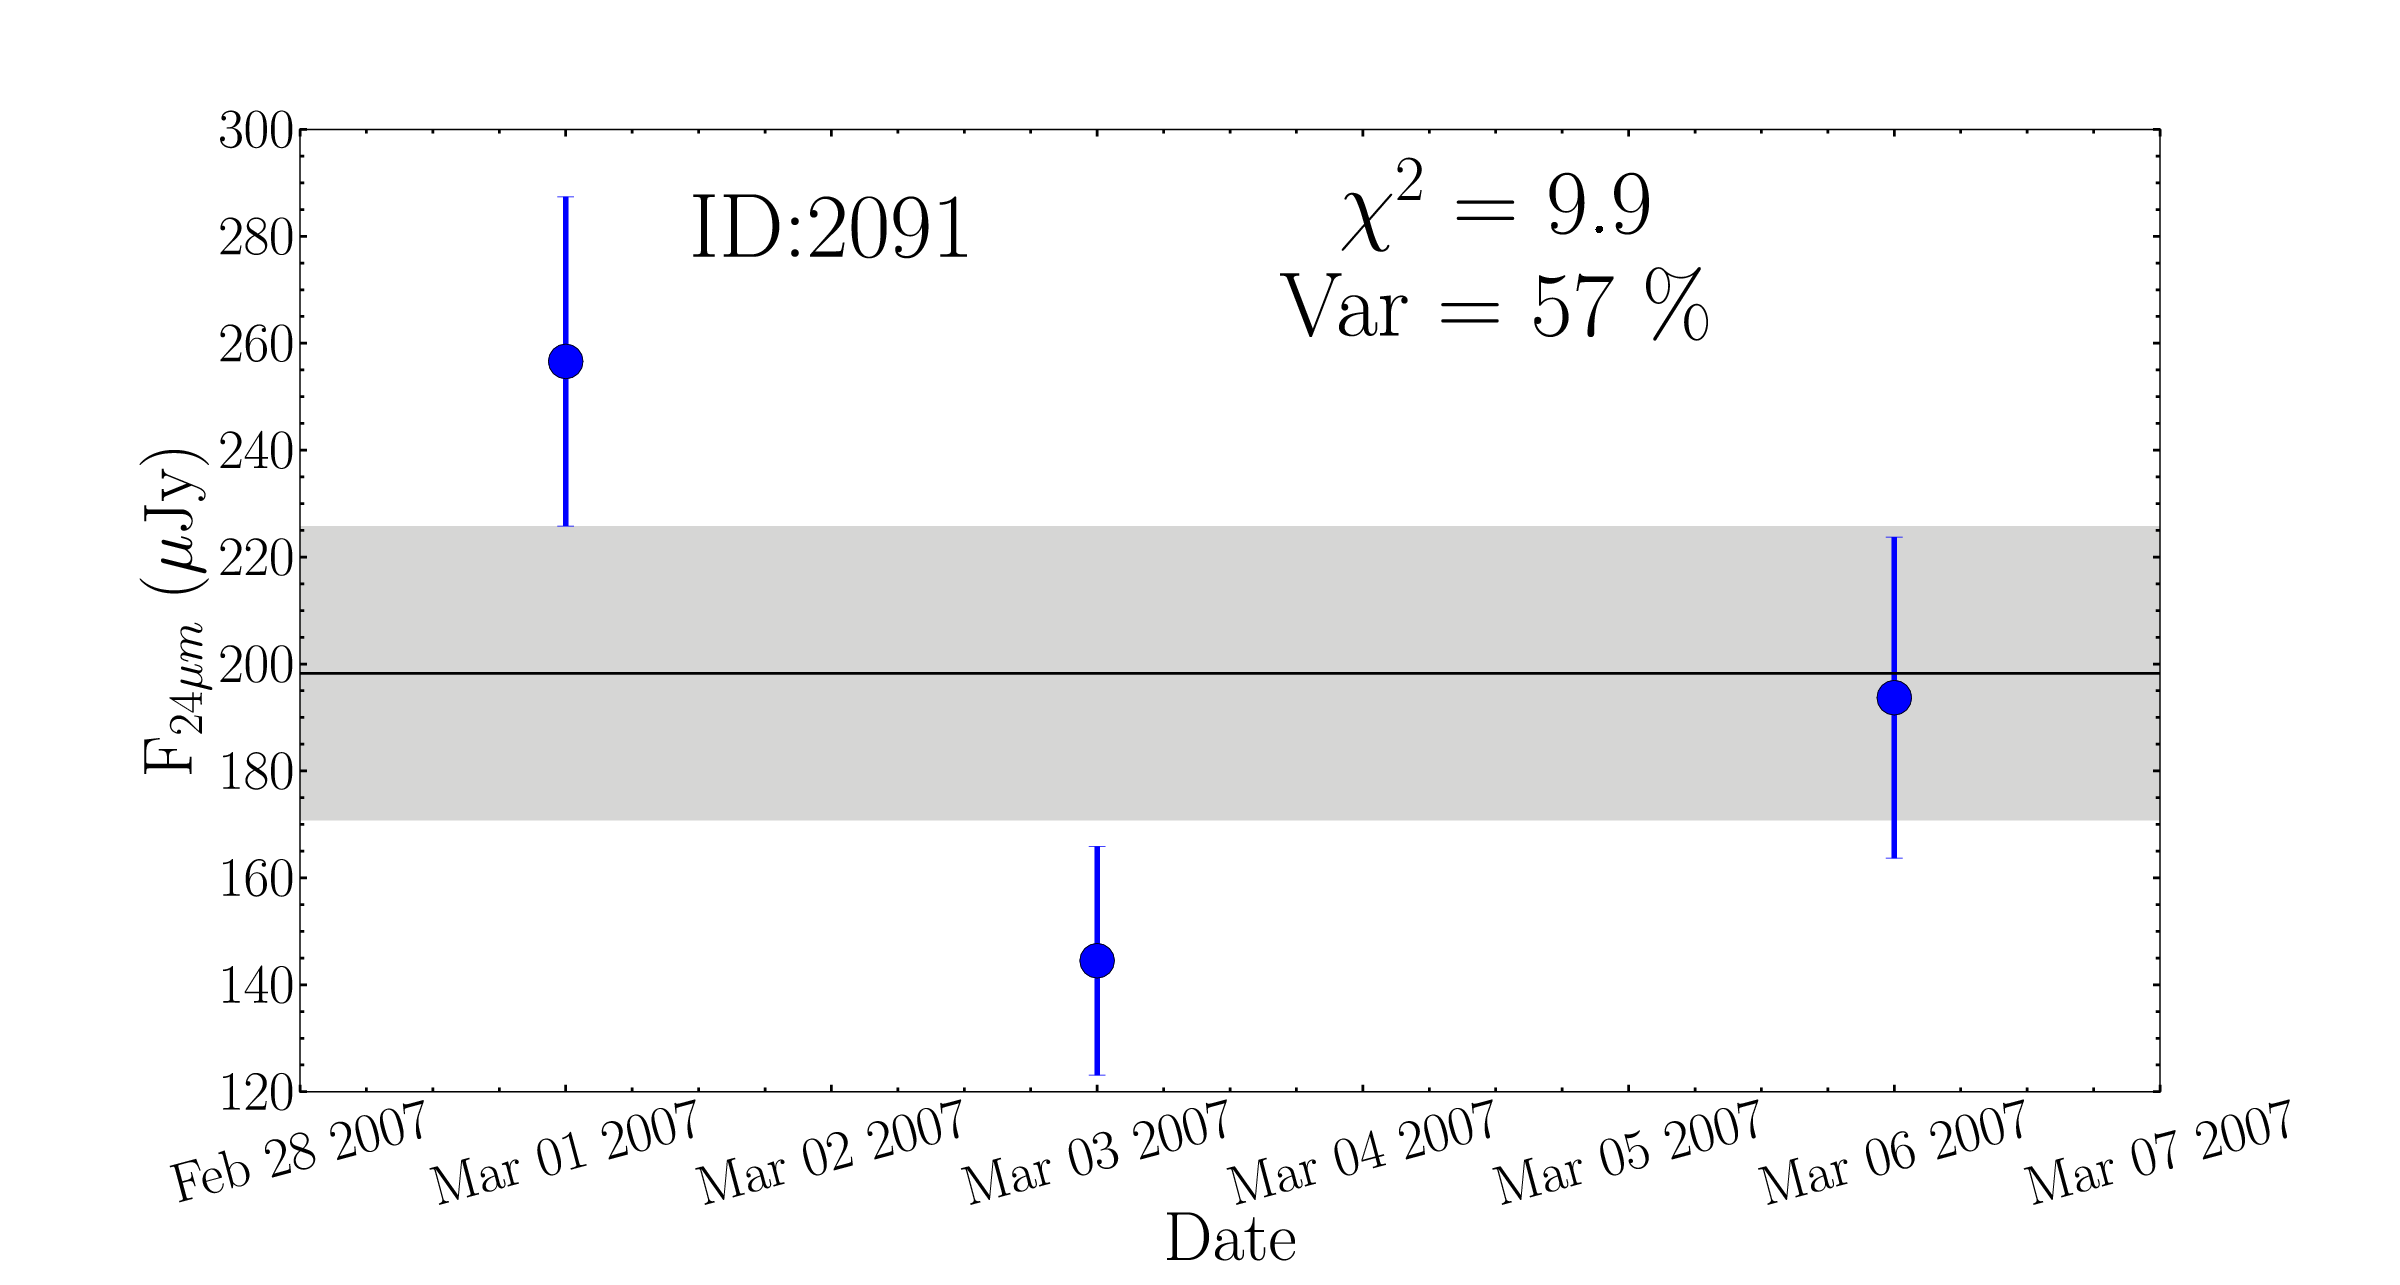
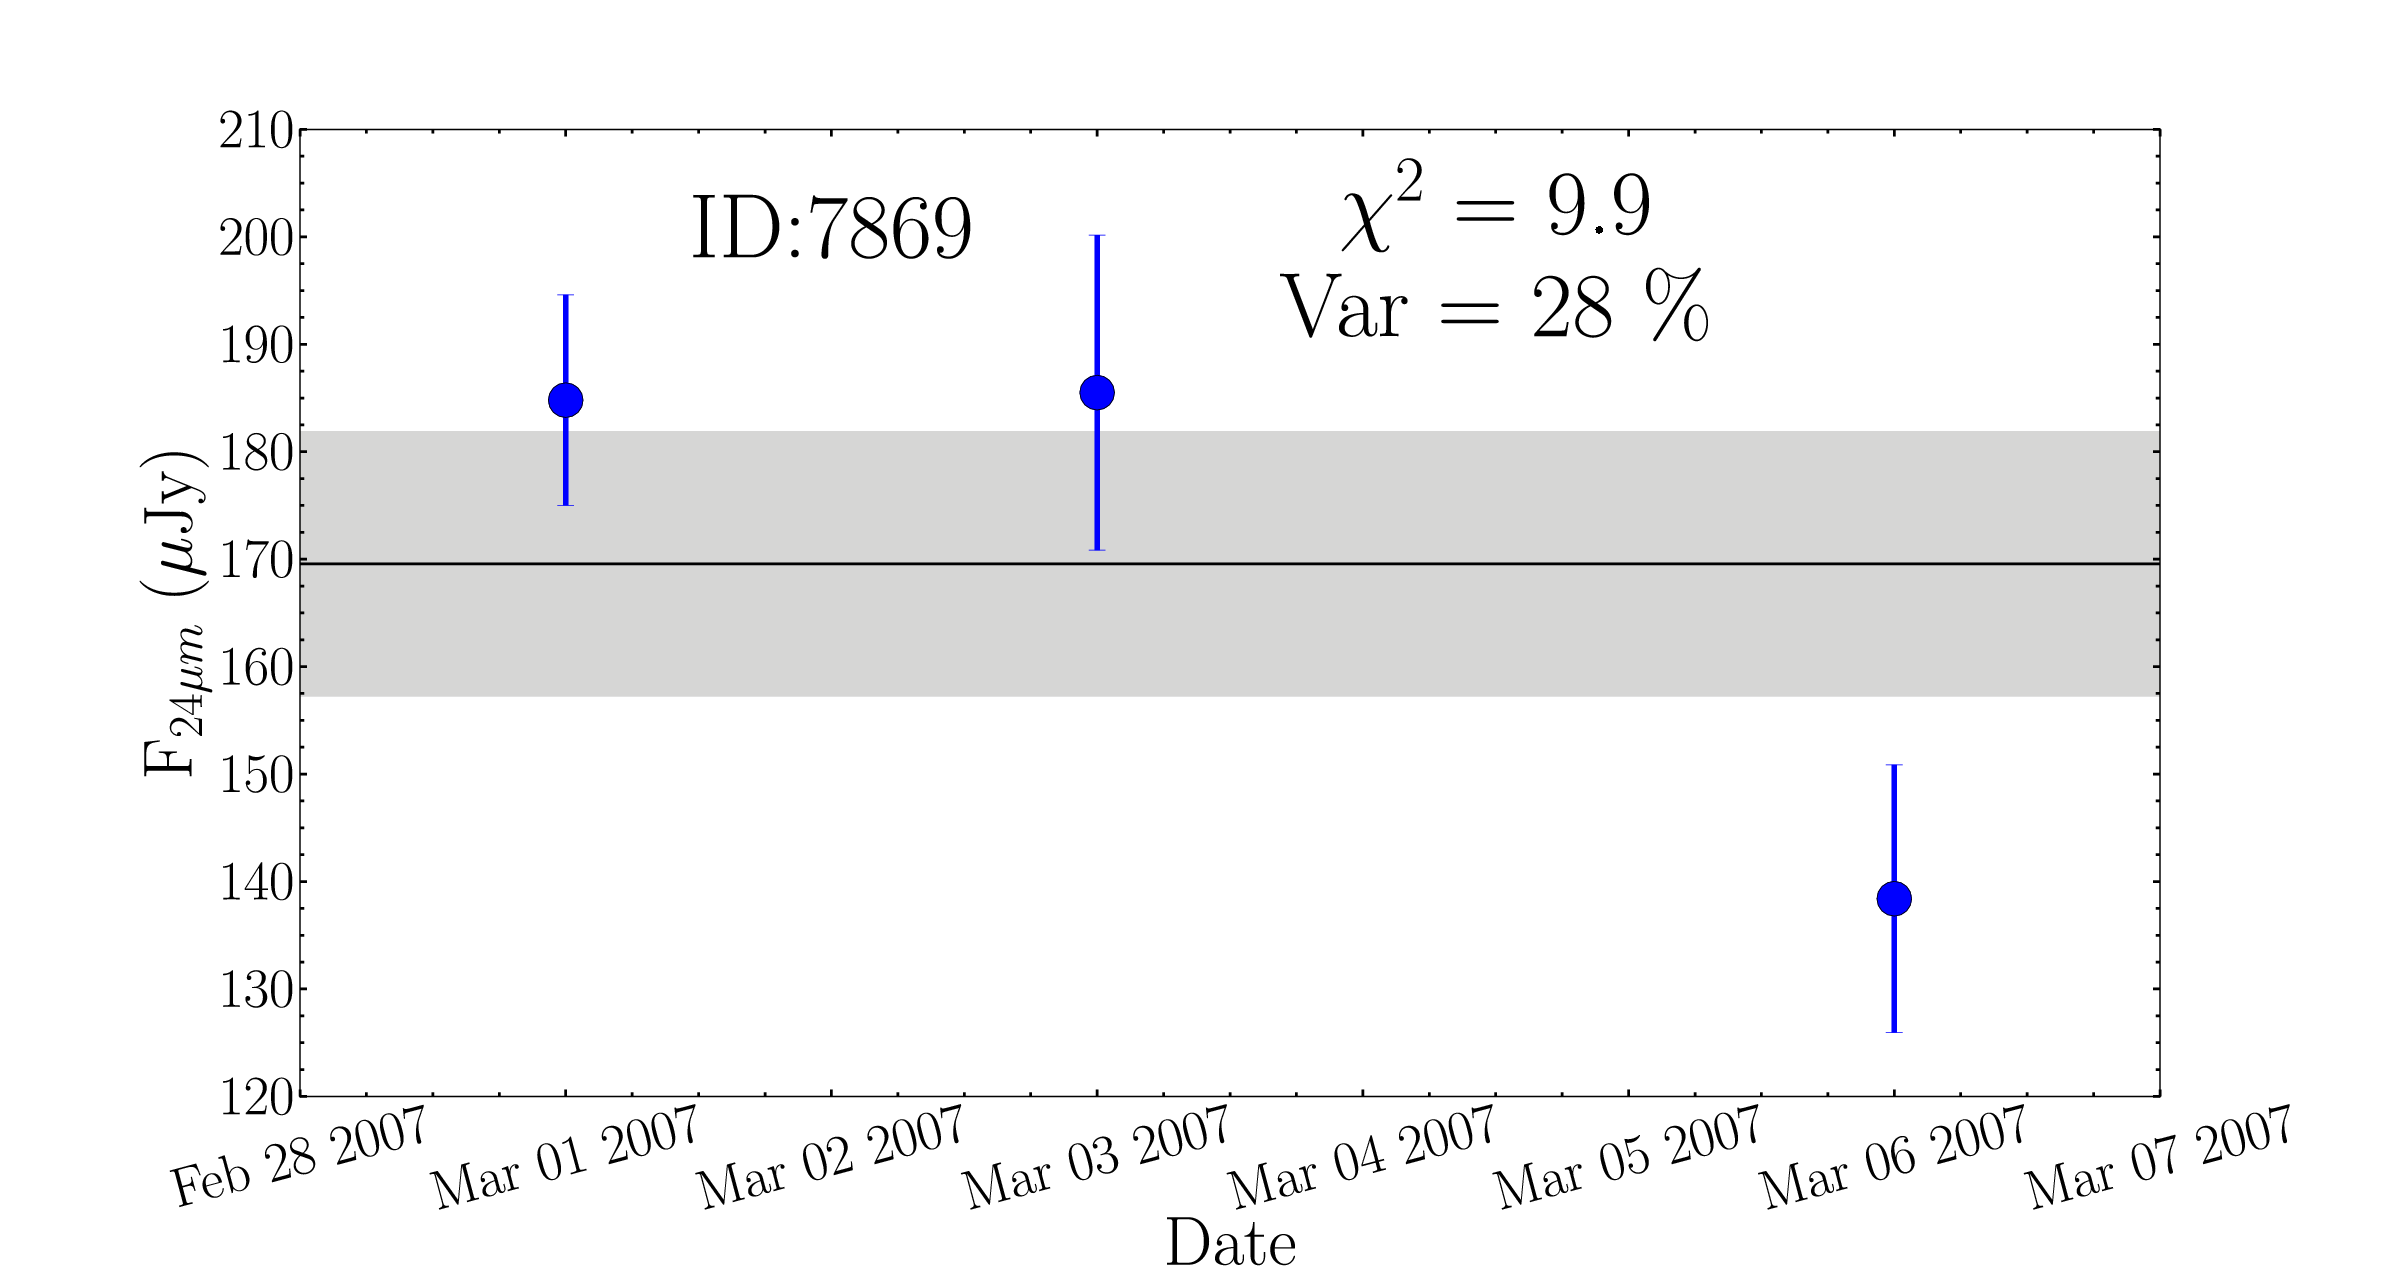
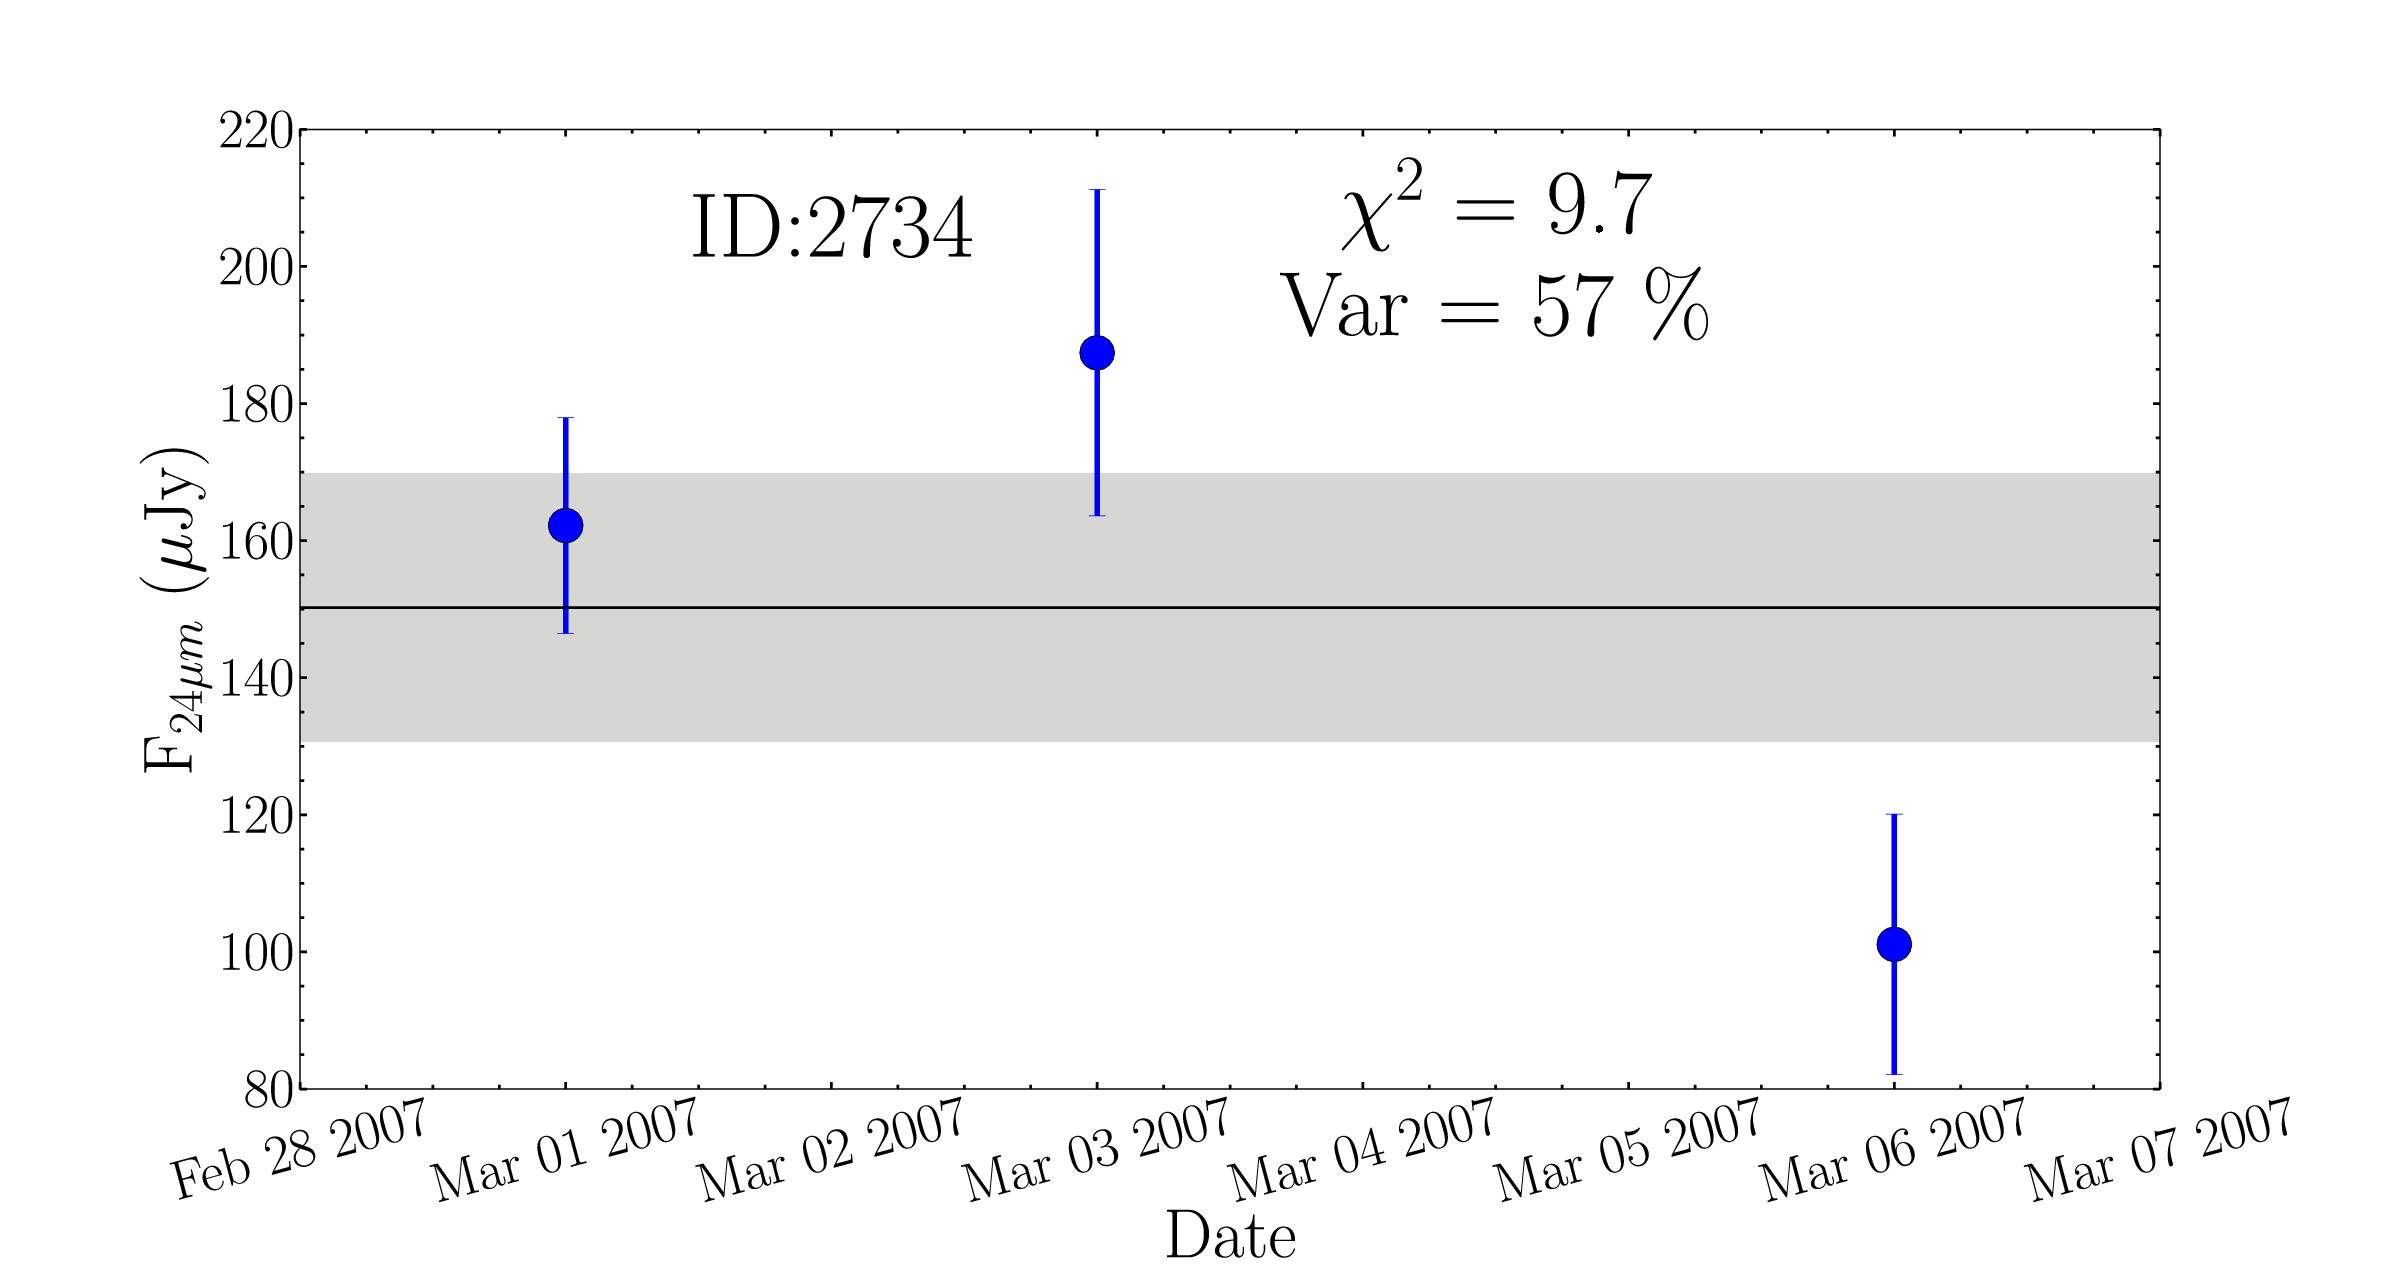
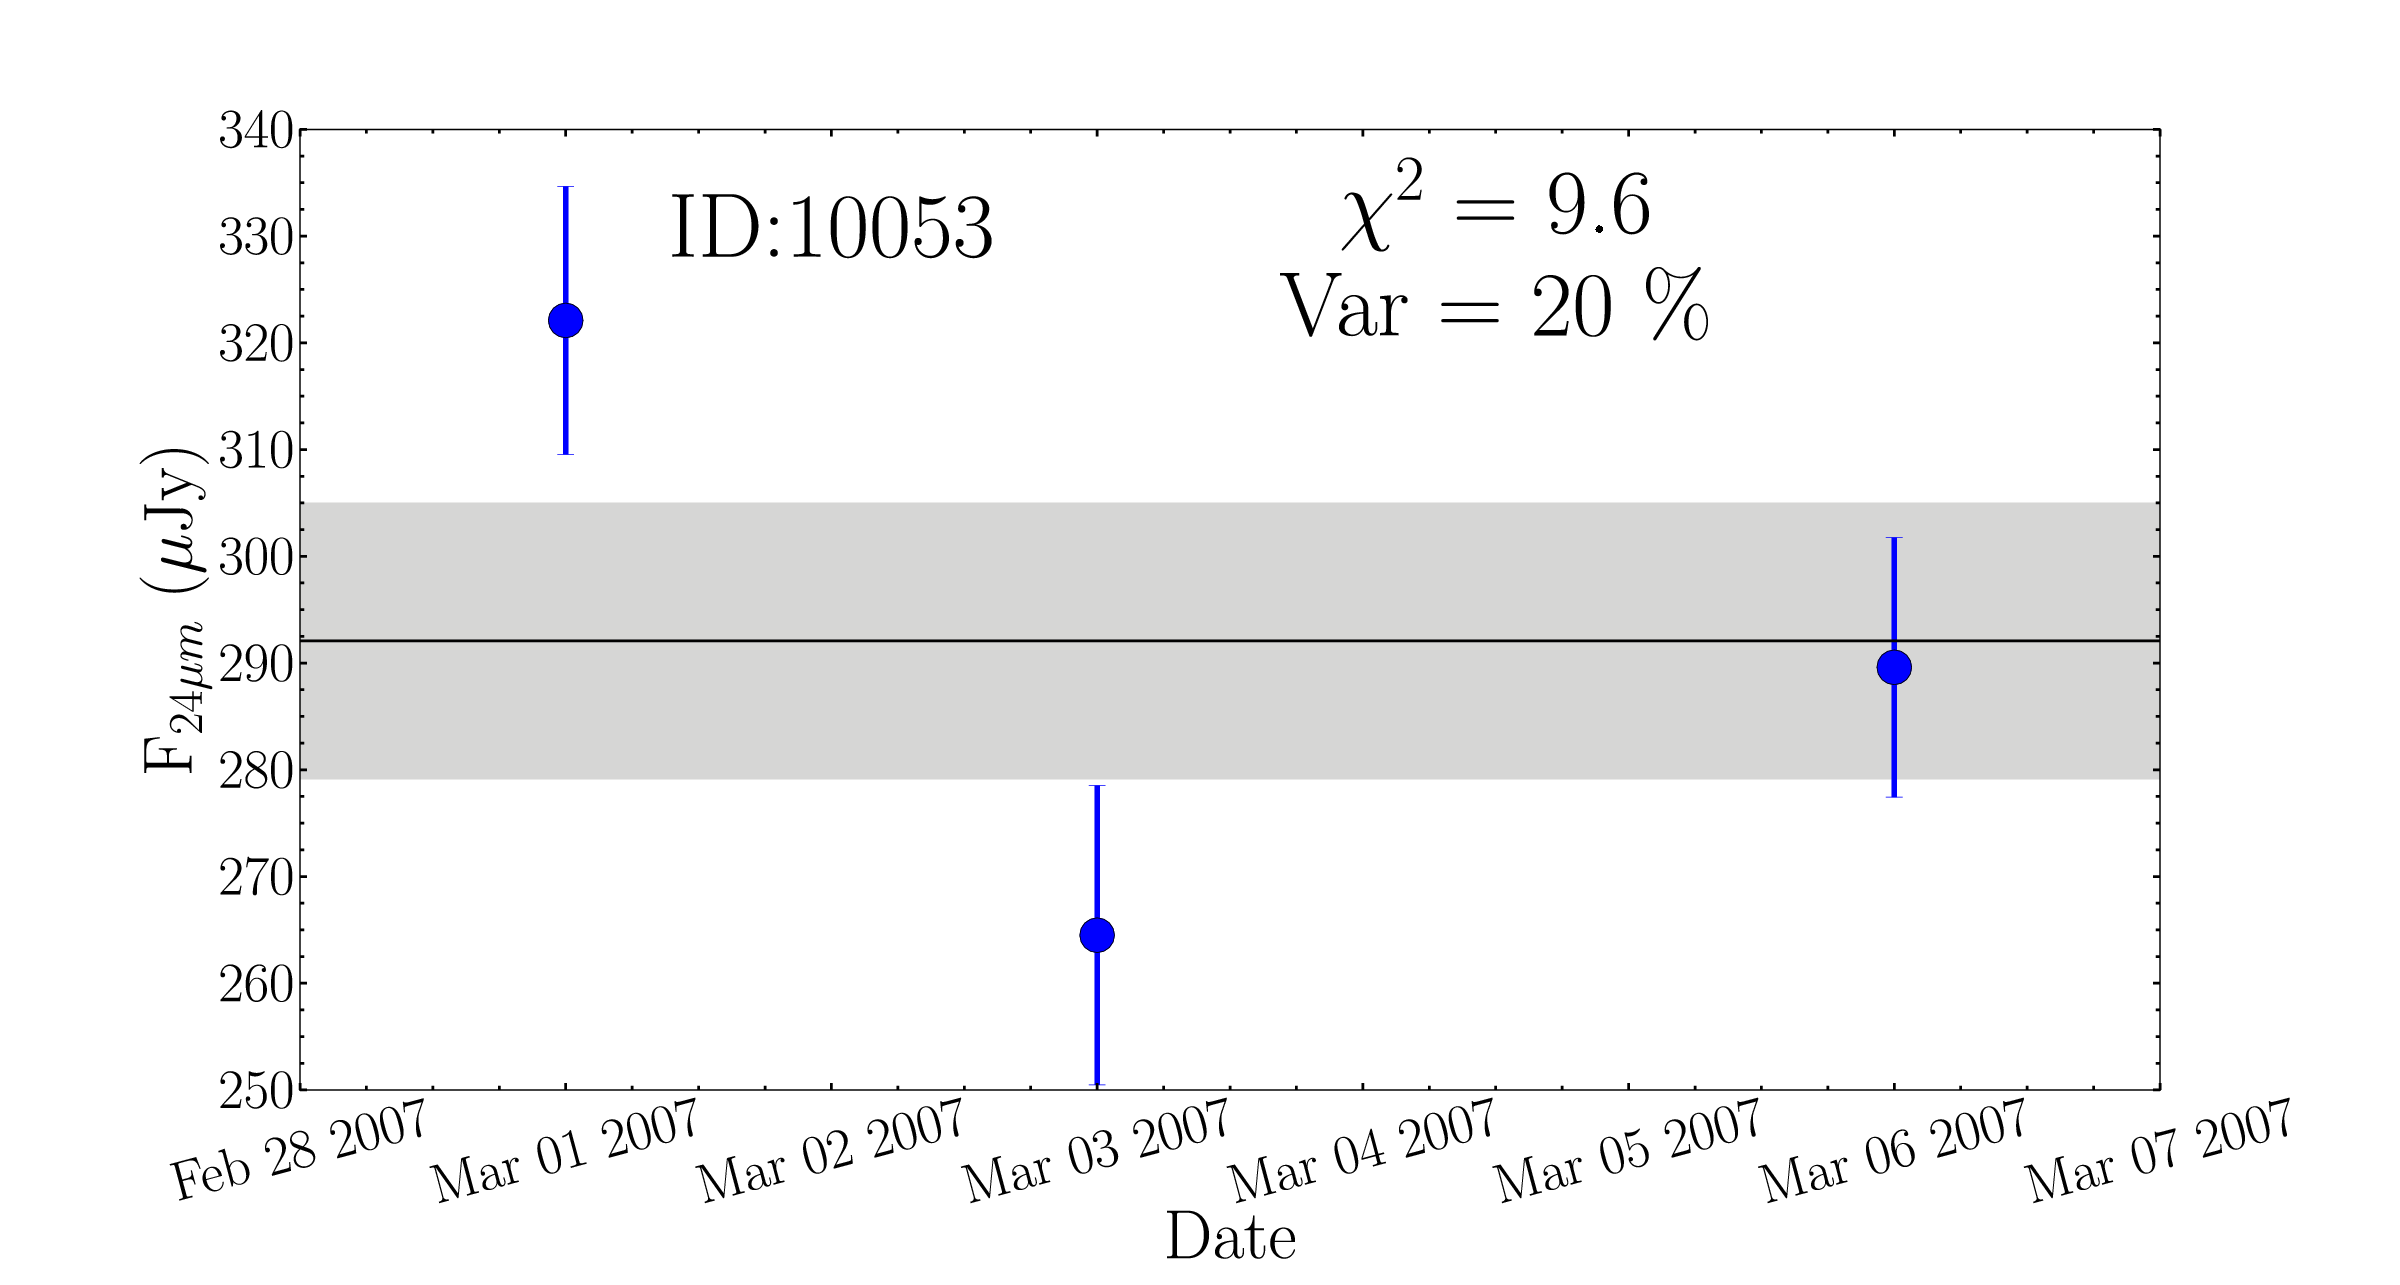
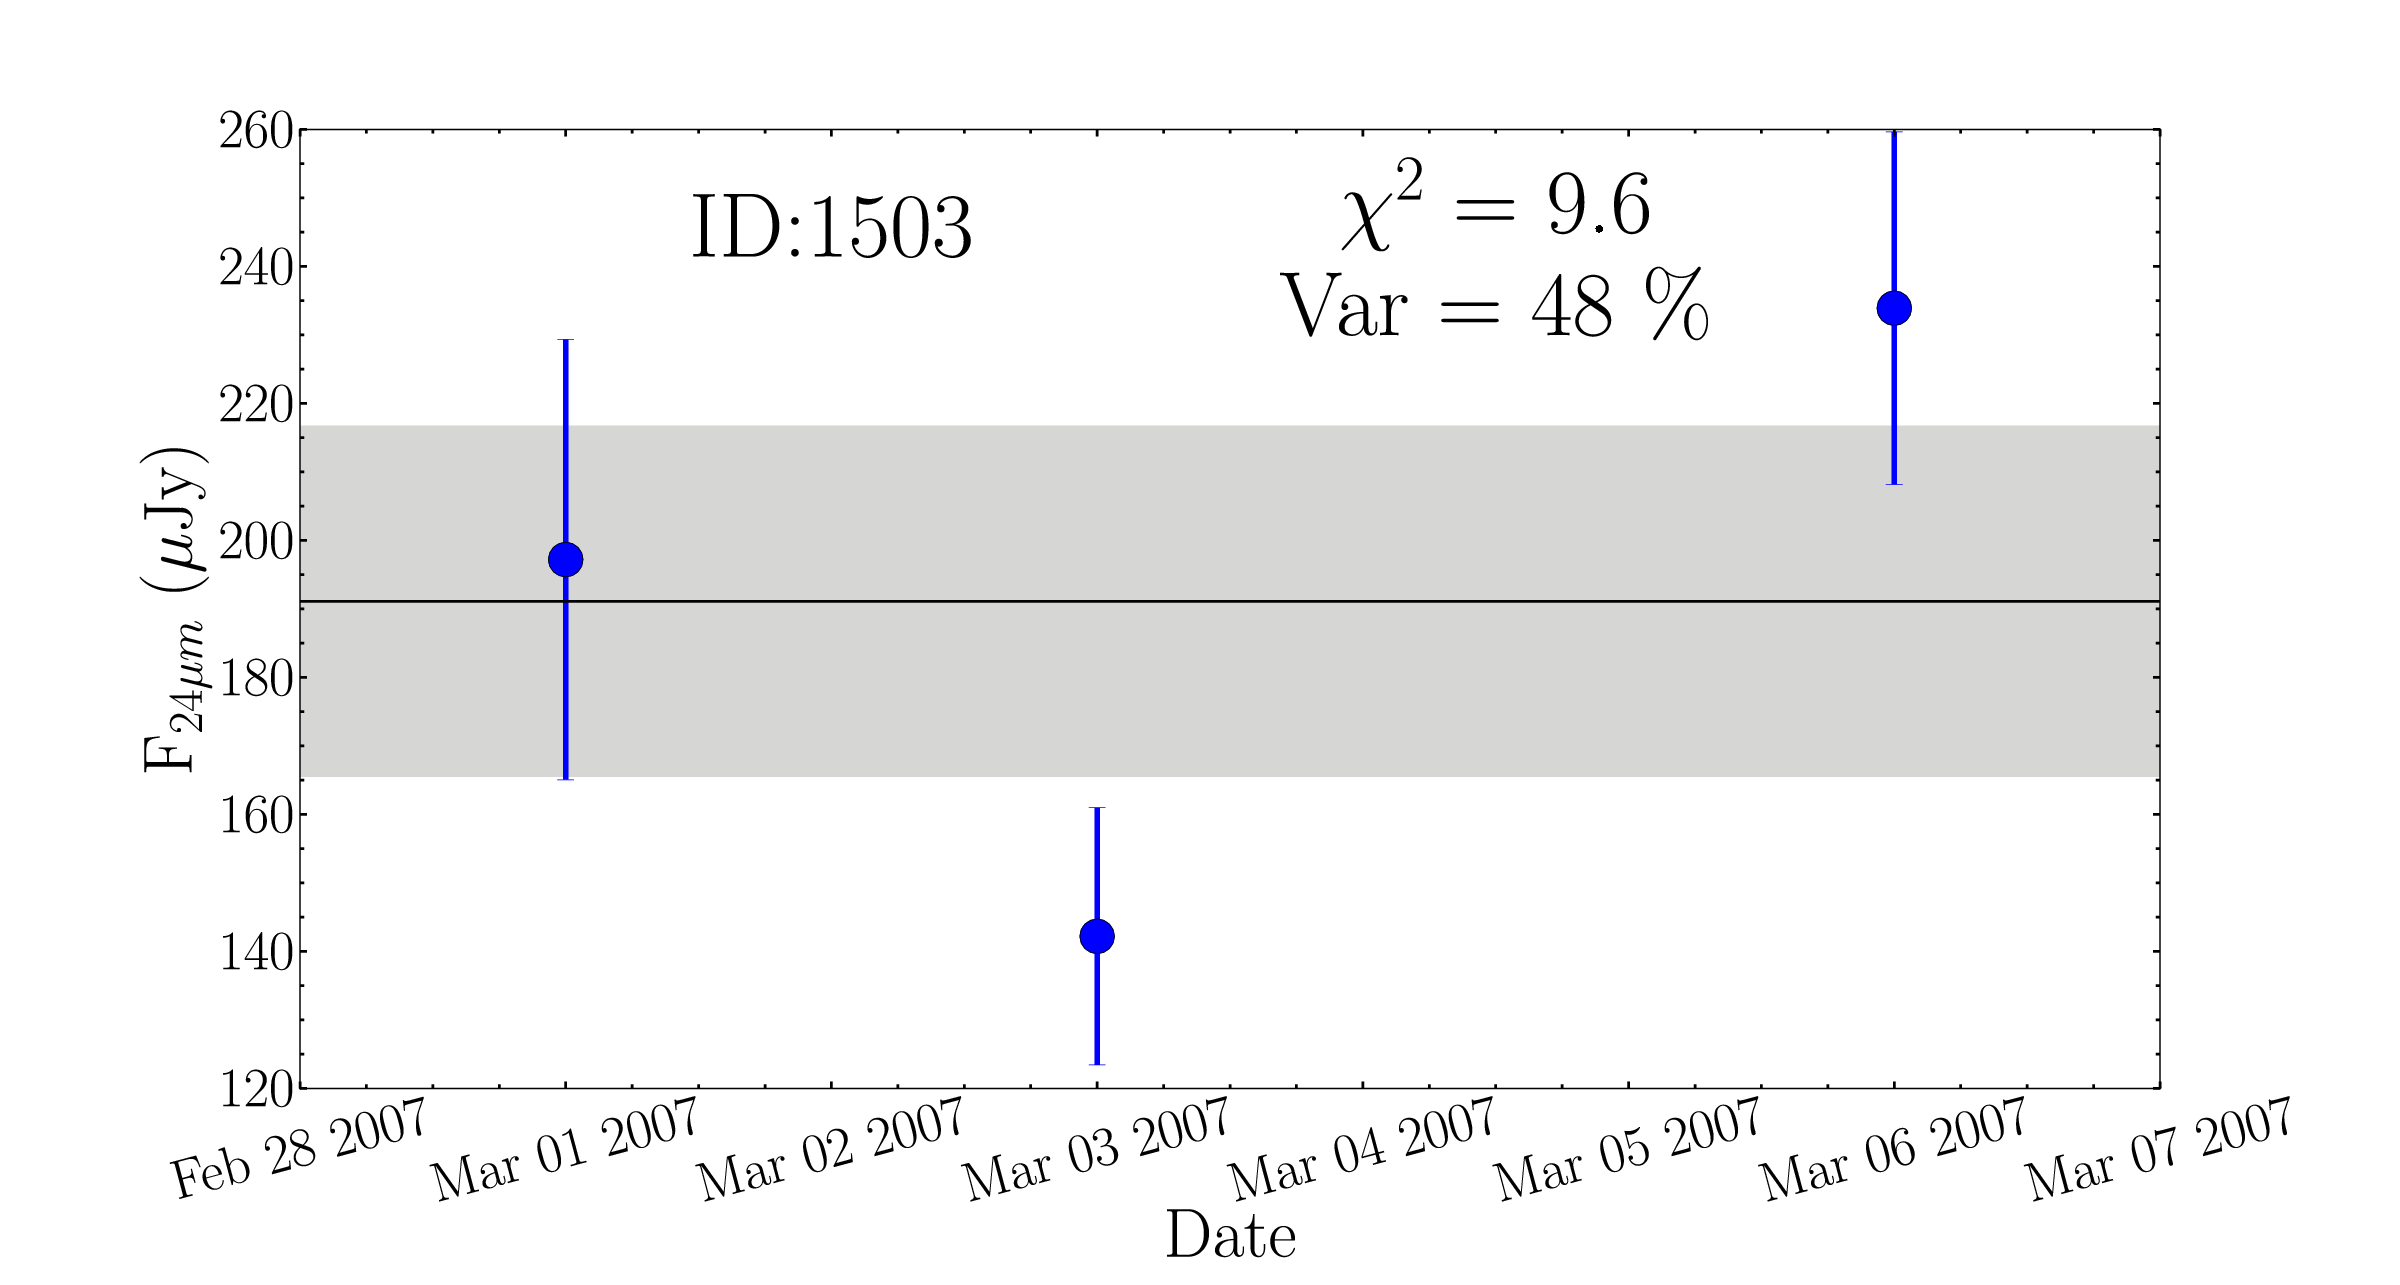
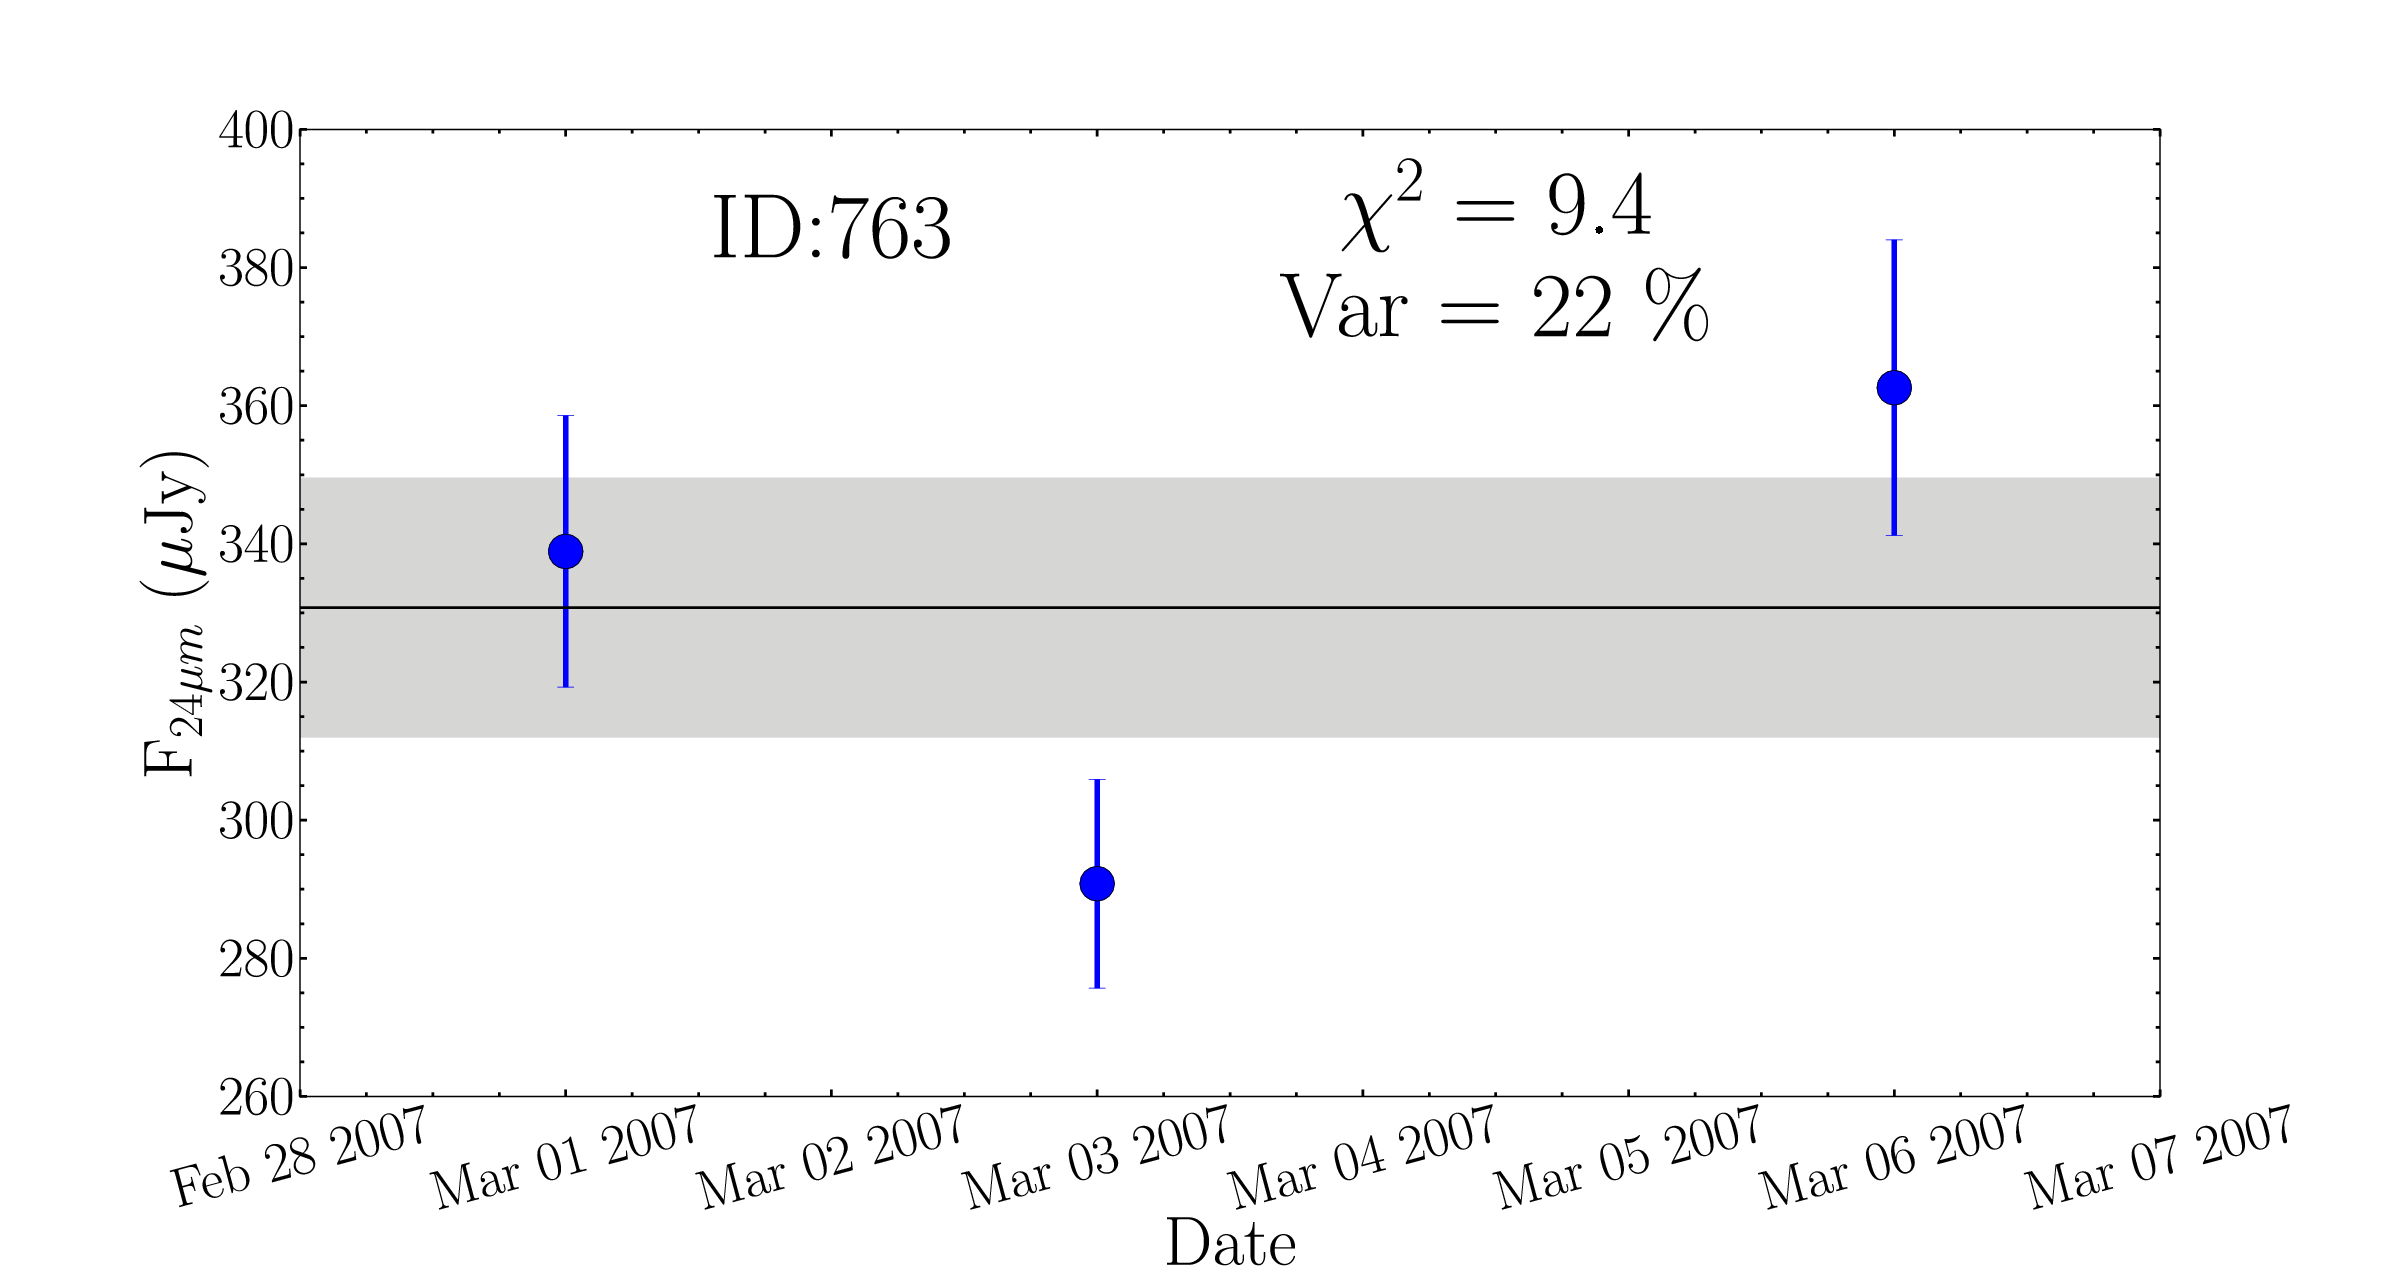
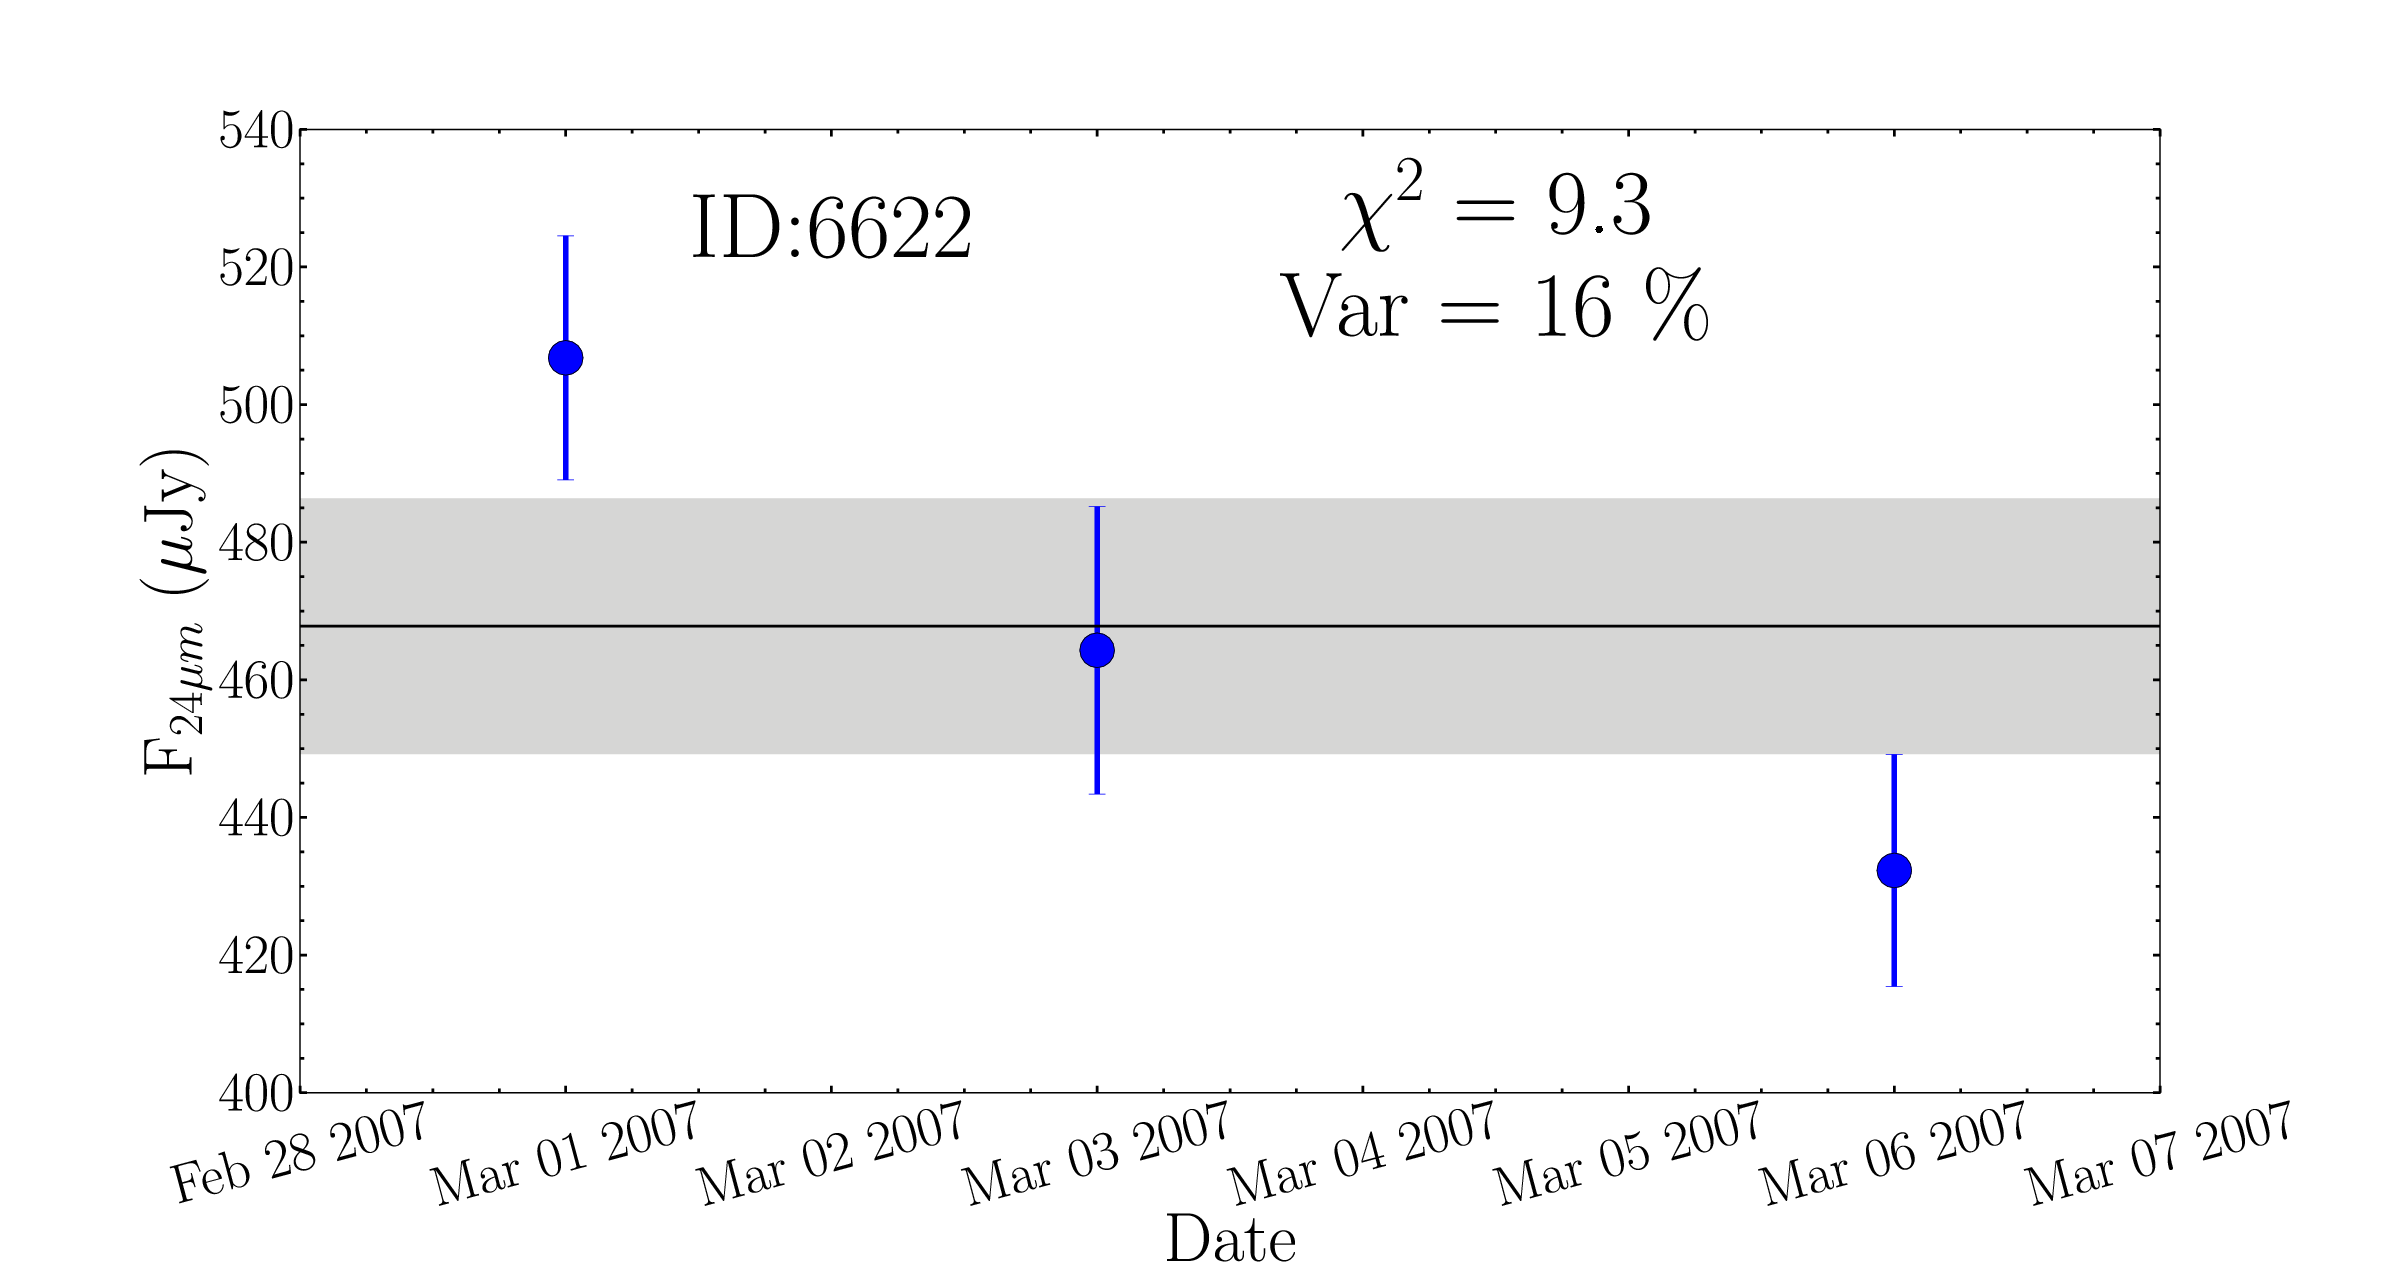
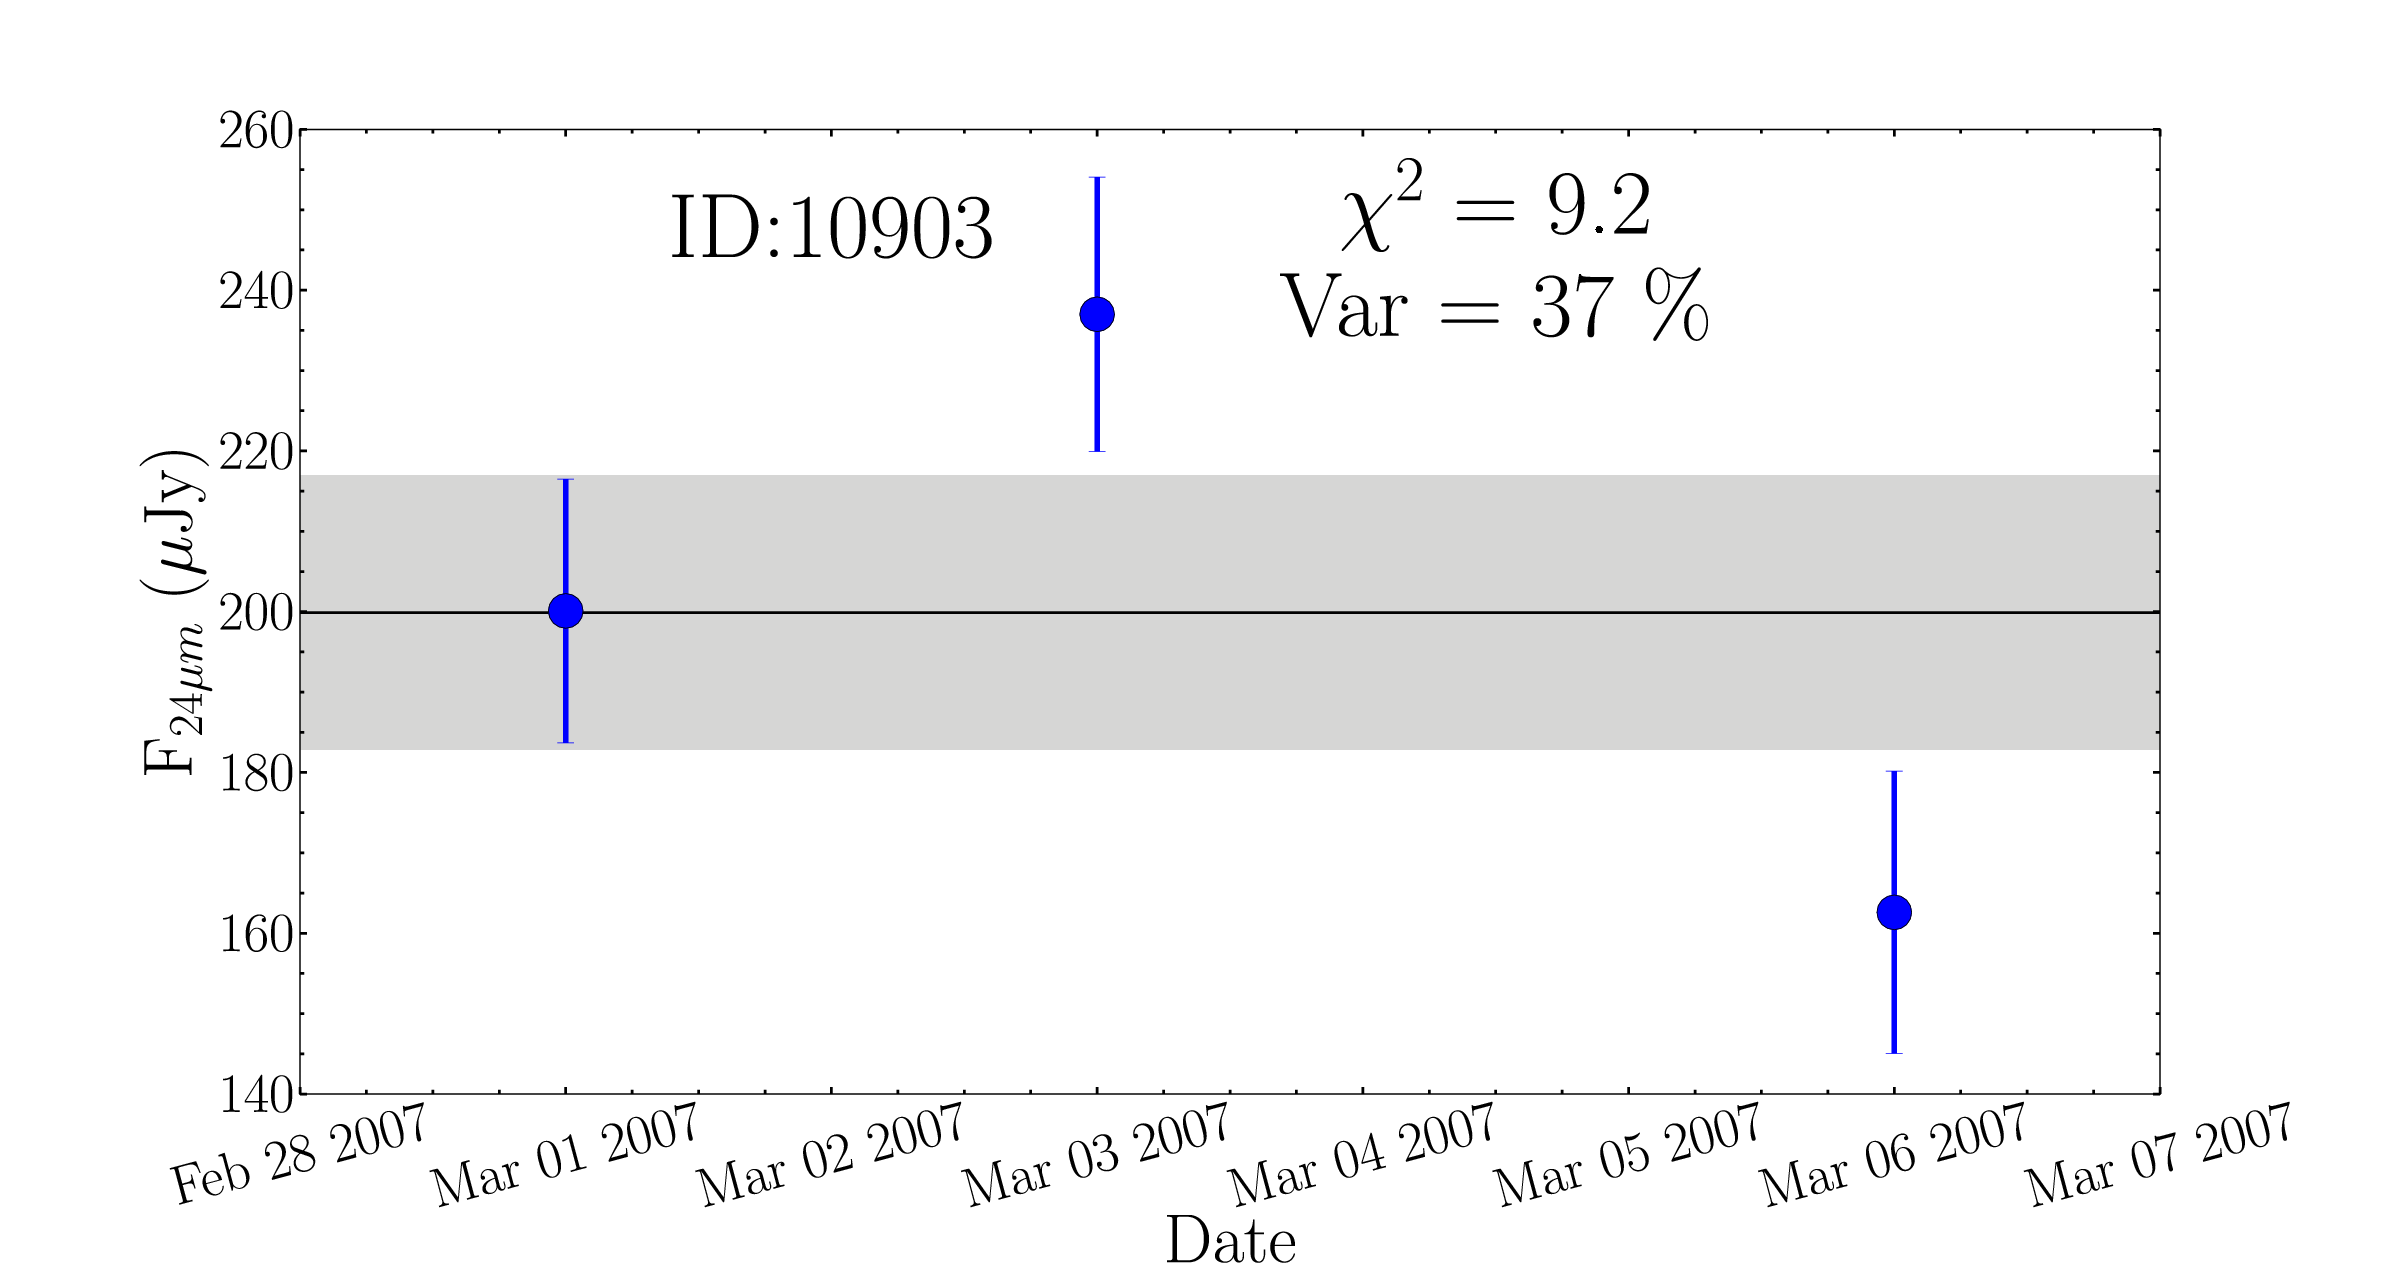
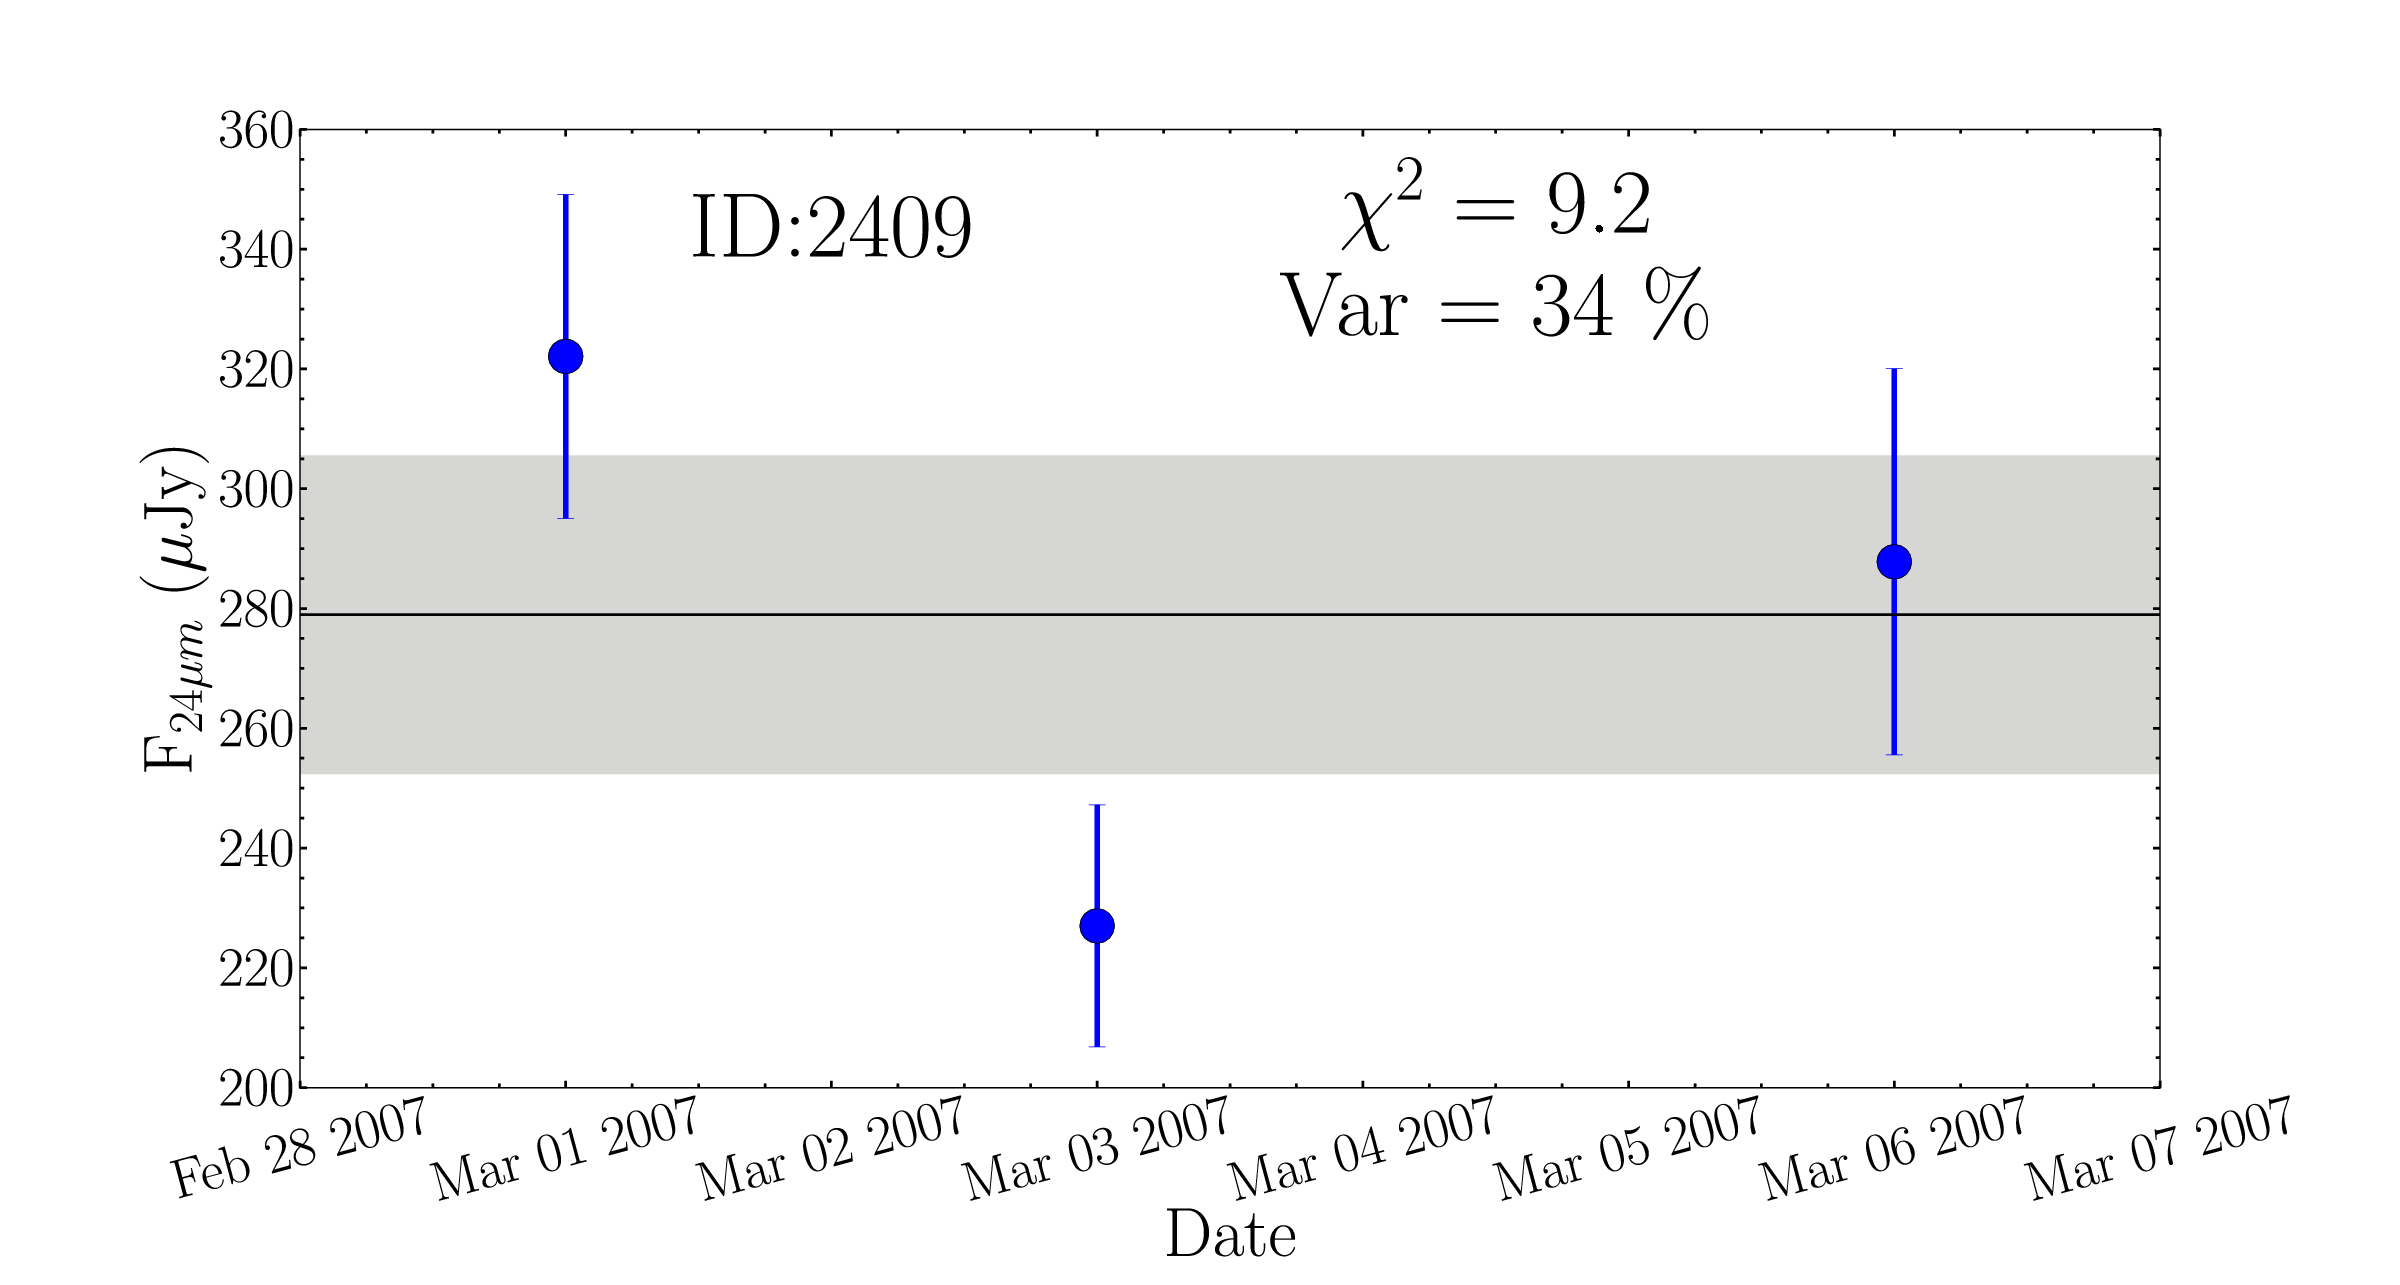
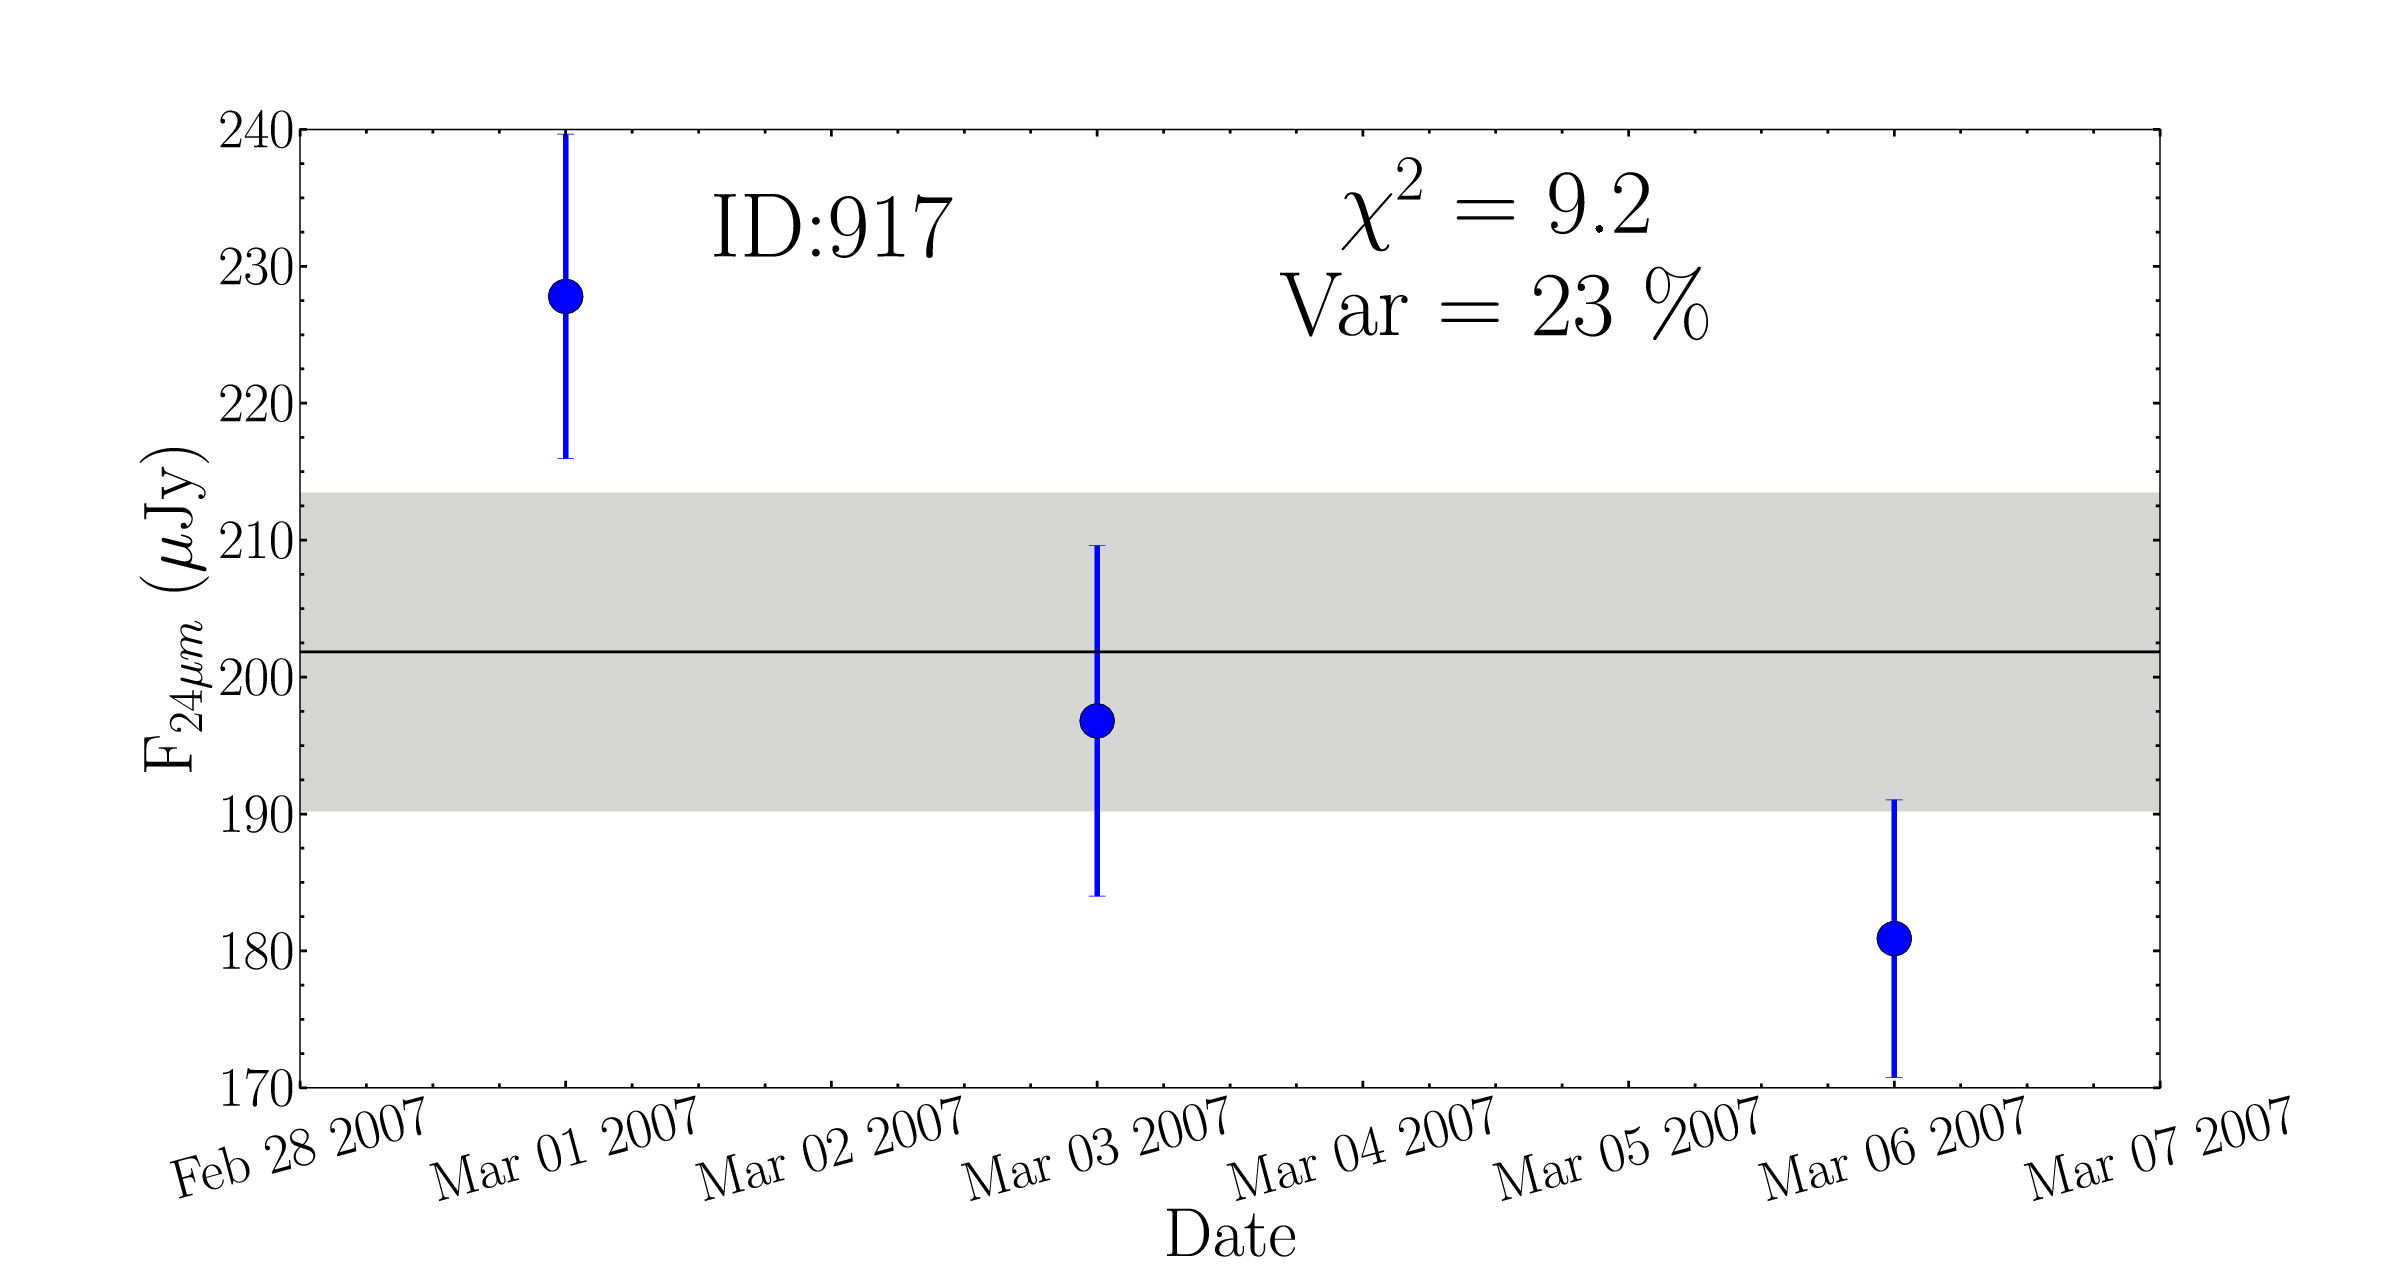
In Figure 6 we show two example light curves, one of long-term and the other of short-term variable sources. Each plot shows the name of the source, the value and the measure of the variability (see below, Equation 2). The light curves for all the long and short-term 24 m variable sources are presented in Appendices F and G, respectively.
As a first measure of the variability, we calculated the maximum to minimum flux ratio, , as: . The long-term and short-term variable sources show similar values of the average and median of approximately (see Table 3 and Figure 7).
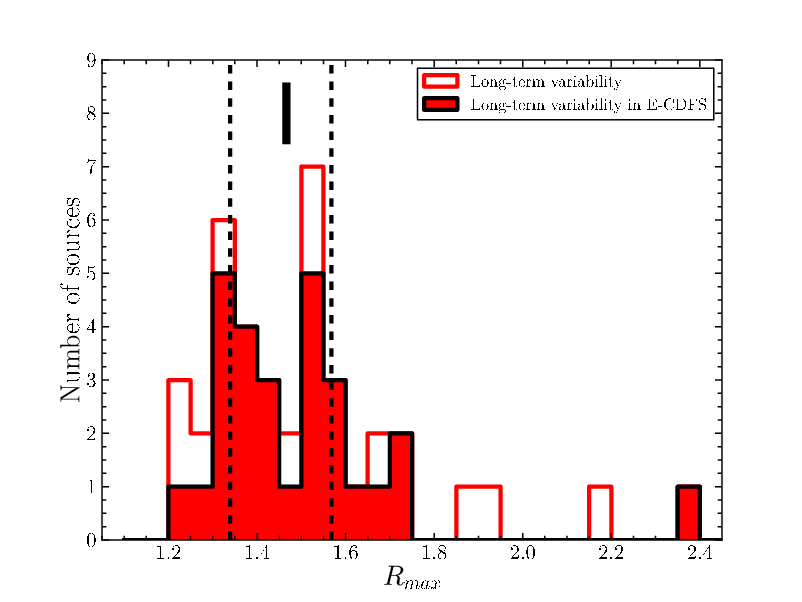
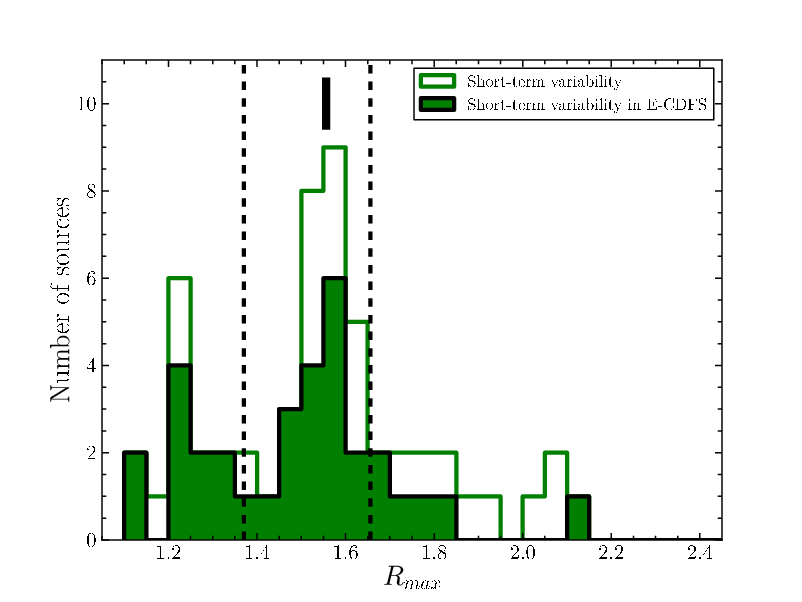
Another estimate of the variability is the ratio between the maximum and minimum values and the mean flux measured as a %.
| (2) |
As can be seen from Table 3, the typical 24 m values of the long-term and short-term variable sources are 37-43%, with typical errors of 12-13%. In Figure 8 we show against the mean m flux for each candidate (lower panel) with the typical errors (upper panel). The apparent lack of small values of at low m mean fluxes is because these sources have lower S/N detections and therefore higher errors in their photometry, and for the same variability they do not meet our criterion. There is also a lack of large values of at high m mean fluxes. It is due to a statistical effect because the number of sources at high m mean fluxes is small, and the fraction of variable sources with low values of is higher than the fraction with large values of .
Finally, the reduced value of , which is defined as with being the number of epochs, has also been used as a measure of the m variability of local quasars by (1999). For the long and short-term variable sources we find median values of 3.2 and 3.7, respectively. These are slightly higher than the values measured for local quasars at m. We note, however that our variability criterion in both cases is more restrictive than that used for the local quasars ().
It is not straightforward to compare our measures of the MIPS m variability in GOODS-South with studies done in the optical. The optical studies (e.g., 2011; Villforth et al. 2010) used the variability significance and the variability strength as a measure of the variability. These parameters are defined in a different way than our and it is not appropriate to calculate them for our sources because they assume equal errors for all the sources, which is not the case for our epochs as shown in Section 2.
We can compare the MIPS m values with those measured in X-rays. (2012) detected X-ray variable sources with maximum-to-minimum flux ratios with a median value of 4.1 over a period of 10.8 years. These values are noticeably higher than those measured at m both in short-term and long-term time scales. There are two explanations for this. First, as pointed out by (2012), the limited photon statistics of their X-ray observations means that sources must be strongly variable to be identified as such. The second reason is due to the reprocessed nature of the AGN mid-IR emission. Indeed, in the context of the AGN dusty torus, the IR variability of AGN is predicted to be only a fraction of the AGN intrinsic luminosity variation, to depend of the dust distribution, to be delayed with respect to optical variations, and to depend on the IR wavelength used (see 2011 and references therein). This is because the dust is further away from the central engine than the accretion disk. This has been confirmed observationally for local quasars (, 1999) and Seyfert galaxies (, 2004).

| Variability | 24 m (Jy) | Var (%) | ||||||
|---|---|---|---|---|---|---|---|---|
| Average | Median1 | Average | Median1 | Average | Median1 | Average | Median1 | |
| Long-term | 196 | 14.75 | 39.0 | 1.51 | ||||
| Short-term | 239 | 12.14 | 41.7 | 1.55 | ||||
1 Median and quartiles of the distribution.
5.3 IRAC colours
In this subsection we investigate the Spitzer-IRAC mid-IR (3.6, 4.5, 5.8, and 8.0 m) properties of the MIPS m variable sources as the IRAC emission has also been used to select AGN candidates (e.g., 2004; 2005; 2006; 2012; 2013).
(2004) defined a wedge in an IRAC colour-colour diagram to identify AGN via their IR emission, based on the locus of the diagram occupied by quasars. (2012) defined a more restrictive IRAC wegde based on the IR power-law criterion of (2006) and the typical errors of the IRAC photometry. This IR power-law wedge was specifically designed to avoid contamination from high-redshift star forming galaxies. To do so, Donley et al. applied a colour cut of to avoid high-redshift () star-forming galaxies. They also applied a vertical cut of to prevent contamination due to low-redshift star-forming galaxies and required that the IRAC SED of the source rises monotonically. (2012) showed that this power-law wedge selects the majority of luminous X-ray identified AGN and therefore it is highly reliable at the expense of losing the least luminous AGN.
Finally, we note that recently (2013) put forward a new expanded AGN selection criteria with a broader wedge when compared to that of (2004) and imposed a 24 m limit of >600 Jy. We do not use this new wedge as only 1 short-term 24 m variable source is above this limit (see Figure 5).
To obtain the IRAC data for our sources, we used the Rainbow Cosmological Surveys Database, which contains multi-wavelength photometric data as well as spectroscopic information for sources in different cosmological fields, including GOODS-South (see 2005, 2008). We cross-correlated the MIPS m catalogs with the Rainbow IRAC sources using a search radius of 2.5. Of the 39 long-term variable sources, 26 (67%) have a single counterpart and the remaining 13 (33%) have more than one counterpart within a radius of 2.5. Of the 55 short-term variable candidates, 44 (80%) have a single counterpart and the remaining 11 (20%) have more than one counterpart within a radius of 2.5. A visual inspection of the images at different wavelengths allowed us to identify the counterpart of the majority of the variable sources444In the majority of the sources, inspection of the IRAC images is enough to determine which source dominates in the IR.. For the rest we used the data from the nearest source. All the long-term variable sources have fluxes in all four IRAC bands, whereas only 43 (78%) of 55 short-term variable candidates do. This is because the entire Epoch 7 region is not fully covered by the IRAC observations. The flux limits of the m variable sources are approximately Jy at m, Jy at m, Jy at m, and Jy at m.

Figure 9 shows the IRAC colour-colour plot for all the MIPS m variable sources detected in the four IRAC bands together with the (2004) and (2012) AGN wedges. For comparison we also plot the IRAC colours of the full (non-variable) MIPS m sample in the common area of GOODS-South as grey dots. Of the 39 long-term variable sources, only 8% fall in the (2012) AGN region and 44% fall in the (2004) AGN region. Of the 43 short-term variable sources with IRAC fluxes, 2% fall in the (2012) AGN region and 44% fall in the (2004) AGN region. These fractions of mid-IR variable sources falling inside the (2004) wedge are similar to those found for variable optical sources in GOODS-South (see Villforth, Sarajedini, & Koekemoer, 2012). In an IRAC variability study (2010) found a higher fraction (approximately 75%) of near-IR variable objects within an AGN wedge similar to that defined by (2005). This is most likely due to the relatively shallow IRAC observations of their study.
It is also worth noting that the fraction of objects in the parent MIPS 24 m population in GOODS-South that are in the (2004) wedge is 50%. However, the (2004) AGN selection criteria was based on the IRAC colours of bright SDSS quasars with IRAC m fluxes greater than 1 mJy. In our general population, only about 1% of sources are above this limit. Alternatively, only 2% of the general sources in GOODS-South located inside the (2004) wedge are found to be variable at m. Such a small fraction of mid-IR variable sources is expected, because the probability of detecting mid-IR variability of an AGN over the time scales probed and with three/four epochs is low. Additionally, it is likely that the AGN emission does not have a dominant contribution to the observed 24 m emission.
6 Candidates in the Extended Chandra Deep Field South
In this section we investigate the multi-wavelength properties of the MIPS 24 m variable sources located in the Extended Chandra Deep Field South (E-CDFS), which is located in the central area covered by our study (see Figure 4). This field covers an area555The approximate location of this region compared to the region studied here can be seen from Figure 4 where we marked the MIPS m variable sources in the region of the E-CDFS 1100 arcmin2.
The E-CDFS was observed by COMBO-17 (Classifying Objects by Medium-Band Observations, a spectrophotometric 17-filter survey) survey (, 2004). The COMBO-17 object catalog contains, in addition to the 17 optical medium-band photometry, the broad-band magnitude ( nm) and photometric redshifts for 63501 objects. We chose the E-CDFS because it has been observed with the deepest multi-wavelength data. We note that although the COMBO-17 catalog gives a photometric redshift, for the objects without spectroscopic redshift we use the photometric redshifts provided by the Rainbow database because they are calculated using both optical and IR data (see 2008). We only have spectroscopic redshifts for 8 long-term and 6 short-term variable objects.
For the cross-correlation we used again a search radius of 2.5. All the objects within this radius are possible counterparts. Since now we are looking at the same area we find relatively similar numbers of long (28) and short term (33) variable sources, although still the number of short term variable sources is higher due to the deepest central area of Epoch 7. Of the 39 long-term variable candidates, 28 are in the E-CDFS and 27 have a detection in the COMBO-17 catalog. Only 19 (70%) have a single counterpart, whereas the remaining 8 (30%) have more than one counterpart within a radius of 2.5. Of the 55 short-time variable candidates, 33 are in the E-CDFS and 28 are detected in the COMBO-17 catalog. Only 21 (75%) have a single counterpart and the other 7 (25%) have more than one counterpart in a radius of 2.5. In the following discussion in the case of multiple counterparts we associate the MIPS m source to the nearest object in the COMBO-17 catalog.
The COMBO-17 -band magnitudes of the m variable sources are given in Tables C1 and D1 in the Appendices. The median values are -bandmag and -bandmag for the long and short-term variable sources, respectively (see Table 4). These values are similar to those of X-ray selected non-broad line AGN in deep cosmological fields whose optical luminosities are dominated by the host galaxy (, 2004). This is probably the case as well for the MIPS m variable sources as they are not dominated by the AGN (see next section).
We also searched for counterparts in the MUSYC (Multiwavelength Survey by Yale-Chile) catalog (, 2010). See also Section 6.1. This catalog covers all the E-CDFS in the optical and near-IR. We used again a radius of 2.5 for the cross-correlation. We found 28 long-term variable sources detected in the MUSYC catalog, 23 (82%) of them with a single counterpart and 33 short-term variable sources, 31 (94%) with a single counterpart.
As a sanity check, we compared the variable MIPS 24 m sources in the E-CDFS with the full variable catalog. We confirmed that their properties in terms of mean m fluxes (see Figure 5 and Tables 3 and 4) and the variability measures and (see Figures 7 and 8) behave as the general 24 m variable population. We therefore expect that the properties of the 24 m variable sources in the E-CDFS might be extrapolated to the entire variable population.
| Variability | No. | 24 m (Jy) | Var (%) | ||||||||||
|---|---|---|---|---|---|---|---|---|---|---|---|---|---|
| Average | Median1 | Average | Median1 | Average | Median1 | Average | Median1 | Average | Median1 | Average | Median1 | ||
| Long-term | 28 | 186 | 14.98 | 38.1 | 1.49 | 0.94 | 22.66 | ||||||
| Short-term | 33 | 240 | 11.87 | 38.1 | 1.49 | 0.96 | 22.19 | ||||||
1 Median and quartiles of the distribution.
6.1 Photometric redshifts and IRAC properties
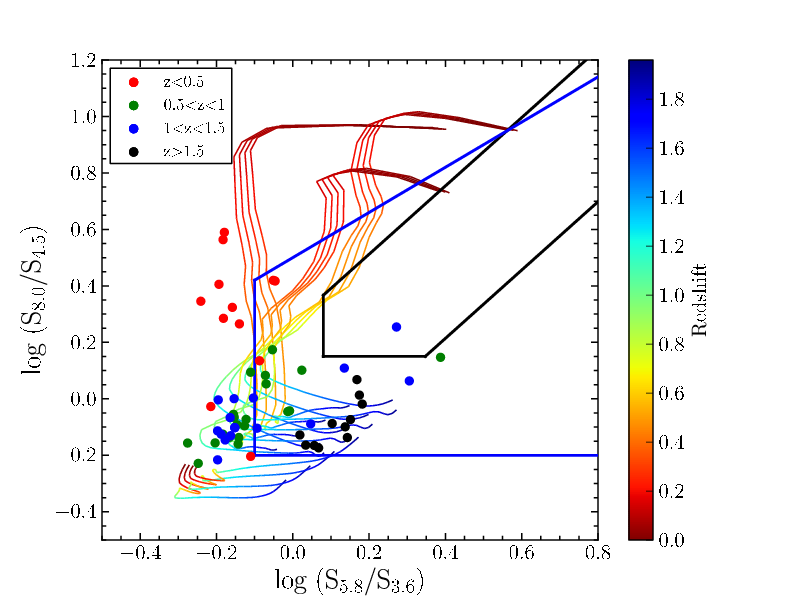
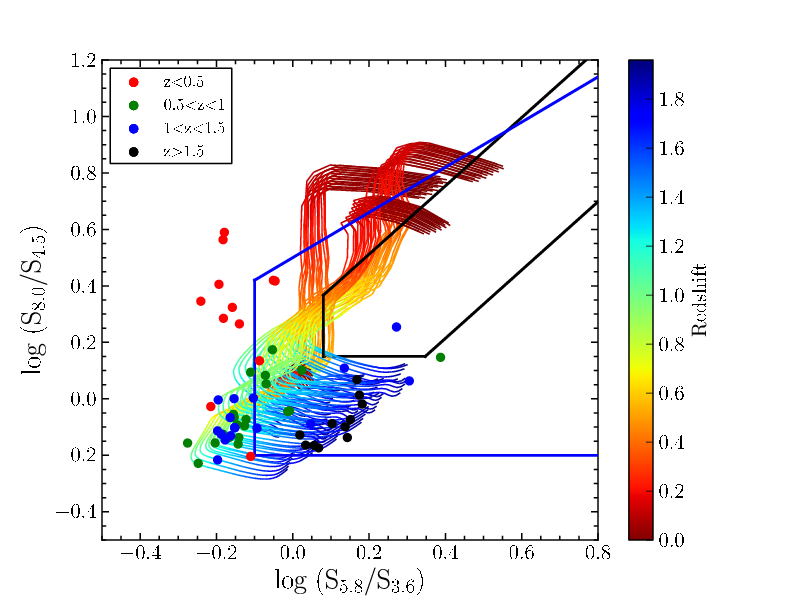
In this section we study the distribution of the Rainbow redshifts for the MIPS m variable sources in the E-CDFS. For the long-term variable sources the redshifts are between 0.18 and 1.88 and for the short-term variable source between 0.12 and 1.94. This redshifts are in accordance with the redshifts of the MUSYC catalog. The average (median) redshifts are similar for the long-term and the short term variable sources. The average (median) redshifts for the sources in the MUSYC catalog are for the long-term and for the short-term variable candidates. We are therefore probing typically variable emission at 12 m rest-frame. For comparison, the redshift distribution of the optical variable sources in GOODS-South has a mean value 0.94 for i-band selected sources (Villforth et al., 2012) and 1.14 for v-band selected sources (, 2011). For the X-ray selected AGN in our parent 24 m catalogs the average (median) redshift is .
Figure 9 shows with black open symbols the IRAC colours of the MIPS m variable sources, both long and short term. As with the variability properties, the variable sources located in the E-CDFS behave as the general variable population, with approximately 50% being in the (2004) wedge, and a small fraction in the (2012) wedge. As discussed above, the (2012) criteria are more restrictive to avoid contamination from star forming galaxies at different redshifts entering the AGN selection wedge but it misses a large fraction of low-luminosity AGN. In consequence, only one of the MIPS m variable sources in the E-CDFS would be classified as IR power-law galaxies according to (2012). Its ID is given in Table 5.
We can now use the redshift information in the IRAC colour-colour diagram to investigate whether variable sources in the (2004) wedge can be classified as AGN, since the IRAC colours have a strong dependence with redshift. As shown in Figure 10, a large fraction of the MIPS m sources falling in the (2004) wedge are at (62% of the objects).
In Figure 10 we also plotted the tracks for an AGN/galaxy composite SED with a 20% AGN contribution (right panel) and no AGN contribution (left panel) with redshifts varying from 0 up to 2, and different degrees of extinction from (2012). As can be seen from these figures, the colours of approximately half of the MIPS m variable sources inside the (2004) wedge agree with having a relatively small AGN fraction and are not compatible with a zero AGN fraction for their redshifts. This is similar to what is found for optical variable AGN in cosmological fields, where the AGN component is expected to be 10% or less of the total galaxy flux in most cases (, 2011). Those outside this wedge might be compatible with just being normal galaxies (although see Section 6.2).
6.2 X-ray properties
One of the main goals of this work is to investigate whether variability at 24 m is able to select AGN otherwise missed by deep X-ray exposures.
6.2.1 Fraction of 24m variable sources detected in X-rays
All the MIPS m variable sources, both long and short term, were matched against the deepest X-ray observations in the CDFS, that is, the 4 Ms Chandra catalog presented in (2011), using again a search radius of 2.5. These deep observations cover only the central part of the E-CDFS. The rest of the area is covered by shallower X-ray observations that are part of the E-CDFS observations (see references listed in Table 5). We also cross-matched our variable sources with these shallower X-ray catalogs with a search radius of 2.5. We find 7 (25%) and 4 (12%) of the MIPS m long-term and short-term variable sources respectively in the E-CDFS are detected in X-rays (see Table 5 for the ID of the sources). The lower fraction of X-ray detections among the short-term variable sources is because a large fraction of these are located outside the deepest 4 Ms X-ray region. These fractions of 24 m variable sources detected in X-rays are in general smaller than for AGN candidates selected by optical variability (30-50%) (, 2008, 2011; Villforth et al., 2012).
In the central part of the E-CDFS (CDFS; 465 arcmin2), which is covered by the deepest X-ray data (2011 catalog), 30% of the 24 m variable sources are detected in X-rays. Using the catalogs of (2011) and (2005, 2008), and the redshifts provided by the Rainbow Database, we find that the m variable sources detected in X-rays have keV luminosities ranging from to (See Table 5). Although some of our 24 m variable sources with an X-ray counterpart are low luminosity X-ray sources and would be below the limit X-ray luminosity for the AGN definition, this does not imply that these sources are not AGN. (2012) studied sources classified as galaxies in X-rays and found the 22% of them presented variability in X-rays, confirming that variability selects AGN that might not be selected by other methods. There are also many optical variables that are not X-ray detected or that have low X-ray to optical flux ratios (see Fig 6 in 2011).
| ID | Catalogs | Ref | (2004) | X-ray Luminosity |
| (0.5-8 KeV) (erg s-1) | ||||
| Long-term variable sources | ||||
| 2552 | X-ray, compilation AGN, optical-variable, IR power-law | (2), (3)*, (4), (5), (11), (13) | YES | |
| 13601 | X-ray, Chandra 4 Ms, Radio excess | (2), (6), (9)*, (12) | NO | |
| 12099 | X-ray | (3)*, (11) | NO | |
| 10015 | relative IR SFR excess, X-ray | (7), (10)* | NO | |
| 2226 | optical-variable, Chandra 4 Ms | (8), (9)* | NO | |
| 11976 | Chandra 4 Ms | (9)* | YES | |
| 14779 | Chandra 4 Ms | (9)* | NO | |
| 9796 | Radio excess | (12) | YES | |
| 9579 | IR power-law | (13) | YES11footnotemark: 1 | |
| 4679 | IR power-law | (13) | YES11footnotemark: 1 | |
| Short-term variable sources | ||||
| 8766 | IR power-law, Chandra 4 Ms | (1), (9)* | YES | |
| 6827 | X-ray, optical-variable, IR power-law | (2), (3)*, (5), (11), (13) | YES11footnotemark: 1 | |
| 7761 | X-ray, Chandra 4 Ms, Radio excess | (2), (6), (9)*, (12) | NO | |
| 7513 | optical-variable | (8) | YES | |
| 917 | Chandra 4 Ms | (9)* | NO | |
| 2614 | Chandra 4 Ms | (9)* | NO | |
| 540 | Radio excess | (12) | YES11footnotemark: 1 | |
Notes.- References for the catalogs. (1) (2006); (2) (2008); (3) (2005) (4) (2010); (5) (2008); (6) (2006); (7) (2011); (8) Villforth et al. (2010); (9) (2011); (10) (2008); (11) (2010); (12) This work (radio excess); (13) This work (IR power-law according to (2012)).
* Reference for the X-ray luminosity.
1 Not in the E-CDFS.
6.2.2 Fraction of X-ray selected AGN found variable at 24m
As explained in the introduction, all AGN are expected to vary over a large range of timescales. However, the probability of detecting AGN variability in the mid-IR is always lower than the optical and near-IR because mid-IR variability is predicted to be only a fraction of the AGN intrinsic luminosity variation. This is because the dust responsible for the bulk of the mid-IR emission is further away from the central engine than the accretion disk, and the variability signal is expected to be smoothed for large dust distribution (see 1999, 2004, 2011).
Before we compute the fraction of X-ray selected AGN found variable at 24 m, we need to calculate the number of X-ray sources detected in 24 m satisfying our criteria in the parent catalogs as explained in Section 5.1. We found 211 X-ray sources in the central part of the E-CDFS (classified as AGN and galaxies in the (2011) catalog) satisfying the properties of our parent MIPS 24 m catalogs. Of these, only 4% are found to be variable at m on the timescales probed by our study. This fraction is smaller than the fraction found in the optical (25%, see 2007, 2011). This is explained by model simulations, which predict a more smothered variable signal and longer time scales in the mid-IR than in the optical (, 2011). In addition, for low luminosity AGN most of the mid-IR emission might come from the host galaxy, which would make it difficult to detect variability (see Section 6.1).
There are 149 sources classified as AGN in the (2011) catalog in our parent 24 m merged catalogs (see Section 5.1). If we assume that deep X-ray exposures provide the majority of the AGN in the field the total AGN population in this field would be 149 AGN. Assuming the 24 m variable sources in the region covered by the (2011) catalog not detected in X-ray are also AGN, they would only account for a small fraction ( 13 %) of the total AGN population in this field.
6.2.3 Candidates in the deepest X-ray region of the E-CDFS
As explained in Section 6.2.1, only the central area of the E-CDFS is covered by the deepest X-ray data (, 2011). Since the effective exposure of the Chandra 4 Ms survey is not homogeneous (see Fig. 2 of 2011), we selected a central region of 115 arcmin2 with the deepest and most homogeneous X-ray coverage. In this region we can compare the sources in the parent catalog with the selected variable sources.
In this deepest X-ray region there are 189 sources in the parent 24 m long-term catalog and 181 in the parent 24 m short-term catalog. There are only 8 long-term variable sources and 5 short-term variable sources. Tables 6 and 7 summarize the results for the deepest X-ray region within the CDFS. As expected, the percentage of 24 m variable sources with an X-ray detection (63% for long-term and 60% for short-term variable sources) is higher than the percentage in our parent 24 m catalog sources detected in X-ray (48% for long-term and 55% for short-term variable sources). This is expected because the fraction of X-ray detection is higher in AGN than in not AGN. Since the number of variable sources in this region is small, the percentages given at Tables 6 and 7 suffer from small number statistics.
| No. sources | parent catalog | parent catalog | X-ray sources | |
|---|---|---|---|---|
| parent 24 m | with X-ray | with variability | with variability | |
| catalog | No. (%) | No. (%) | No. (%) | |
| Long-term | 189 | 90 (48) | 8 (4) | 5 (6) |
| Short-term | 181 | 99 (55) | 5 (3) | 3 (3) |
6.3 Monochromatic IR luminosities
From the Rainbow Database we obtained the rest-frame m monochromatic luminosities for the MIPS m variable sources. As the contribution of the AGN to the total luminosity in the 24 m variable sources is expected to be low (See Section 6.1), the luminosities were obtained by fitting the star forming galaxy templates from (2001). Therefore, the fitted templates provide a reasonable approximation to the rest-frame 24 m luminosities of the sources, which arise from star formation in the host galaxy and the putative AGN. For each source we used all the available photometric mid-to-far IR data points to fit the SEDs. Apart from the MIPS 24 m flux, the Rainbow catalogs include photometry in the four IRAC bands, MIPS 70 m and Herschel/PACS 100 and 160 m. For our sample of 24 m variable sources, 32% have 70 m photometry, 23% have 100 m photometry, and 18% have 160 m photometry.
Figure 11 shows these luminosities against the redshift for the long-term (red) and short-term (green) variable candidates in the E-CDFS. The mean value of rest-frame is 10.5 for both, the long-term and the short-term variable sources. For those candidates satisfying the (2004) AGN selection criteria the mean values are for both, the long-term and the short-term variable candidates. Conversely, the candidates not satisfying the (2004) criteria have mean values of and 10.4 for the long-term and the short-term variable candidates, respectively. This is expected as galaxies in the (2004) wedge tend to have a higher AGN fraction contributing to their IR emission than those outside (see previous section).

| No. | X-ray1 | radio2 | other AGN3 | IR4 | Combined5 | (2004)6 | Combined7 | |
|---|---|---|---|---|---|---|---|---|
| variable | excess | catalogs | power law | criteria | criteria | |||
| sources | No. (%) | No. (%) | No. (%) | No. (%) | No. (%) | No. (%) | No.(%) | |
| Long-term variable sources | ||||||||
| Deepest X-ray region | 8 | 5 (63) | 1 (13) | 3 (38) | 0 (0) | 5 (63) | 3 (38) | 7 (88) |
| In the E-CDFS | 28 | 7 (25) | 2 (7) | 4 (14) | 1 (4) | 8 (29) | 12 (43) | 17 (61) |
| Outside the E-CDFS | 11 | 0 (0) | 0 (0) | 0 (0) | 2 (18) | 2 (18) | 5 (45) | 5 (45) |
| In IRAC | 39 | 7 (18) | 2 (5) | 4 (10) | 3 (8) | 10 (26) | 17 (44) | 22 (56) |
| All | 39 | 7 (18) | 2 (5) | 4 (10) | 3 (8) | 10 (26) | 17 (44) | 22 (56) |
| Short-term variable sources | ||||||||
| Deepest X-ray region | 5 | 3 (60) | 1 (20) | 2 (40) | 0 (0) | 3 (60) | 2 (40) | 4 (80) |
| In the E-CDFS | 33 | 4 (12) | 1 (3) | 3 (9) | 0 (0) | 5 (15) | 14 (42) | 17 (52) |
| Outside the E-CDFS | 22 | 1 (5) | 1 (5) | 1 (5) | 1 (5) | 2 (9) | 5 (23) | 5 (23) |
| In IRAC | 43 | 5 (12) | 2 (5) | 4 (9) | 1 (2) | 7 (16) | 19 (44) | 22 (51) |
| All | 55 | 5 (9) | 2 (4) | 4 (7) | 1 (2) | 7 (13) | 19 (35) | 22 (40) |
1 Variable MIPS 24 m sources detected in X-rays.
2 Variable MIPS 24 m sources with radio excess.
3 Variable MIPS 24 m sources in other AGN catalogs. (See notes in Table 5).
4 Variable MIPS 24 m sources detected as IR power-law AGN.
5 Combined 1st, 2nd, 3rd, and 4th criteria.
6 Variable MIPS 24 m sources satisfying the Lacy et al. 2004 criteria.
7 All the criteria combined.
6.4 Radio properties
We investigate the radio properties of the MIPS m variable sources, since radio observations are in principle not biased against obscured AGN. Since star-forming galaxies also emit at radio frequencies and show a tight correlation between the IR and the radio emission (e.g. , 1985, 1992, 2010), it is also possible to select AGN in cosmological fields by looking for radio excess sources (see e.g. , 2005, 2013). We cross-correlated our 24 m variable sources with the (2013) radio 1.4 GHz source catalog and found that 2 long-term and 7 (one of which is outside the E-CDFS) short-term variable sources had a radio counterpart within a search radius of 2.5. That is, 7% and 18% of the MIPS m long and short term variable sources.
We calculated the ratio defined as (see 2004) to determine if any of these sources present a radio excess. Figure 12 shows versus the redshift for the 14 MIPS m variable sources with radio detections at 1.4 GHz. (2005) considered radio excess sources those having q<0 for non-K-corrected fluxes. On the other hand, (2013) demonstrated that this limit misses a large fraction of sources with radio excesses based on the ratio between the far-IR luminosity and the radio emission. From Figure 5 of (2013), we can see that sources with can be considered radio excess sources, and therefore AGN candidates. Among the MIPS m variable sources we find only 2 () long-term and 2 (one of them out of the E-CDFS) () short-term variable sources are radio excess sources, all of them at . Note that we include the short-term source just above the line (see Figure 12). For reference, their IDs are given in Table 5. These small fractions of radio excess sources, if taken as AGN candidates among the MIPS m variable sources is generally consistent with the little overlap between radio selected AGN and AGN selected via their X-ray and/or IR emission in cosmological fields (, 2005, 2009; Villforth et al., 2012).

6.5 Comparison with other variability studies
Finally, we cross-correlated our 24 m variable sources with sources found to be variable in other studies in the E-CDFS, using a search radius of 2.5. We found two long term and two short term variable sources at m in common with the optical variability studies of (2008) and Villforth et al. (2010), and none with those of (2006), (2007), and (2011). Three of these four sources are also detected in X-rays, as can be seen from Table 5. The low correspondence between optical and mid-IR variable sources is expected given the lags and lower variation of amplitude observed and predicted in the mid-IR for local AGN when compared with those observed in the optical (, 1999, 2004, 2011).
7 Discussion and Summary
In this work we have used multi-epoch deep Spitzer/MIPS m observations in GOODS-South to look for mid-IR variable sources. The goal was to identify low luminosity and possibly obscured AGN candidates not identified by other methods. To select variable sources we used a -statistics method to take into account the different photometric errors due to the different depths between epochs and varying depth within a given mosaic. By combining m data taken over three years and four epochs we studied long-term variability over time scales of months-years. Additionally we subdivided the longest duration epoch in three subepochs that allowed us to study the short-term variability in time scales of days over a period of seven days. In each epoch and subepoch, we restricted the analysis to sources above the 5 detection limit and without neighbours at distances of less than 10 to minimize crowding effects in the photometry. We used a 2 cross-matching radius, imposing additionally that the 2 criterion was fulfilled in each pair of epochs.
After discarding problematic sources, our sample contains 39 long-term and 55 short-term mid-IR variability-selected AGN candidates over the GOODS-South areas of 1360 arcmin2 and 1960 arcmin2, respectively, covered by the different epochs. The expected fraction of false positives in our sample of variable mid-IR sources is estimated to be about 40%. The mid-IR long and short-term variable sources comprise approximately 1.7% and 2.2% of the parent MIPS 24 m samples, respectively. After removing the expected number of false positives the estimated percentages are 1.0% and 1.4%. These fractions of variable sources are typical of optical and near-IR variability studies in cosmological fields. The typical variability at m of the sources is 40%, both for the long and short-term variable sources.
In Section 6 we studied the properties of these variability selected AGN candidates restricting the region to the E-CDFS, as it contains the deepest and largest multi-wavelength coverage. We also made use of the Rainbow photometric redshifts that are calculated using optical and IR data for the objects without spectroscopic redshift. In the E-CDFS, we found 28 and 33 long and short term mid-IR variable sources, respectively, typically at which implies our work is sensitive to variable emission at 12 m rest-frame.
We cross-correlated our AGN candidates with other AGN catalogs including X-ray, radio, and variable catalogs in the E-CDFS. In the region with the best coverage by the deepest X-ray data, the Chandra 4 Ms catalog of (2011) (CDFS; 465 arcmin2), 30% of the variable sources (both short and long term) are also detected in X-rays. However, their keV luminosities are typically , with a few sources with X-ray luminosities of . In the Chandra 4 Ms catalog of (2011) there are 149 sources identified as AGN due to their X-ray luminosity in our parent MIPS 24 m catalogs (i.e., after removing close neighbours and merging individual catalogs), see Section 5.1. If we assume that the 24 m variable sources in the region covered by the (2011) catalog not detected in X-rays are AGN, they would only account for a small fraction () of the total AGN population in this field.
As expected, the fraction of m variable sources with a radio excess () is small, as is the case with variable sources identified in other wavelengths. Table 7 summarizes the results.
We also investigated the IRAC properties of the m variable sources. The fraction of mid-IR variable selected AGN candidates meeting the (2012) IR power law criteria for AGN is small. This is not surprising, as this method has been proven to be a very reliable method to select luminous AGN, although it is highly incomplete for low luminosity X-ray selected AGN. Combining the AGN selected by the IR power law criteria with the above X-ray, radio, and variability criteria, we find that 29% and 15% of the long-term and short-term MIPS m variable sources would be also identified as AGN using other methods (see Table 7). The lower fraction for the short-term variable candidates is because a larger fraction of them lie in the area with the shallowest X-ray coverage (that is, the E-CDFS, see Section 6.2).
In Table 7 we also included the number of MIPS m variable sources that fall in the (2004) IRAC colour-colour wedge. Approximately 44% of the m variable selected AGN candidates are located in this wedge. However, using their redshifts we concluded that of these only half of them would have colours compatible with a small () AGN contribution (see Section 6.1).
If we combined all these criteria together we would obtain an upper limit of to the fraction of MIPS m variable sources that would be identified as AGN by other methods. For reference in Table 7 we also listed these AGN fractions for sources outside the E-CDFS. However, as noted before the multi-wavelength coverage and depth of the observations outside this region are not as good, so these fractions should be taken as lower limits.
As explained in Section 6.2, only the central area of the E-CDFS is covered by the deepest X-ray data (, 2011). We selected the region with the deepest and most homogeneous X-ray data (115 arcmin2), which is also covered by other AGN variability studies (, 2006, 2007, 2008; Villforth et al., 2010; , 2011). Combining all the criteria together, we obtained that 85% of the 24 m variable sources in this region would be identified as AGN by other methods (see Table 7). The percentage in this region is higher than when considering the entire E-CDFS due to the deepest X-ray data and because other AGN catalogs do not cover all the E-CDFS. In this 115 arcmin2 region we compared the parent catalog with the variable sources (see Table 6). As expected, in this region the fraction of 24 m variable sources with an X-ray detection is higher (63% for long-term and 60% for short-term variable sources) than that of sources in the parent 24 m catalog with X-ray detections (48% for long-term and 55% for short-term variable sources). Since the number of variable sources in this region is small, the percentages given at Tables 6 and 7 suffer from small number statistics.
In summary, we have shown that MIPS 24 m variability provides a new method to identify AGN in cosmological fields. We find, however, that the 24 m variable sources only account for a small fraction ( 13 %) of the general AGN population. This is expected because model simulations predict a more smothered variable signal and longer timescales in the mid-IR than in the optical (, 2011). Moreover, we found that the AGN contribution to the mid-IR emission of these 24 m variable sources is low (typically less than 20%). Since our method is only sensitive to high amplitude variability (see Section 4) then these 24 m variable sources are likely to host low-luminosity AGN where the variability is expected to be stronger (, 1994).
Acknowledgements
We thank the referee for valuable comments that helped improve the paper.
J.G.-G., A.A.-H., and A.H.-C. acknowledge support from the Augusto G. Linares research program of the Universidad de Cantabria and from the Spanish Plan Nacional through grant AYA2012-31447.
P.G.P.-G. acknowledges support from MINECO grant AYA2012-31277.
This work has made use of the Rainbow Cosmological Surveys Database, which is operated by the Universidad Complutense de Madrid (UCM), partnered with the University of California Observatories at Santa Cruz (UCO/Lick,UCSC). This research has made use of the NASA/IPAC Extragalactic Database (NED) which is operated by the Jet Propulsion Laboratory, California Institute of Technology, under contract with the National Aeronautics and Space Administration.
This work is based on observations made with the Spitzer Space Telescope, obtained from the NASA/ IPAC Infrared Science Archive, both of which are operated by the Jet Propulsion Laboratory, California Institute of Technology under a contract with the National Aeronautics and Space Administration.
References
- (1) Alexander D. M. et al., 2003, AJ, 126, 539
- (2) Alexander D. M., & Hickox R. C., 2012, NewAR, 56, 93
- (3) Alonso-Herrero A. et al., 2004, ApJS, 154, 155
- (4) Alonso-Herrero A. et al., 2006, ApJ, 640, 167
- (5) Antonucci R., 1993, ARA&A, 31, 473
- (6) Appleton P. N. et al., 2004, ApJS, 157, 147
- (7) Assef R. J. et al., 2013, ApJ, 772, 26
- Baldwin et al. ( 1981) Baldwin J. A., Phillips M. M., Terlevich R., 1981, PASP, 93, 5
- (9) Balestra I. et al., 2010, A&A, 512, 12
- (10) Bauer F. E., Alexander D. M., Brandt W. N., Schneider D. P., Treister E., Hornschemeier A. E., & Garmire G. P., 2004, AJ, 128, 2048
- (11) Beckwith S. V. W. et al.m 2006, AJ, 132, 1729
- (12) Bertin E., Arnouts S., 1996, A&AS, 117, 393
- (13) Brandt W. N., & Hasinger G., 2005, ARA&A, 43, 827
- (14) Cardamone C. N. et al., 2008, ApJ, 680, 130
- (15) Cardamone C. N. et al., 2010, ApJS, 189, 270
- (16) Chary R., & Elbaz D., 2001, ApJ, 556, 562
- (17) Cohen S. H. et al., 2006, ApJ, 639, 731
- (18) Condon J. J., 1992,ARA&A, 30, 575
- (19) Del Moro A., et al., 2013, A&A, 549, A59
- (20) Donley J. L., Rieke G. H., Rigby J. R., Pérez-González P. G., 2005, ApJ, 634, 169
- (21) Donley J. L. et al., 2012, ApJ, 748, 142
- (22) Gandhi P., Horst H., Smette A., Hönig S., Comastri A., Gilli R., Vignali C., Duschl W., 2009, A&A, 502, 457
- (23) Giacconi R et al, 2001, ApJ, 551, 624,
- (24) Giavalisco M. et al., 2004, ApJ, 600, L93
- (25) Gilli R., Comastri A., & Hasinger G., 2007, A&A, 463, 79
- (26) Glass I. S., 2004, MNRAS, 350, 1049
- (27) Grazian A. et al., 2006, A&A, 449, 951
- (28) Häring N., Rix H. W., 2004, ApJ, 604, L89
- (29) Helou G., Soifer B. T., Rowan-Robinson M., 1985, ApJ, 298, 7
- (30) Hickox R. C. et al., 2009, ApJ, 609, 891
- (31) Hickox R. C., Mullaney J. R., Alexander D. M., Chen C. J., Civano F. M., Goulding A. D., Hainline K. N, 2014, ApJ, 782, 9
- (32) Hönig S. F., Kishimoto M., 2011, A&A, 534, 121
- (33) Hopkins A. M., Beacom J. F., 2006, ApJ, 651, 142
- (34) Ivison R. J. et al, 2010, A&A, 518, 31
- (35) Klesman A., Sarajedini V. L., 2007, ApJ, 665, 225
- (36) Kormendy J., Richstone D., 1995, ARA&A, 33, 581
- (37) Kozlowski S. et al., 2010, ApJ, 716, 530
- (38) Lacy M. et al., 2004, ApJS, 154, L166
- (39) Lacy M. et al., 2013, ApJS, 208, 24
- (40) Le Fèvre O. et al., 2004, A&A, 428, 1043
- (41) Lehmer B. D. et al., 2005, ApJS, 161, 21
- (42) Lehmer B. D. et al., 2008, ApJ, 681, 1163
- (43) Luo B. et al., 2011, ApJ, 740, 37
- (44) Magorrian J. et al., 1998, AJ, 115, 2285
- (45) Mainieri V. et al., 2008, ApJS, 179, 95
- (46) Marconi A., Hunt L. K., 2003, ApJ, 589, L21
- (47) Martínez-Sansigre A. et al., 2005, Nature, 436, 666
- (48) Mateos S. et al., 2012, MNRAS, 426, 3271
- (49) Mateos S., Alonso-Herrero A., Carrera F. J., Blain A., Severgnini P., Caccianiga A., Ruiz A., 2013, MNRAS, 434, 941
- (50) Mignoli M. et al., 2005, A&A, 437, 883
- (51) Mooley K. P., Frail D. A., Ofek E. O., Miller N. A., Kulkarni S. R., Horesh A., 2013, ApJ, 768, 165
- (52) Miller N. A. et al., 2013, ApJS, 205, 13
- Moran et al. (2002) Moran E. C., Filippenko A. V., Chornock R., 2002, ApJ, 579, L71
- (54) Neugebauer, G., & Matthews, K., 1999, AJ, 118, 35
- (55) Paolillo M., Schreier E. J., Giacconi R., Koekemoer A. M., Grogin N. A., 2004, ApJ, 611, 93
- (56) Pereyra N. A., Vanden Berk D. E., Turnshek D. A., Hillier D. J., Wilhite B. C., Kron R. G., Schneider D. P., Brinkmann J., 2006, ApJ, 642, 87
- (57) Pérez -González P. G. et al., 2005, ApJ, 630, 82
- (58) Pérez -González P. G. et al., 2008, ApJ, 675, 234
- (59) Rieke G. H. et al., 2004, ApJS, 154, 25
- Sarajedini et al. (2003) Sarajedini V. L., Gilliland R. L., Kasm C., 2003, ApJ, 599, 173
- (61) Sarajedini V. L., Koo D. C., Klesman A. J., Laird E. S., Pérez-González P. G., Mozena M., 2011, ApJ, 731, 97
- (62) Silverman J. D. et al., 2010, ApJS, 191, 124
- (63) Smith M. G., Wright A. E., 1980, MNRAS, 191, 871
- (64) Stern D. et al., 2005, ApJ, 631, 163
- (65) Stern D. et al., 2012, ApJ, 753, 30
- (66) Strolger L. G. et al., 2004, ApJ, 613, 200
- (67) Tozzi P. et al, 2006, A&A, 451, 457
- (68) Trevese D., Boutsia K., Vagnetti F., Cappellaro E., Puccetti S., 2008, A&A, 488, 73
- (69) Trevese D., Kron R. G., Majewski S. R., Bershady M. A., Koo D. C., 1994, ApJ, 433, 494
- Ulrich et al. (1997) Ulrich M., Maraschi L., Urry C. M., 1997, ARA&A, 35, 445
- (71) Veilleux S., Osterbrock D. E., 1987, ApJS, 63, 295
- (72) Véron-Cetty M. P., Véron P., 2010, A&A, 518, 10
- Villforth et al. (2010) Villforth C., Koekemoer A. M., Grogin N. A., 2010, ApJ, 723, 737
- Villforth et al. (2012) Villforth C., Sarajedini, V., & Koekemoer A., 2012, MNRAS, 426, 360
- (75) Werner M. W. et al., 2004, ApJS, 154, 1
- (76) Williams R. E. et al., 1996, AJ, 551, 624
- (77) Wolf C. et al., 2004, A&A, 421, 913
- (78) Xue Y. Q. et al., 2011, ApJS, 195, 10
- (79) Young M. et al., 2012, ApJ, 748, 124
Appendix A Photometric errors
As we explained in Section 4 errors are essential in the method, and therefore we checked them in each epoch. For every source in each epoch, we calculated the ratio / and , where is the flux in each epoch, is the mean flux for the source from measurements in all epochs, and is the error of the flux in each epoch. We separated the values in bins according to their mean flux value, so each bin contained 200 sources. For each bin we calculated the median of the / values and +1 and -1 (26th and 84th percentiles) so that between the median and there were the 34% of the data in the bin, and the same between the median and . This is a measure of the scatter of the fluxes and should be consistent with the photometric errors. We also calculated the median of the for the sources of each bin.
Figure 13 plots the scatter in fluxes as a function of the m median flux for Epoch 1, as an example. As can be seen from the figure, the median of the errors (blue line) is consistent with the dispersion of the fluxes (red line). This confirms the validity of the estimated photometric errors used to calculate the value. For all the epochs and subepochs these figures are similar and the photometric errors are consistent with the dispersion of the fluxes.

Appendix B Kolmogorov-Smirnov test for distribution
We performed a Kolmogorov-Smirnov test (hereafter KS-test) in order to determine whether our observed distributions of values differ significantly from the theoretical distribution based on the assumption of gaussian photometric errors. We did the test for the data used to study both the long-term and short-term variability at m.
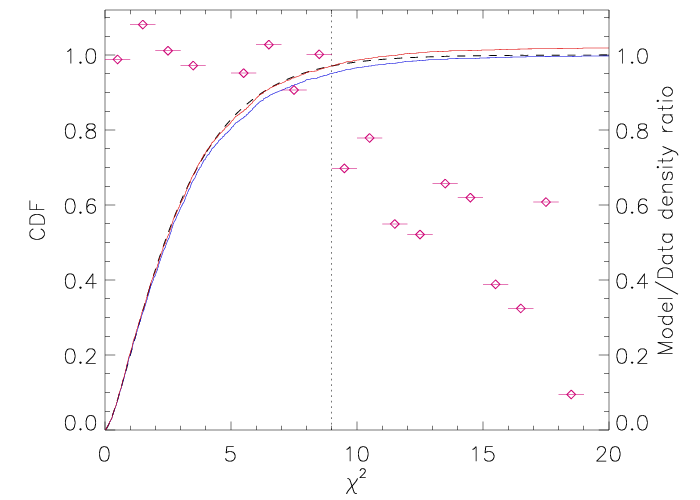
Figure 14 shows the cumulative distribution function, CDF, for the long-term data. As can be seen from the figure (and confirmed by a KS test), the theoretical distribution for 3 degrees of freedom (dashed line) is incompatible with the CDF of the data (blue line). This is because the tail of objects with high is more populated than expected from the photometric errors alone. This is shown with the magenta symbols which are the ratio between the theoretical distribution of and the number of sources in the sample, in intervals of =1. This ratio presents a small deficit of sources in the range =1-2 and an increasing excess at higher values. We truncated and rescaled the CDF at =9 (red line). The rescaled CDF follows well the theoretical distribution for < 9. There is a small depression around =5, but it is not significant. The KS-test found no significant differences between the theoretical and the observed distributions below < 9. Cutting the CDF in =10 the differences start to be significant. This indicates there is an excess of > 9 sources, which is evidence for variability.
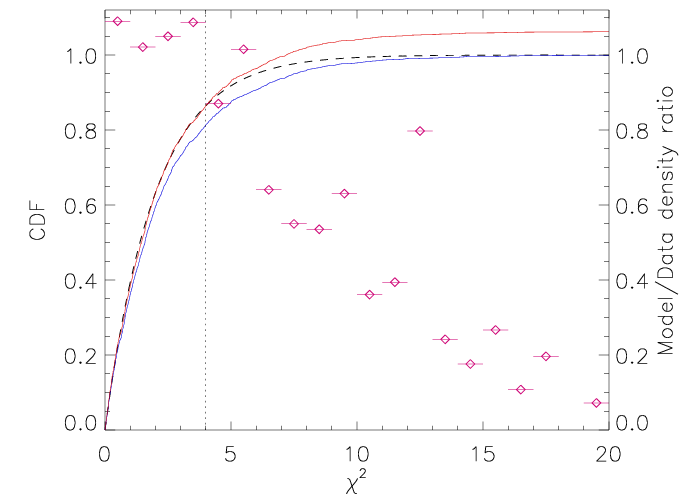
Figure 15 shows the CDF for the short-term data. The theoretical distribution corresponds to a distribution with 2 degrees of freedom. The rescaled CDF follows well the theoretical distribution for < 4. For higher values of the difference between the theoretical and the observed distribution is significant, again indicating that our criterion is valid for selecting variable sources.
Appendix C Images of the variable candidates in the different epochs
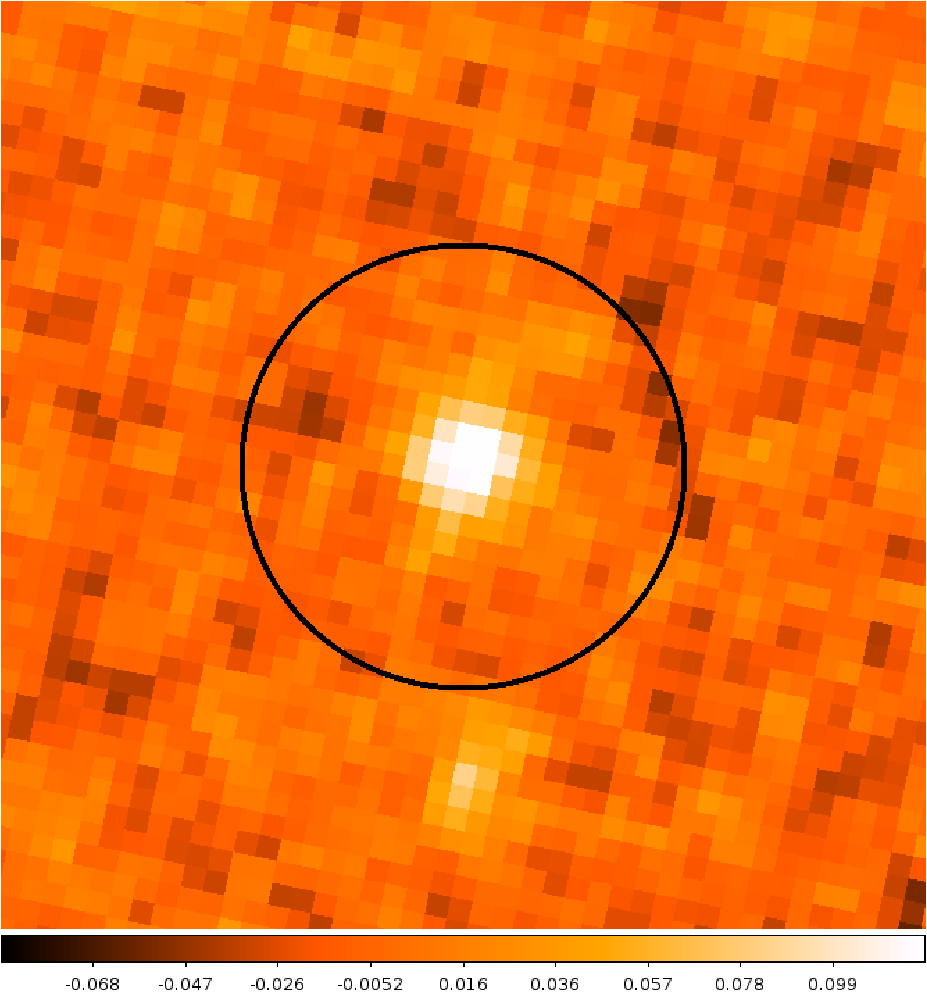
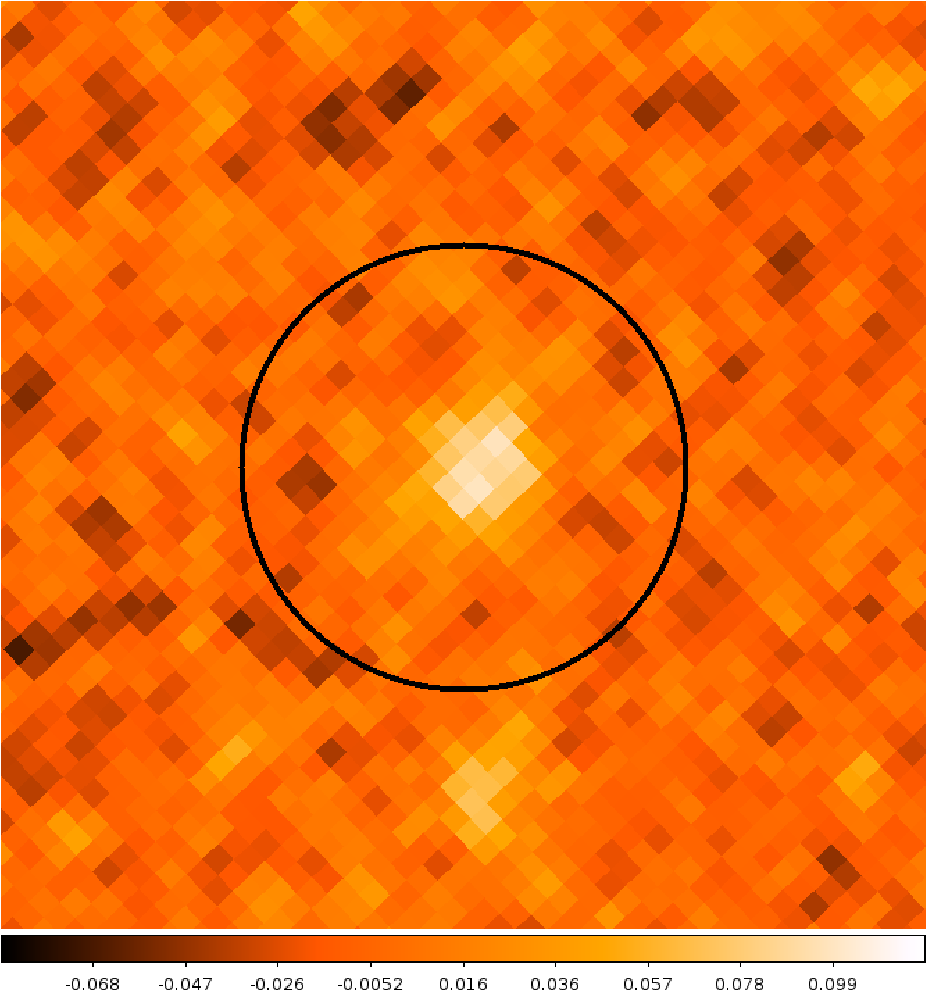
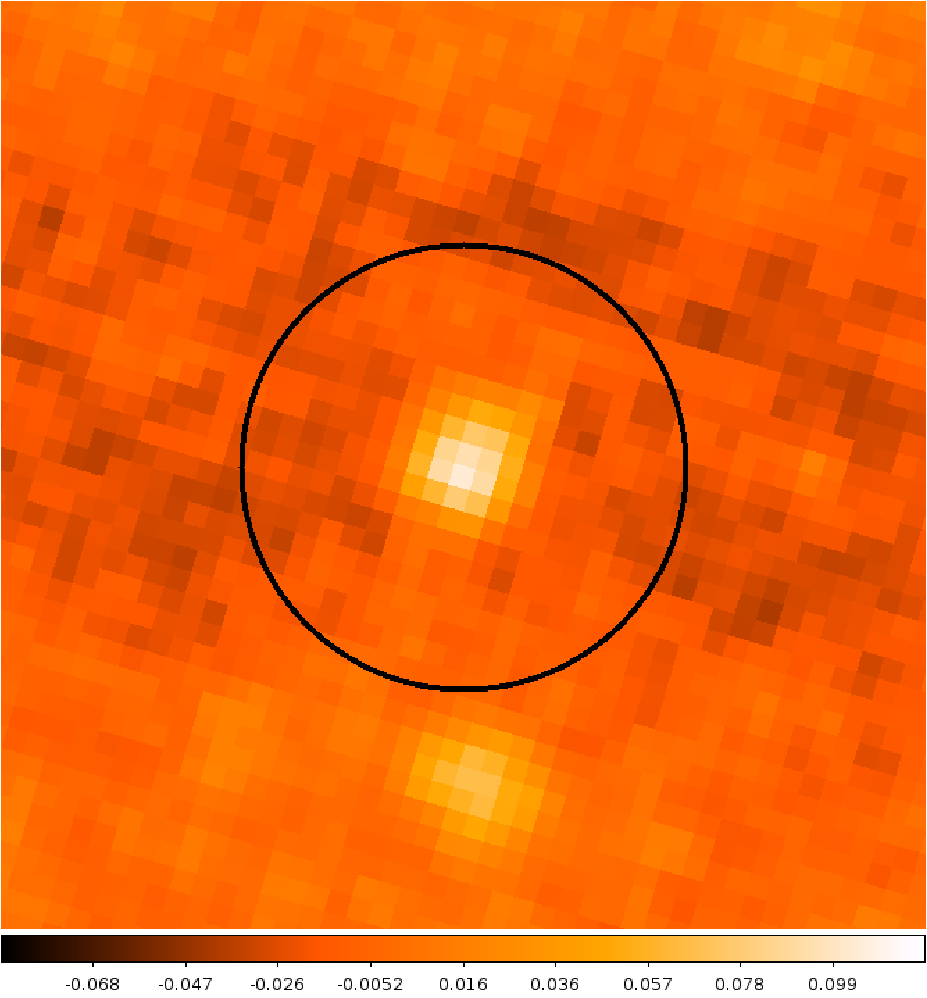
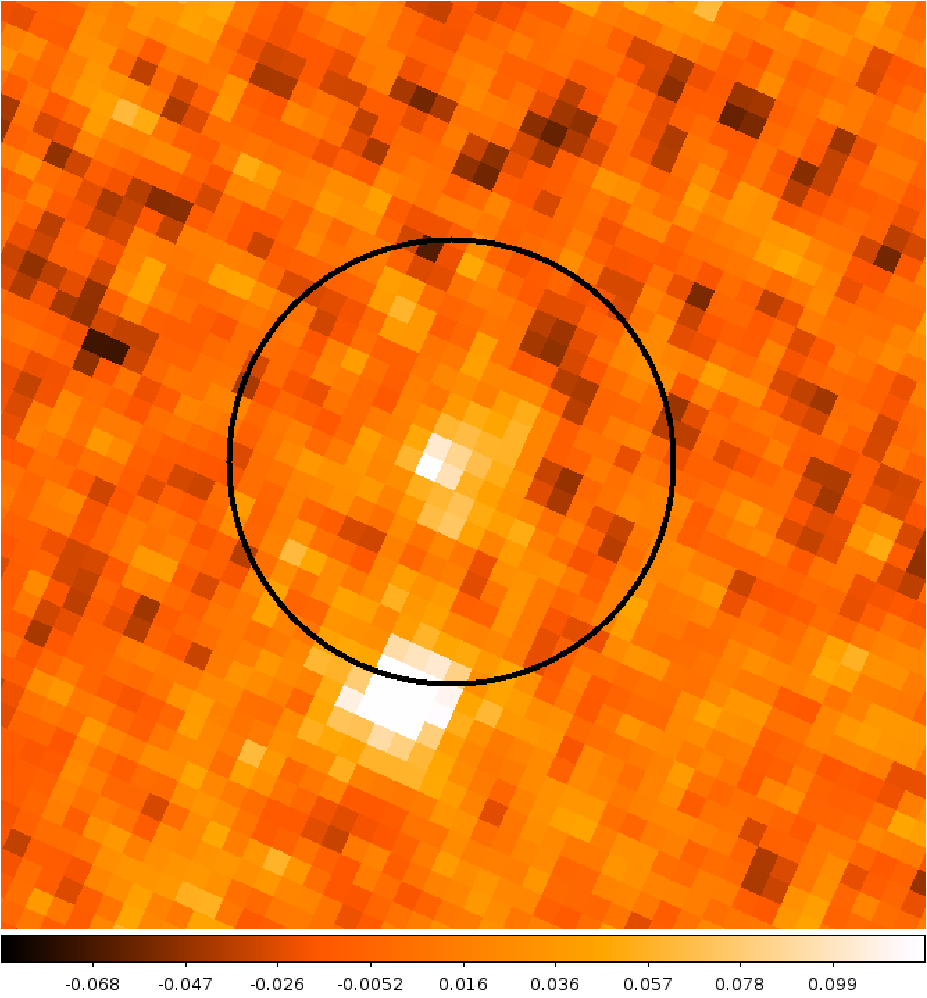
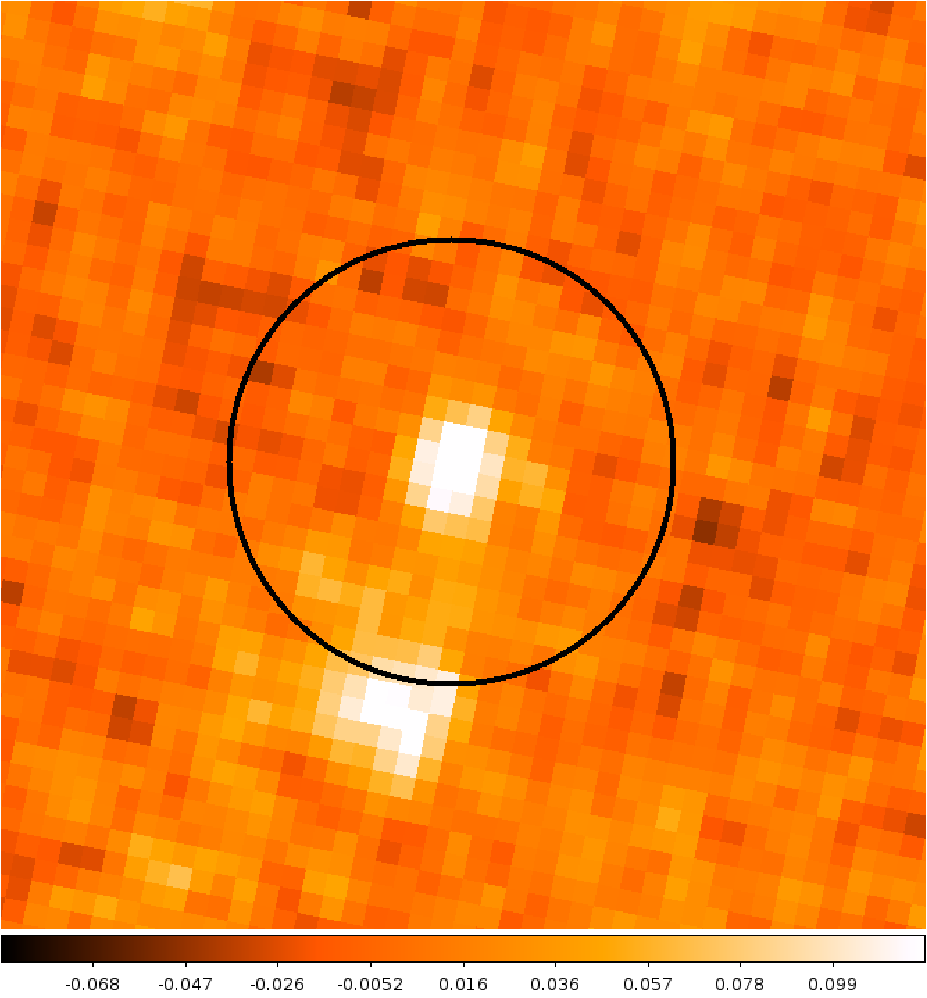
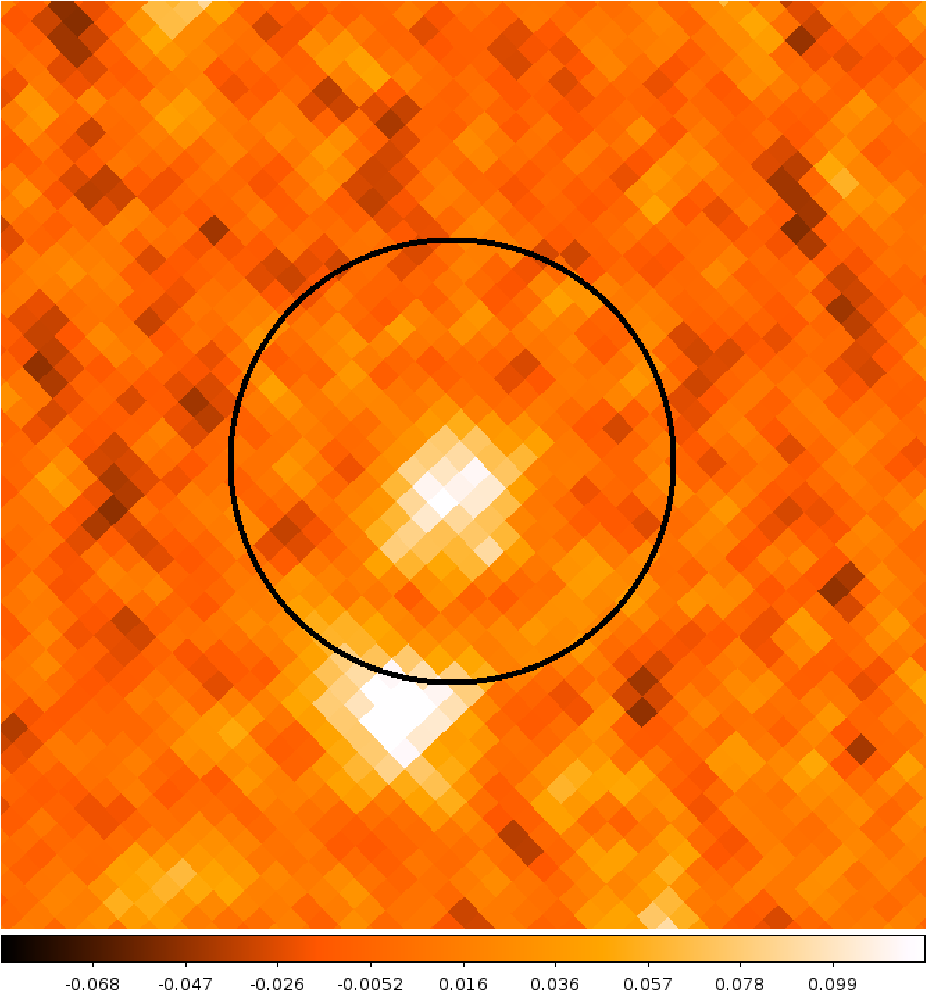
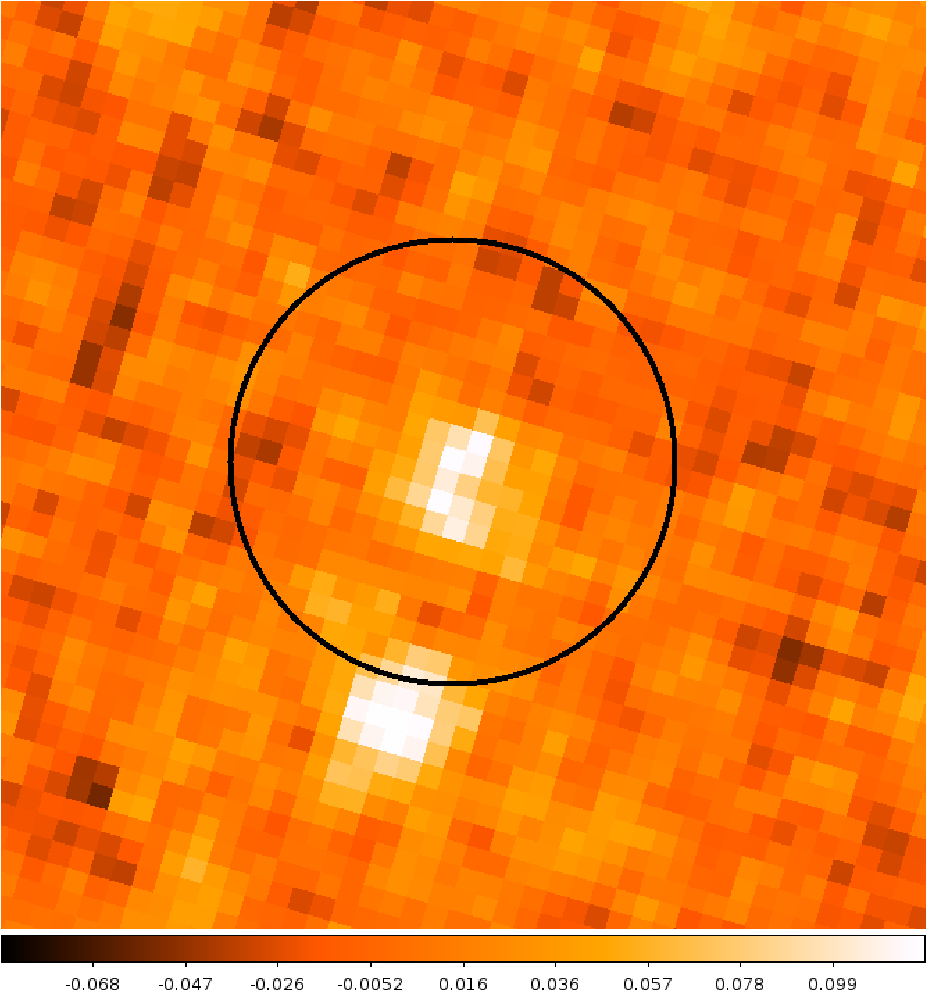
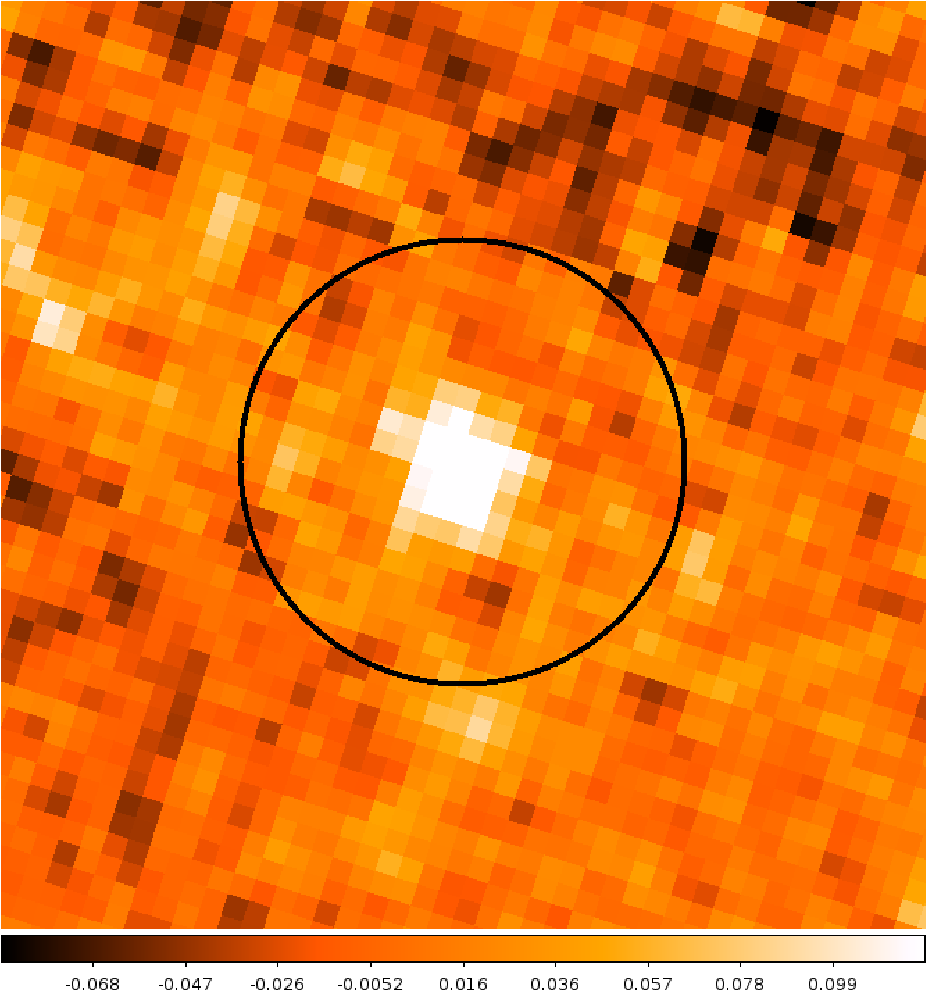
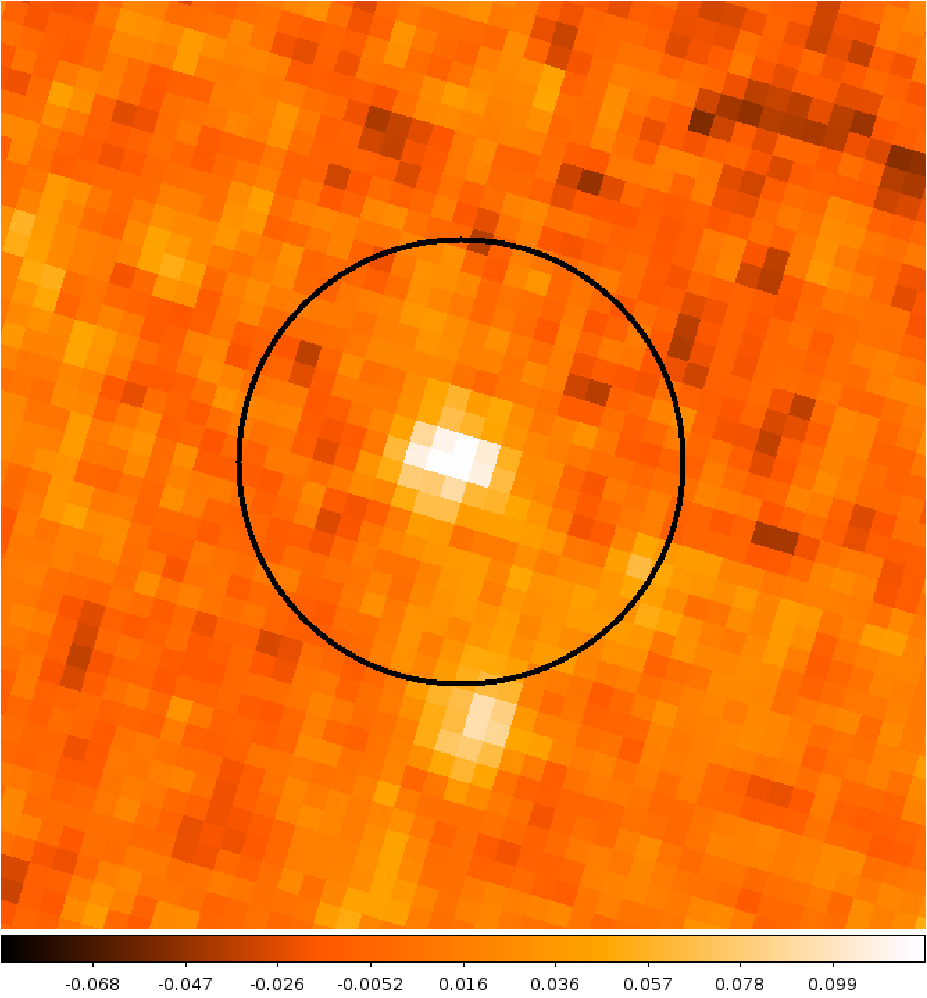
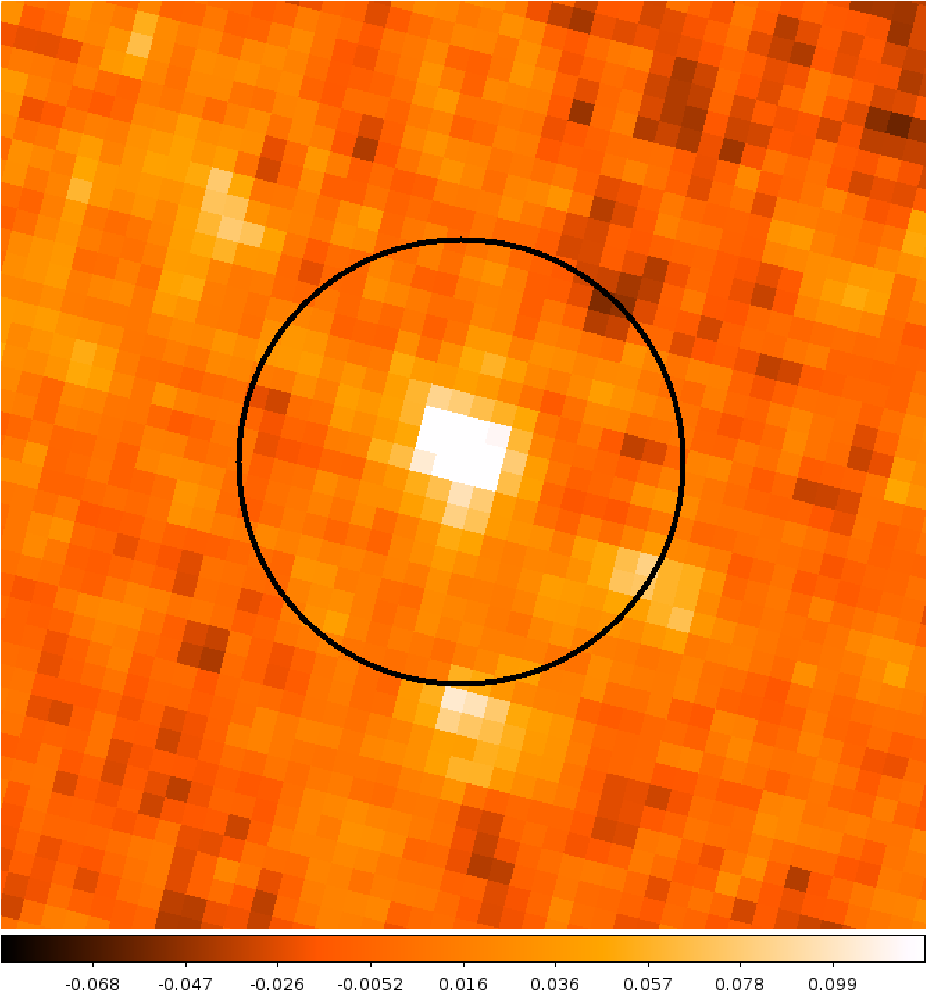
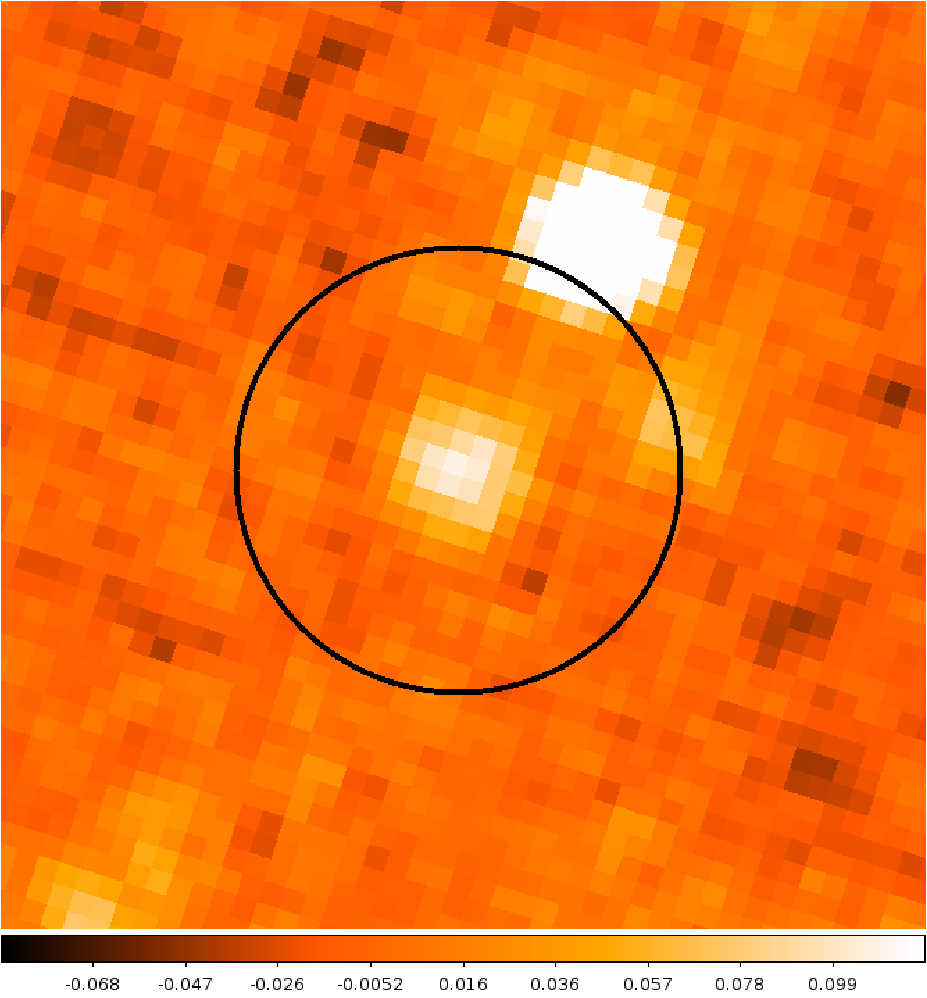
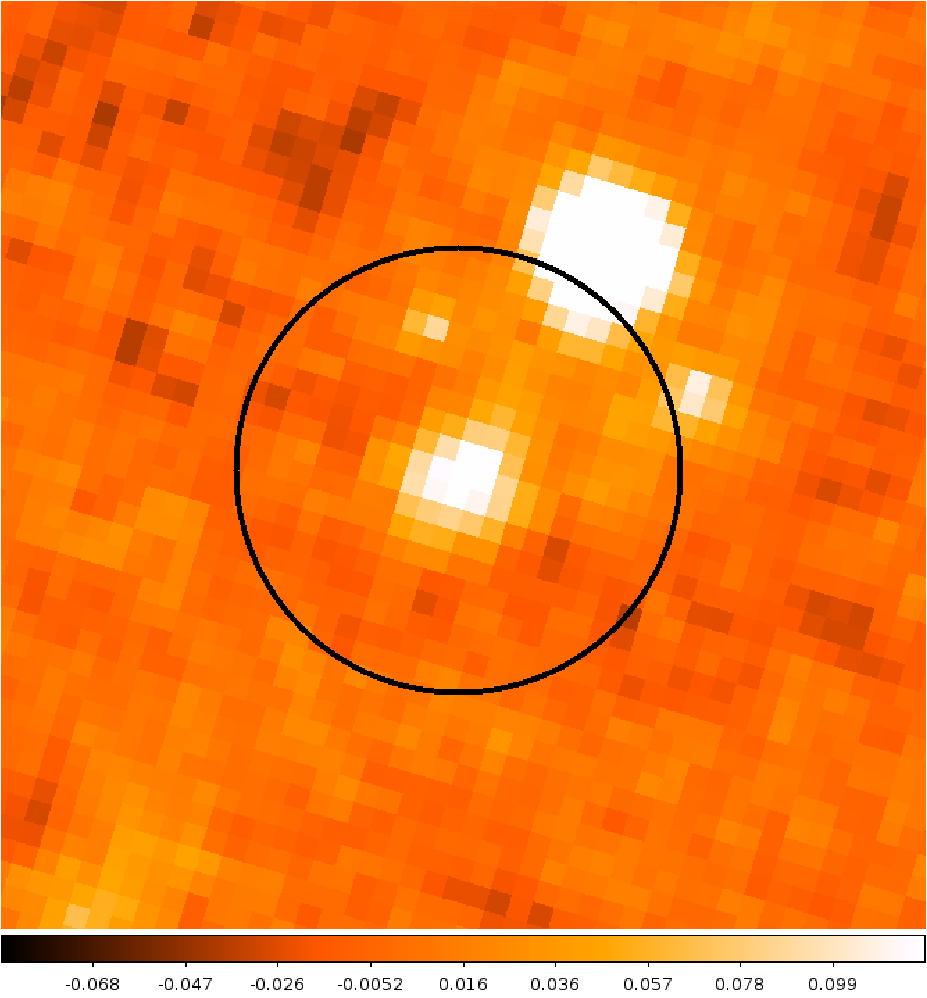
Appendix D Long-term variable candidates catalog
| ID | RA | DEC | Flux[epoch 1] | Flux[epoch 3] | Flux[epoch 6] | Flux[epoch 7] | Var | z+ | R | X-ray? | Radio? | |||
|---|---|---|---|---|---|---|---|---|---|---|---|---|---|---|
| (J2000) | (J2000) | (Jy) | (Jy) | (Jy) | (Jy) | (Jy) | (%) | |||||||
| 7348 | 52.8655903 | -27.5329591 | 41016 | 41024 | 41620 | 34217 | 395 | 12.23 | 18.9 | 1.22 | 0.71 | - | NO | NO |
| 13441∗11footnotemark: 1,22footnotemark: 2 | 52.8882698 | -27.7897526 | 14414 | 15620 | 14818 | 9911 | 137 | 12.48 | 41.4 | 1.57 | 0.57 | 20.98 | NO | NO |
| 5071∗ | 52.9801950 | -27.8067295 | 12913 | 8314 | 10421 | 1277 | 111 | 11.39 | 41.8 | 1.56 | 0.75 | 23.08 | NO | NO |
| 11519 | 53.0214235 | -27.4722517 | 17816 | 19115 | 12815 | 12421 | 155 | 13.61 | 43.2 | 1.54 | 1.07 | - | NO | NO |
| 12269 | 53.0288333 | -28.1259252 | 11419 | 17415 | 16319 | 11813 | 142 | 11.71 | 42.4 | 1.53 | 0.29 | - | NO | NO |
| 14622∗22footnotemark: 2 | 53.0467505 | -27.5834456 | 20114 | 22514 | 17716 | 26918 | 218 | 16.75 | 42.5 | 1.52 | 1.43 | 25.22 | NO | NO |
| 9579 | 53.0534834 | -27.4522969 | 40317 | 41817 | 34119 | 36921 | 383 | 11.63 | 20.3 | 1.23 | 0.19 | - | NO | NO |
| 16416 | 53.0543385 | -27.3906117 | 15917 | 15115 | 16319 | 25131 | 180 | 11.87 | 55.5 | 1.67 | 0.57 | - | NO | NO |
| 5359∗ | 53.0719302 | -27.9225433 | 11214 | 16918 | 13921 | 1167 | 134 | 12.39 | 42.6 | 1.51 | 1.27 | 24.98 | NO | NO |
| 5080∗11footnotemark: 1,22footnotemark: 2 | 53.0779999 | -27.7740151 | 24717 | 26016 | 19620 | 20810 | 228 | 11.73 | 28.3 | 1.33 | 1.729 | 24.08 | NO | NO |
| 11976∗ | 53.0885467 | -27.8504550 | 13417 | 16114 | 12619 | 1828 | 151 | 18.92 | 36.6 | 1.44 | 1.78 | 23.28 | YES | NO |
| 9796∗11footnotemark: 1,22footnotemark: 2 | 53.1110983 | -27.6040756 | 18513 | 17216 | 23416 | 15215 | 186 | 14.77 | 43.7 | 1.53 | 1.24 | 24.79 | NO | YES |
| 5109∗22footnotemark: 2 | 53.1515045 | -27.7620615 | 22413 | 21419 | 16217 | 14310 | 186 | 30.41 | 43.6 | 1.57 | 0.426 | 22.16 | NO | NO |
| 7742∗11footnotemark: 1,22footnotemark: 2 | 53.1942822 | -27.6723954 | 33315 | 35825 | 37317 | 27716 | 335 | 19.00 | 28.8 | 1.35 | 0.668 | 21.84 | NO | NO |
| 10015∗11footnotemark: 1,22footnotemark: 2 | 53.1948840 | -27.7538449 | 17213 | 14616 | 18417 | 1339 | 159 | 11.67 | 31.6 | 1.38 | 0.838 | 22.96 | YES | NO |
| 2226∗11footnotemark: 1,22footnotemark: 2 | 53.2001248 | -27.8155580 | 14613 | 15517 | 18022 | 1918 | 168 | 12.37 | 26.4 | 1.30 | 0.233 | 20.78 | YES | NO |
| 13601∗22footnotemark: 2 | 53.2022070 | -27.8263358 | 14919 | 17416 | 14416 | 1968 | 166 | 17.41 | 31.1 | 1.36 | 1.117 | 25.08 | YES | YES |
| 14779∗11footnotemark: 1,22footnotemark: 2 | 53.2047528 | -27.7432269 | 10013 | 8117 | 9415 | 14110 | 104 | 15.46 | 57.0 | 1.73 | 0.216 | 19.75 | YES | NO |
| 2324∗22footnotemark: 2 | 53.2064728 | -27.8675984 | 17416 | 13513 | 13519 | 1778 | 155 | 11.94 | 27.2 | 1.31 | 0.414 | 21.38 | NO | NO |
| 10402 | 53.2076102 | -28.0760407 | 34514 | 33519 | 31215 | 26518 | 314 | 13.35 | 25.5 | 1.30 | 1.95 | - | NO | NO |
| 4679 | 53.2103280 | -27.5243703 | 34023 | 26917 | 34119 | 27418 | 306 | 13.33 | 23.4 | 1.27 | 0.98 | - | NO | NO |
| 5930 | 53.2134267 | -28.1566425 | 13614 | 17816 | 9520 | 16416 | 143 | 12.72 | 57.4 | 1.86 | - | - | NO | NO |
| 4878∗ | 53.2139709 | -27.6210732 | 21214 | 27315 | 16615 | 21216 | 207 | 11.88 | 34.5 | 1.43 | 1.88 | - | NO | NO |
| 10377∗11footnotemark: 1 | 53.2681253 | -28.0246684 | 19819 | 16916 | 17125 | 24117 | 195 | 11.58 | 37.4 | 1.43 | 0.92 | 22.83 | NO | NO |
| 2380∗11footnotemark: 1,22footnotemark: 2 | 53.2730602 | -27.8755176 | 17918 | 11115 | 16515 | 1408 | 149 | 12.01 | 46.0 | 1.62 | 0.50 | 20.99 | NO | NO |
| 12354 | 53.2756206 | -28.0988060 | 14913 | 12217 | 15315 | 8115 | 126 | 16.58 | 57.6 | 1.90 | 1.86 | - | NO | NO |
| 8295∗ | 53.2766409 | -28.0183704 | 17413 | 19016 | 21715 | 9117 | 168 | 34.06 | 75.1 | 2.39 | 1.57 | 24.21 | NO | NO |
| 13829∗11footnotemark: 1,22footnotemark: 2 | 53.2853000 | -28.0627180 | 13713 | 16118 | 14016 | 9413 | 133 | 12.01 | 50.9 | 1.72 | 0.76 | 22.88 | NO | NO |
| 2552∗11footnotemark: 1,22footnotemark: 2 | 53.2943522 | -27.9635147 | 25014 | 31417 | 36116 | 34812 | 330 | 13.59 | 20.2 | 1.23 | 1.26 | 21.21 | YES | NO |
| 5086∗11footnotemark: 1,22footnotemark: 2 | 53.2980525 | -27.6902849 | 13019 | 21514 | 18518 | 17123 | 175 | 13.65 | 48.4 | 1.65 | 0.90 | 22.95 | NO | NO |
| 5451∗ | 53.3000223 | -27.8779051 | 28318 | 34516 | 27515 | 29810 | 300 | 11.82 | 23.1 | 1.25 | 0.81 | 22.52 | NO | NO |
| 2253∗11footnotemark: 1,22footnotemark: 2 | 53.3011532 | -27.7885025 | 22017 | 18215 | 23916 | 18410 | 206 | 12.90 | 27.4 | 1.31 | 1.45 | 23.98 | NO | NO |
| 12132∗11footnotemark: 1 | 53.3266480 | -27.8986874 | 14915 | 20815 | 23115 | 20110 | 197 | 15.46 | 41.4 | 1.55 | 0.63 | 21.31 | NO | NO |
| 5766∗22footnotemark: 2 | 53.3296181 | -28.0256251 | 24113 | 20113 | 27416 | 25211 | 242 | 14.64 | 30.0 | 1.36 | 0.30 | 21.58 | NO | NO |
| 8379∗11footnotemark: 1 | 53.3585985 | -28.0450788 | 20315 | 15813 | 23017 | 1929 | 196 | 12.77 | 37.0 | 1.46 | 1.08 | 22.63 | NO | NO |
| 12099∗11footnotemark: 1,22footnotemark: 2 | 53.3617713 | -27.8518082 | 10016 | 11921 | 15216 | 1538 | 131 | 12.56 | 40.1 | 1.53 | 0.94 | 22.31 | YES | NO |
| 5403∗11footnotemark: 1,22footnotemark: 2 | 53.3798560 | -27.8245098 | 14526 | 17820 | 16618 | 1298 | 154 | 13.92 | 32.0 | 1.38 | 0.70 | 22.14 | NO | NO |
| 5582 | 53.4022377 | -27.9101321 | 13327 | 15024 | 15618 | 1068 | 136 | 15.81 | 36.4 | 1.47 | 1.93 | - | NO | NO |
| 6061 | 53.4205850 | -28.1435063 | 16315 | 21721 | 10116 | 13017 | 153 | 22.74 | 76.5 | 2.16 | 0.81 | - | NO | NO |
+ Redshifts with three decimal points are spectroscopic redshifts.
∗ In the E-CDFS.
1 In COMBO-17 catalog and only one counterpart in 2.5 in Rainbow catalog.
2 Only one counterpart in 2.5 in COMBO-17 catalog.
Appendix E Short-term variable candidates catalog
| ID | RA | DEC | Flux [epoch7a] | Flux [epoch7b] | Flux7 [epoch7c] | Var | z+ | R | X-ray? | Radio? | |||
|---|---|---|---|---|---|---|---|---|---|---|---|---|---|
| (J2000) | (J2000) | (Jy) | (Jy) | (Jy) | (Jy) | (%) | |||||||
| 13 | 52.7297992 | -27.5739281 | 29830 | 21633 | 15633 | 223 | 10.80 | 63.8 | 1.92 | - | - | NO | NO |
| 2634∗11footnotemark: 1,22footnotemark: 2 | 52.8866973 | -27.8719379 | 21115 | 22915 | 15517 | 198 | 11.81 | 37.5 | 1.48 | 0.65 | 20.30 | NO | NO |
| 6314∗11footnotemark: 1,22footnotemark: 2 | 52.8931060 | -27.8764410 | 20014 | 19415 | 12821 | 174 | 10.12 | 41.0 | 1.56 | 0.74 | 21.20 | NO | NO |
| 937∗ | 52.8942467 | -27.8840075 | 32614 | 28114 | 34616 | 318 | 10.15 | 20.5 | 1.23 | 1.16 | - | NO | NO |
| 2625∗22footnotemark: 2 | 52.8962139 | -27.8649395 | 11914 | 10318 | 19016 | 137 | 16.43 | 63.5 | 1.85 | 1.28 | 23.94 | NO | NO |
| 763∗ | 52.9090009 | -27.7866579 | 33920 | 29115 | 36321 | 331 | 9.37 | 21.7 | 1.25 | 1.05 | 22.07 | NO | NO |
| 2356∗11footnotemark: 1,22footnotemark: 2 | 52.9251368 | -27.7383352 | 23126 | 16220 | 15224 | 215 | 12.52 | 50.8 | 1.72 | 1.02 | 22.38 | NO | NO |
| 6827 | 52.9338732 | -28.0834027 | 40617 | 32516 | 38019 | 370 | 13.22 | 21.8 | 1.25 | 0.44 | - | YES | NO |
| 4648∗11footnotemark: 1,22footnotemark: 2 | 52.9379937 | -27.8746505 | 16311 | 10411 | 13317 | 133 | 14.29 | 44.1 | 1.56 | 0.734 | 23.49 | NO | YES |
| 1947 | 52.9862313 | -27.5157096 | 34631 | 20825 | 20048 | 251 | 13.67 | 58.1 | 1.73 | 0.81 | - | NO | NO |
| 8181 | 52.9972222 | -28.1038541 | 22215 | 17815 | 14317 | 181 | 12.25 | 43.4 | 1.55 | - | - | NO | NO |
| 718∗11footnotemark: 1,22footnotemark: 2 | 53.0047558 | -27.7255025 | 24326 | 14920 | 23531 | 209 | 11.87 | 44.9 | 1.63 | 1.001 | 22.29 | NO | NO |
| 7513∗11footnotemark: 1,22footnotemark: 2 | 53.0134300 | -27.7581000 | 27219 | 16518 | 22718 | 221 | 16.47 | 48.3 | 1.65 | 0.534 | 21.01 | NO | NO |
| 917∗11footnotemark: 1,22footnotemark: 2 | 53.0192273 | -27.8352082 | 22812 | 19713 | 18110 | 202 | 9.23 | 23.2 | 1.26 | 0.23 | 19.93 | YES | NO |
| 8613∗11footnotemark: 1,22footnotemark: 2 | 53.0286682 | -27.6356610 | 21737 | 15820 | 26228 | 212 | 10.48 | 49.2 | 1.66 | 0.50 | 20.92 | NO | NO |
| 1943 | 53.0316927 | -27.5017437 | 38932 | 25822 | 27129 | 306 | 12.61 | 42.8 | 1.51 | 1.91 | - | NO | NO |
| 7921∗22footnotemark: 2 | 53.0476619 | -27.9473127 | 17315 | 21212 | 25416 | 213 | 13.81 | 38.1 | 1.47 | 1.11 | 22.21 | NO | NO |
| 2277∗ | 53.0555289 | -27.6597959 | 23840 | 23021 | 35632 | 275 | 11.85 | 45.9 | 1.55 | 1.49 | - | NO | YES |
| 8766∗ | 53.0819932 | -27.7672103 | 36917 | 32118 | 27722 | 322 | 11.94 | 28.5 | 1.33 | 0.62 | - | YES | YES |
| 517∗11footnotemark: 1,22footnotemark: 2 | 53.0839618 | -27.5734177 | 17929 | 28621 | 22528 | 230 | 10.60 | 46.6 | 1.60 | 1.12 | 21.08 | NO | YES |
| 1503 | 53.0869545 | -28.1404091 | 19732 | 14219 | 23426 | 191 | 9.59 | 48.0 | 1.65 | 0.69 | - | NO | NO |
| 10885∗ | 53.0925557 | -27.9857229 | 36018 | 31115 | 28216 | 318 | 11.10 | 24.8 | 1.28 | 0.57 | - | NO | NO |
| 6978 | 53.1064166 | -28.1262429 | 38924 | 30719 | 24927 | 315 | 15.63 | 44.5 | 1.56 | 1.03 | - | NO | NO |
| 185∗11footnotemark: 1,22footnotemark: 2 | 53.1121892 | -28.0514201 | 34118 | 35422 | 42320 | 373 | 10.06 | 21.9 | 1.24 | 1.57 | 24.00 | NO | NO |
| 3265∗ | 53.1250338 | -28.0383985 | 23425 | 19116 | 14018 | 188 | 10.79 | 50.2 | 1.68 | 1.85 | 23.61 | NO | NO |
| 4501∗11footnotemark: 1,22footnotemark: 2 | 53.1367677 | -27.7688610 | 61020 | 66919 | 58418 | 621 | 10.60 | 13.7 | 1.15 | 0.366 | 20.36 | NO | YES |
| 2091 | 53.1518662 | -27.5393472 | 25731 | 14521 | 19430 | 198 | 9.93 | 56.5 | 1.78 | 0.28 | - | NO | NO |
| 2847∗11footnotemark: 1,22footnotemark: 2 | 53.1549571 | -27.8767845 | 23411 | 19211 | 18713 | 204 | 10.23 | 22.8 | 1.25 | 0.331 | 20.49 | NO | NO |
| 1925 | 53.1620312 | -27.4562601 | 22228 | 24325 | 12129 | 195 | 11.14 | 62.4 | 2.01 | 1.00 | - | NO | NO |
| 3702 | 53.1828042 | -28.2246423 | 29338 | 14220 | 17529 | 203 | 15.70 | 74.3 | 2.07 | - | - | NO | NO |
| 7761∗11footnotemark: 1,22footnotemark: 2 | 53.2024886 | -27.8262335 | 22714 | 20814 | 15116 | 195 | 14.12 | 38.9 | 1.50 | 1.117 | 25.08 | YES | YES |
| 4477∗11footnotemark: 1 | 53.2235604 | -27.7345674 | 25318 | 27417 | 18219 | 236 | 14.08 | 39.2 | 1.51 | 1.58 | 23.97 | NO | NO |
| 540 | 53.2480035 | -27.5404651 | 13927 | 11420 | 23528 | 162 | 13.26 | 74.3 | 2.06 | 1.72 | - | NO | YES |
| 2614∗11footnotemark: 1,22footnotemark: 2 | 53.2610999 | -27.7598248 | 10613 | 14117 | 16913 | 139 | 11.25 | 45.7 | 1.60 | 1.23 | 23.34 | YES | NO |
| 6876∗ | 53.2681484 | -28.0248935 | 12923 | 24620 | 27626 | 217 | 21.45 | 67.6 | 2.13 | 0.92 | 22.83 | NO | NO |
| 6017∗ | 53.2758295 | -27.6029799 | 20628 | 32124 | 25330 | 260 | 10.25 | 44.3 | 1.56 | 1.77 | 23.94 | NO | NO |
| 2409∗11footnotemark: 1,22footnotemark: 2 | 53.2795549 | -27.6633534 | 32227 | 22720 | 28832 | 279 | 9.23 | 34.1 | 1.42 | 0.45 | 21.35 | NO | NO |
| 10903∗ | 53.2826321 | -27.9443909 | 20016 | 23717 | 16318 | 200 | 9.24 | 37.2 | 1.46 | 0.12 | 20.91 | NO | NO |
| 1209∗11footnotemark: 1,22footnotemark: 2 | 53.2846948 | -27.9283298 | 17613 | 13915 | 11314 | 143 | 11.46 | 44.3 | 1.56 | 0.70 | 21.66 | NO | NO |
| 7869∗11footnotemark: 1,22footnotemark: 2 | 53.3057210 | -27.8438699 | 18510 | 18615 | 13813 | 170 | 9.86 | 27.8 | 1.34 | 0.32 | 19.51 | NO | NO |
| 8106∗ | 53.3173805 | -27.9729970 | 17813 | 22517 | 14816 | 184 | 11.56 | 42.3 | 1.53 | 0.45 | 22.63 | NO | NO |
| 6918∗11footnotemark: 1,22footnotemark: 2 | 53.3352837 | -28.0254291 | 10817 | 15013 | 19014 | 149 | 14.42 | 55.0 | 1.76 | 1.61 | 23.41 | NO | NO |
| 8050∗22footnotemark: 2 | 53.3430057 | -27.9321166 | 48019 | 53916 | 47415 | 498 | 10.33 | 13.1 | 1.14 | 1.66 | 23.43 | NO | NO |
| 123∗ | 53.3747793 | -27.8008735 | 16410 | 13912 | 19111 | 165 | 10.80 | 31.8 | 1.38 | 1.94 | - | NO | NO |
| 3632 | 53.3868526 | -28.1329288 | 30328 | 18921 | 24926 | 247 | 11.93 | 46.5 | 1.61 | 0.62 | - | NO | NO |
| 10053 | 53.4529616 | -27.8423718 | 32213 | 26514 | 29012 | 292 | 9.62 | 19.7 | 1.22 | - | - | NO | NO |
| 2734 | 53.4539570 | -27.7478151 | 16216 | 18724 | 10119 | 150 | 9.70 | 57.4 | 1.85 | 0.48 | - | NO | NO |
| 1032 | 53.4584105 | -27.7783558 | 16817 | 19116 | 12614 | 162 | 10.35 | 40.0 | 1.51 | 1.05 | - | NO | NO |
| 6622 | 53.4639456 | -27.8334061 | 50718 | 46421 | 43217 | 468 | 9.30 | 15.9 | 1.17 | - | - | NO | NO |
| 4767 | 53.4656628 | -27.7659261 | 13414 | 21217 | 19016 | 179 | 14.28 | 44.1 | 1.59 | 0.11 | - | NO | NO |
| 1039 | 53.4768023 | -27.7778086 | 16819 | 24417 | 13220 | 181 | 20.08 | 61.8 | 1.85 | - | - | NO | NO |
| 6814 | 53.4846854 | -27.9221903 | 18018 | 14414 | 21718 | 180 | 10.95 | 40.6 | 1.51 | - | - | NO | NO |
| 5284 | 53.4862820 | -27.9564971 | 22520 | 14414 | 19515 | 188 | 13.10 | 43.0 | 1.56 | - | - | NO | NO |
| 7936 | 53.4911453 | -27.8278011 | 36323 | 26926 | 36819 | 333 | 10.89 | 29.5 | 1.37 | - | - | NO | NO |
| 12955 | 53.4921523 | -27.8248350 | 21214 | 17516 | 28120 | 222 | 17.93 | 47.8 | 1.61 | - | - | NO | NO |
+ Redshifts with three decimal points are spectroscopic redshifts.
∗ In the E-CDFS.
1 In COMBO-17 catalog and only one counterpart in 2.5 in Rainbow catalog.
2 Only one counterpart in 2.5 in COMBO-17 catalog.
Appendix F Long-term variable candidates light curves
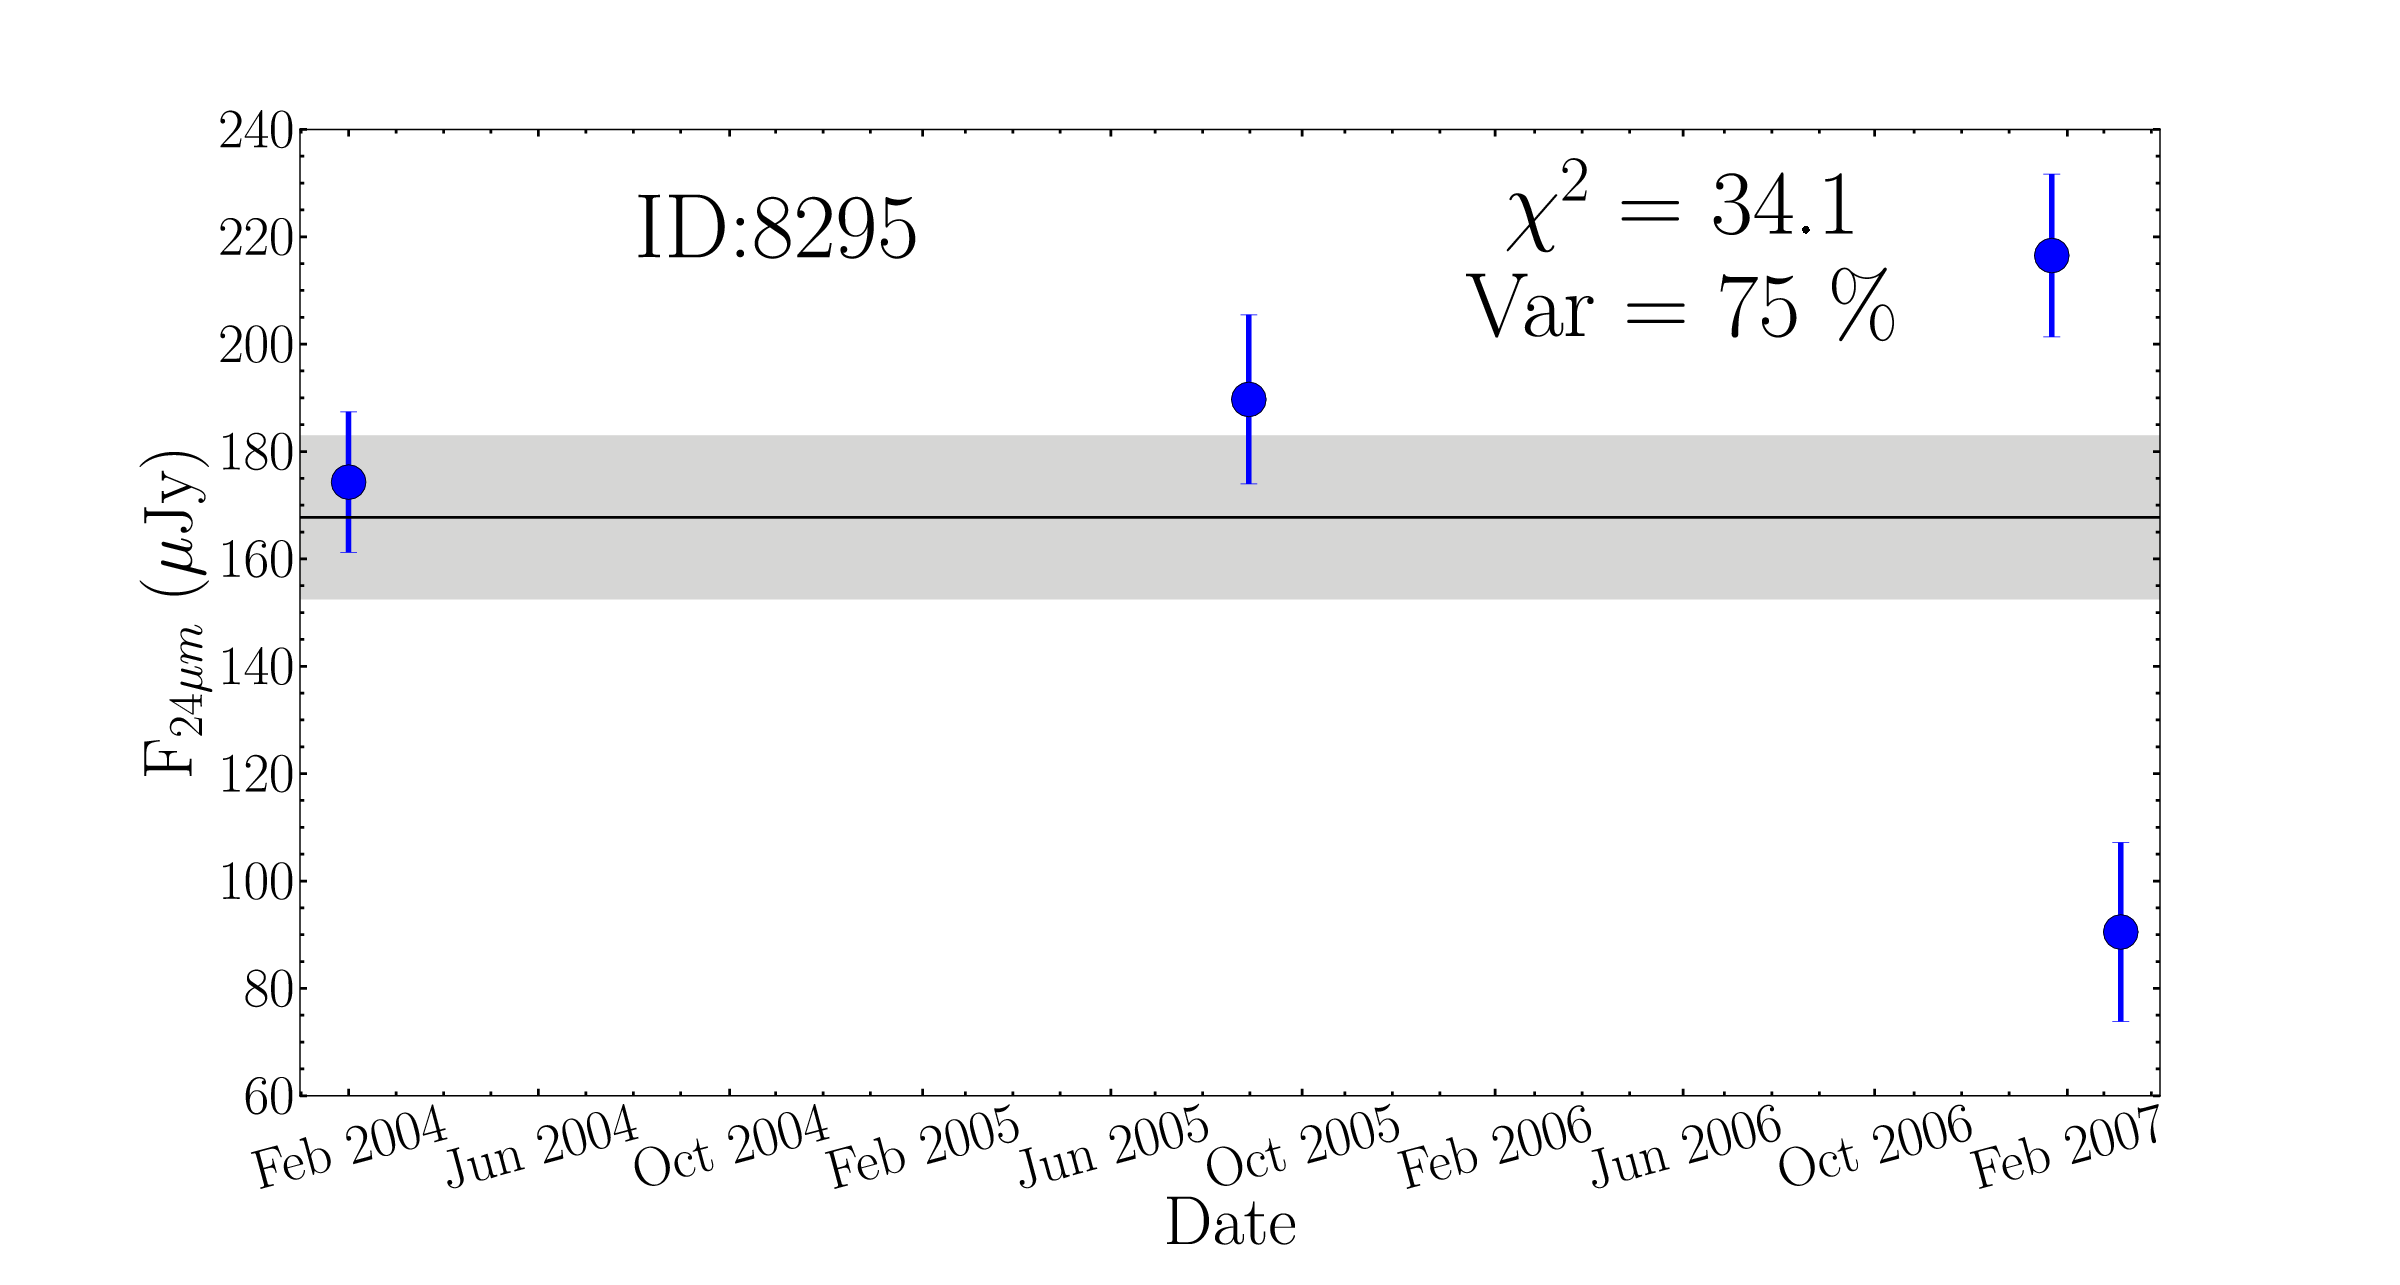
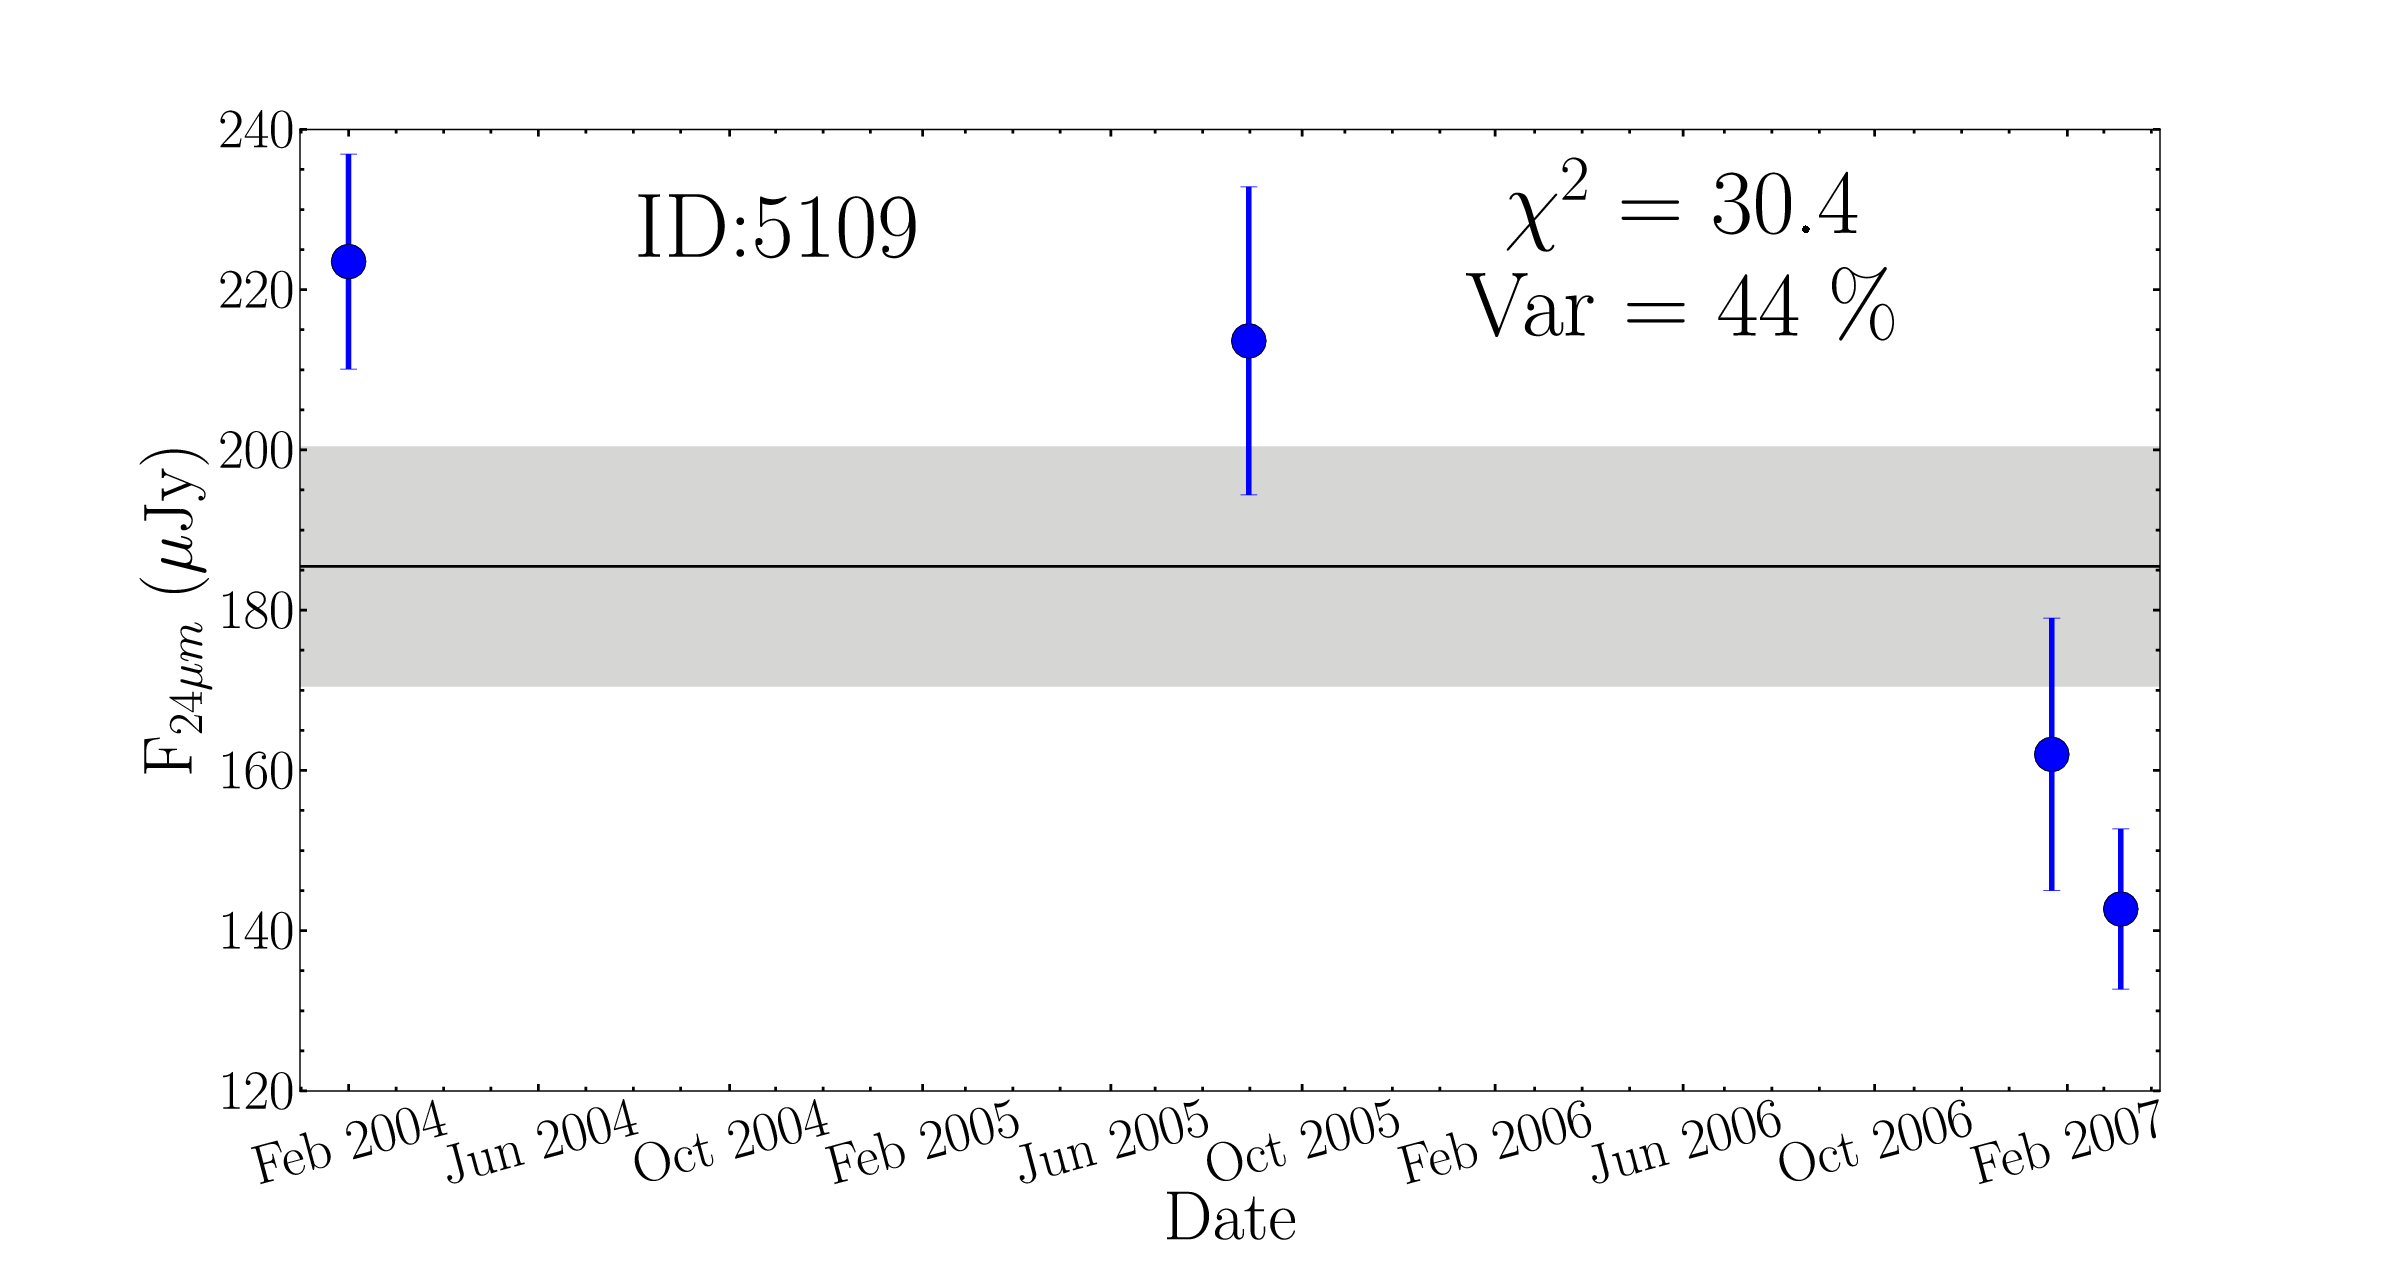
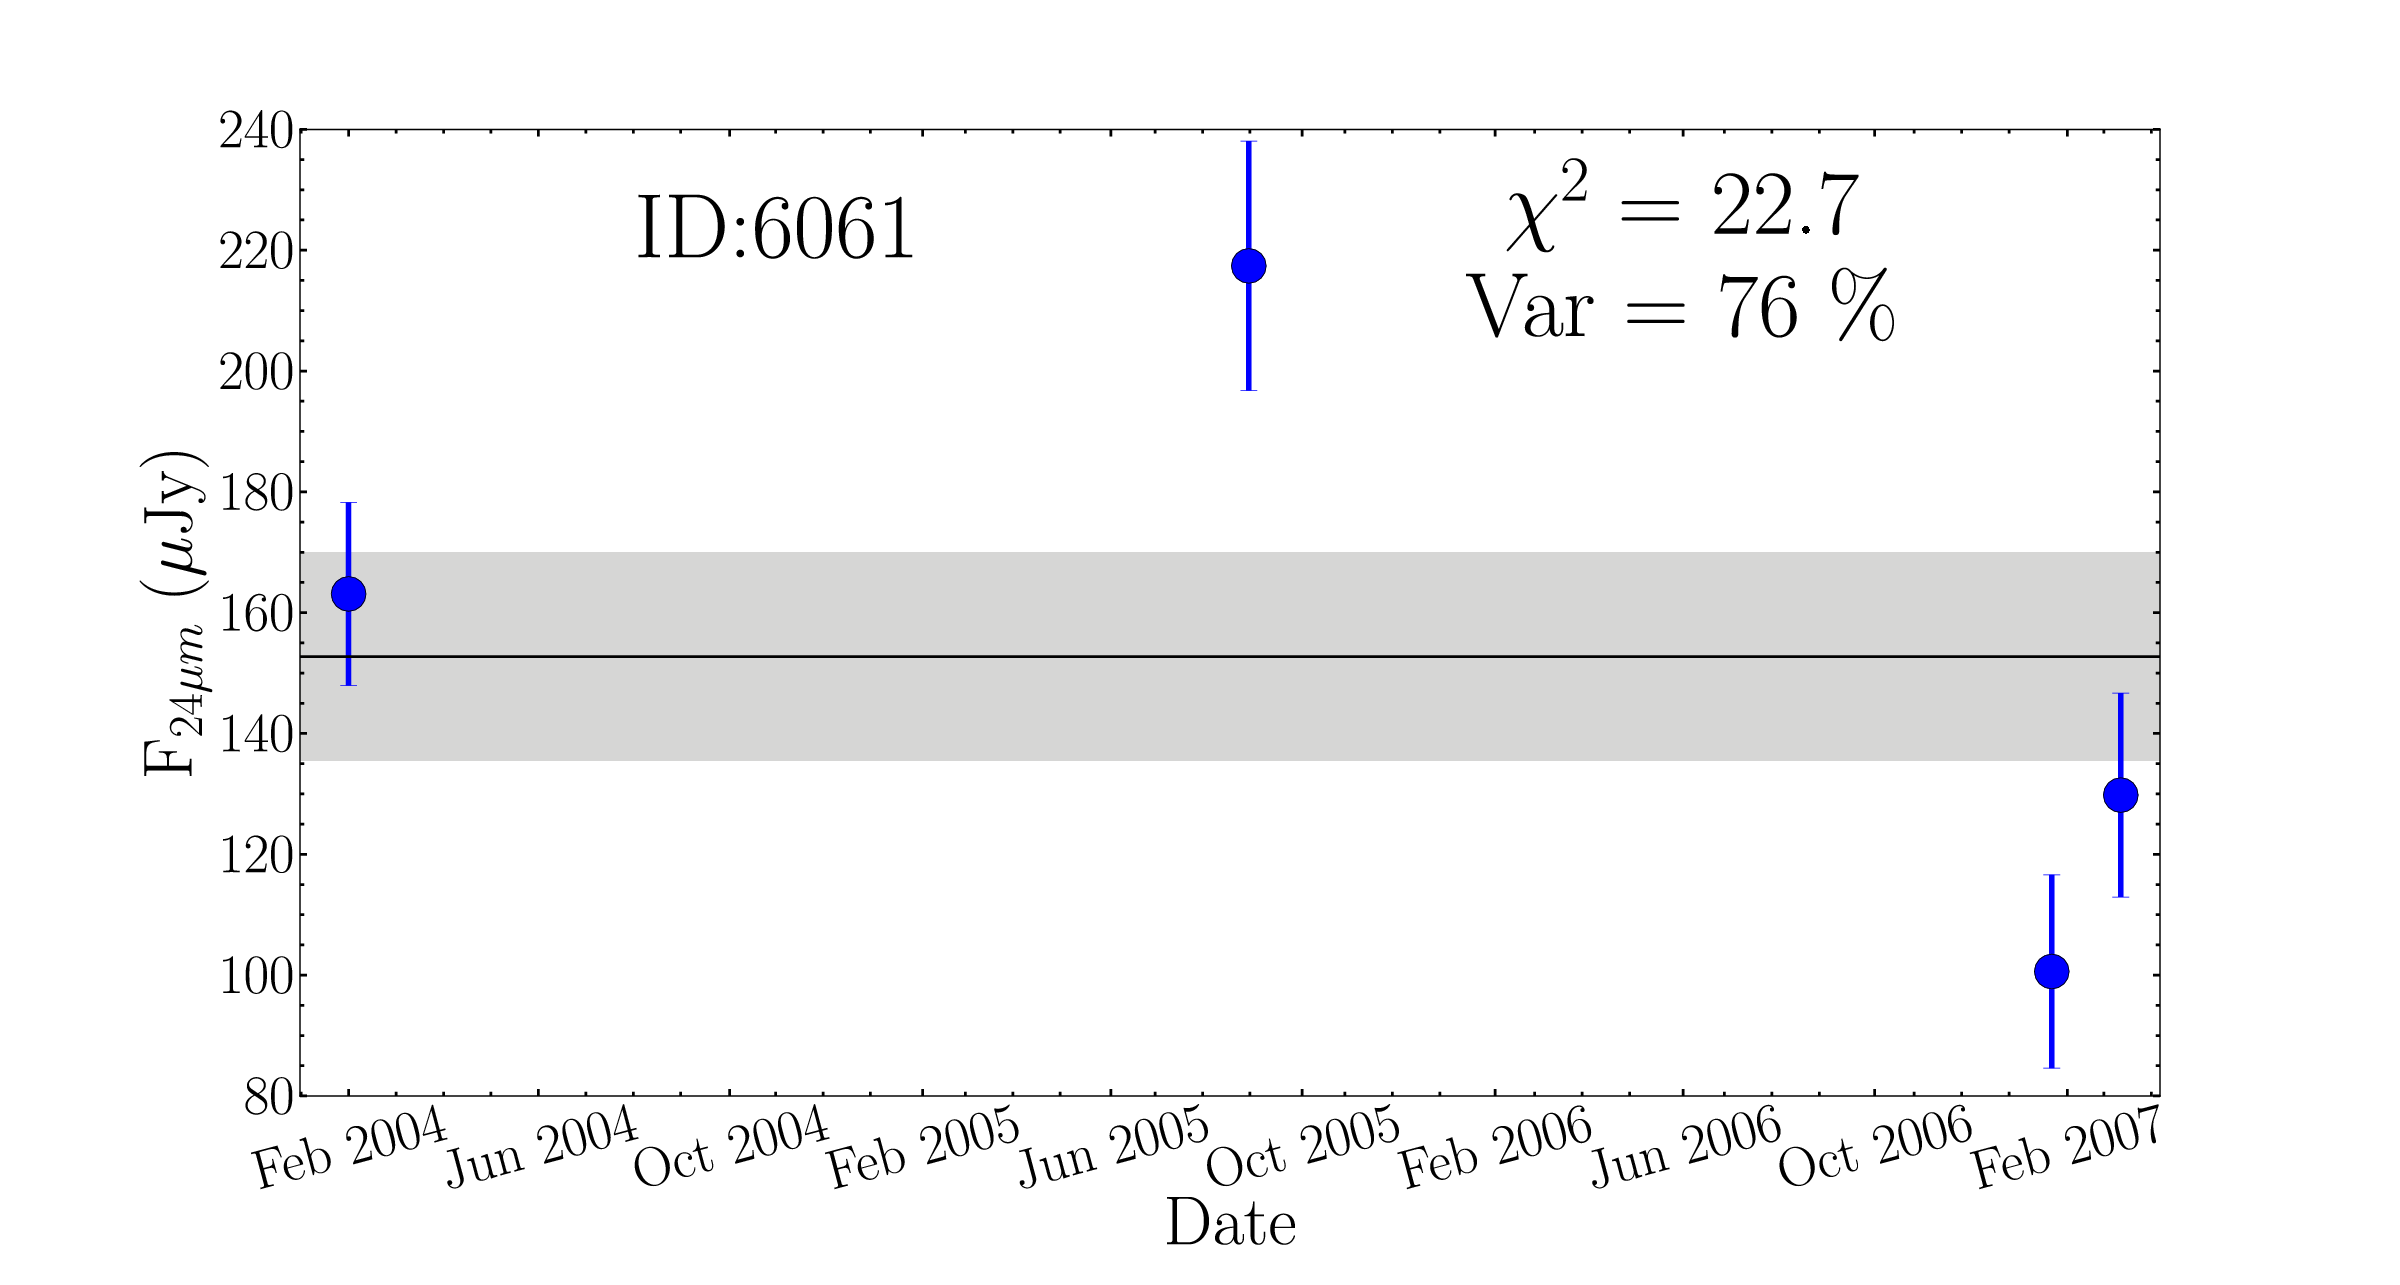
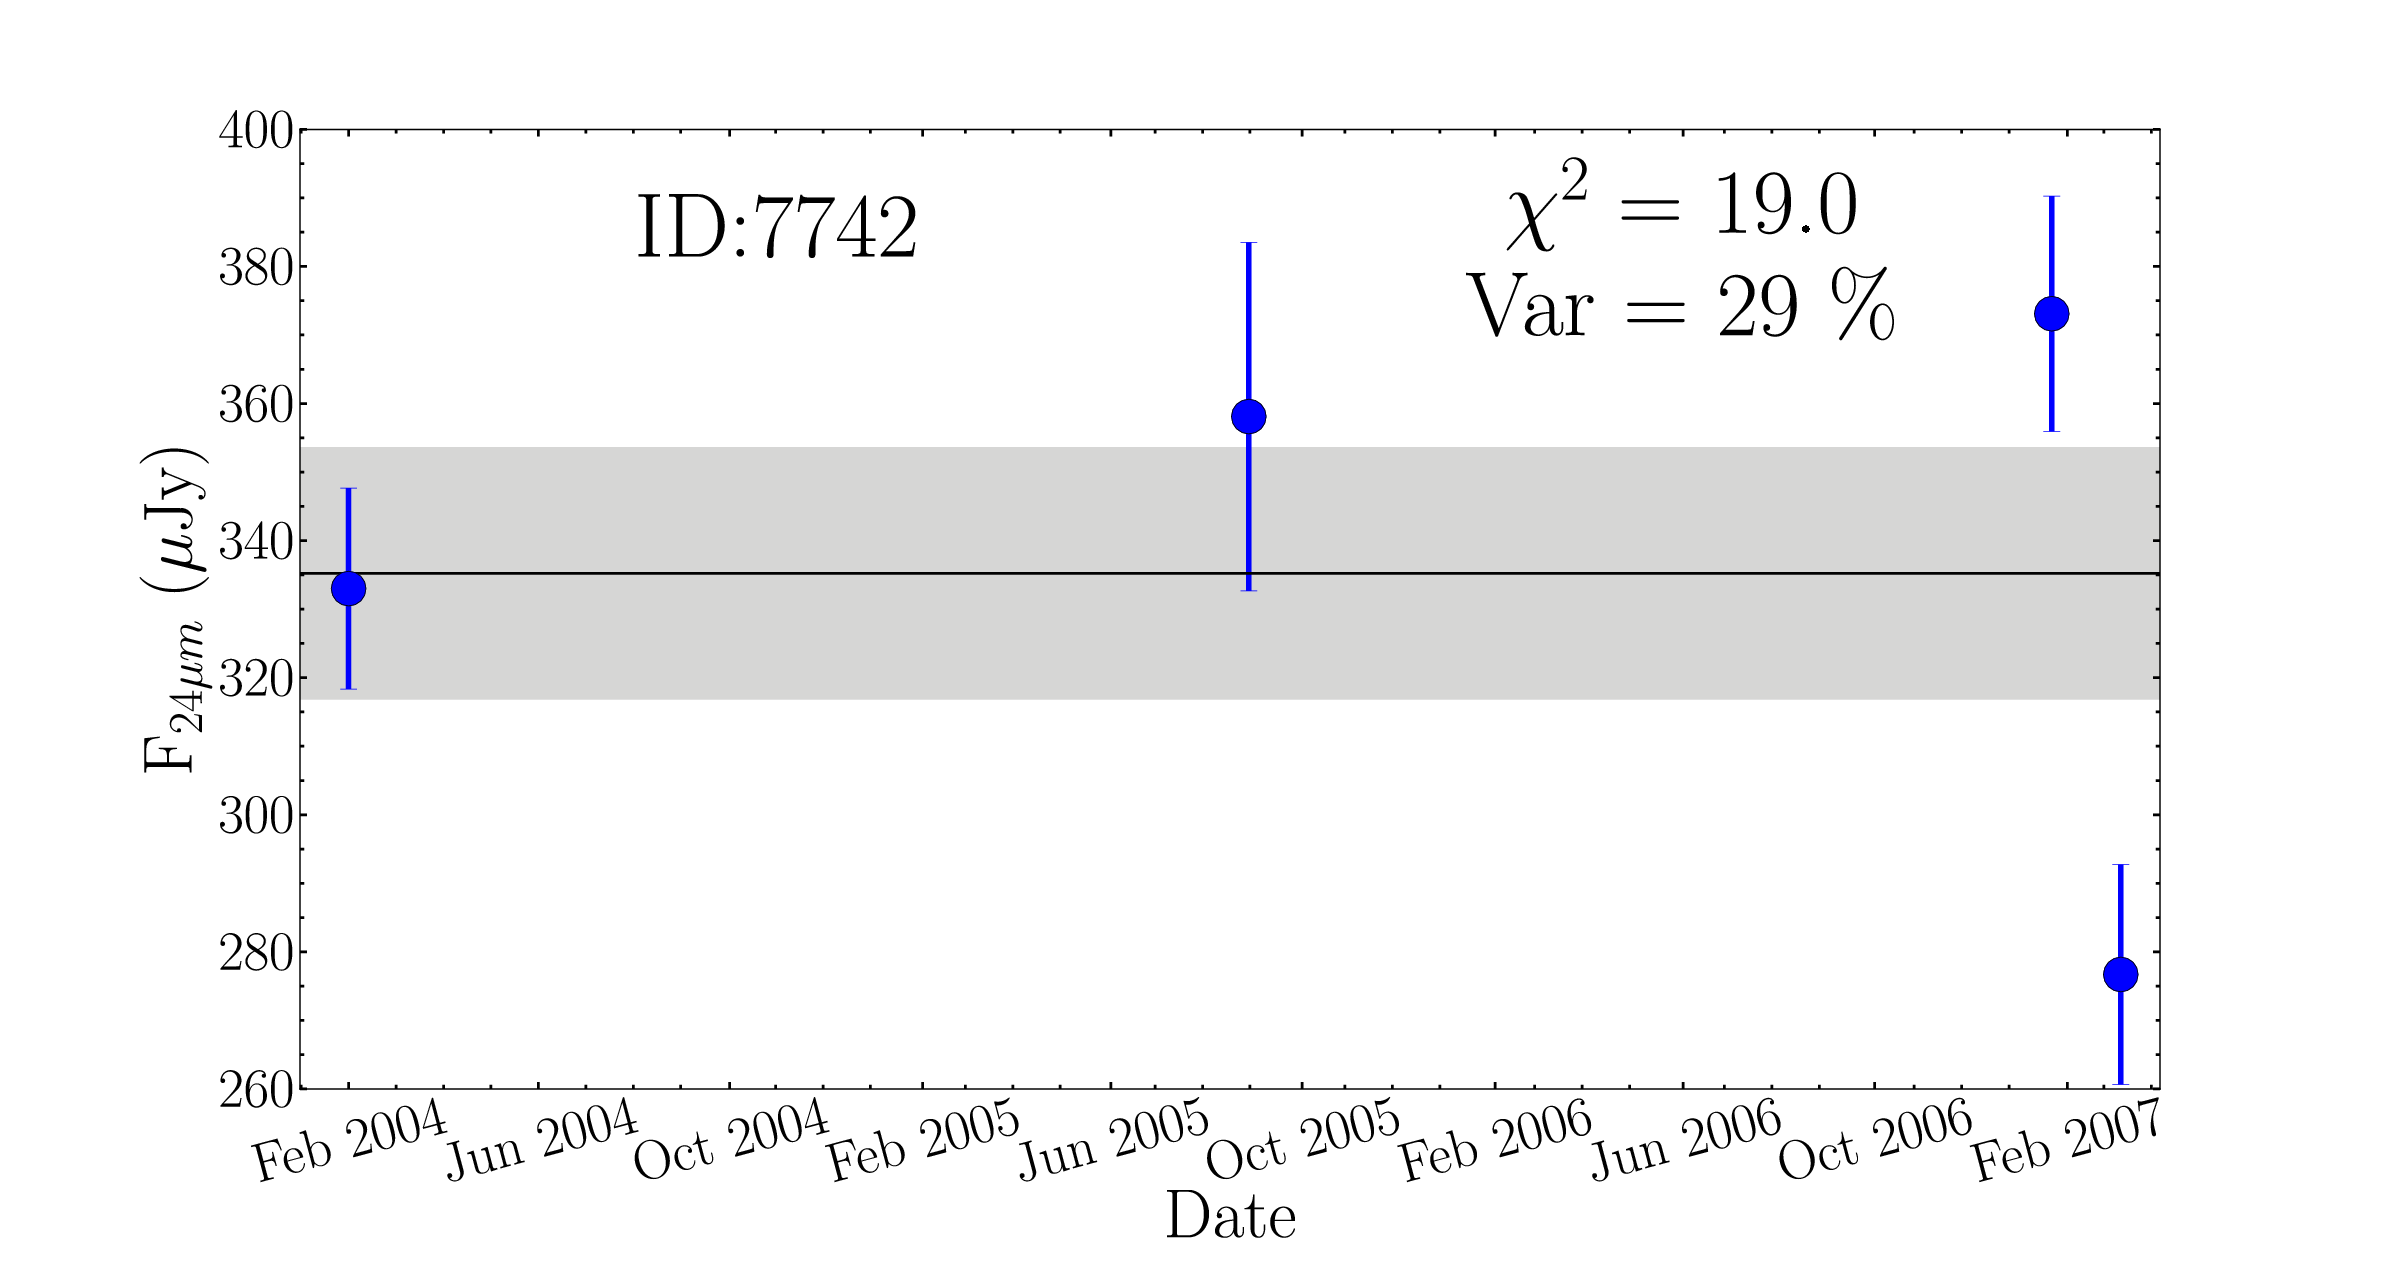
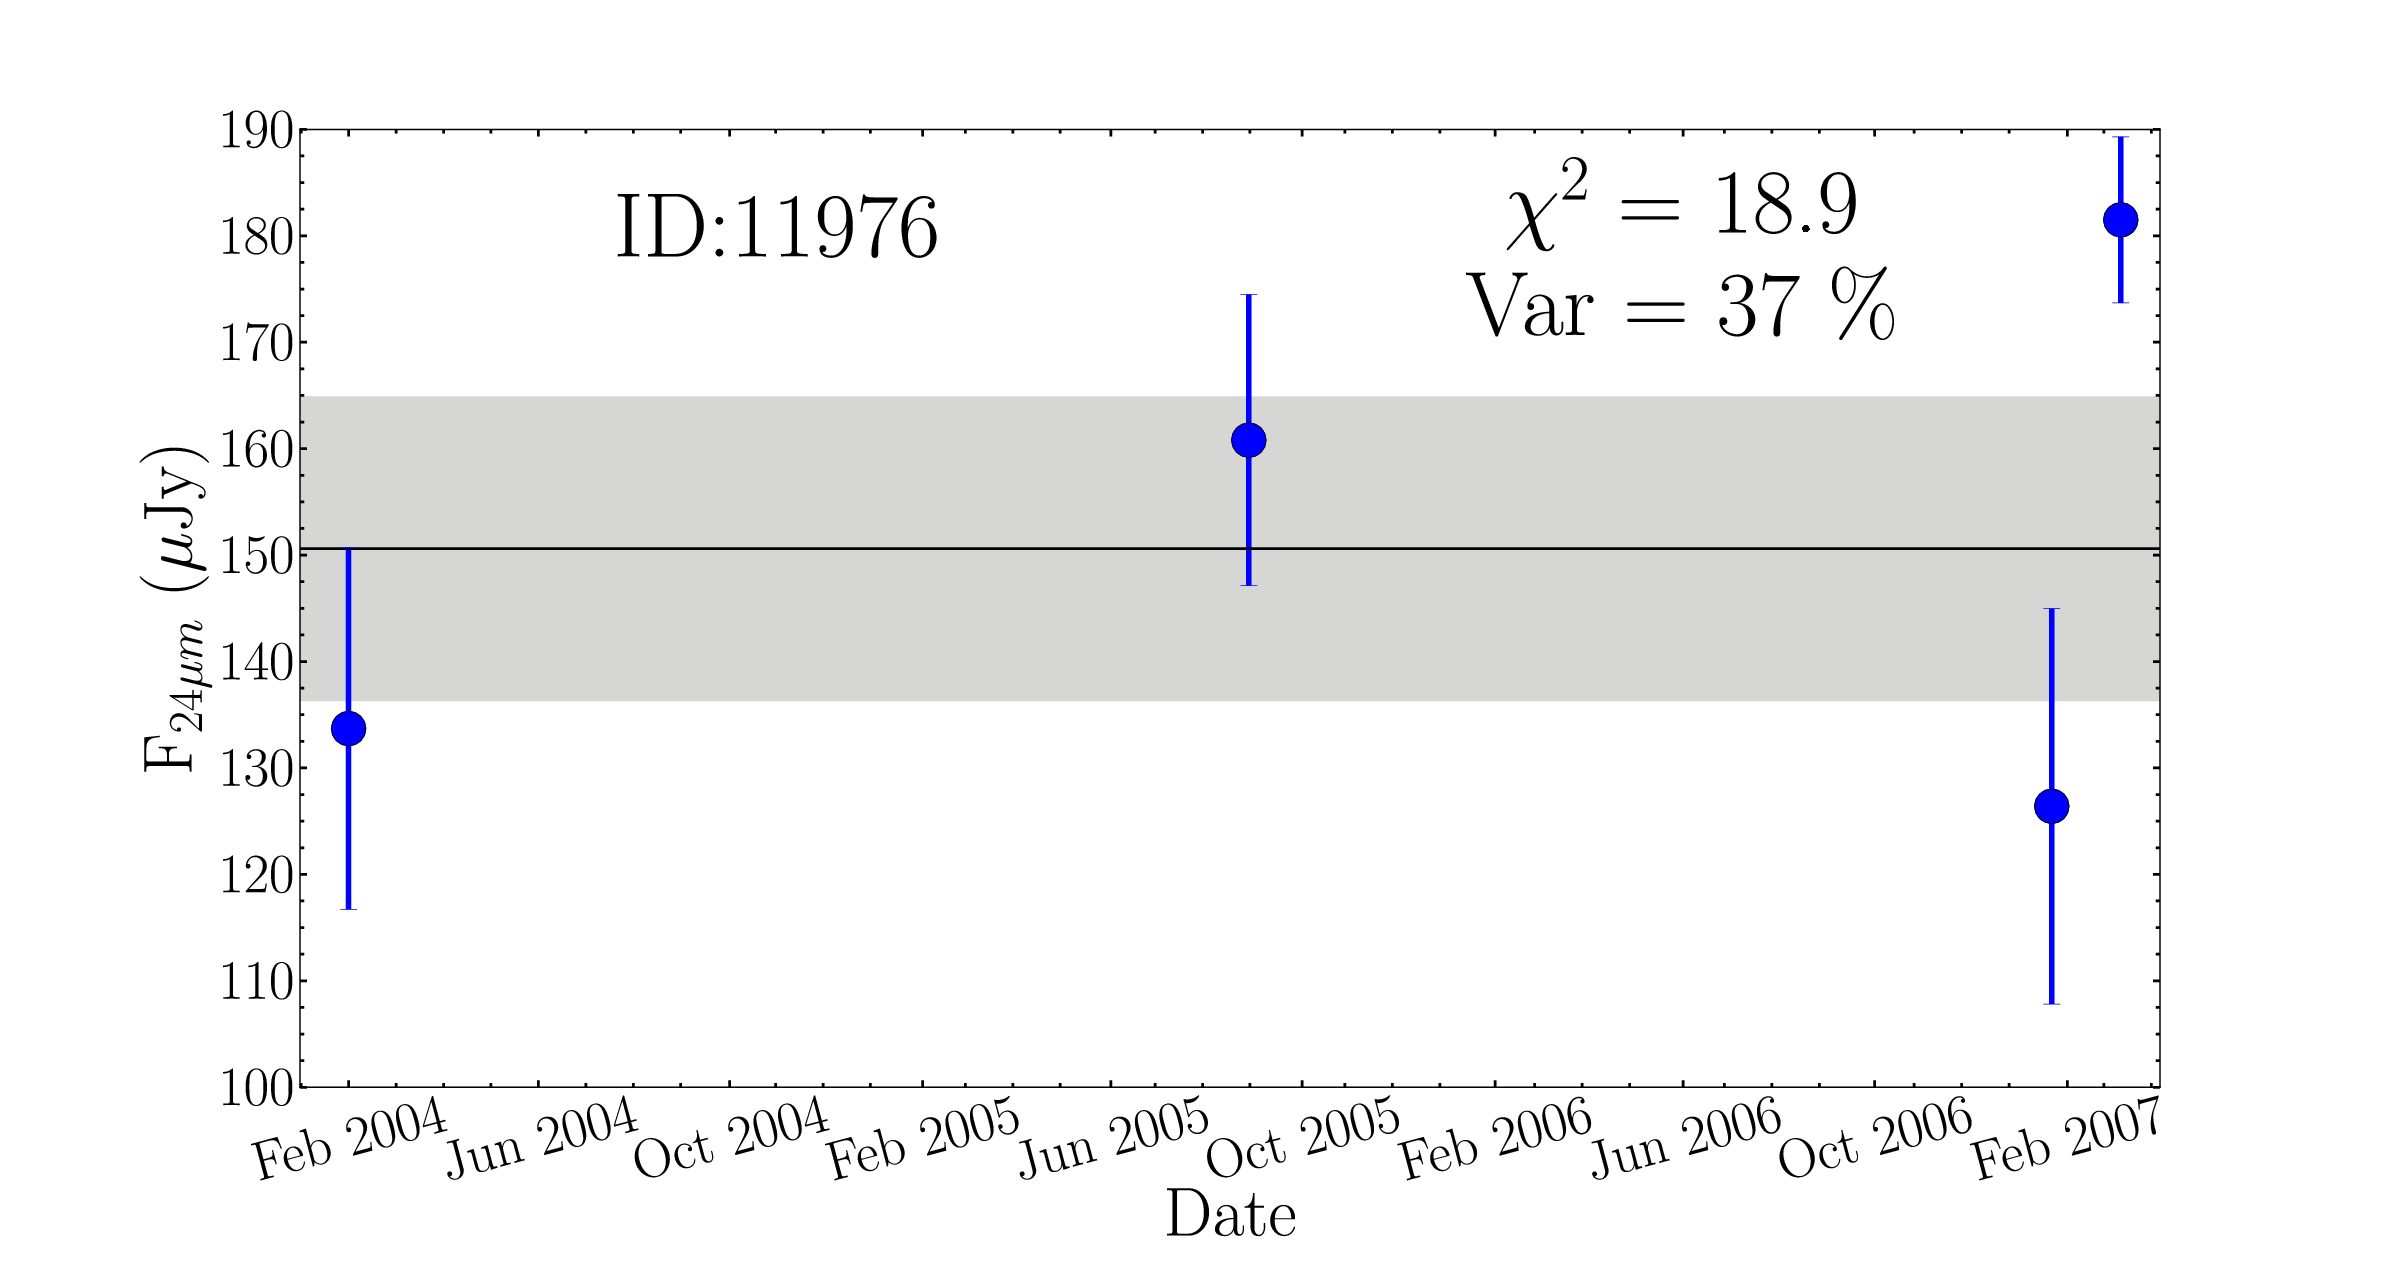
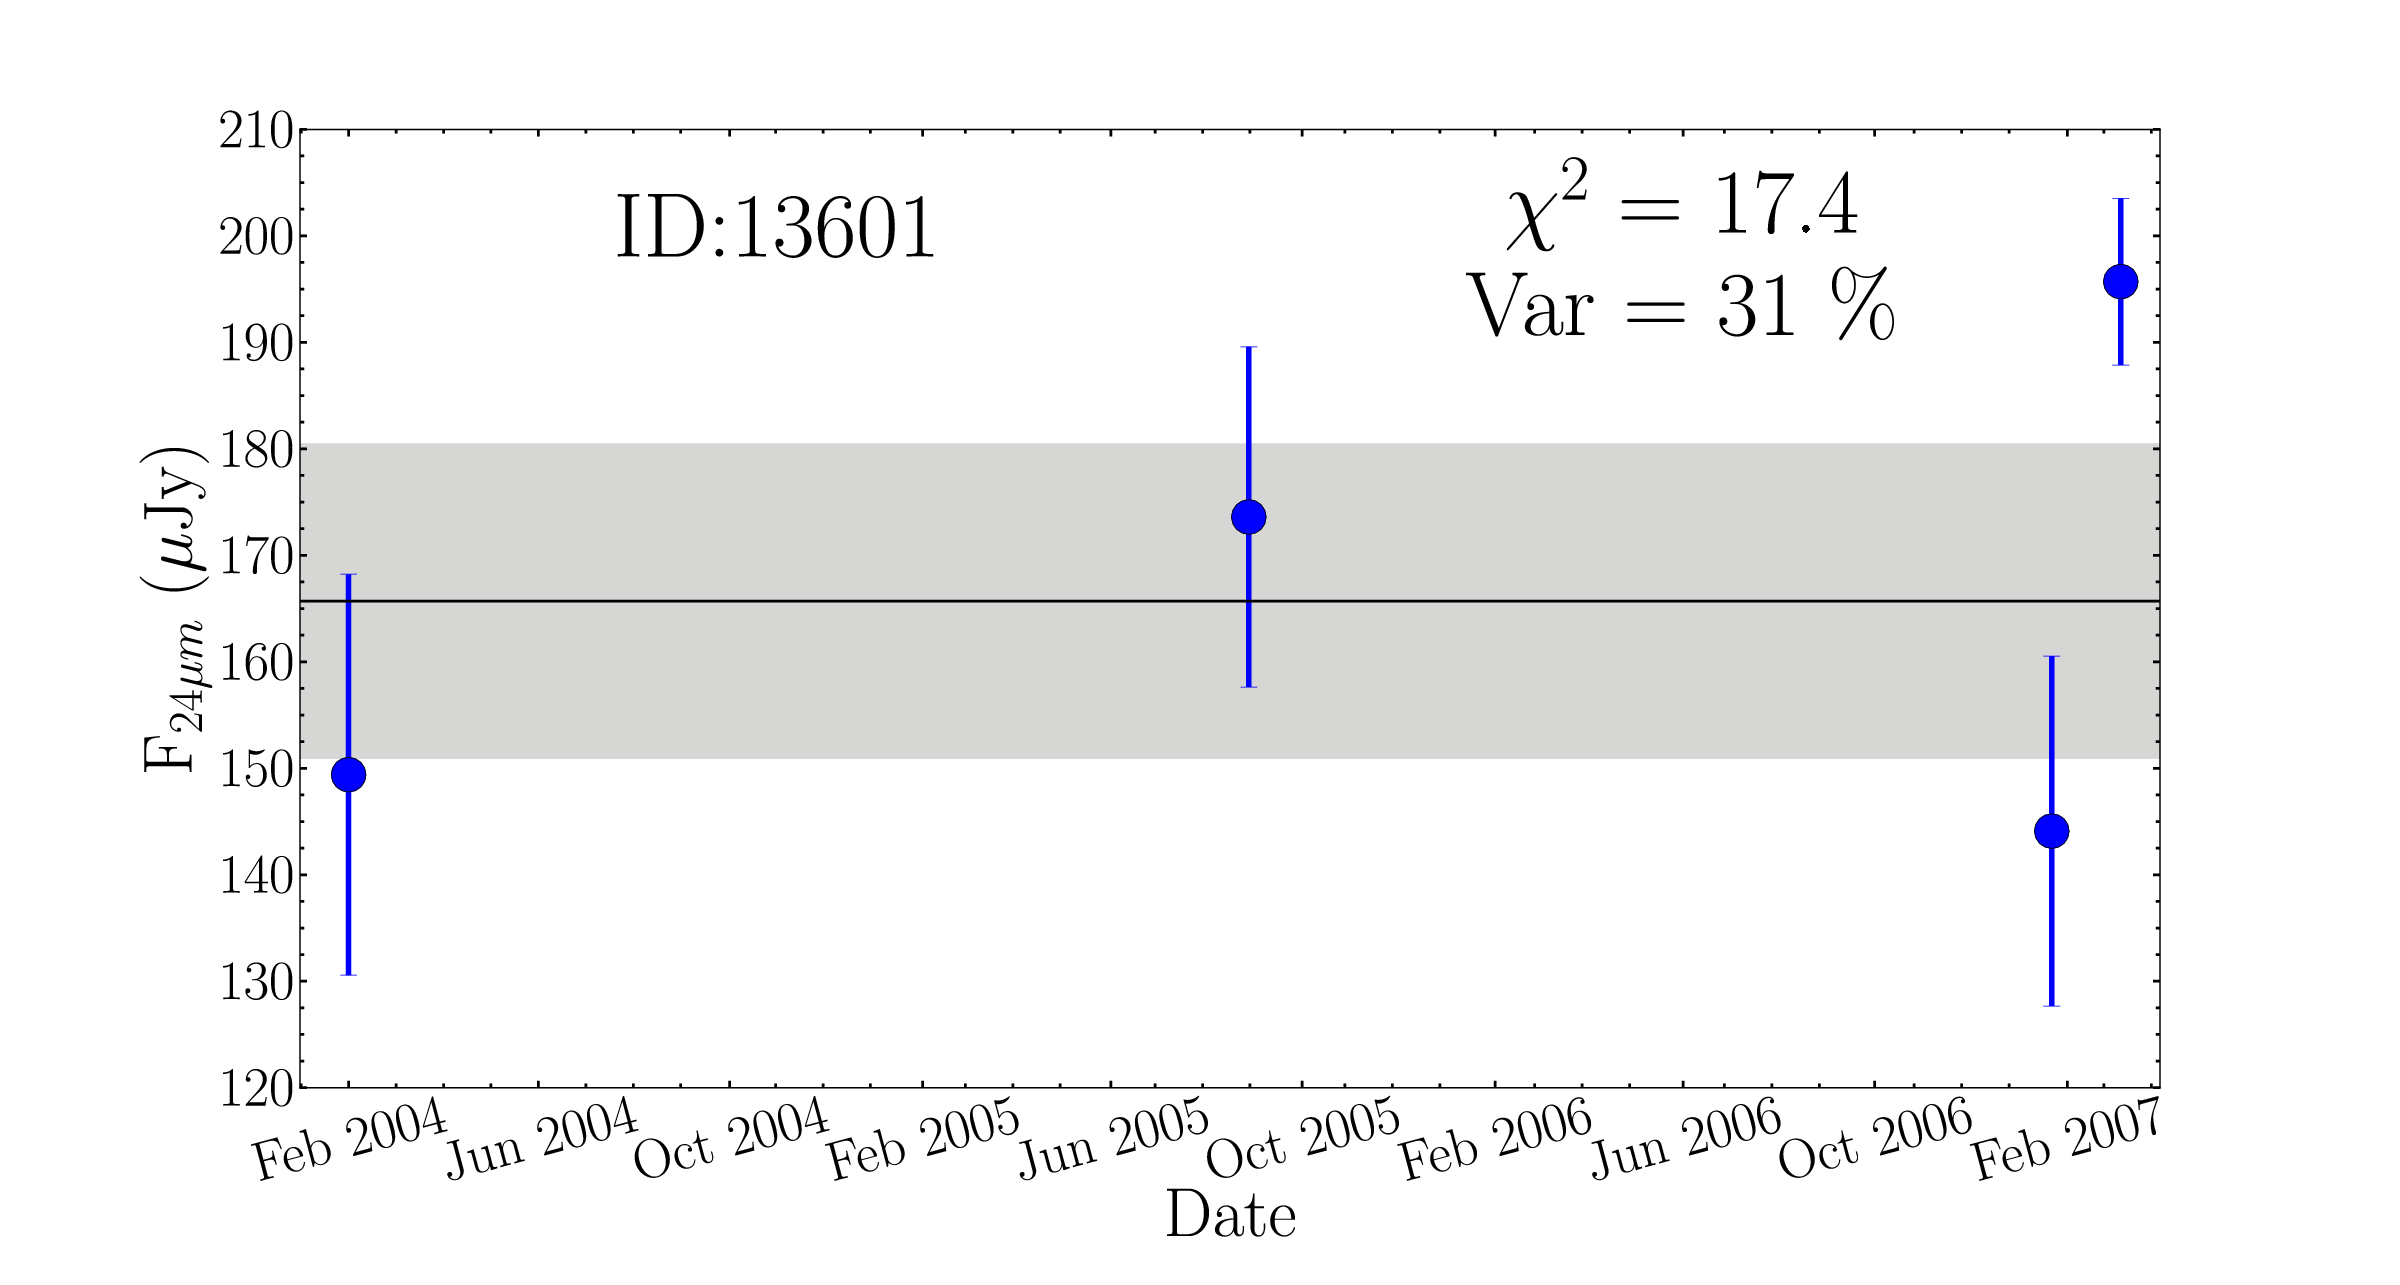
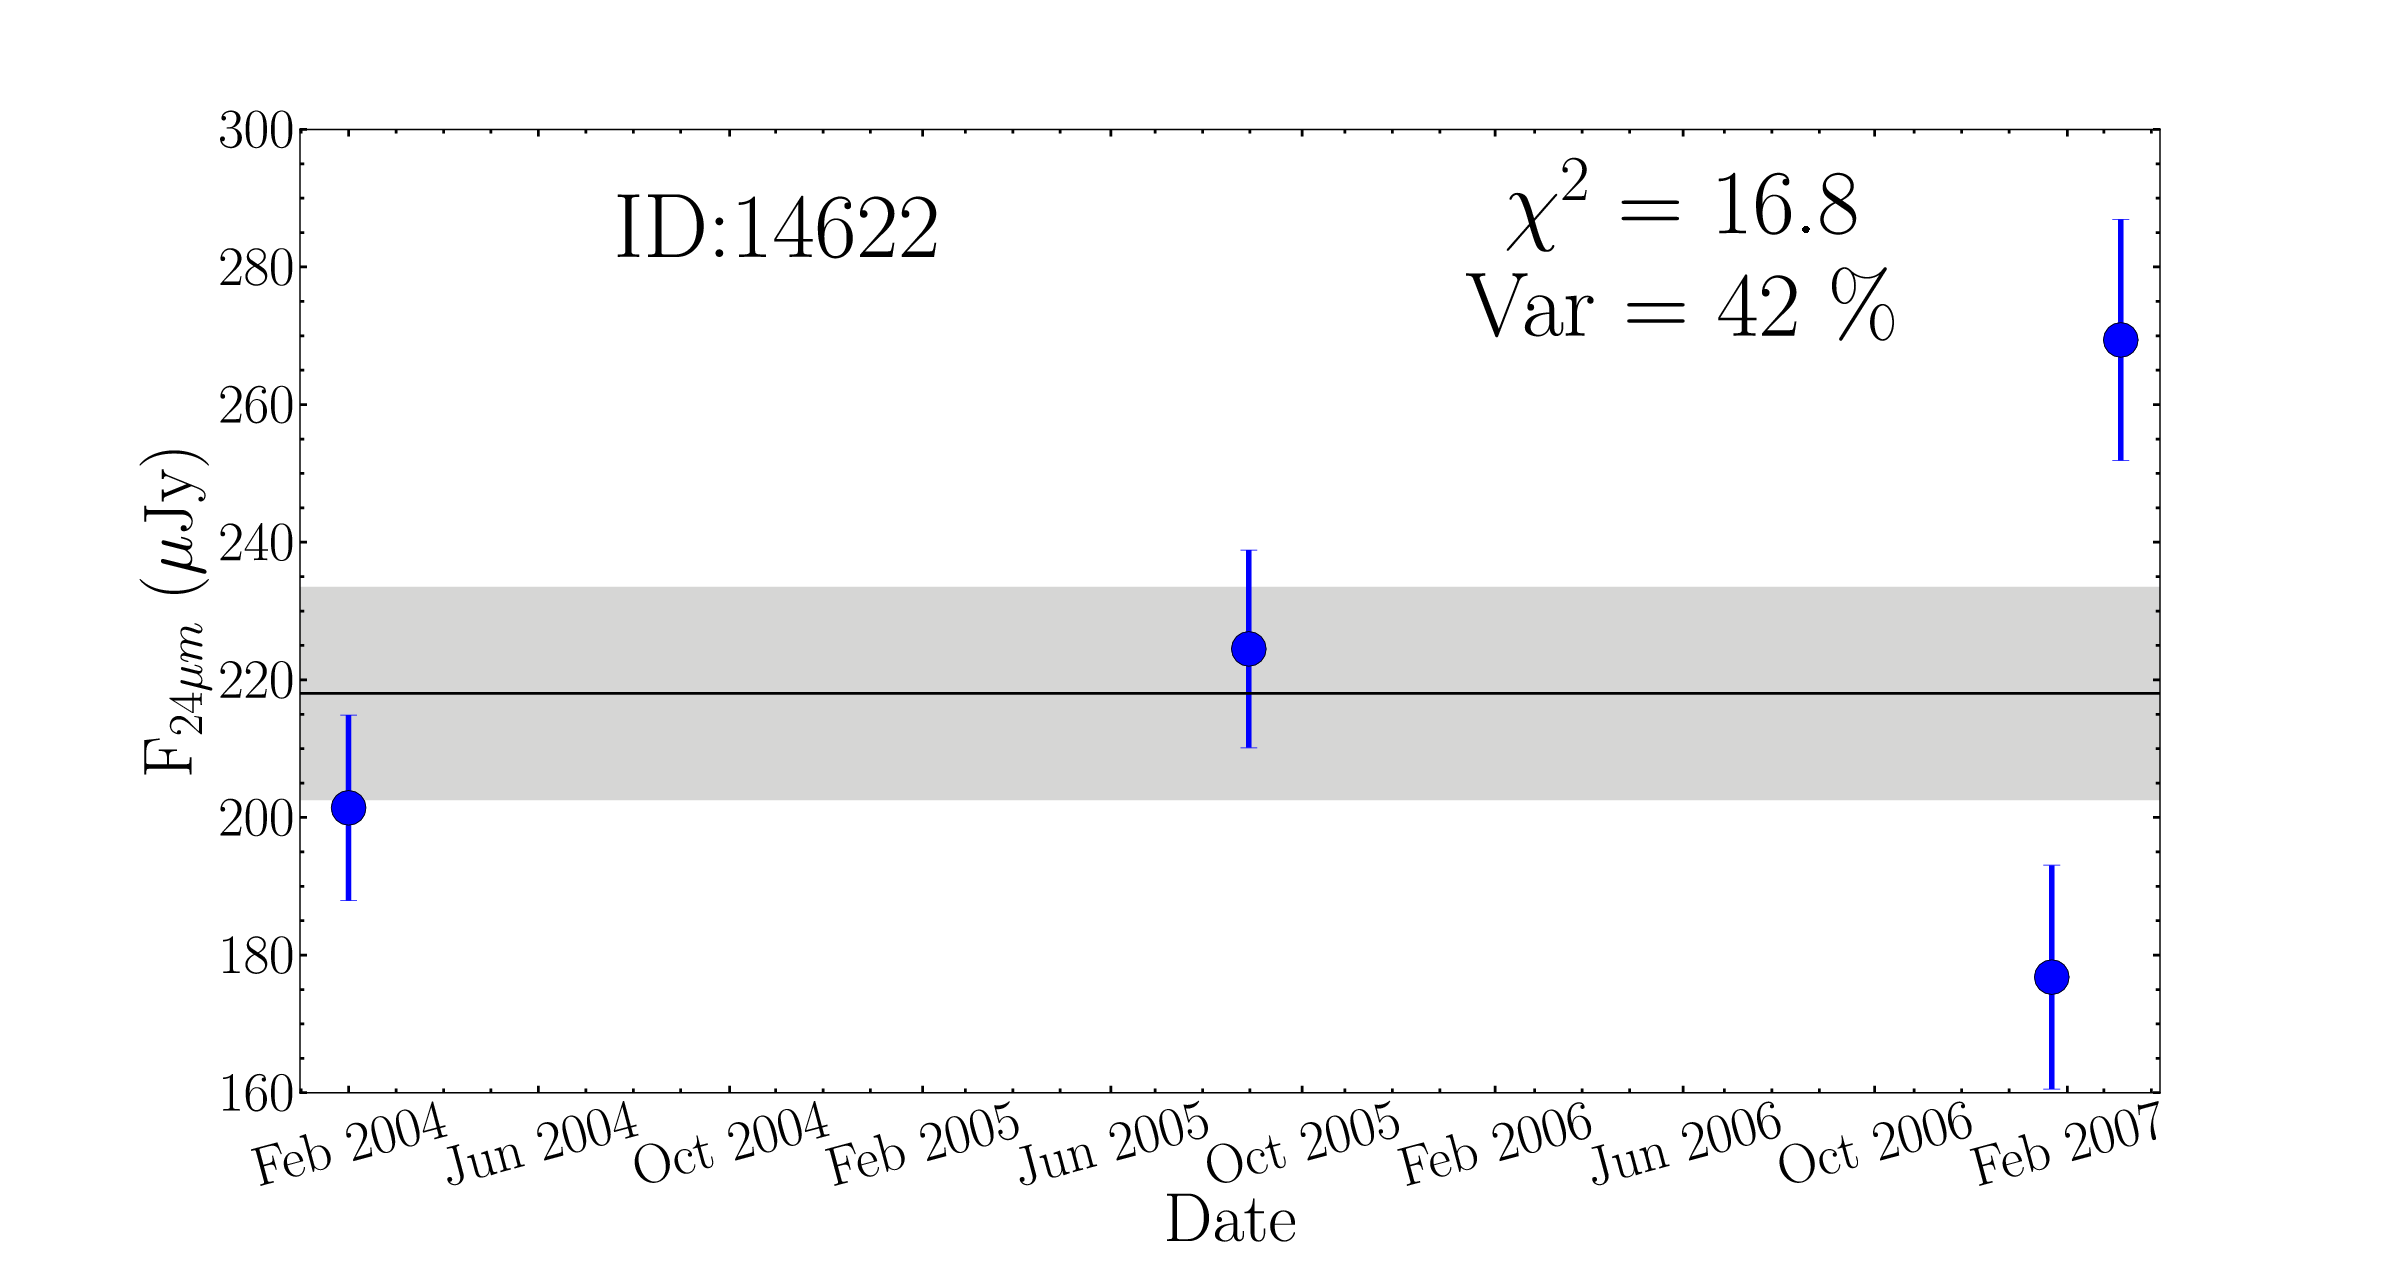
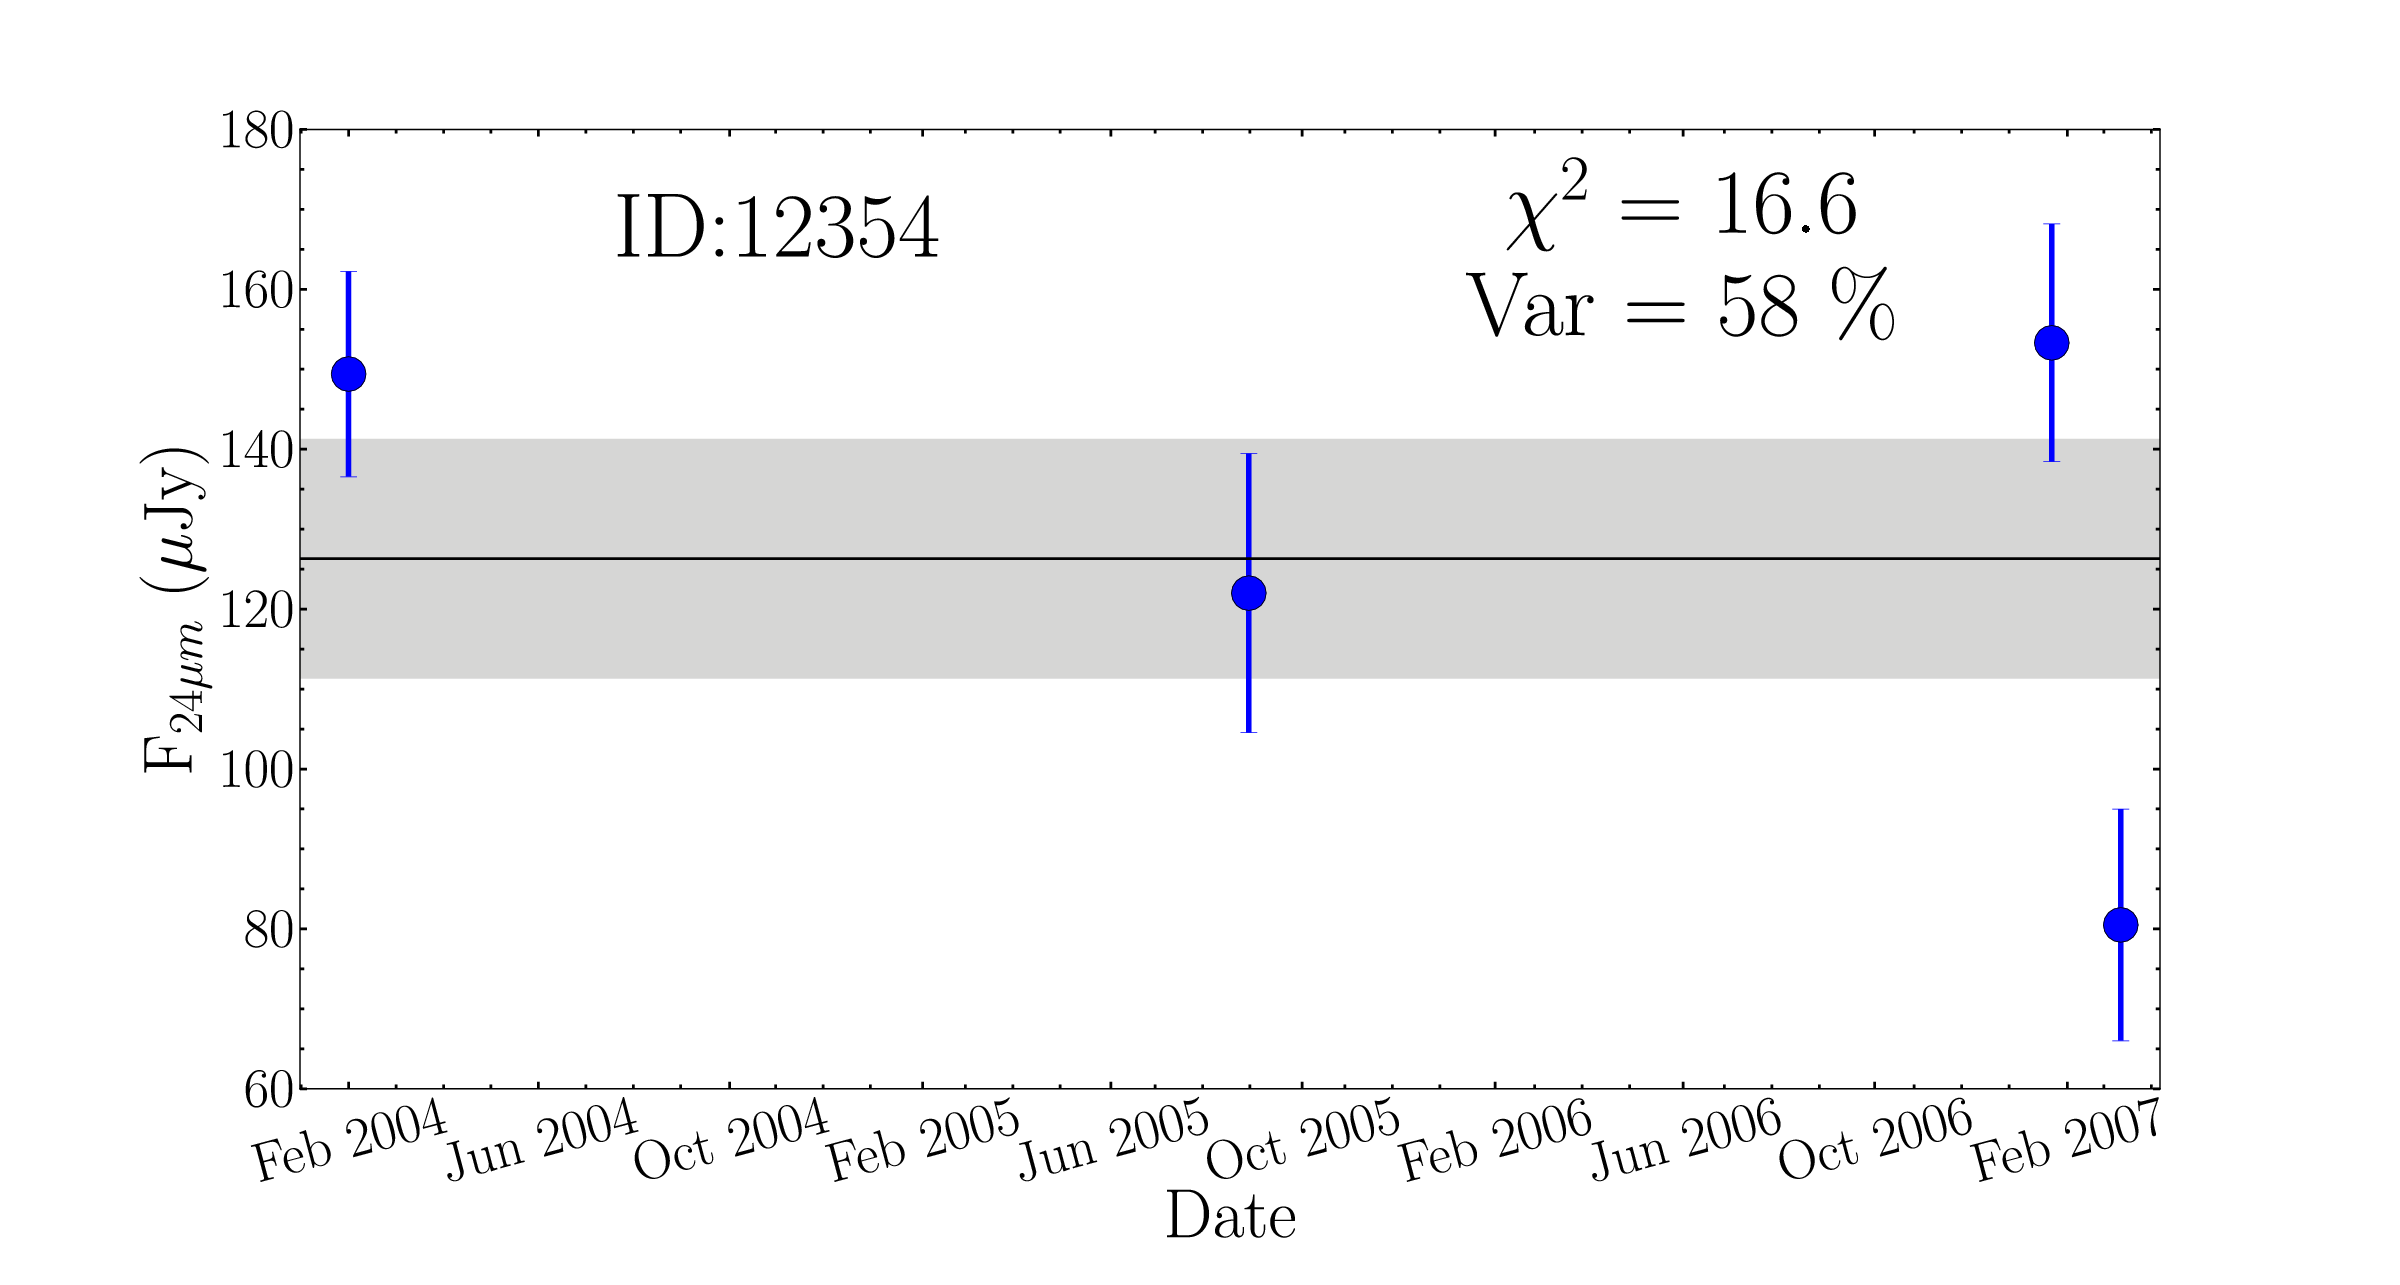
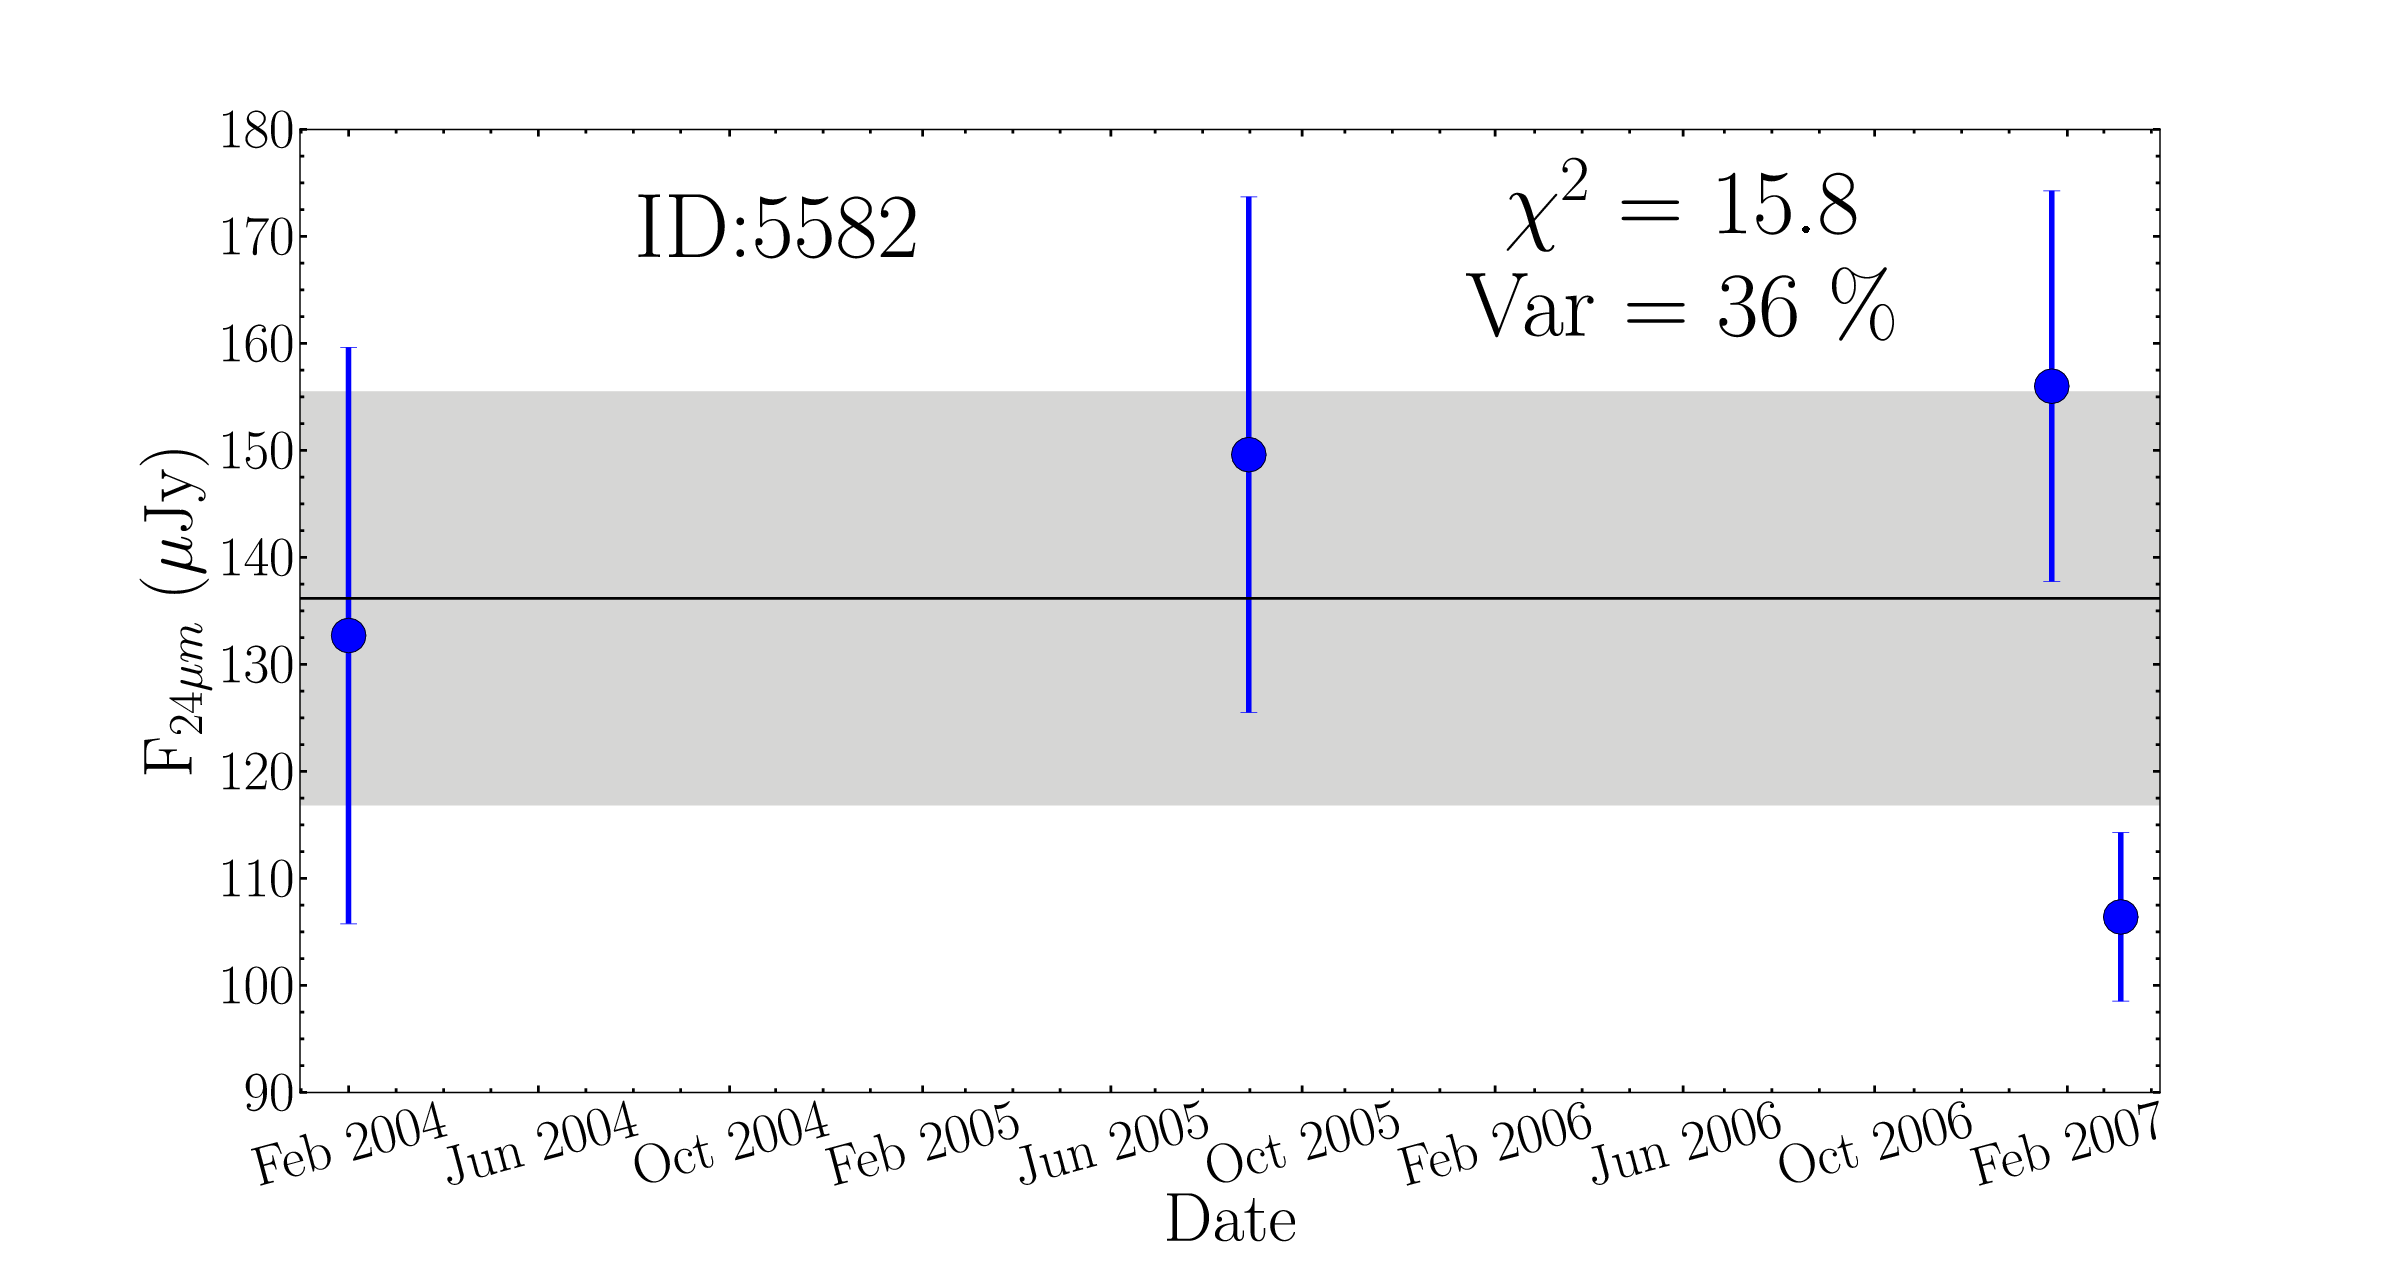
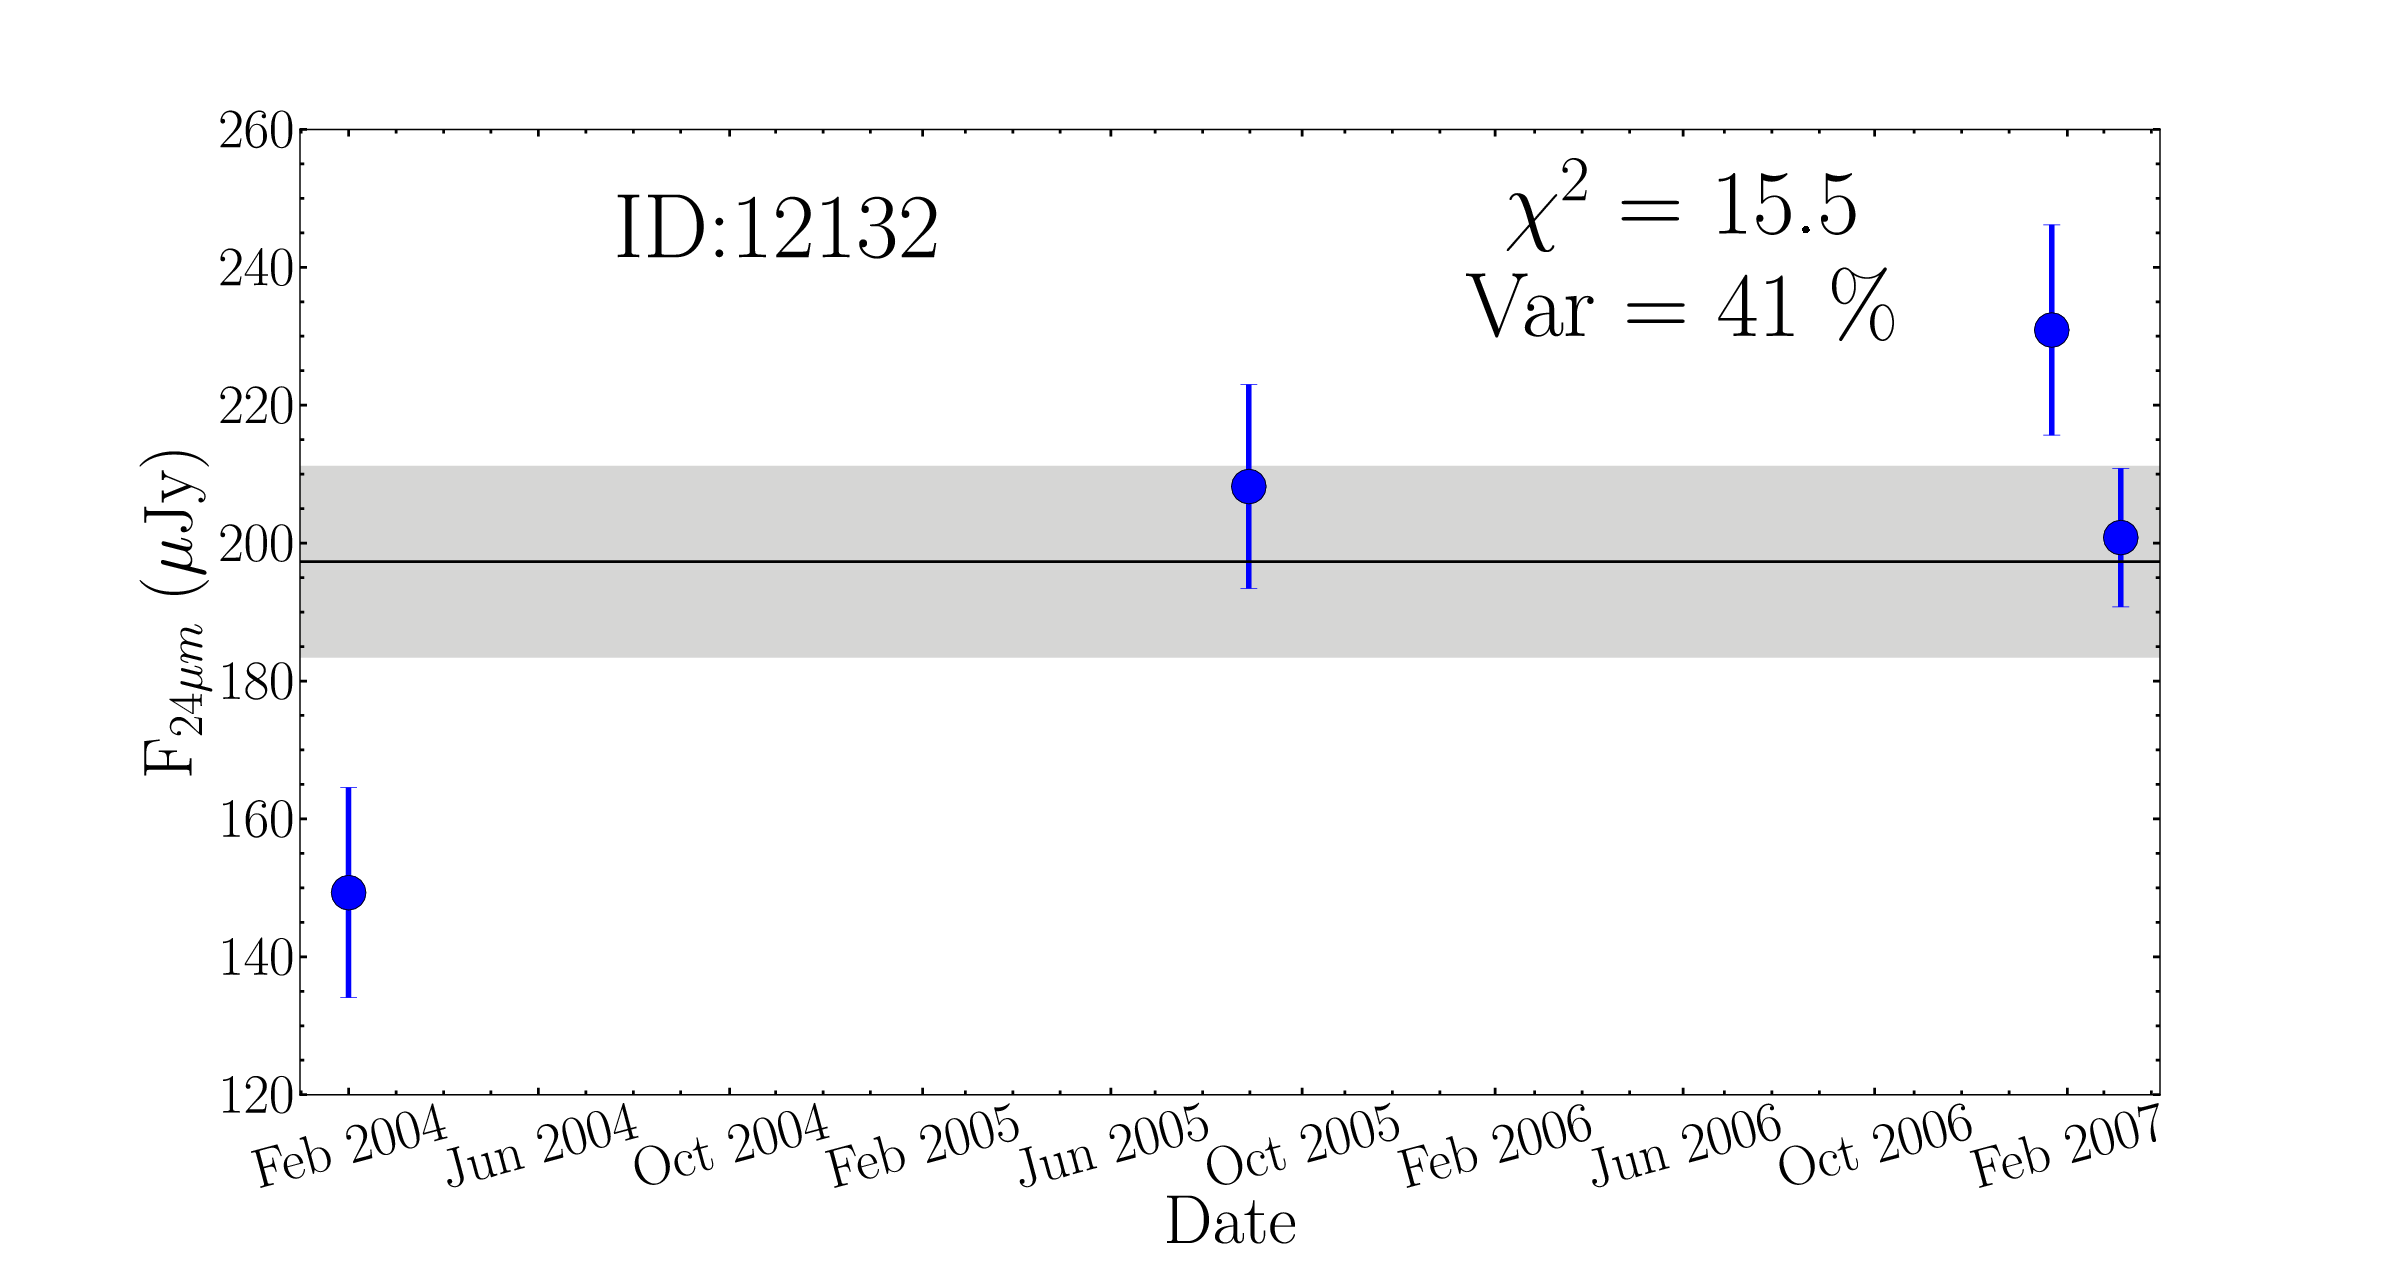
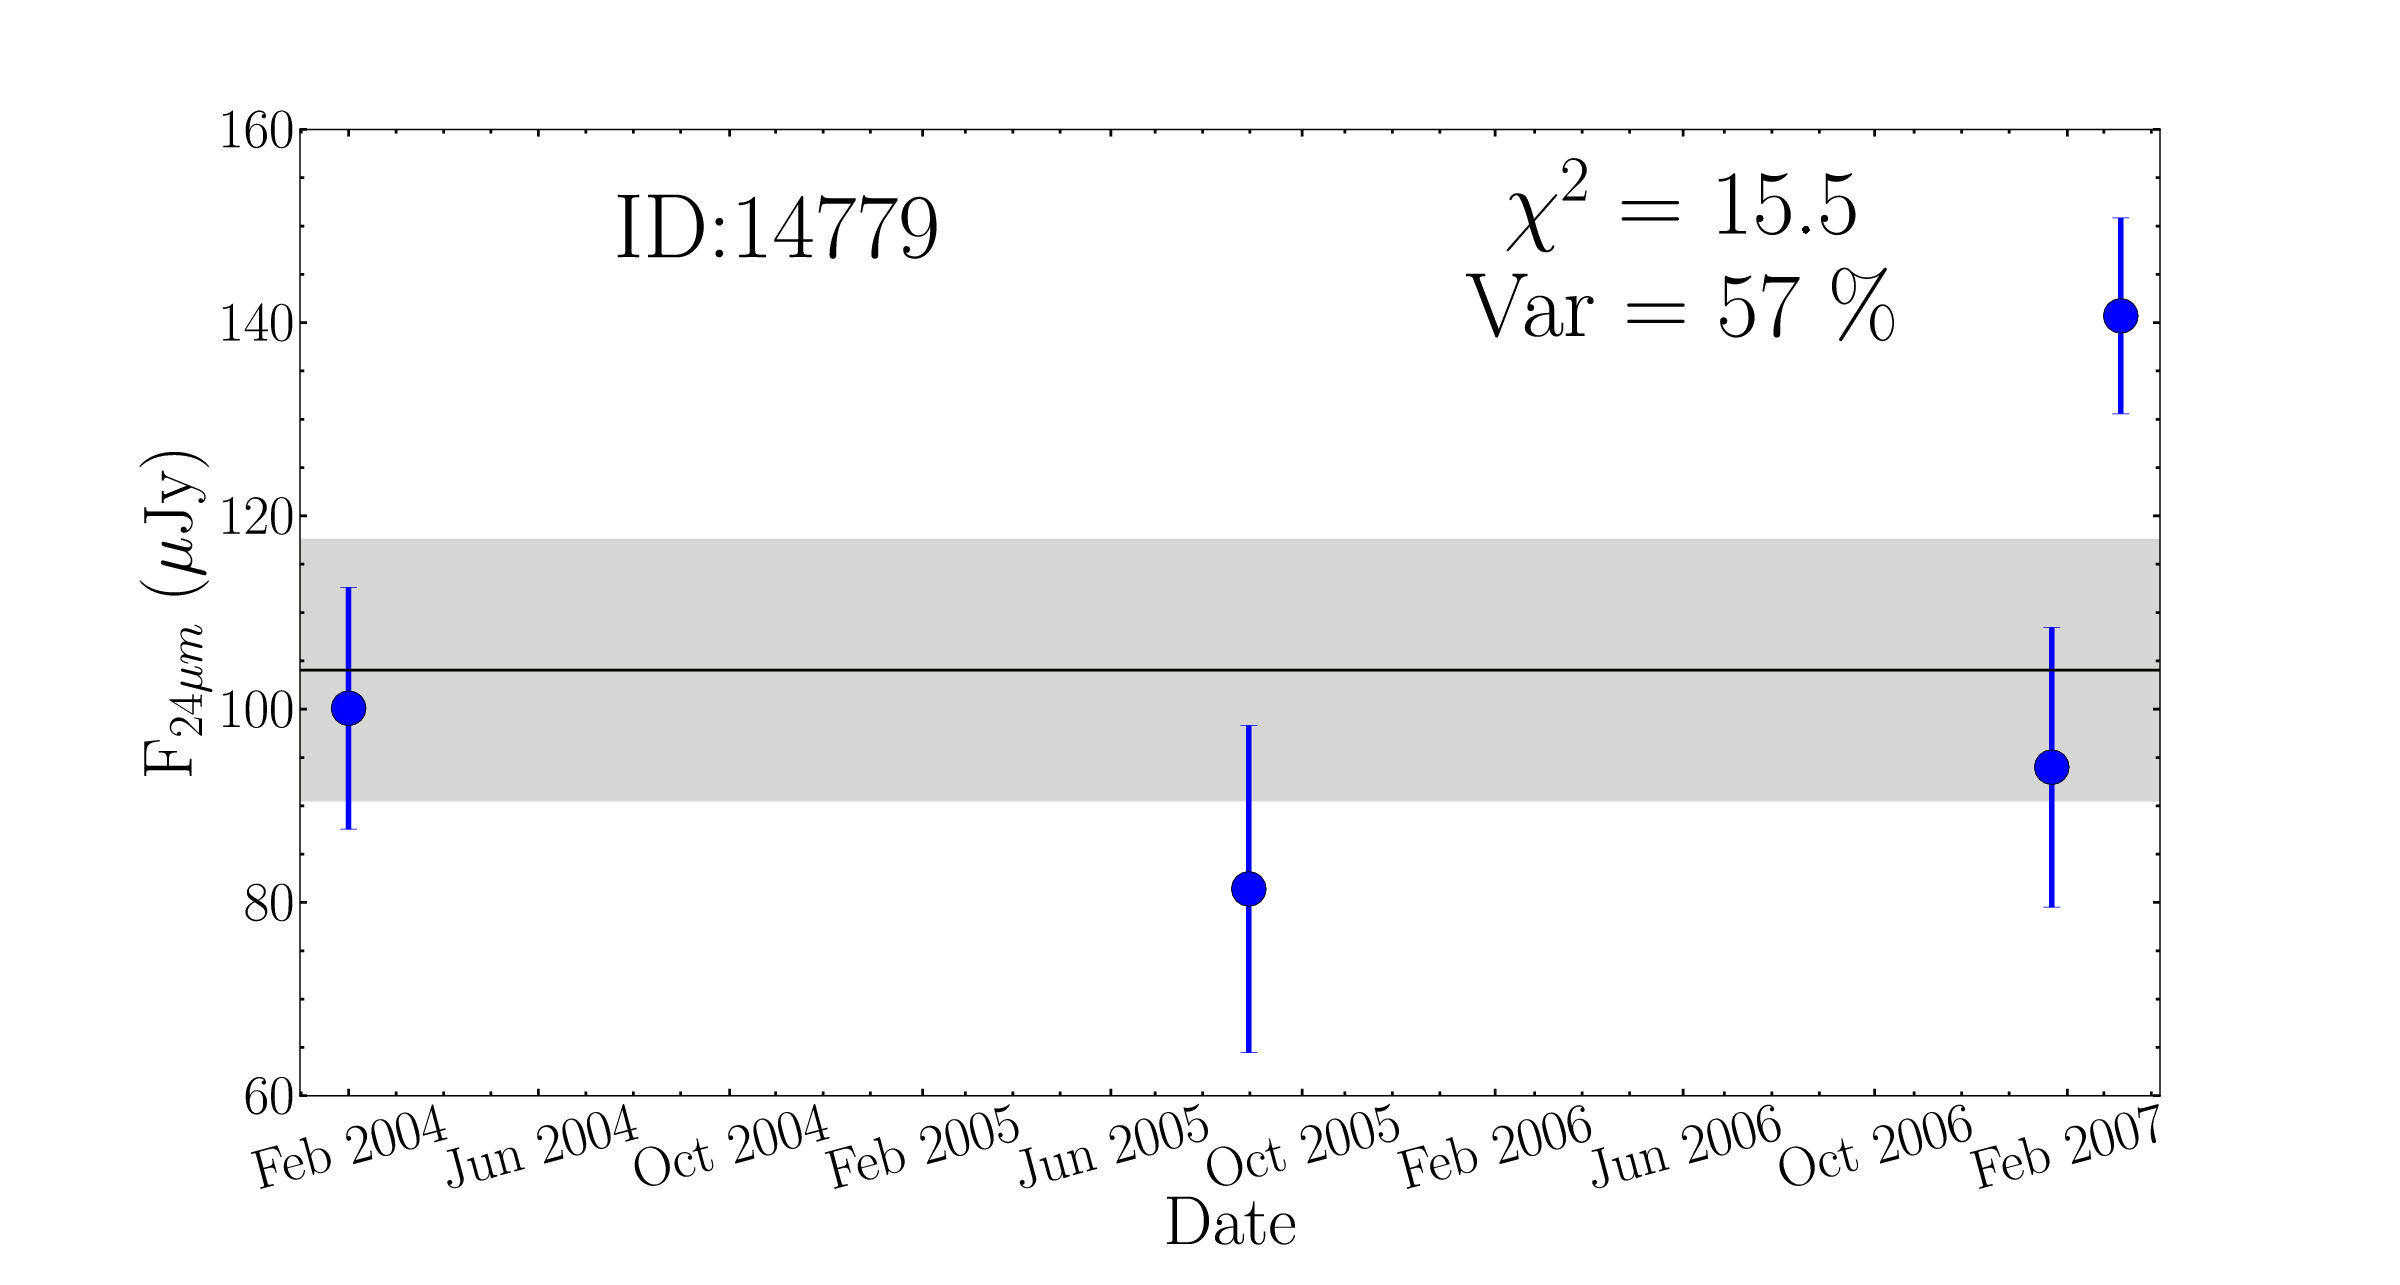
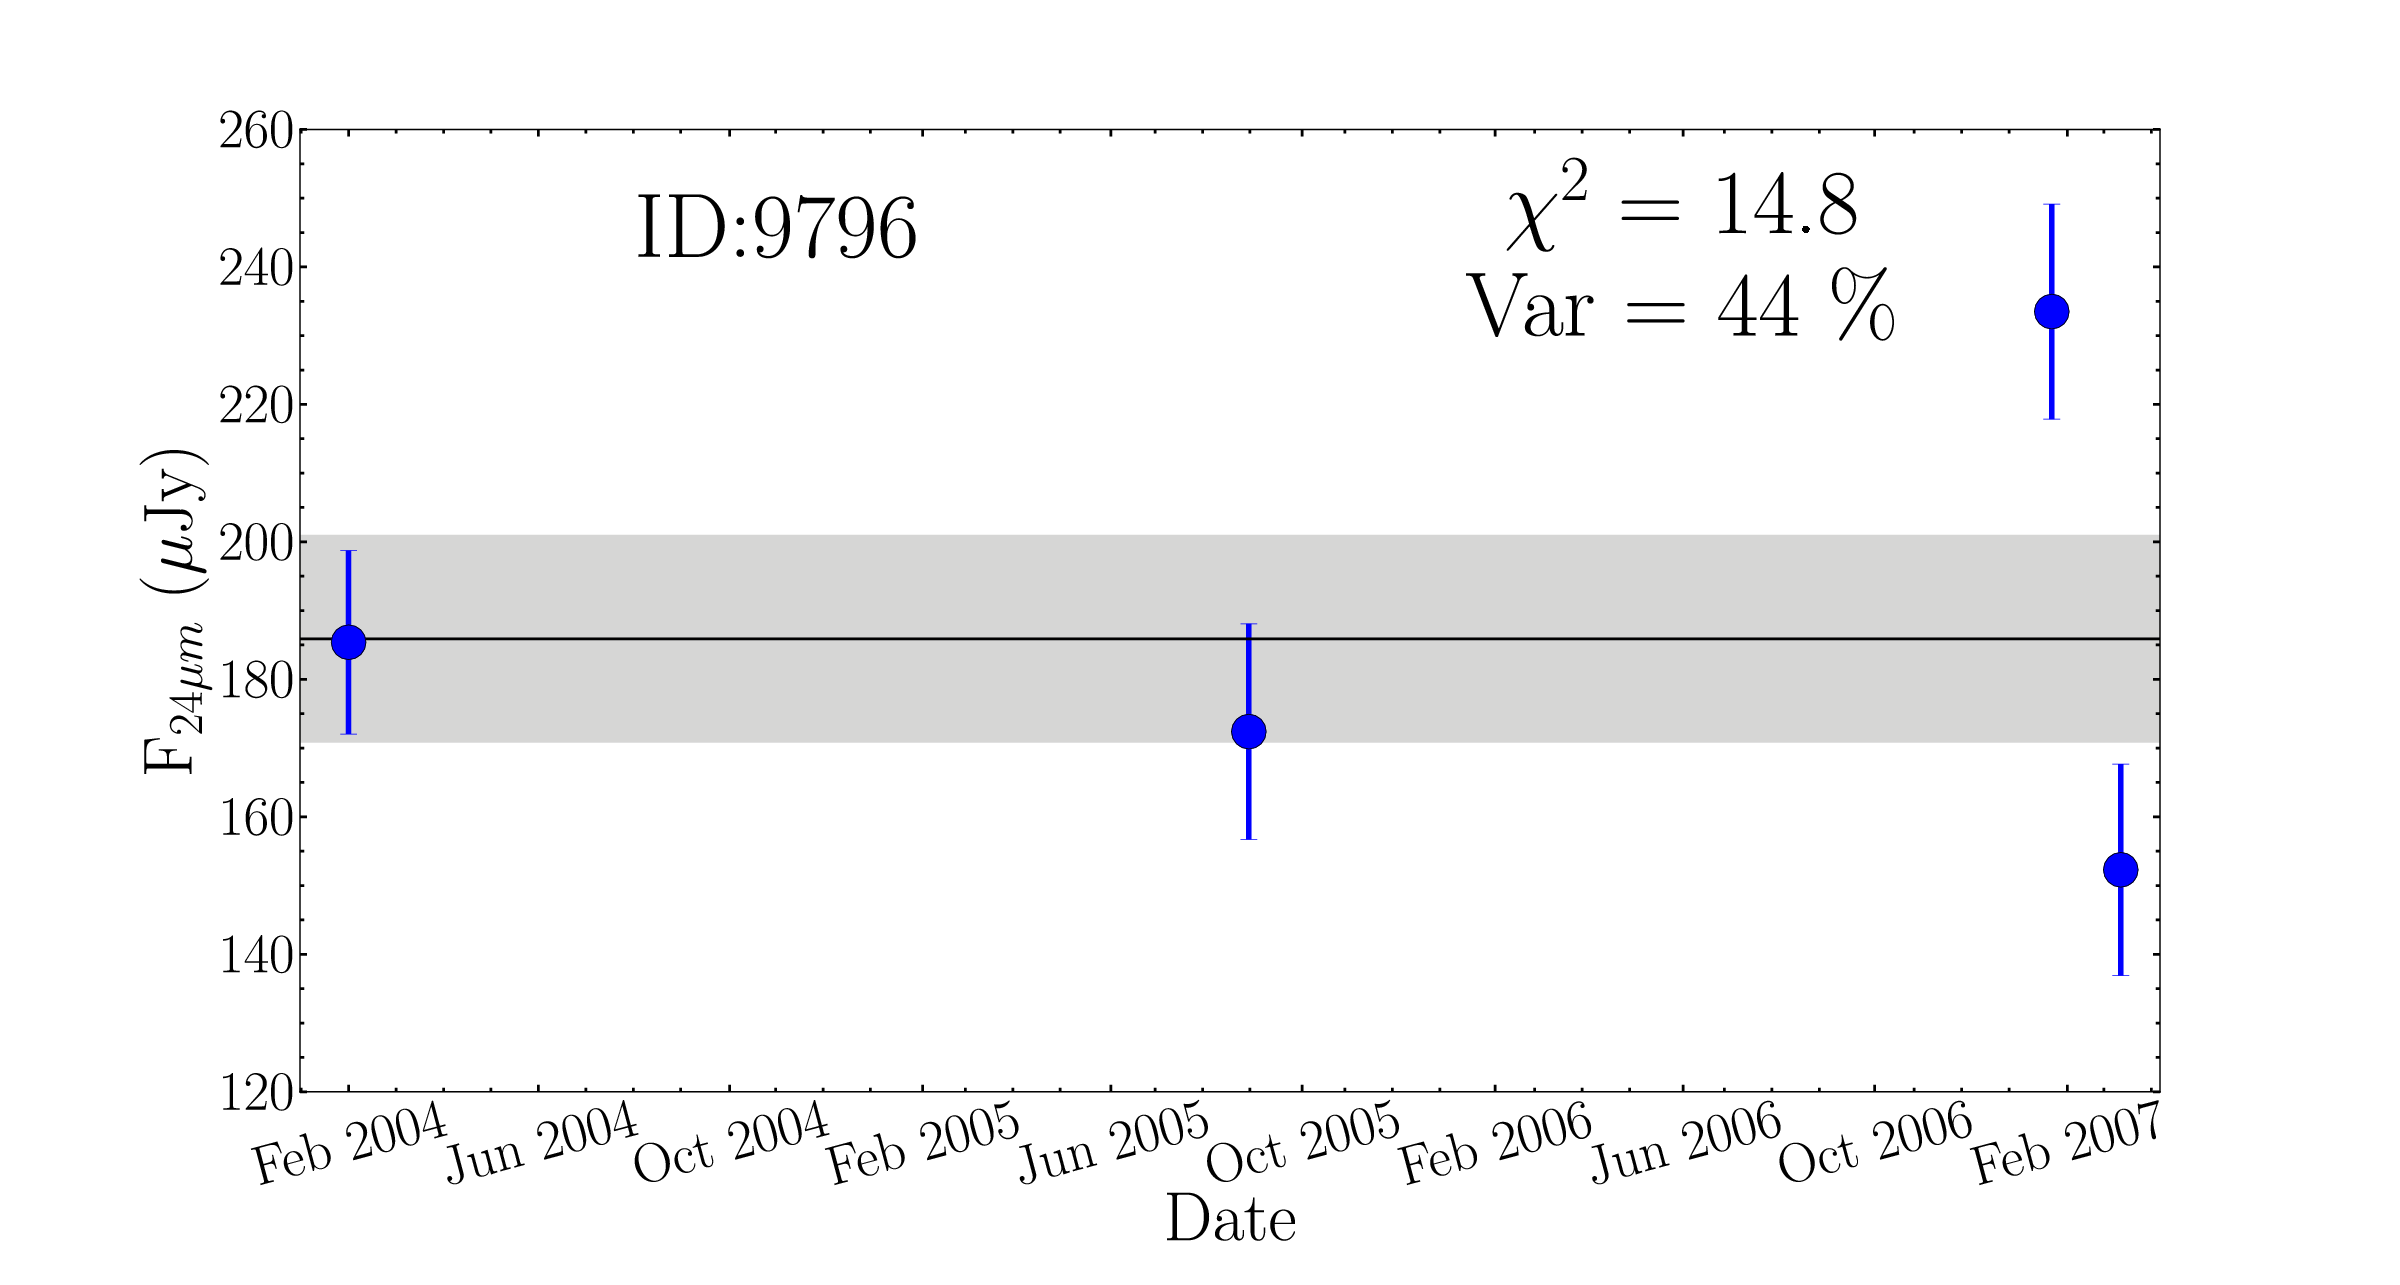
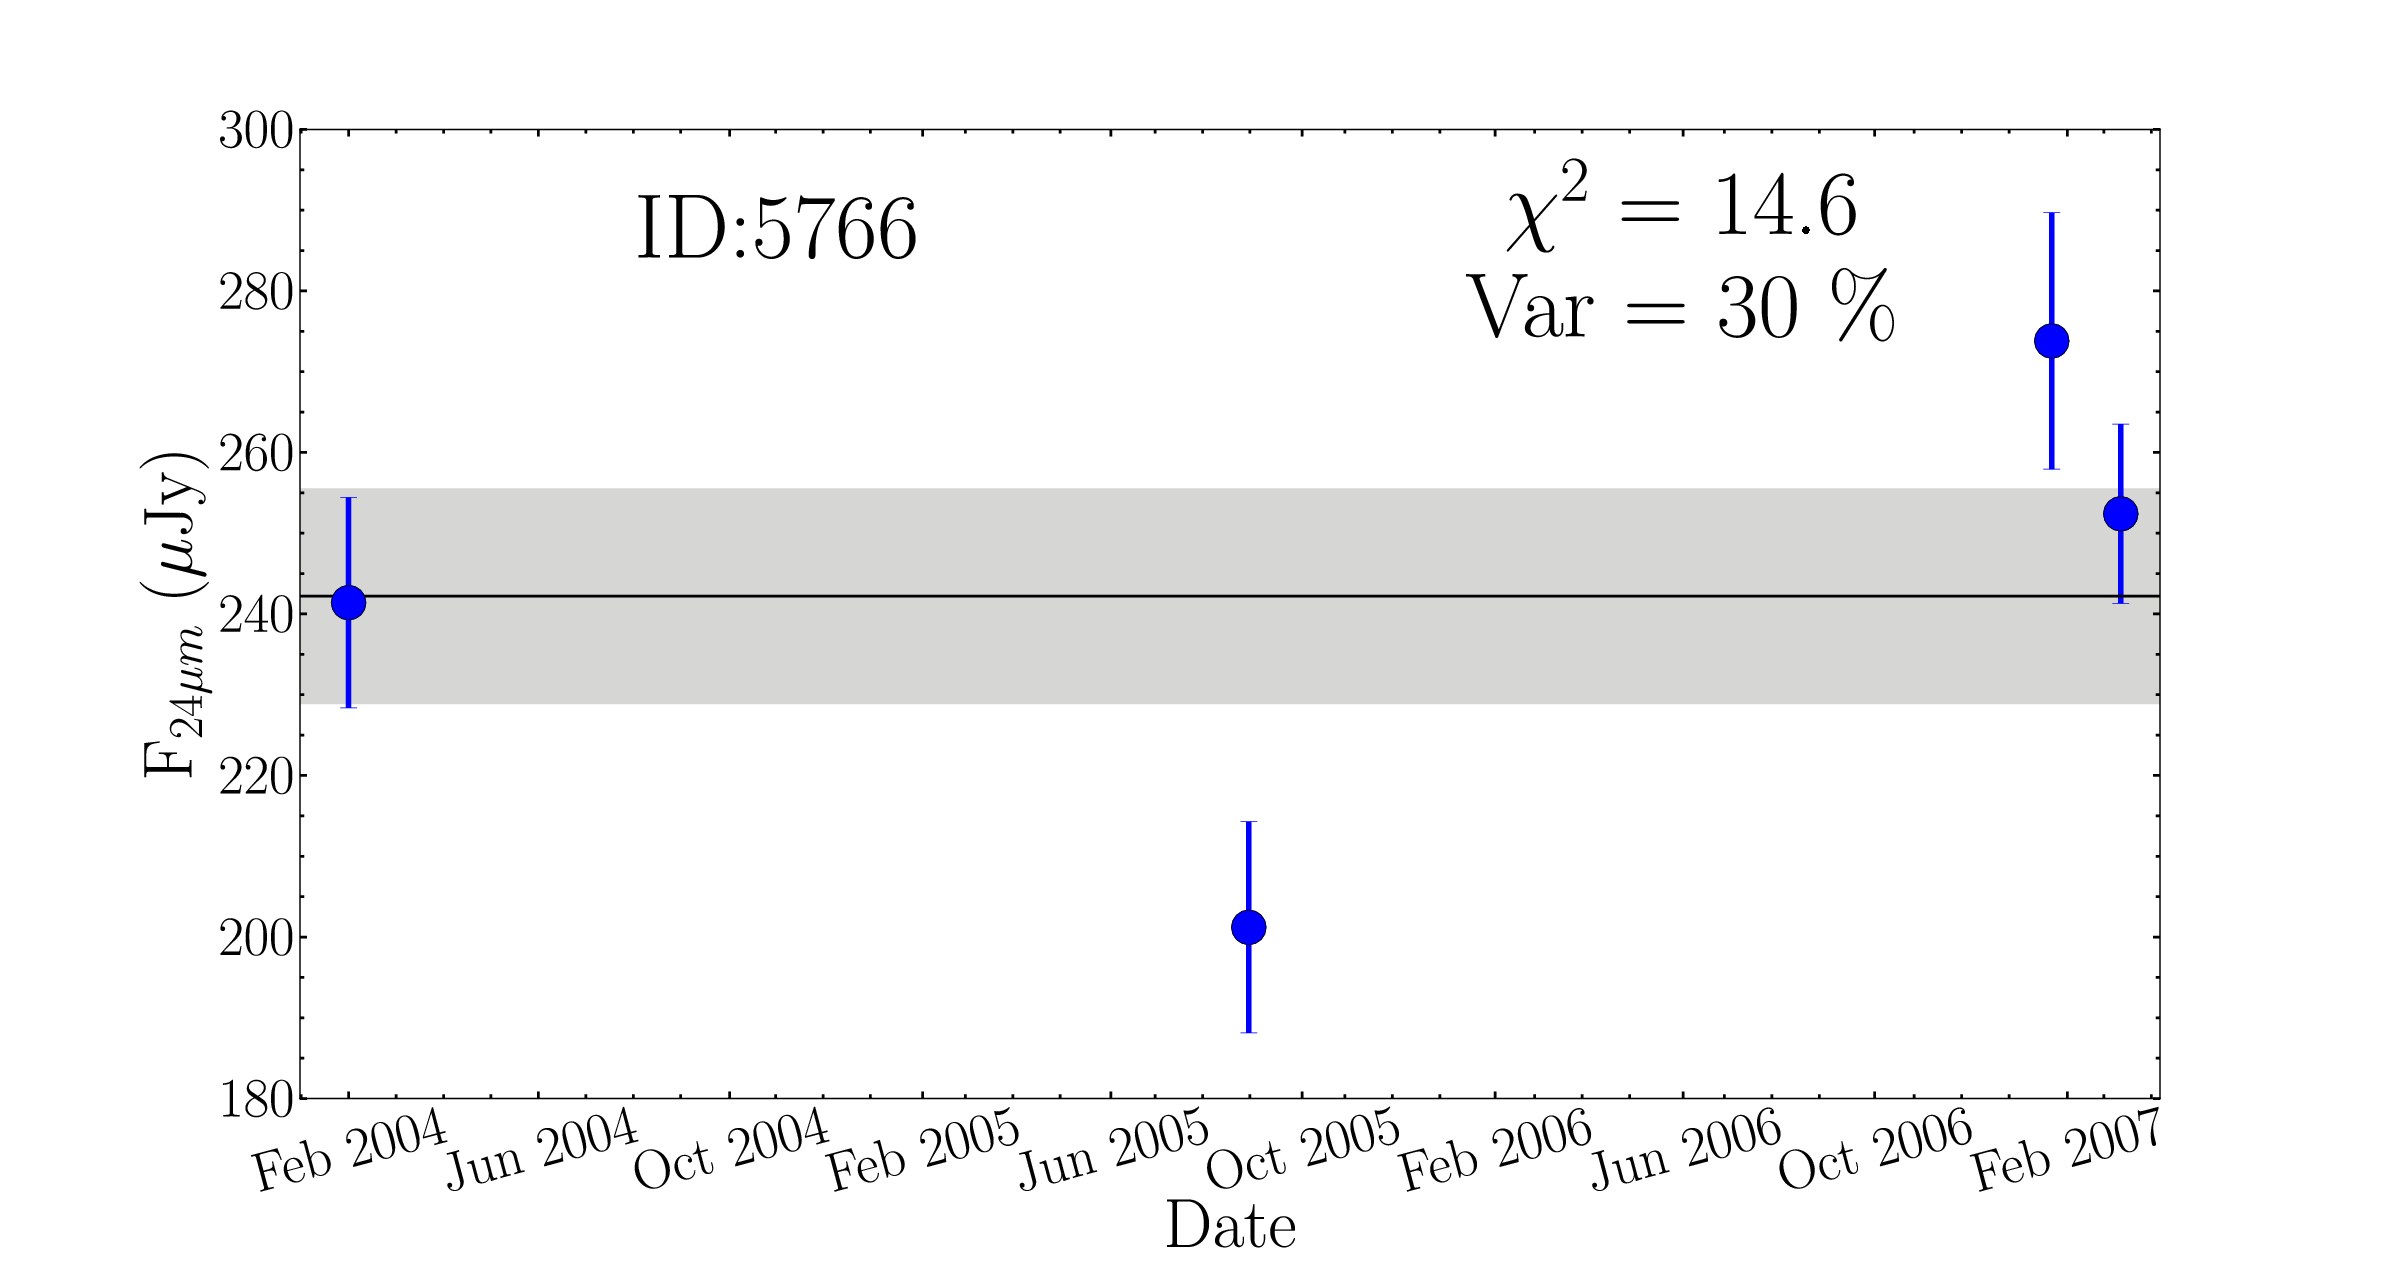
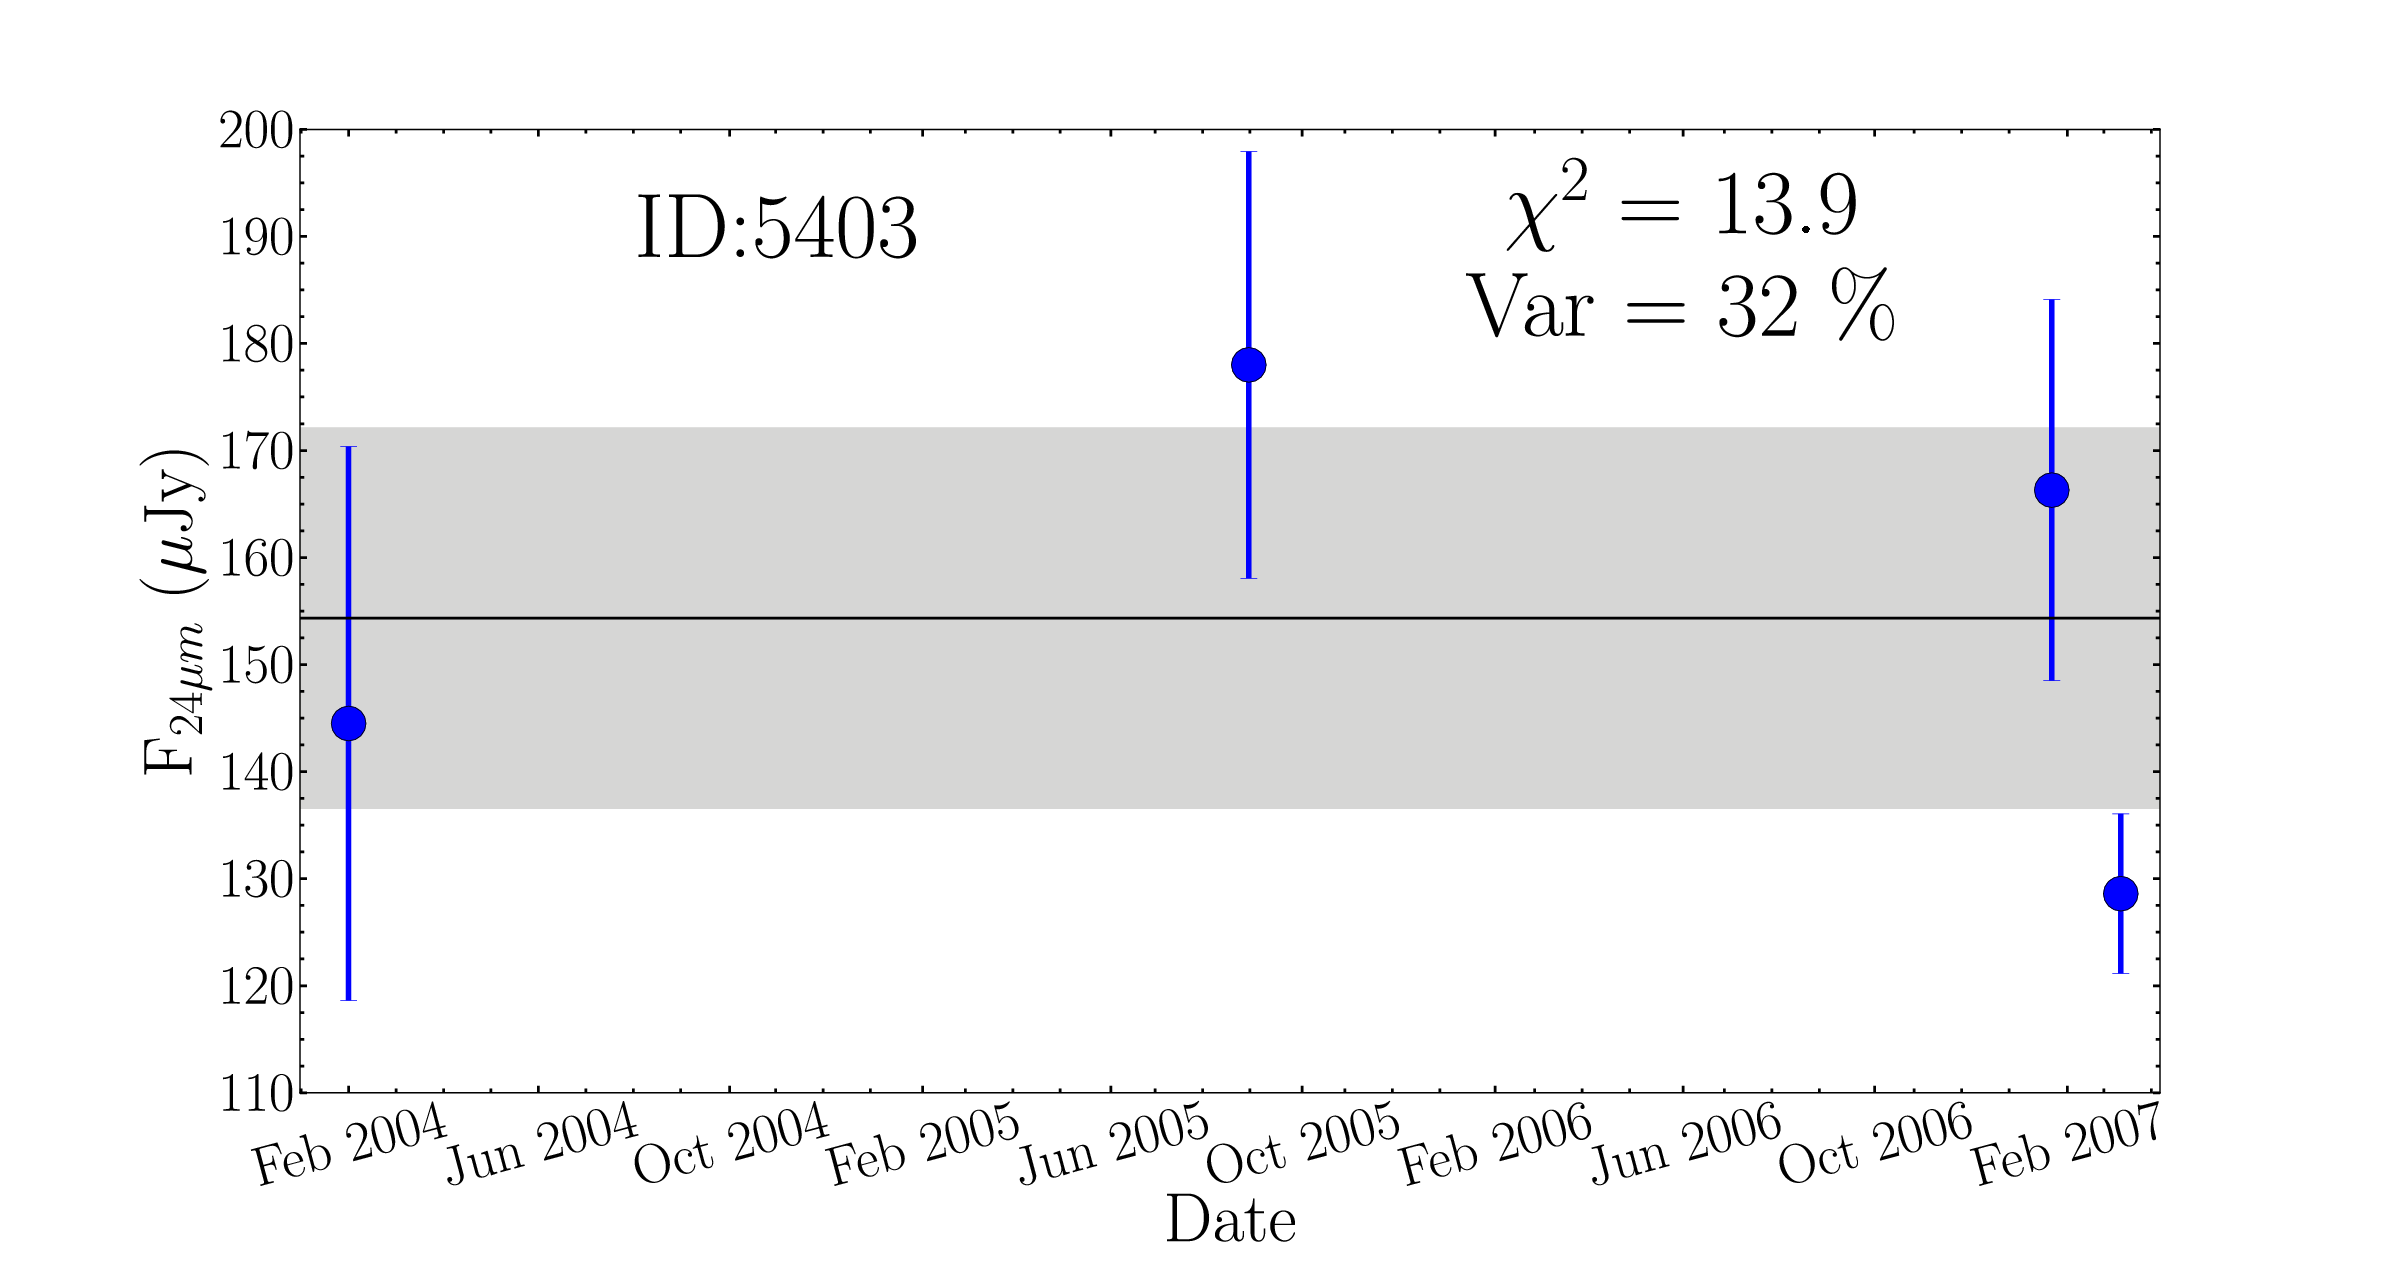
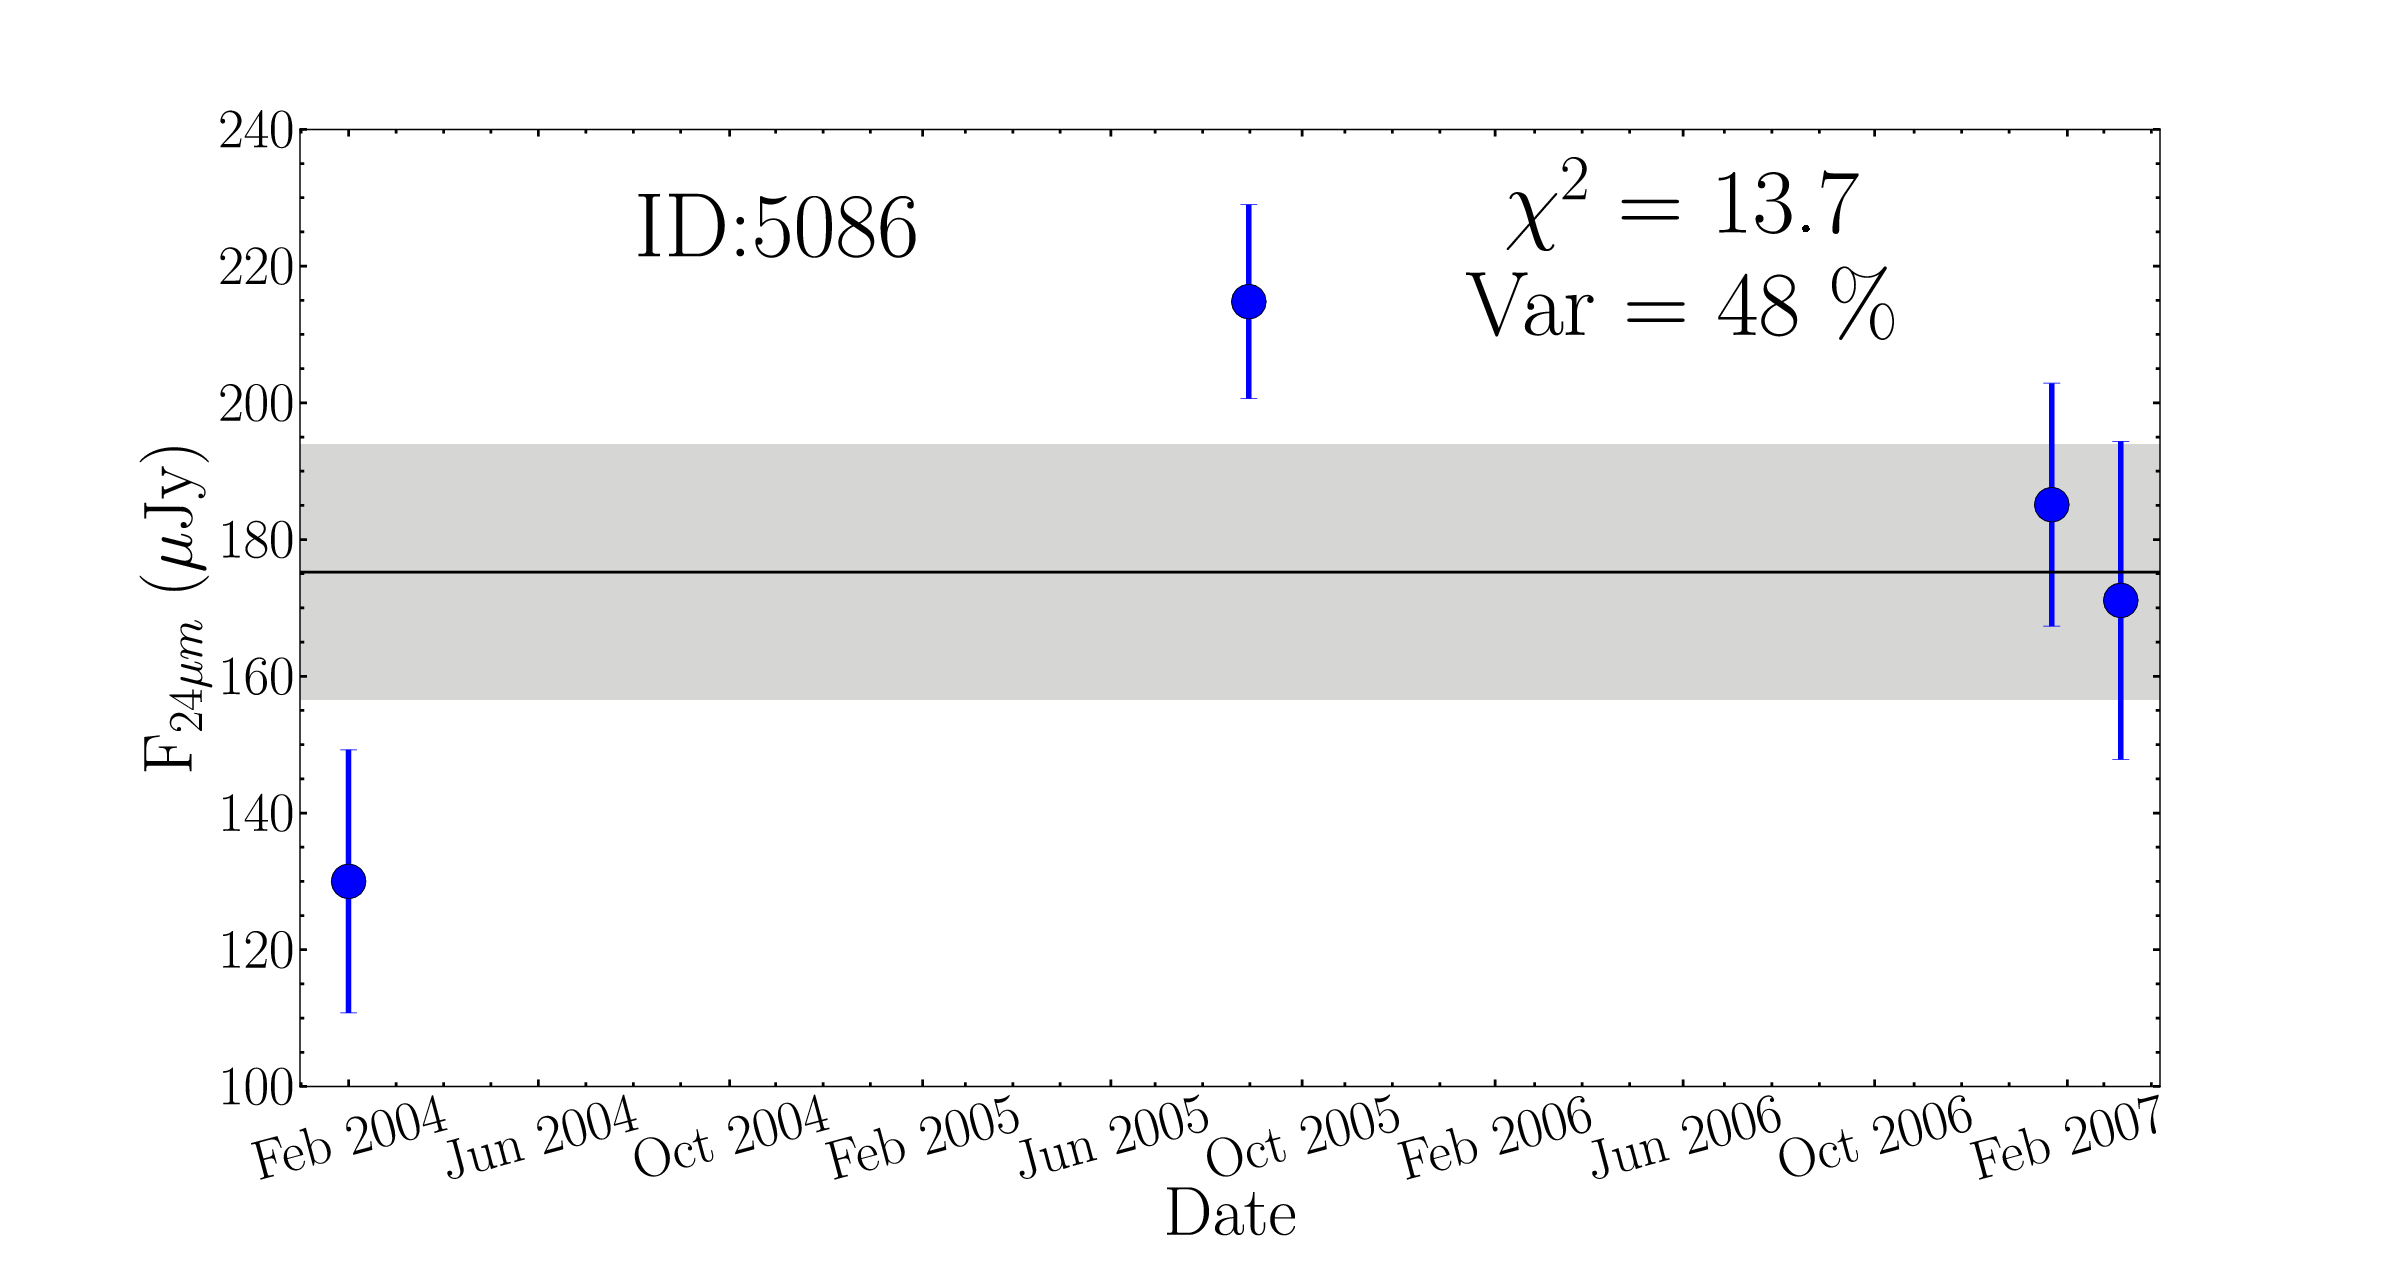
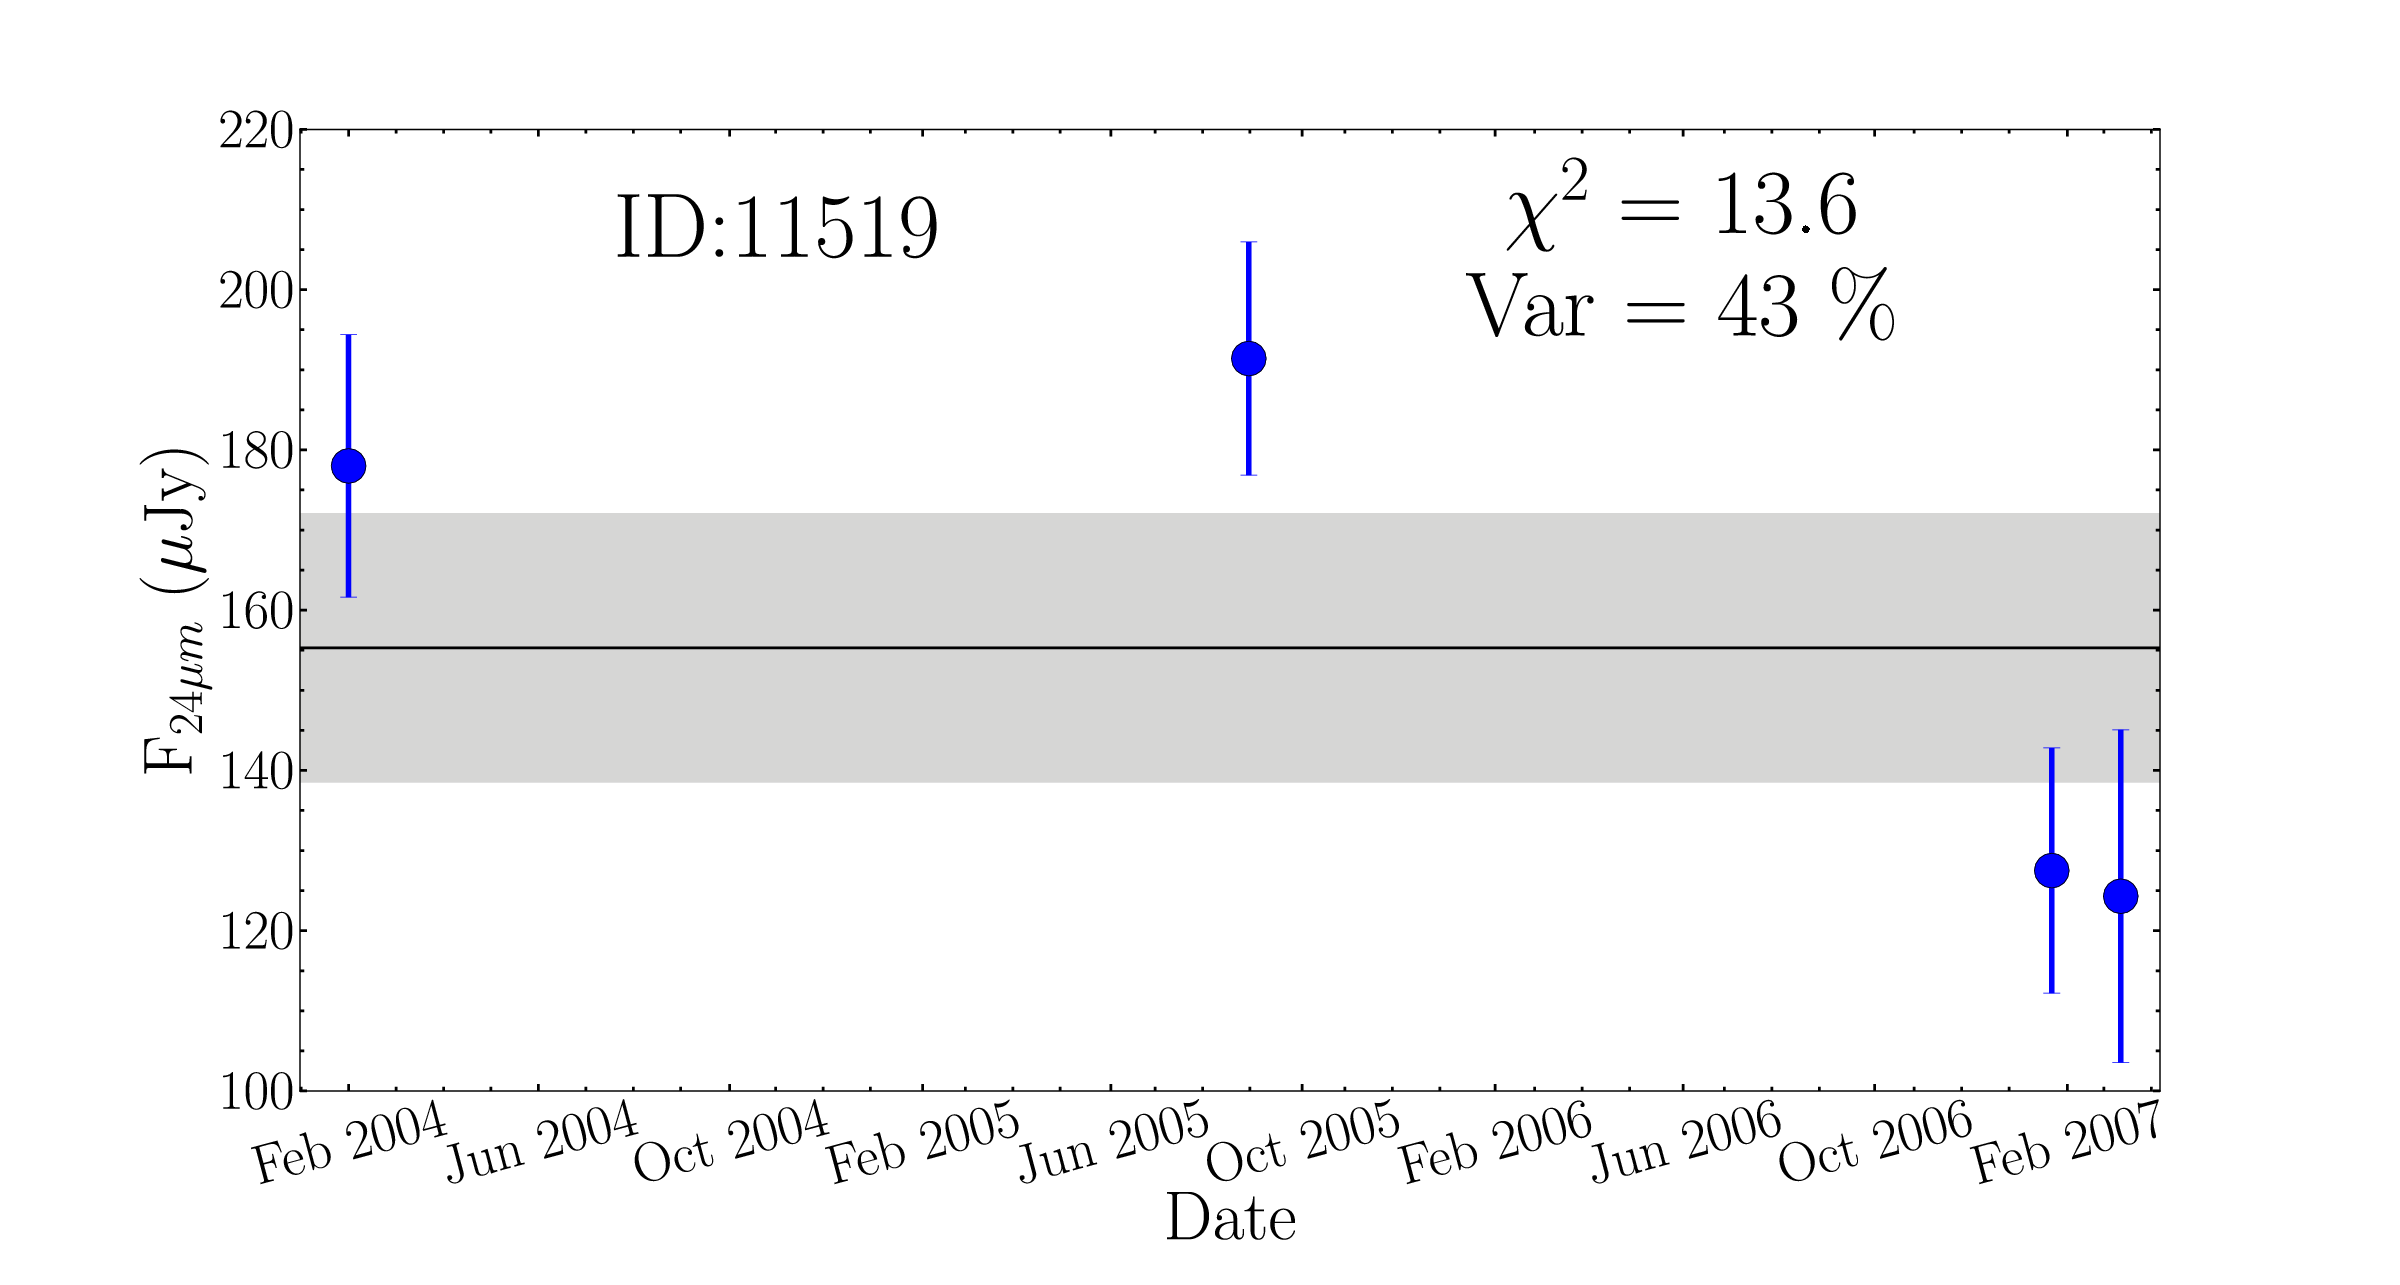
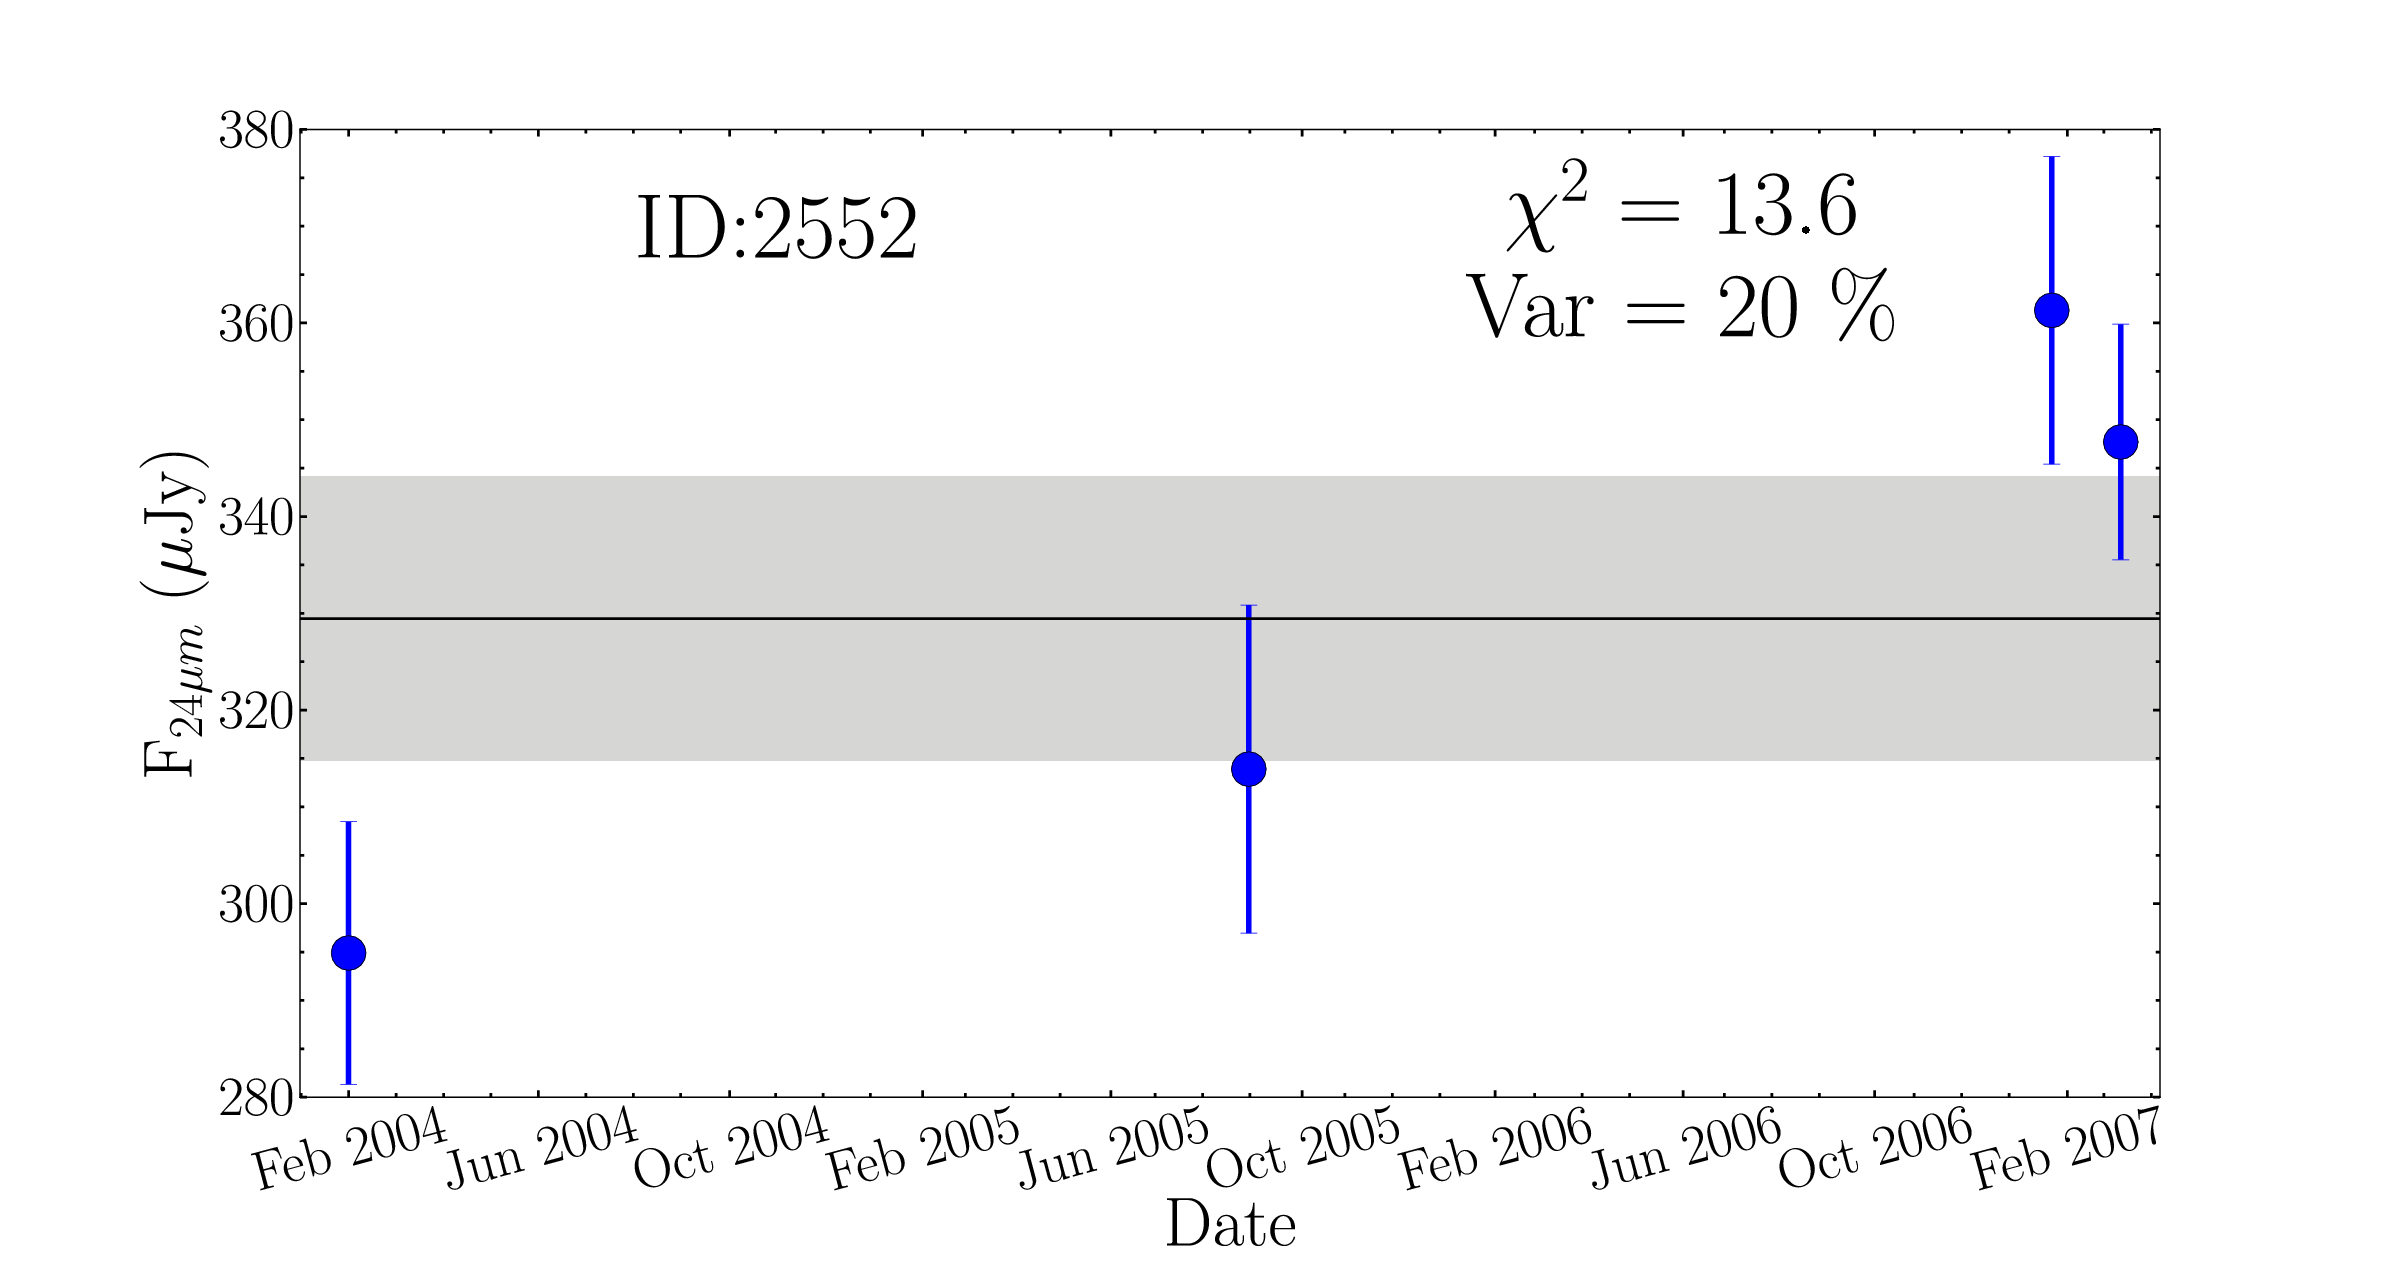
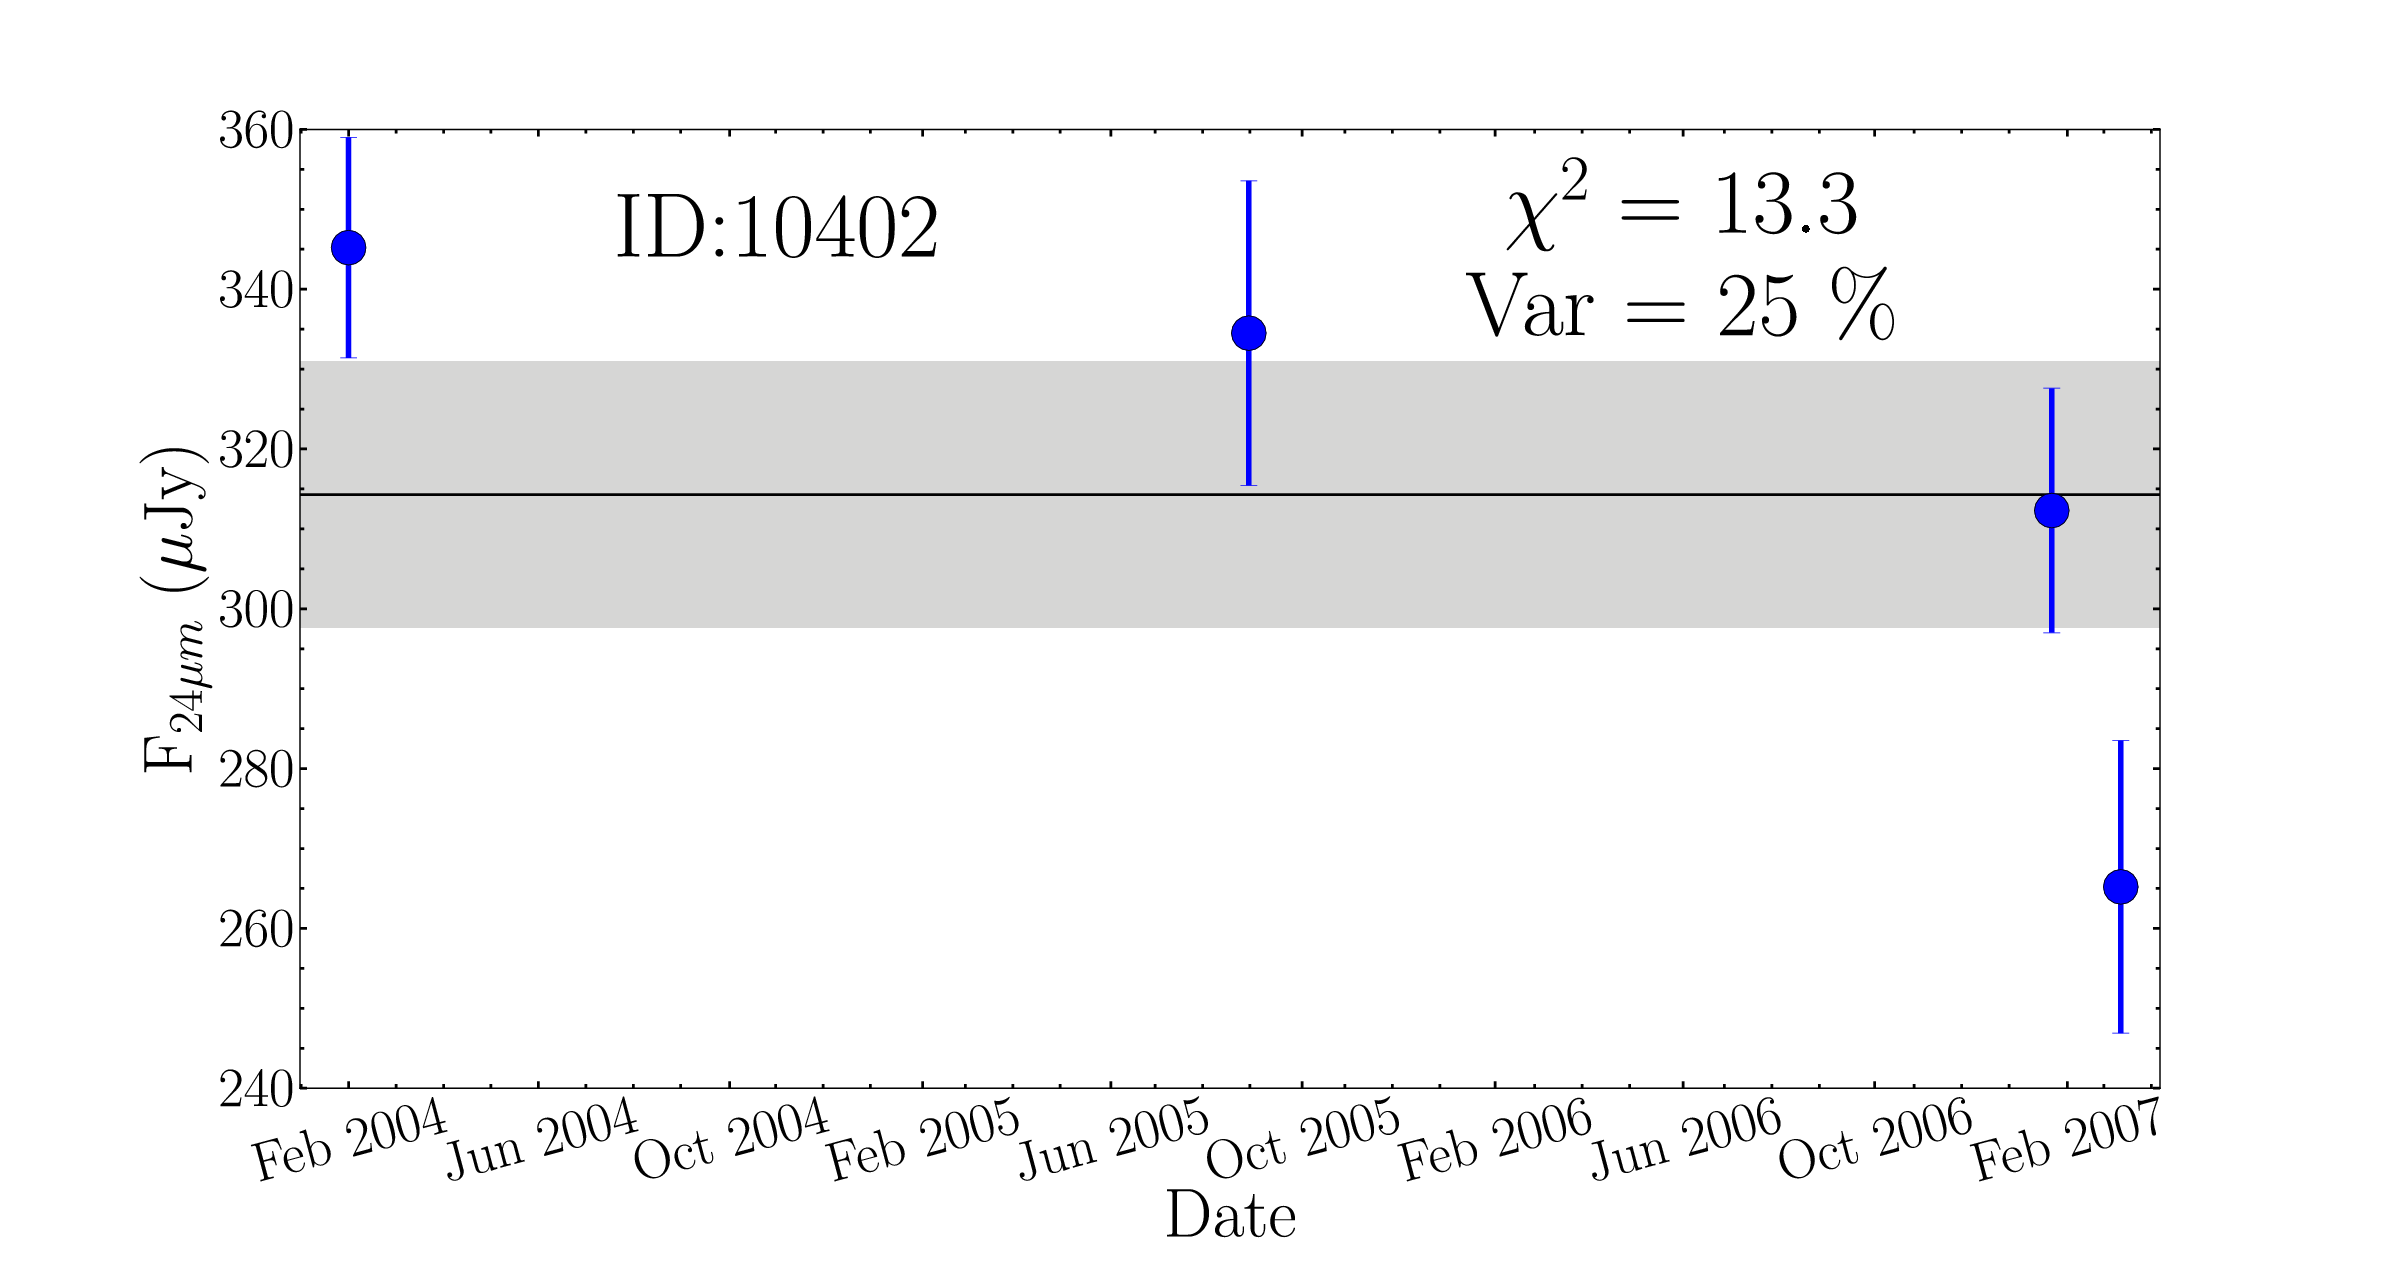
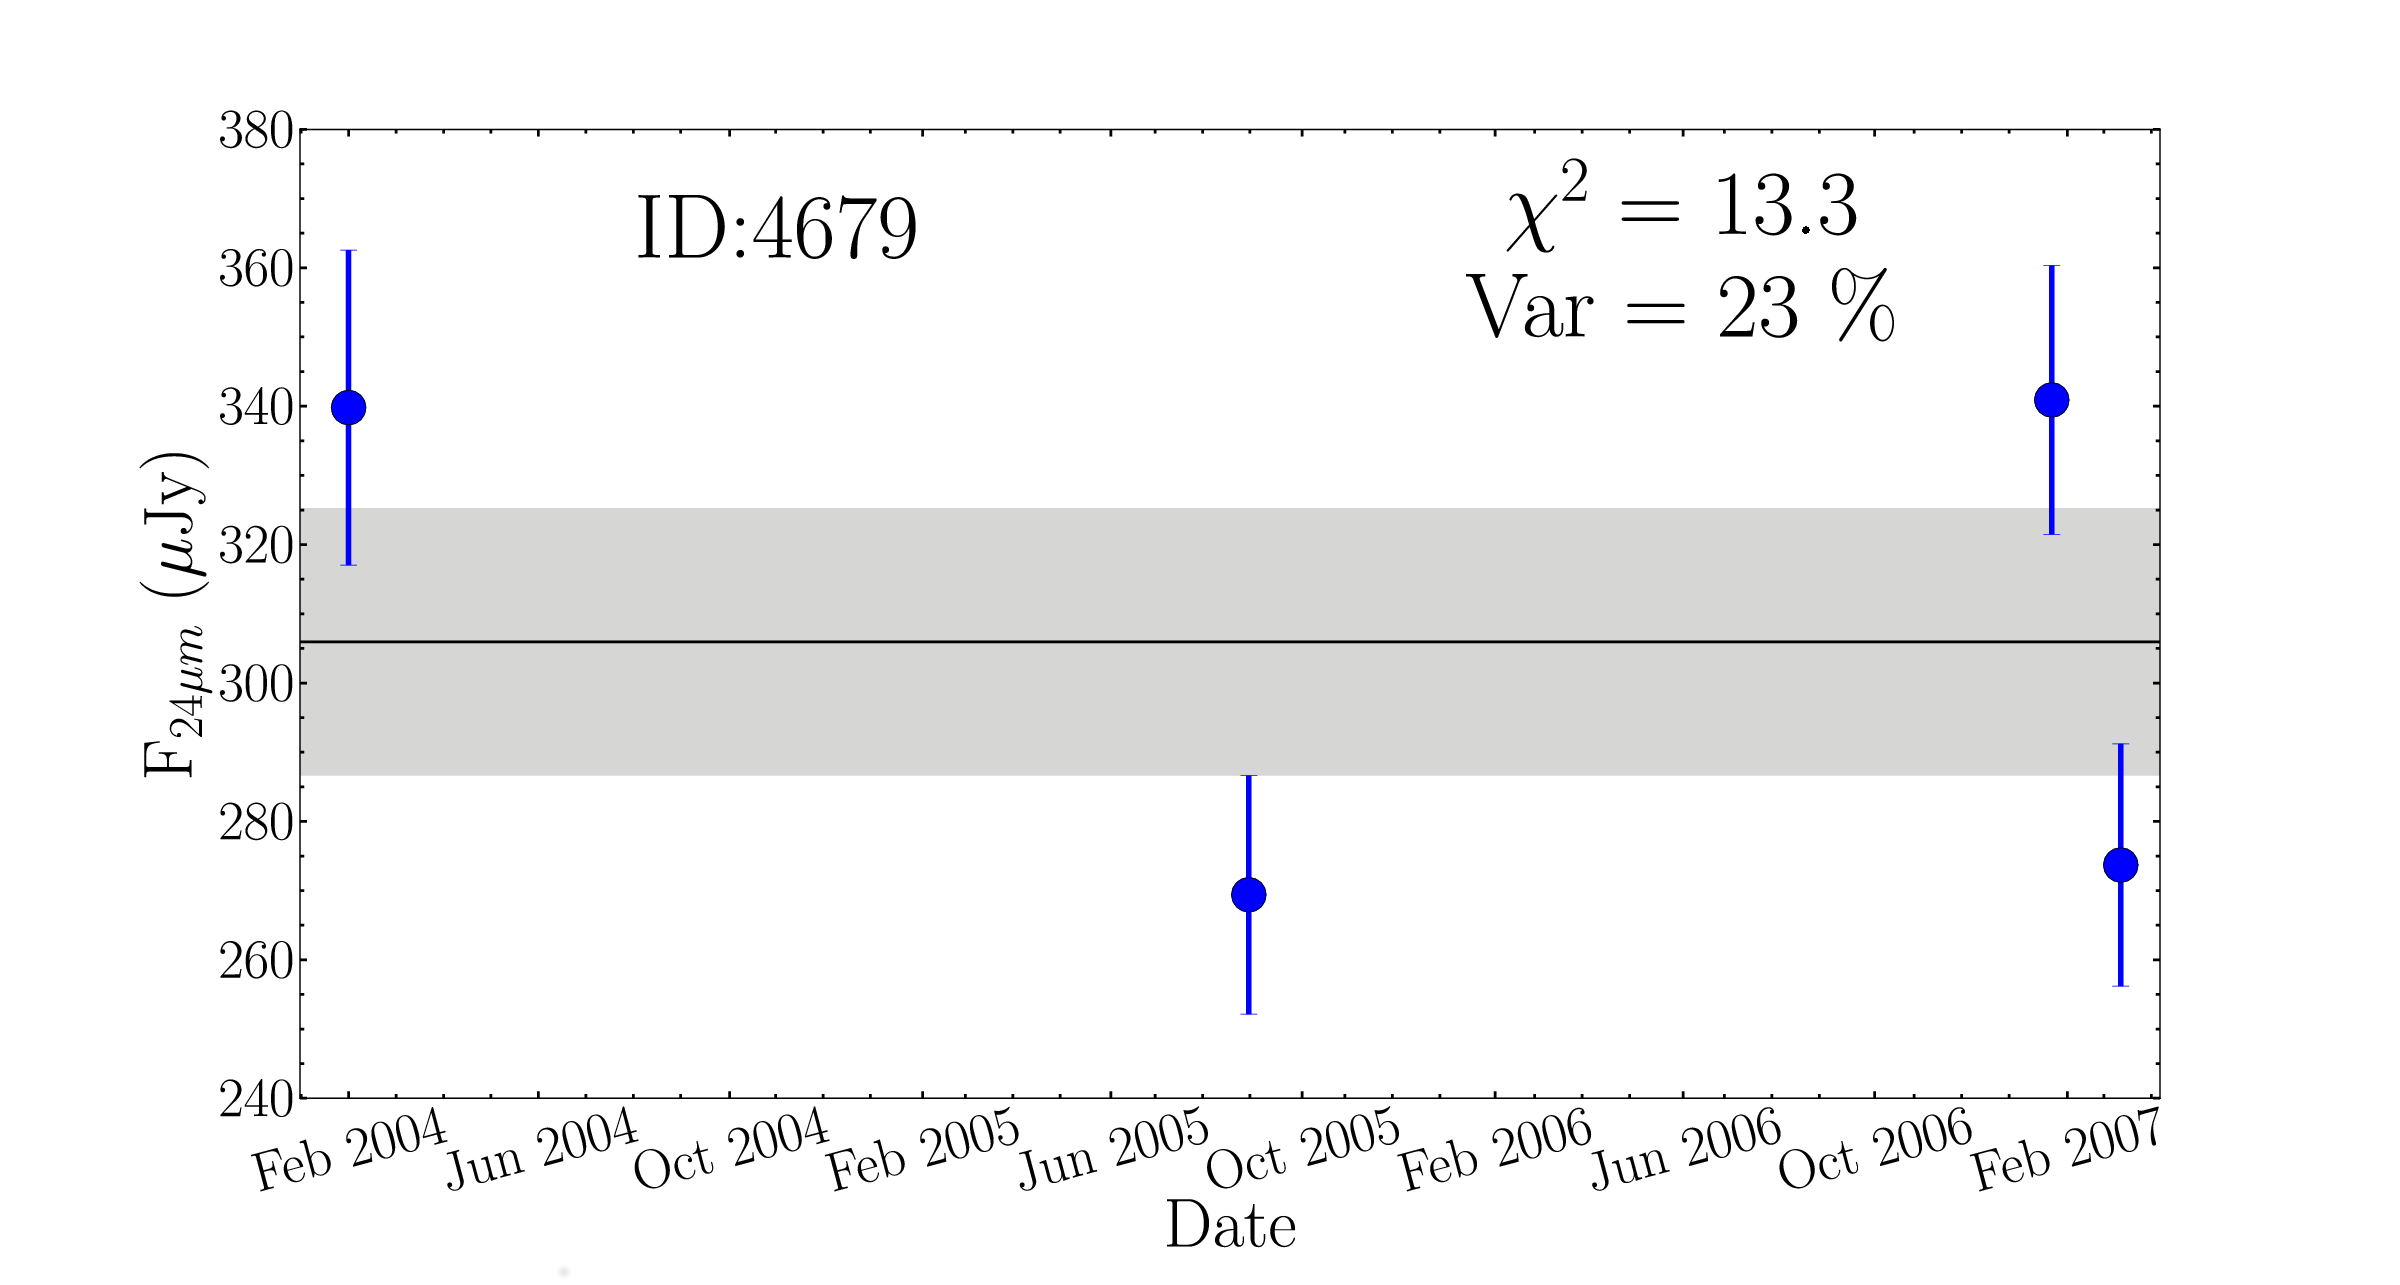
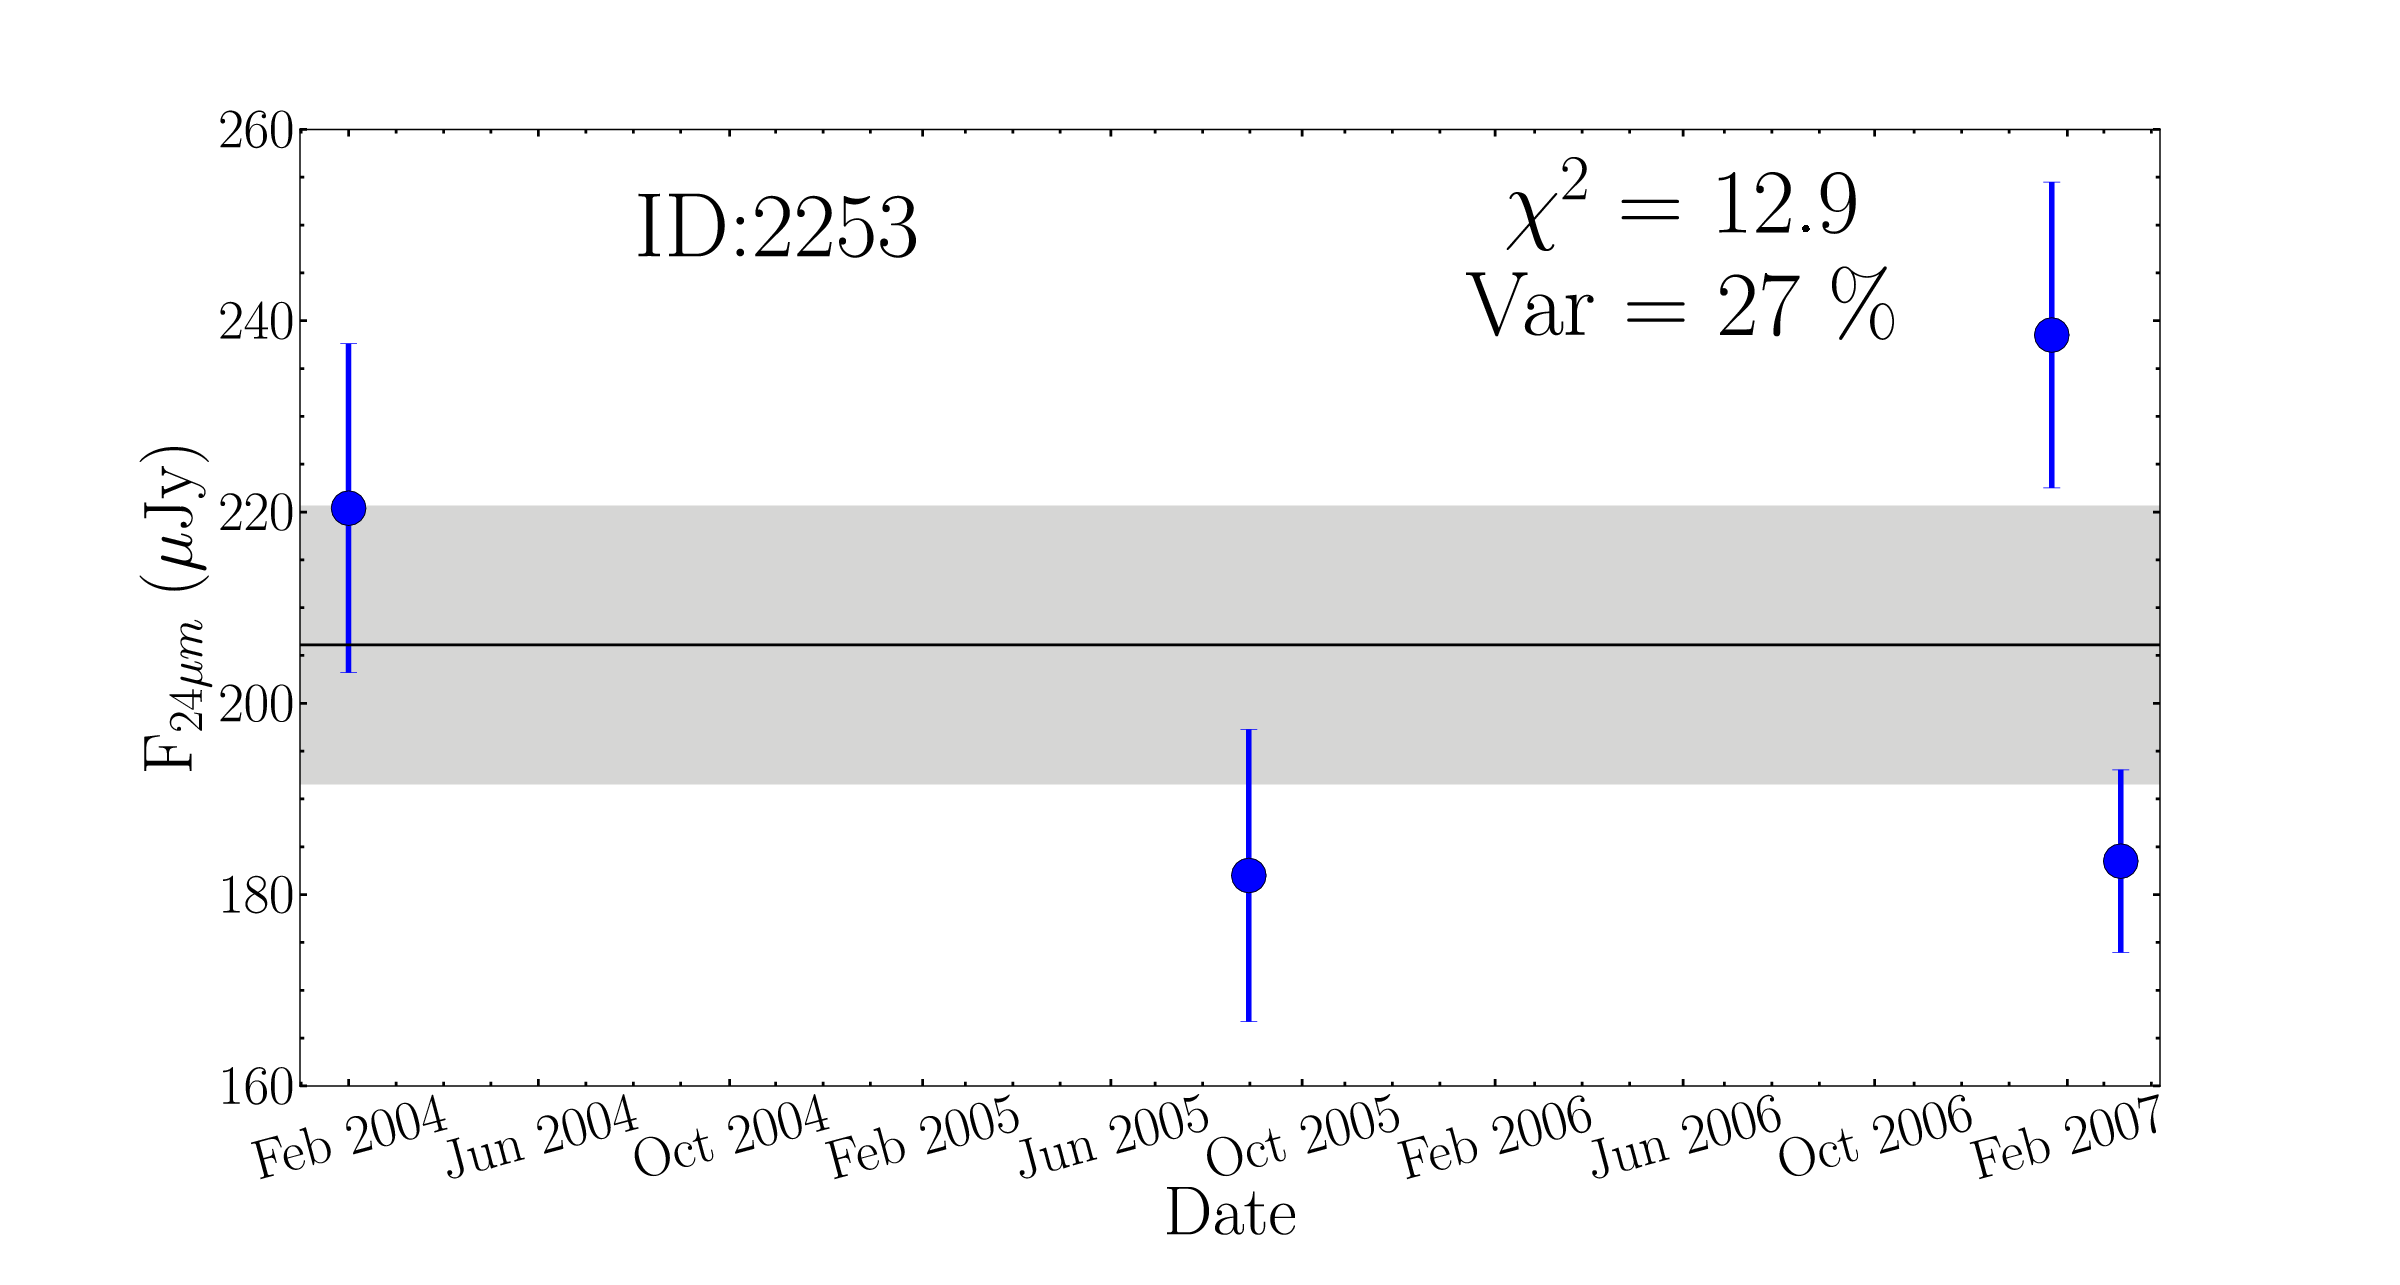
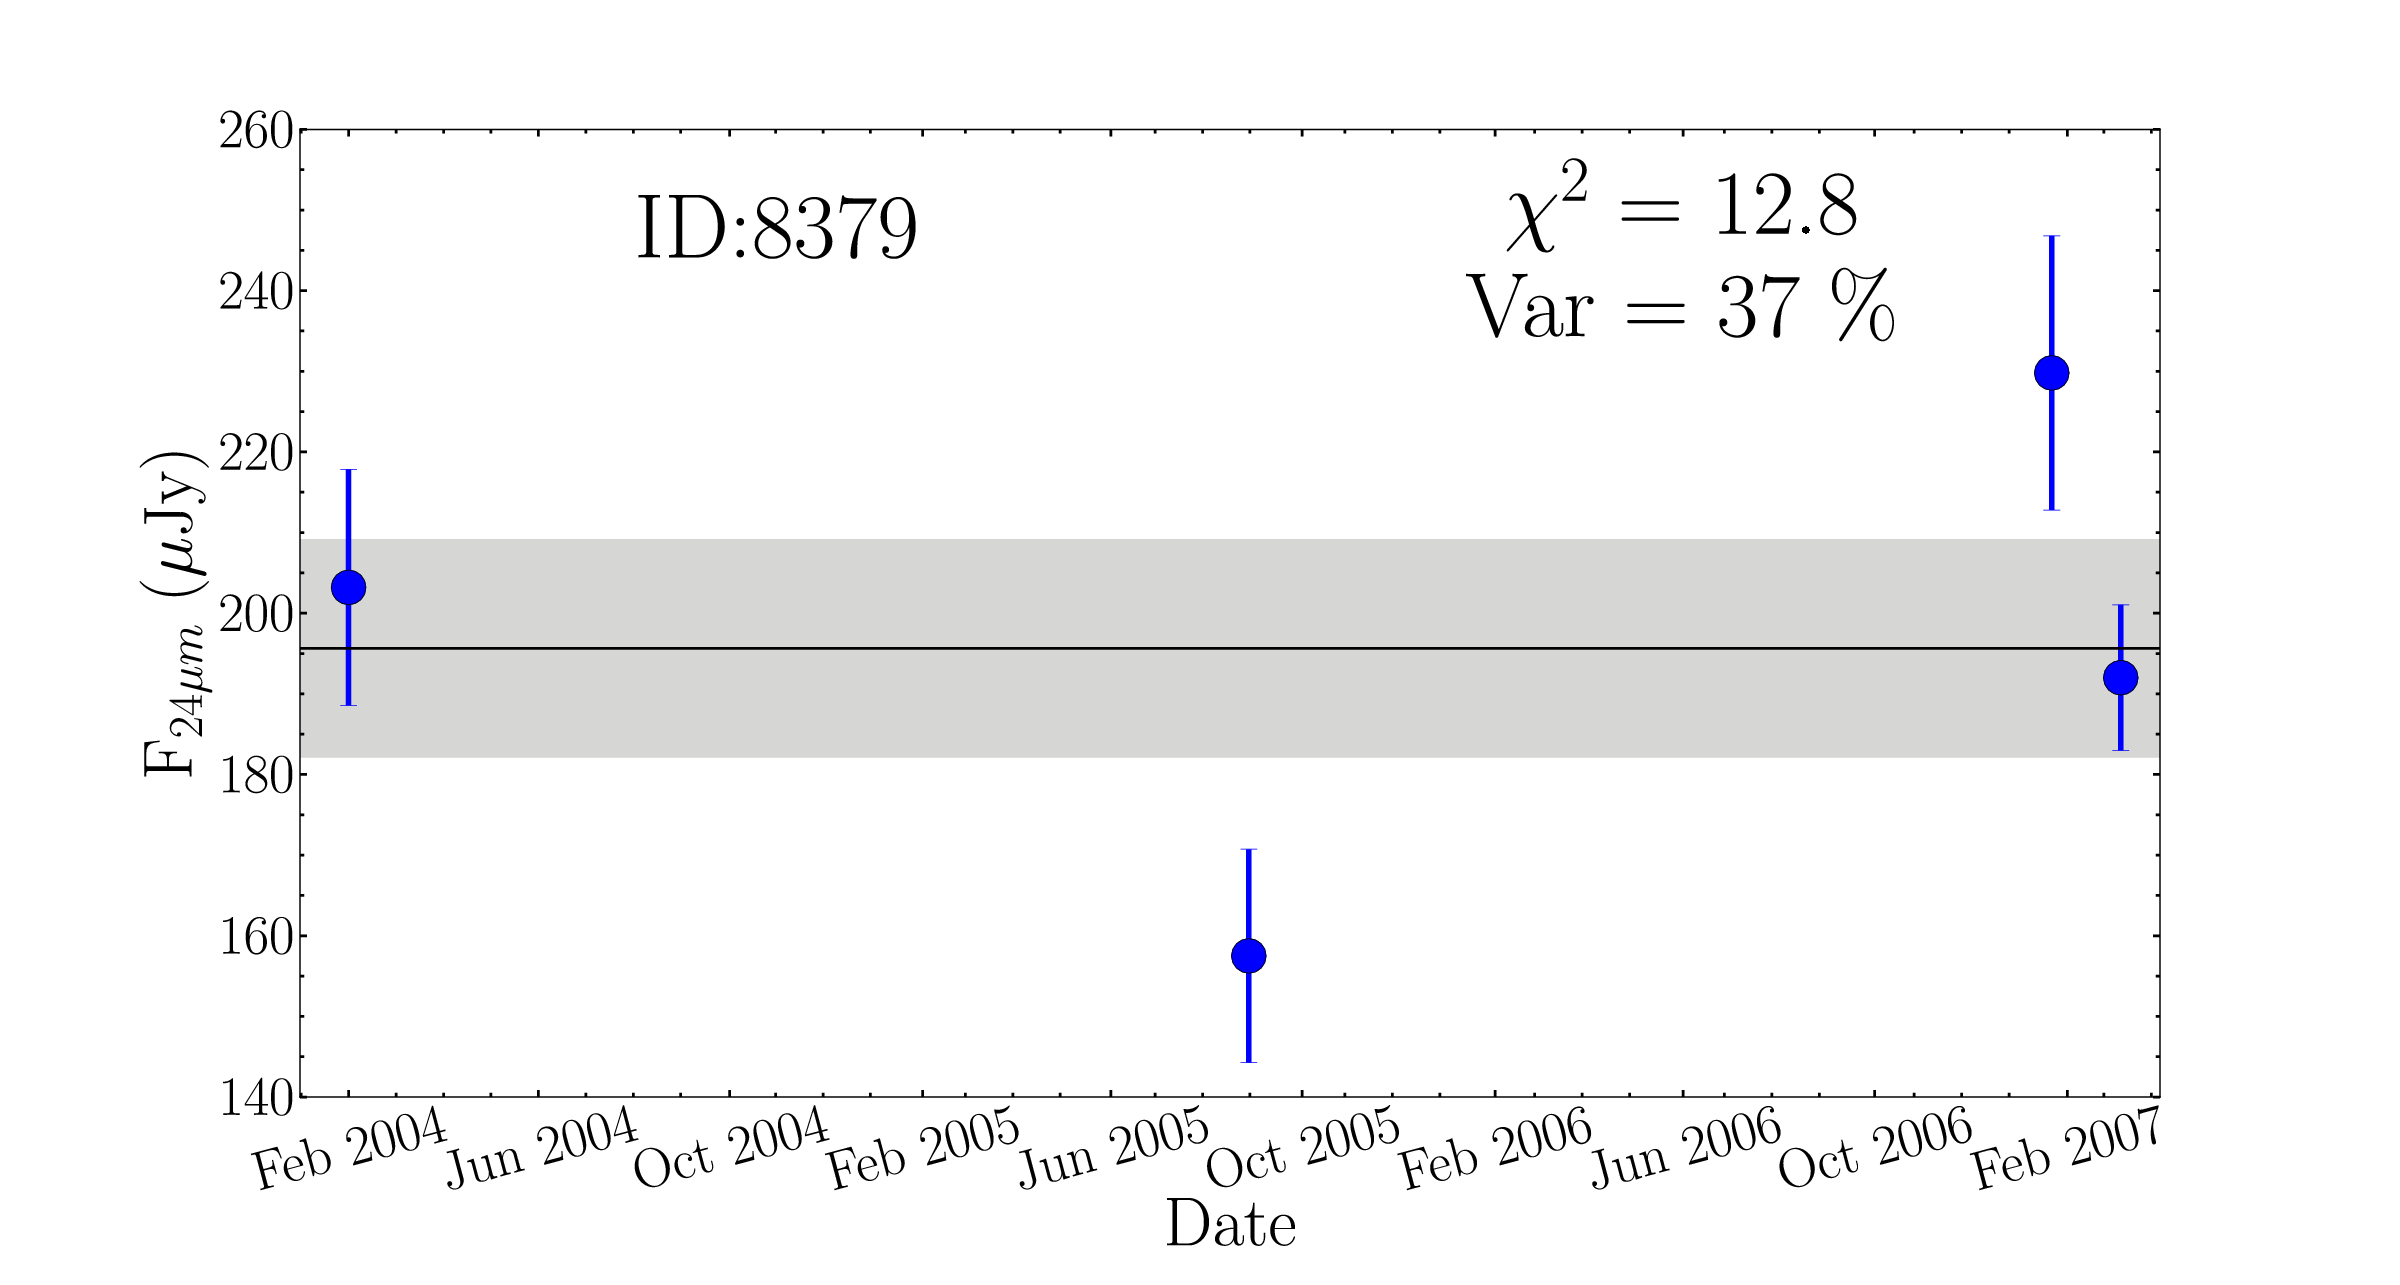
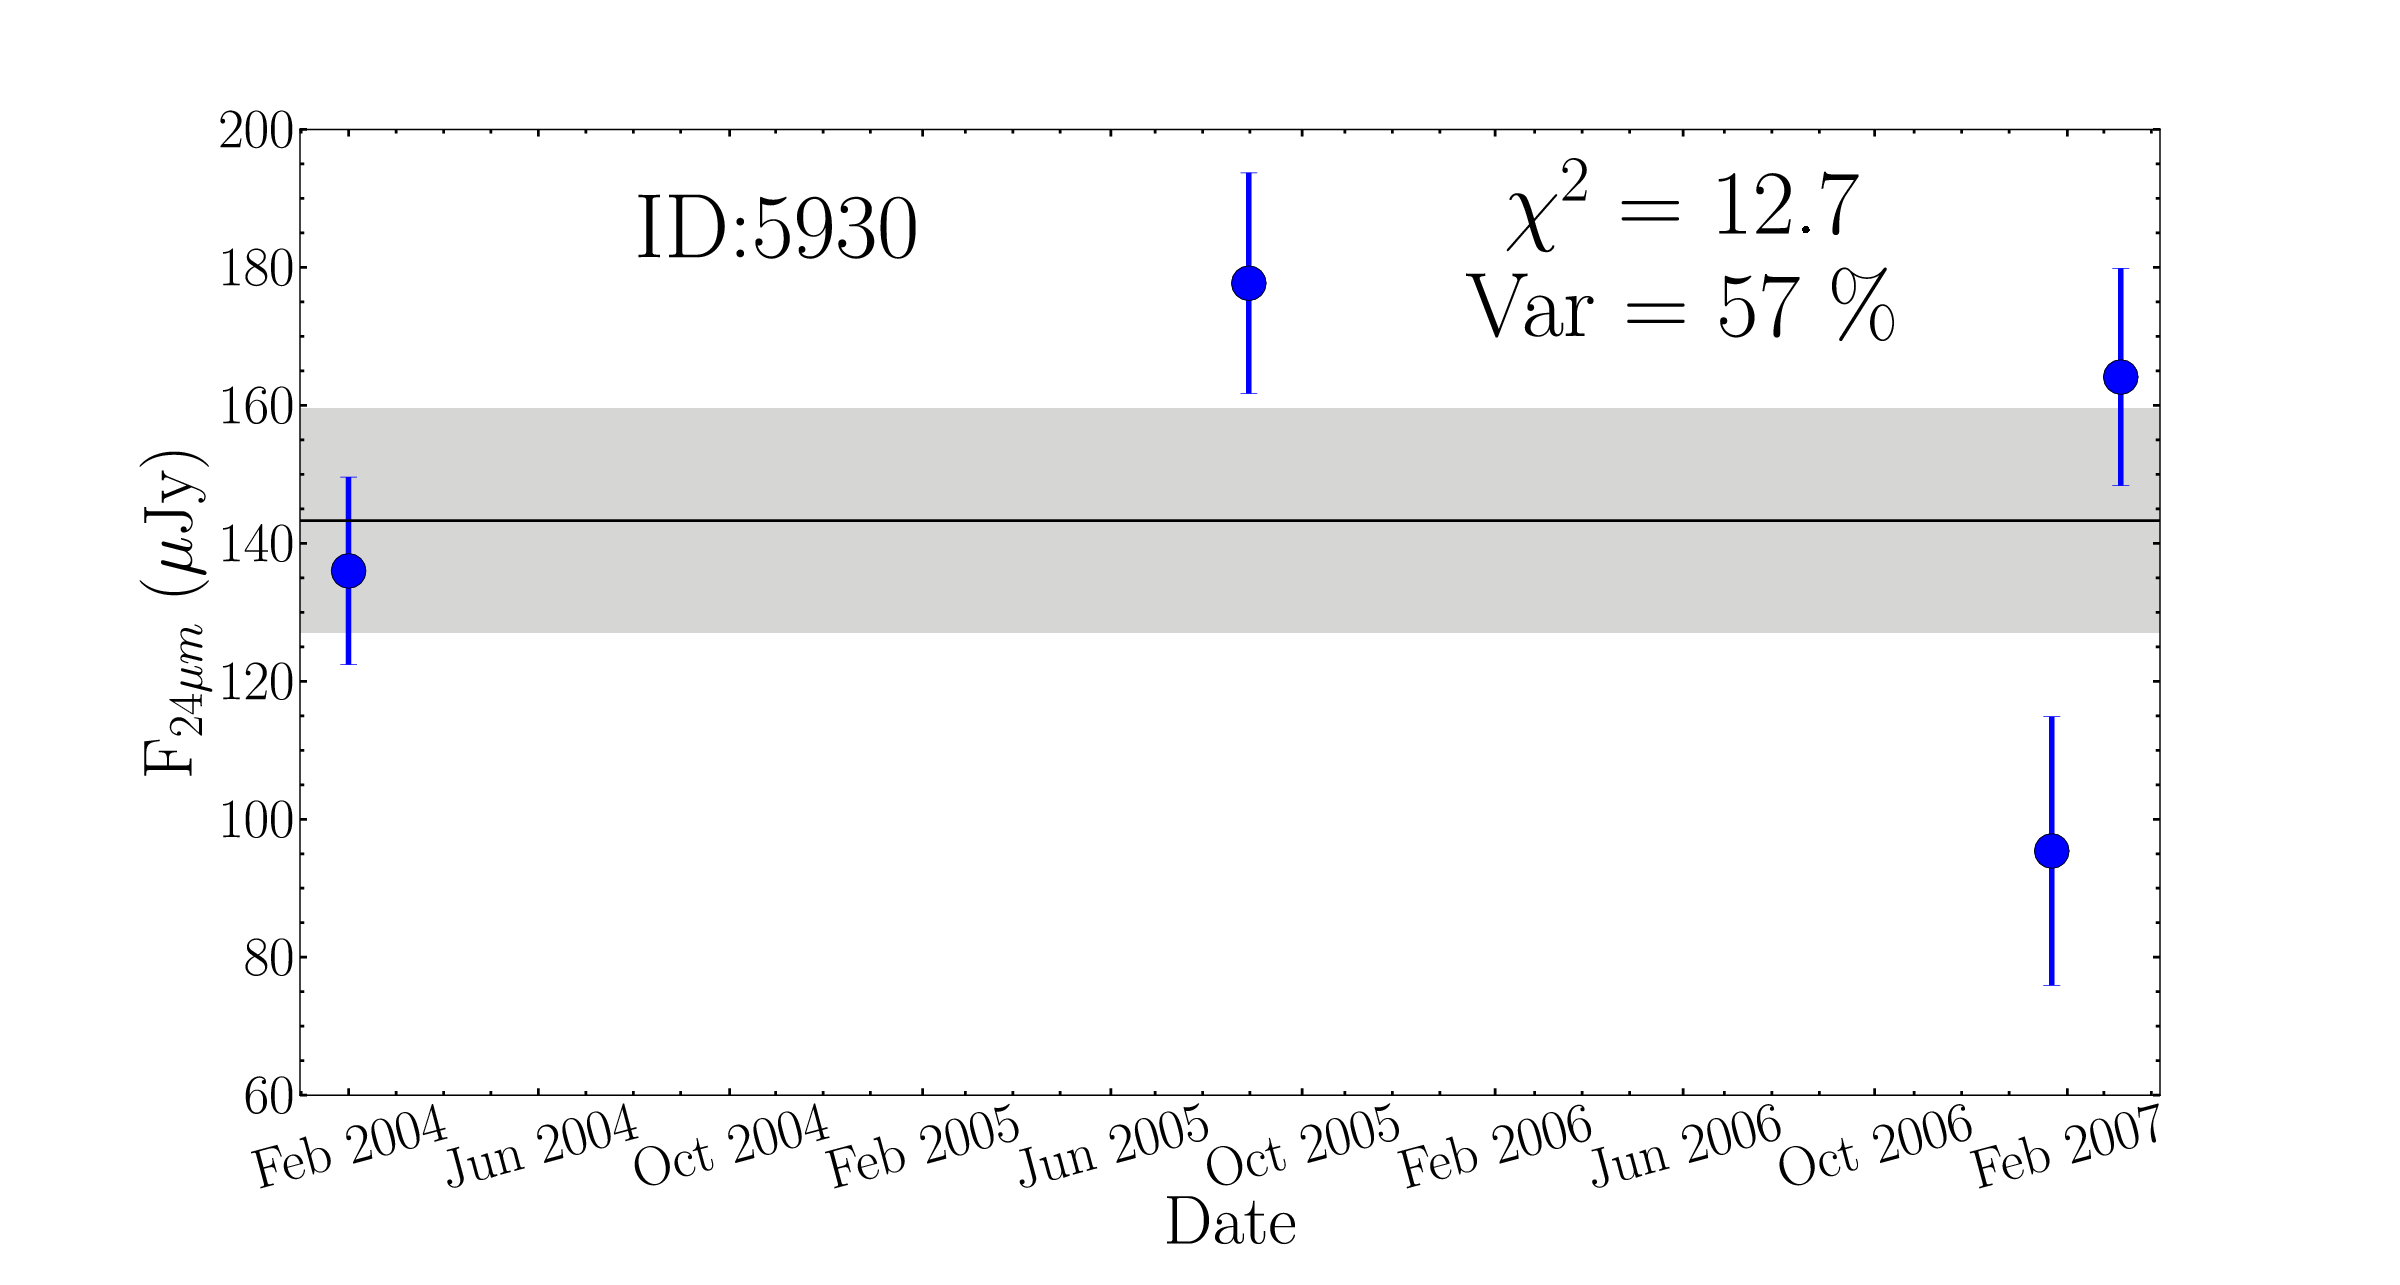
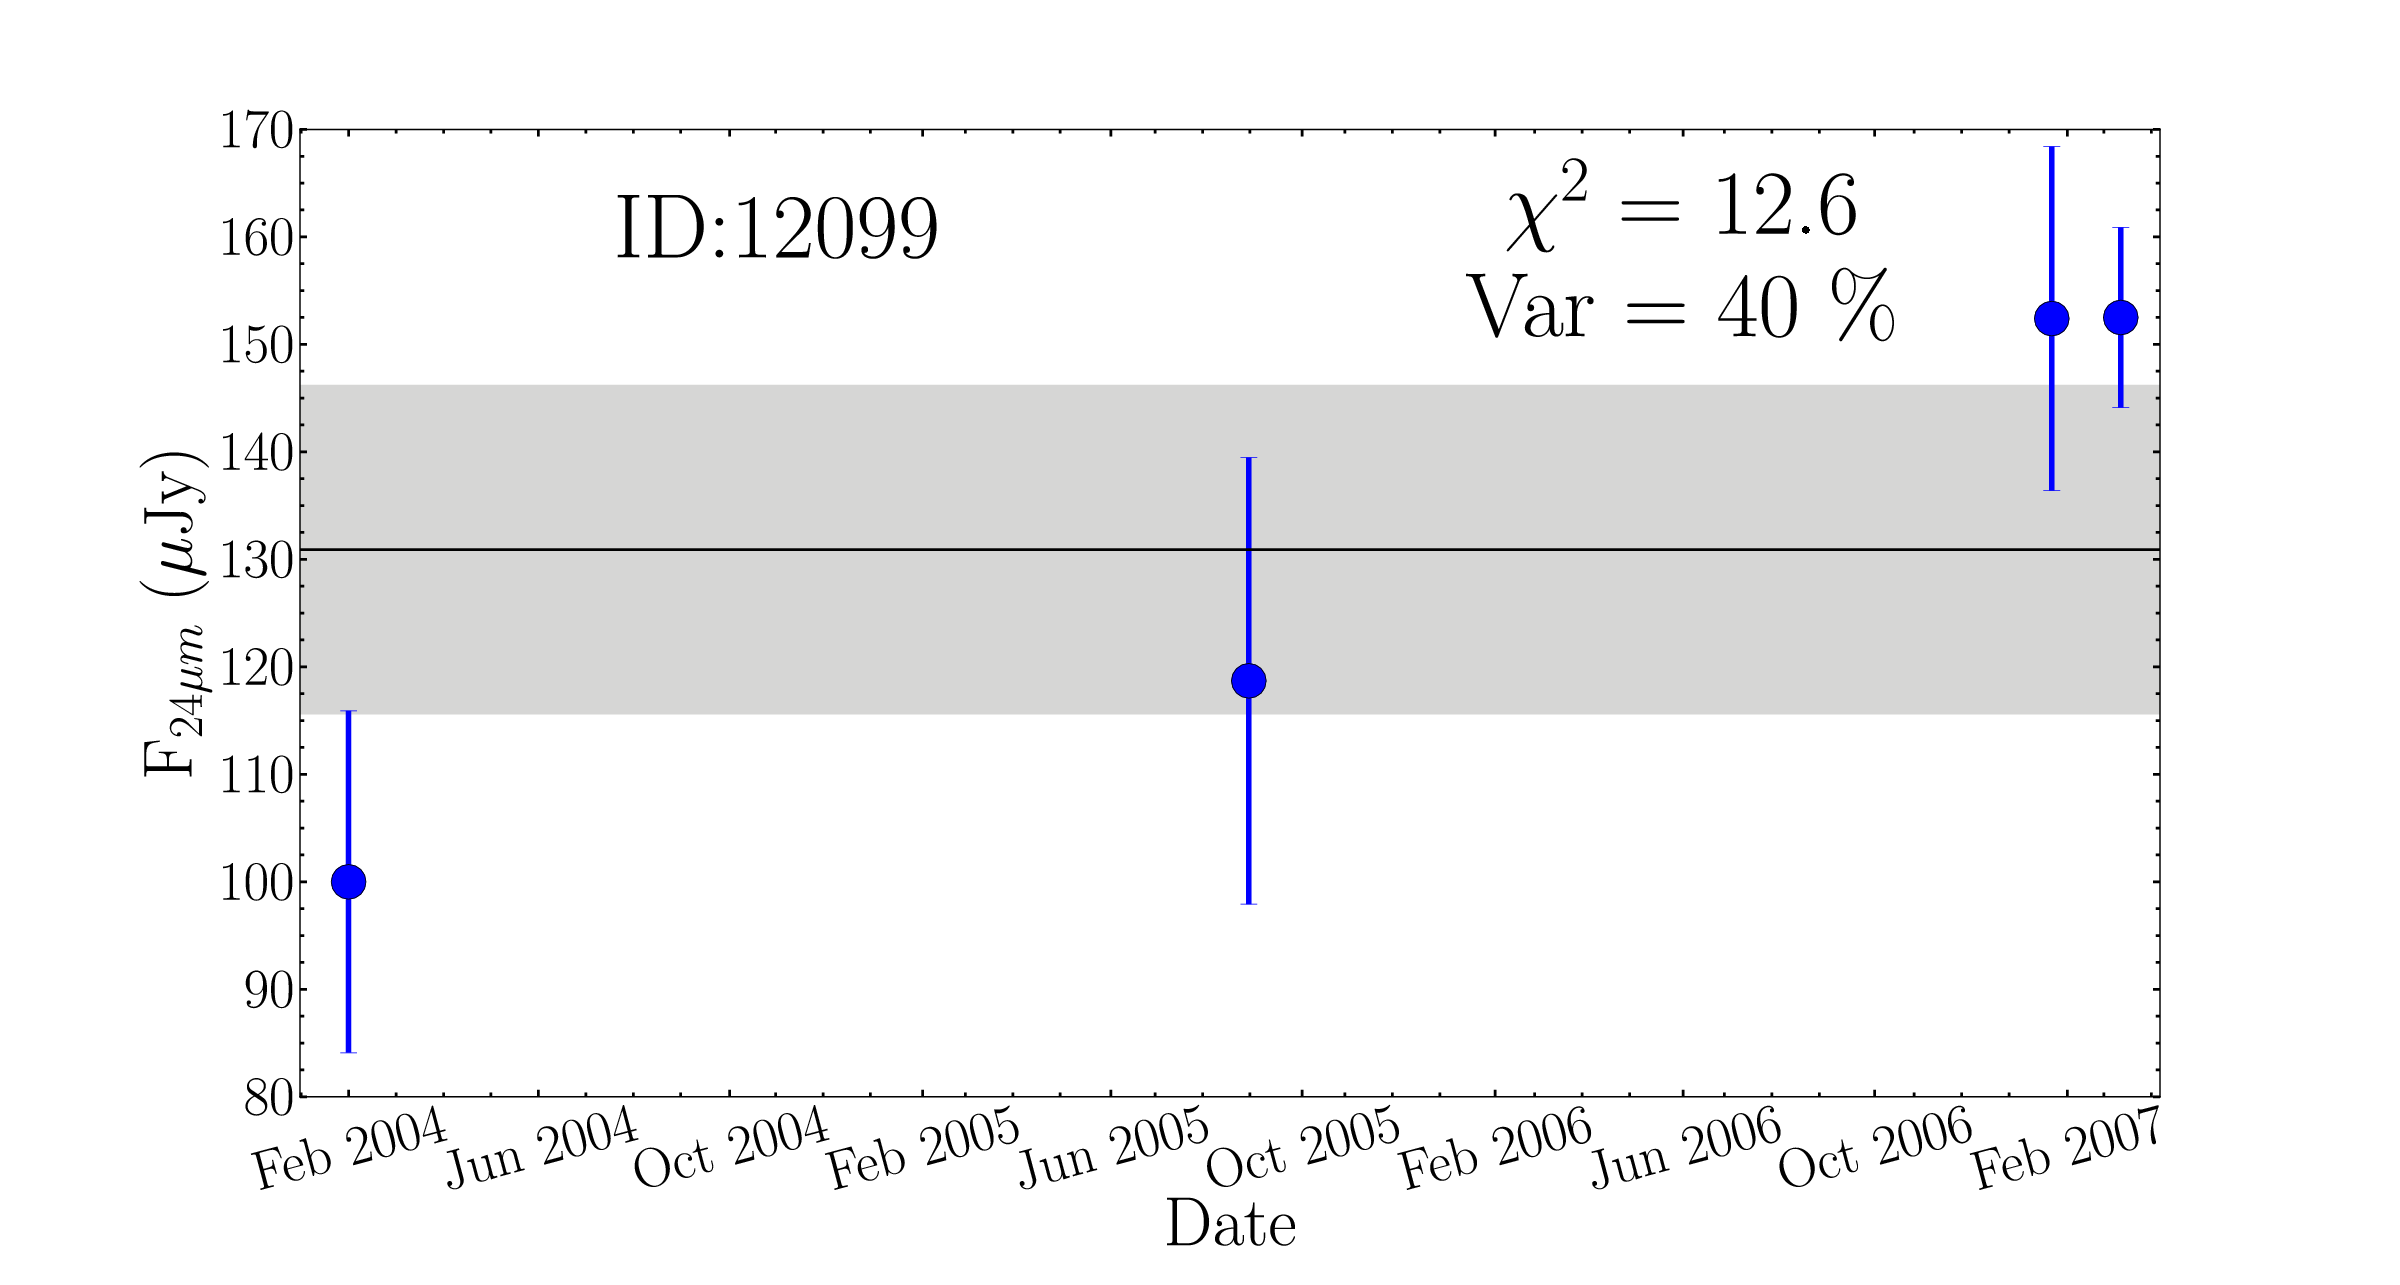
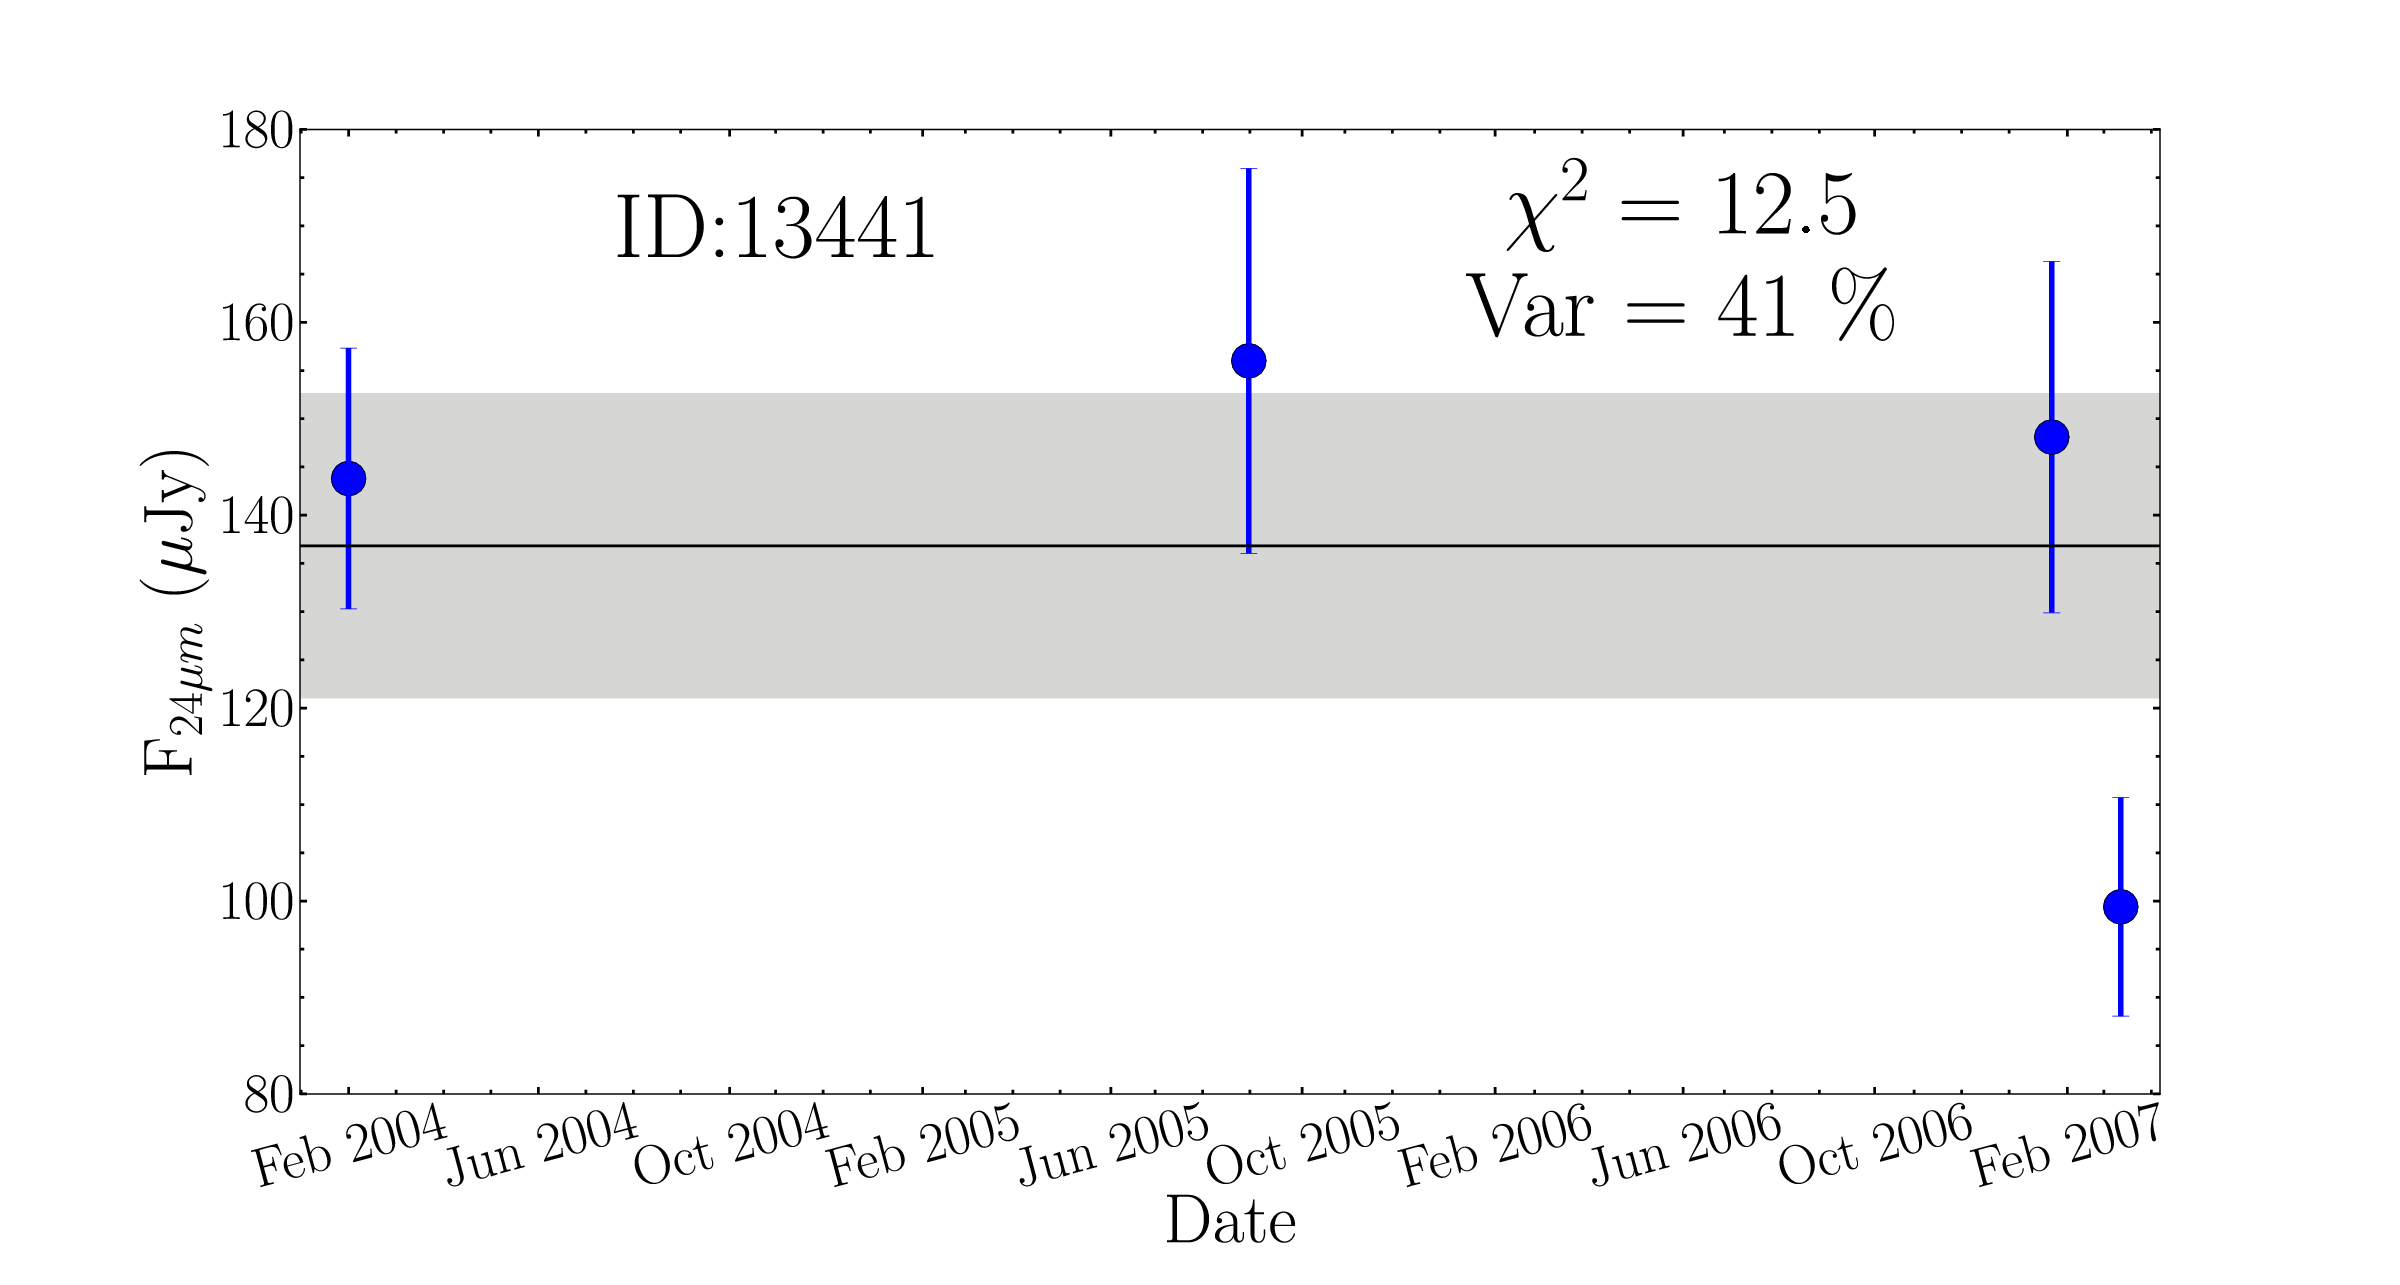
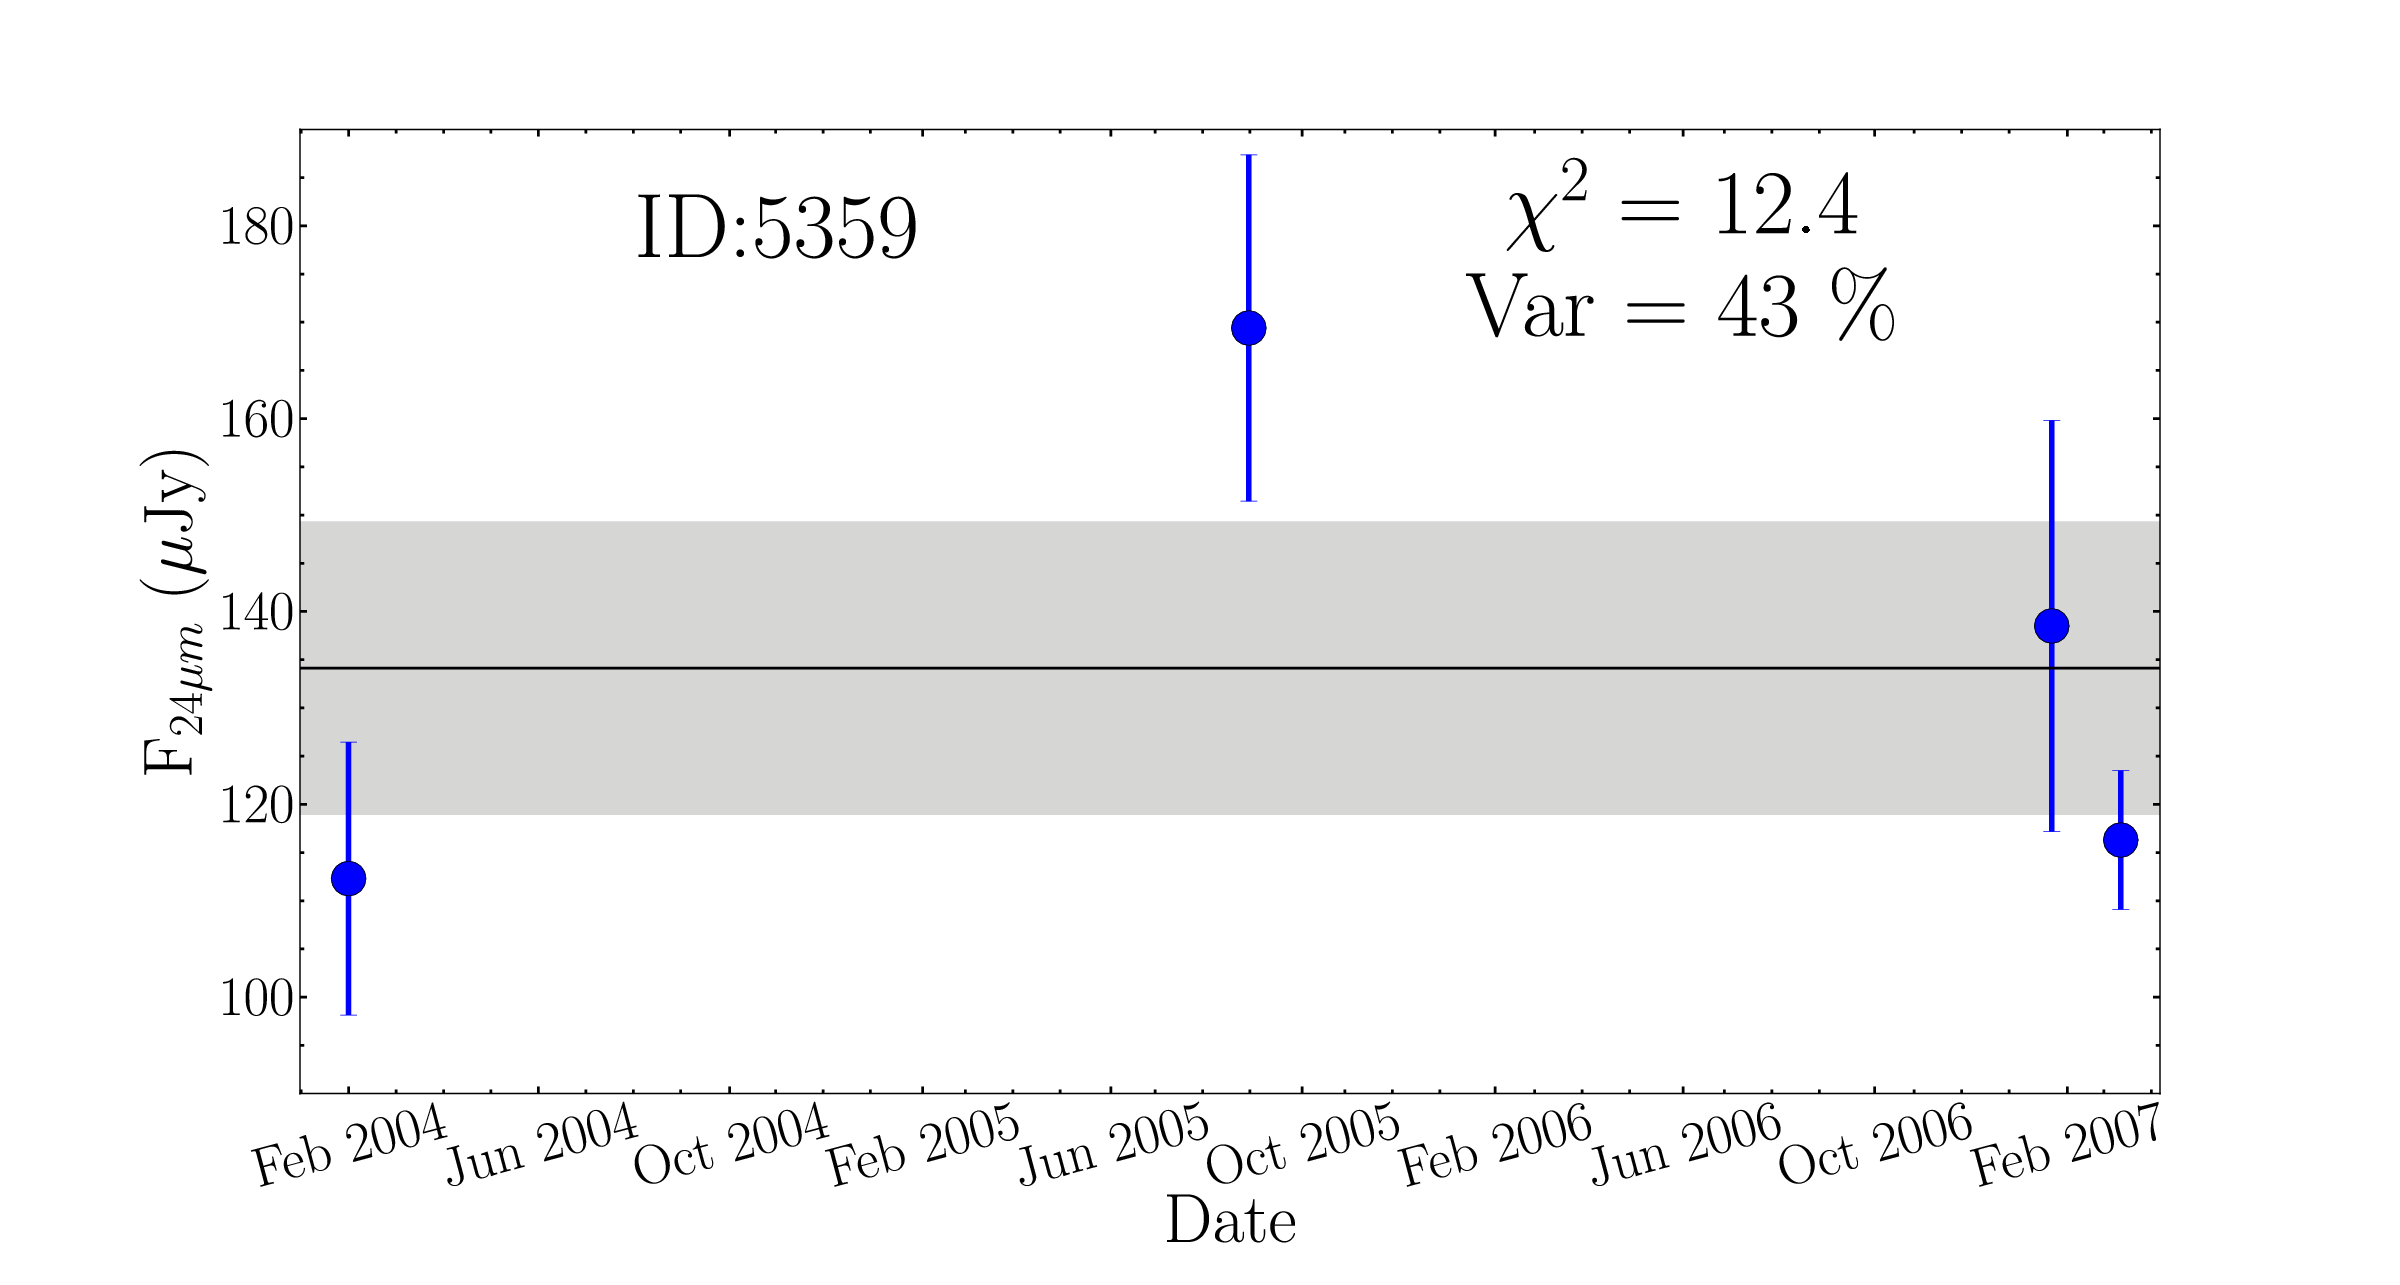
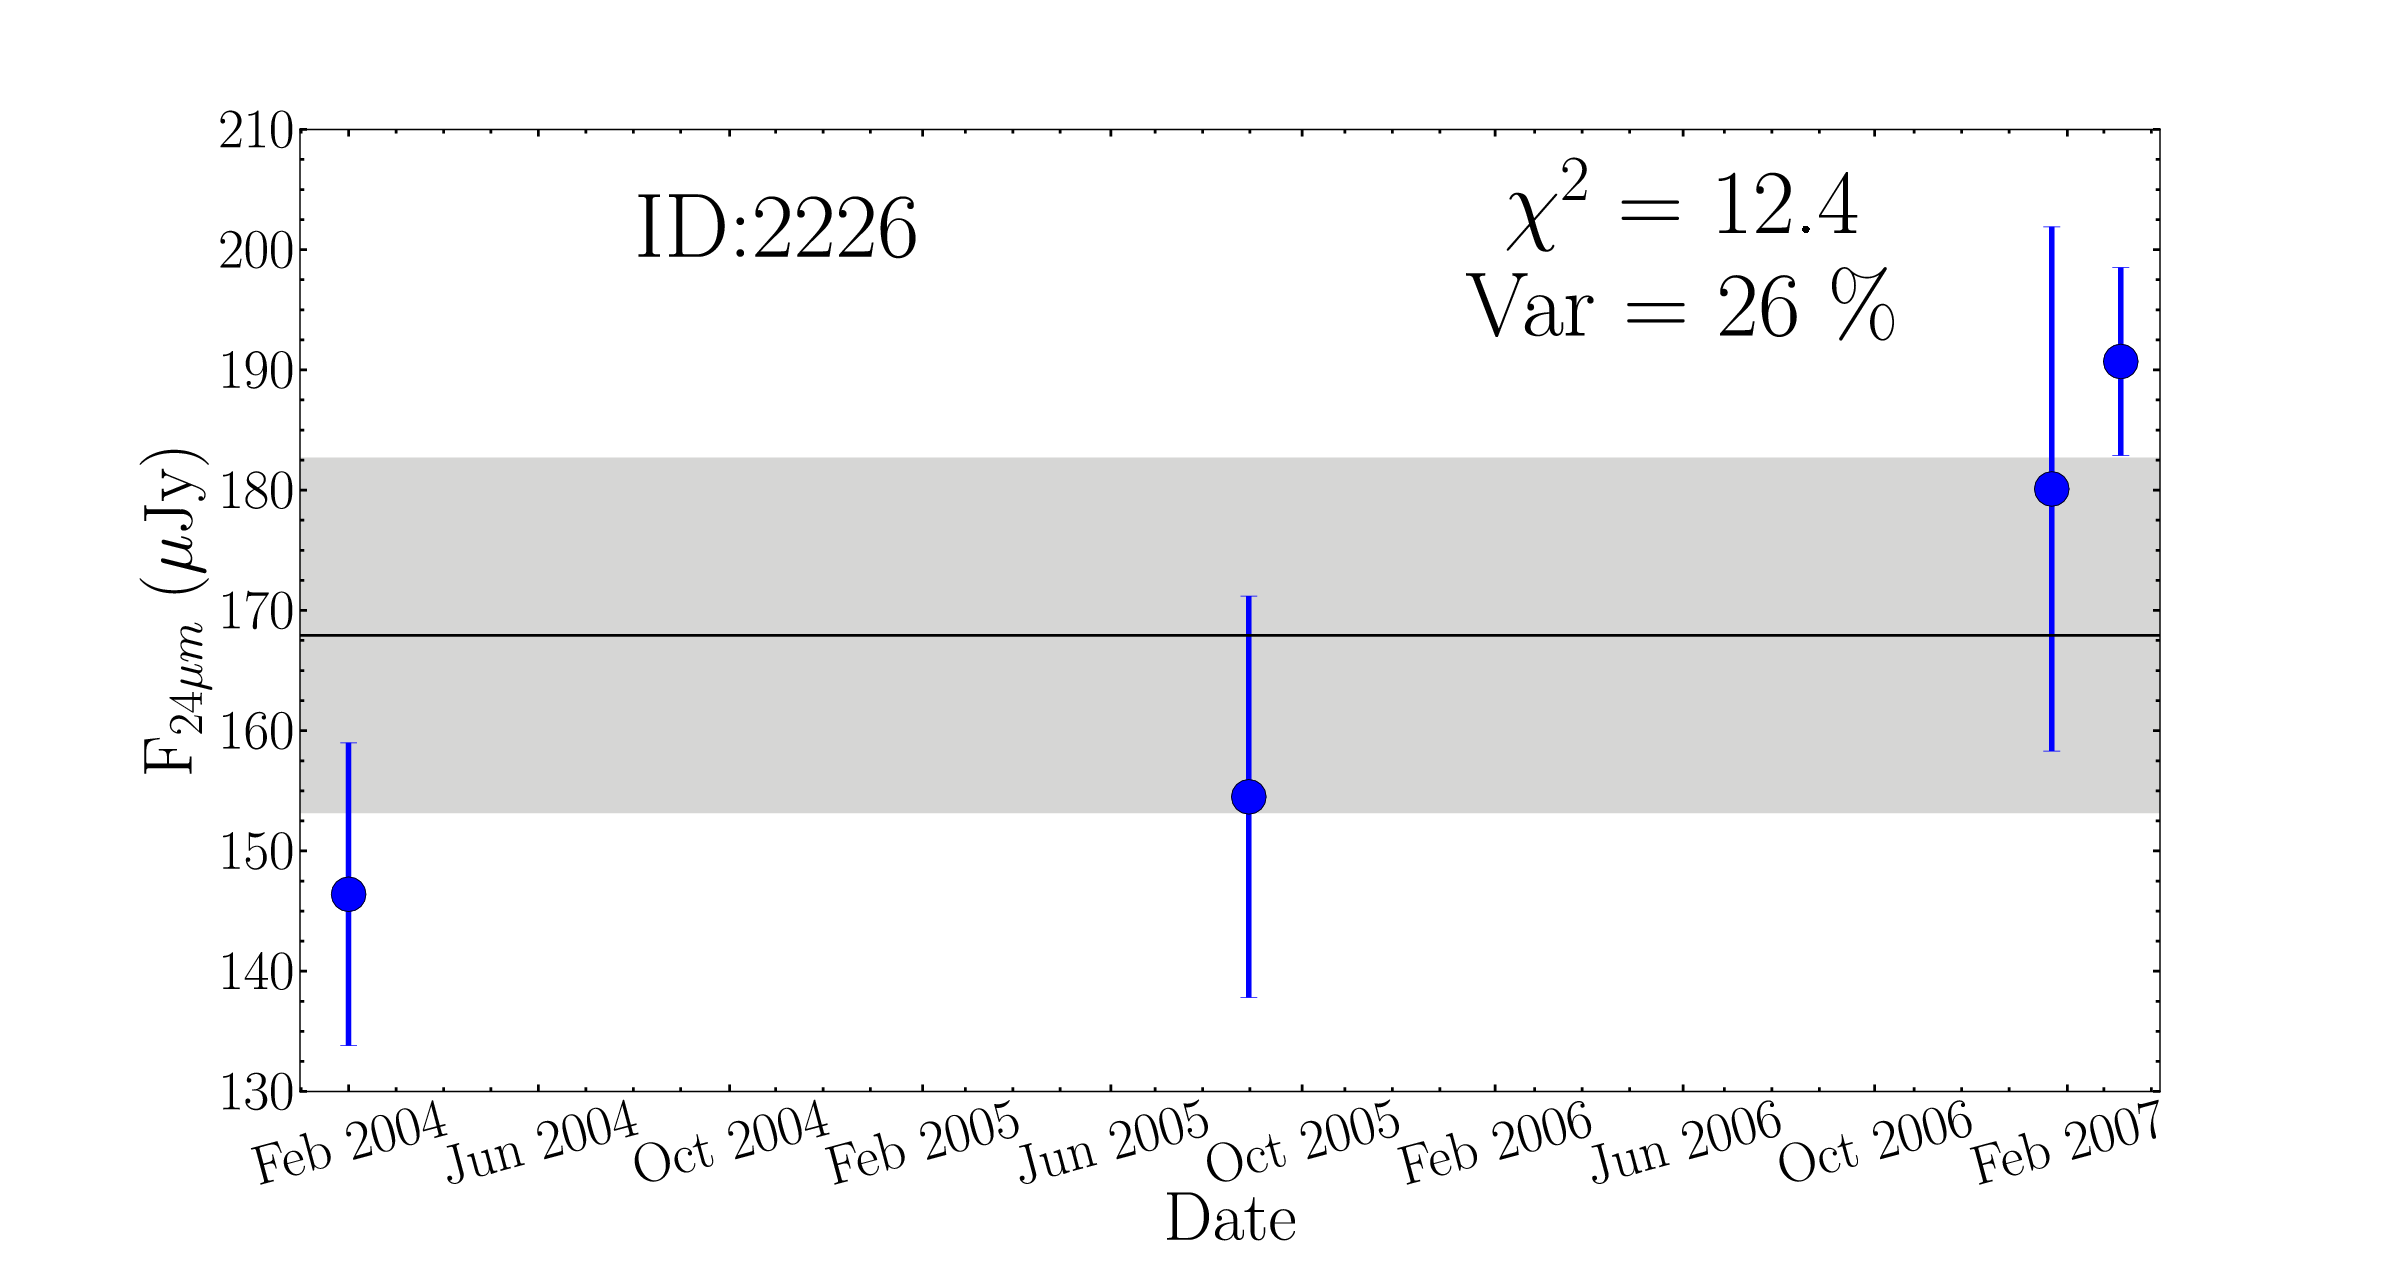
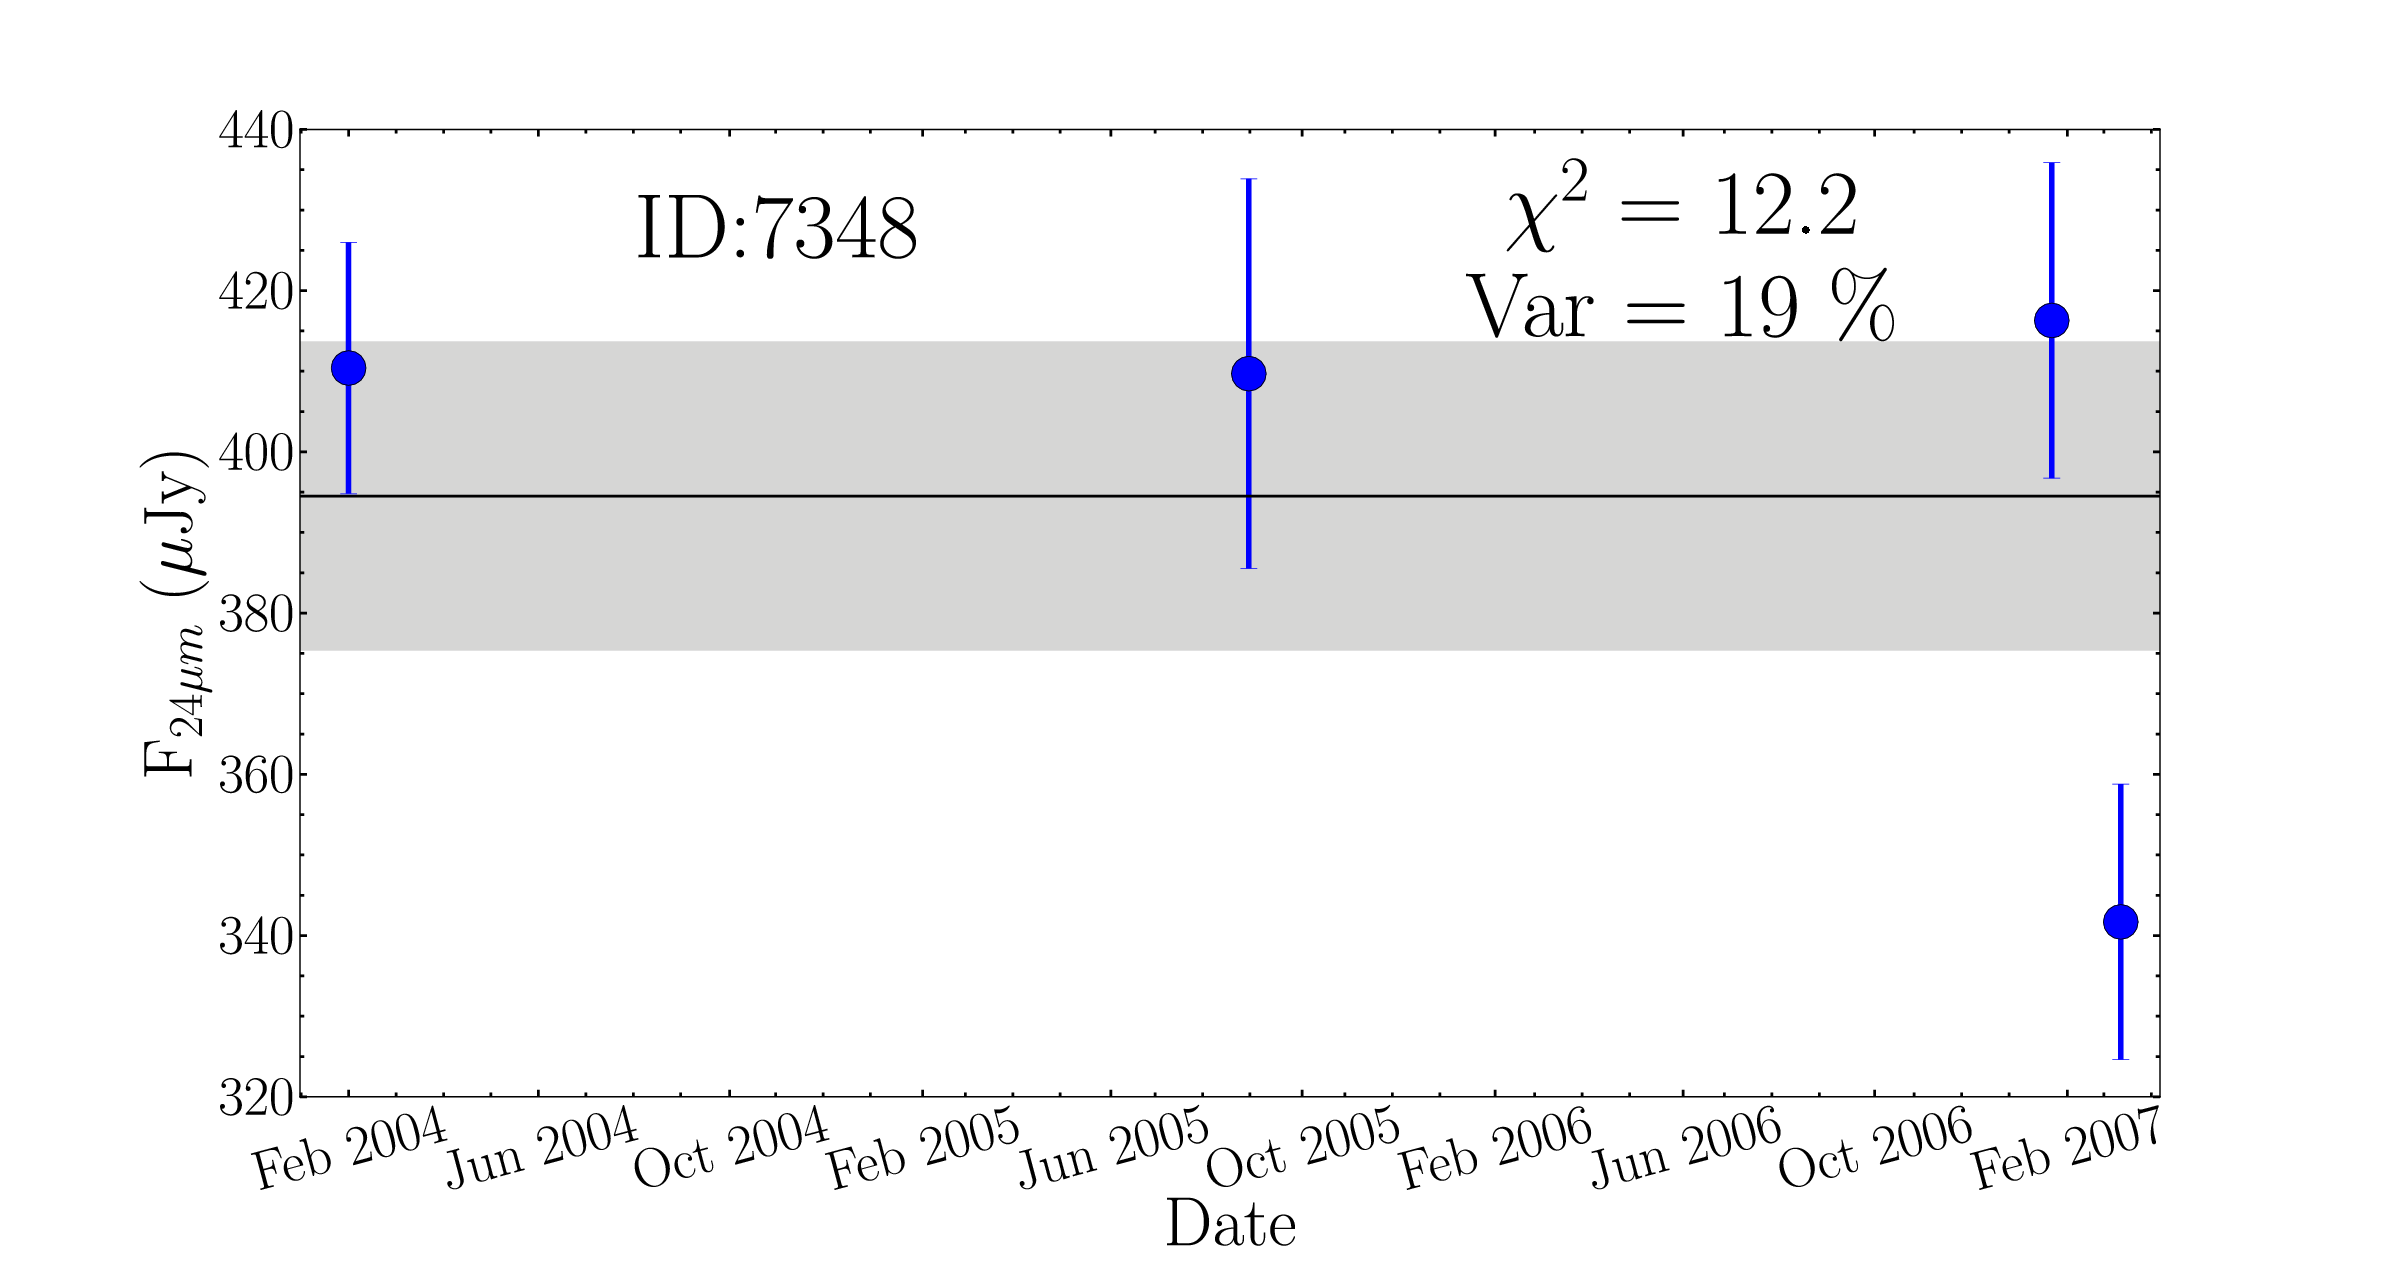
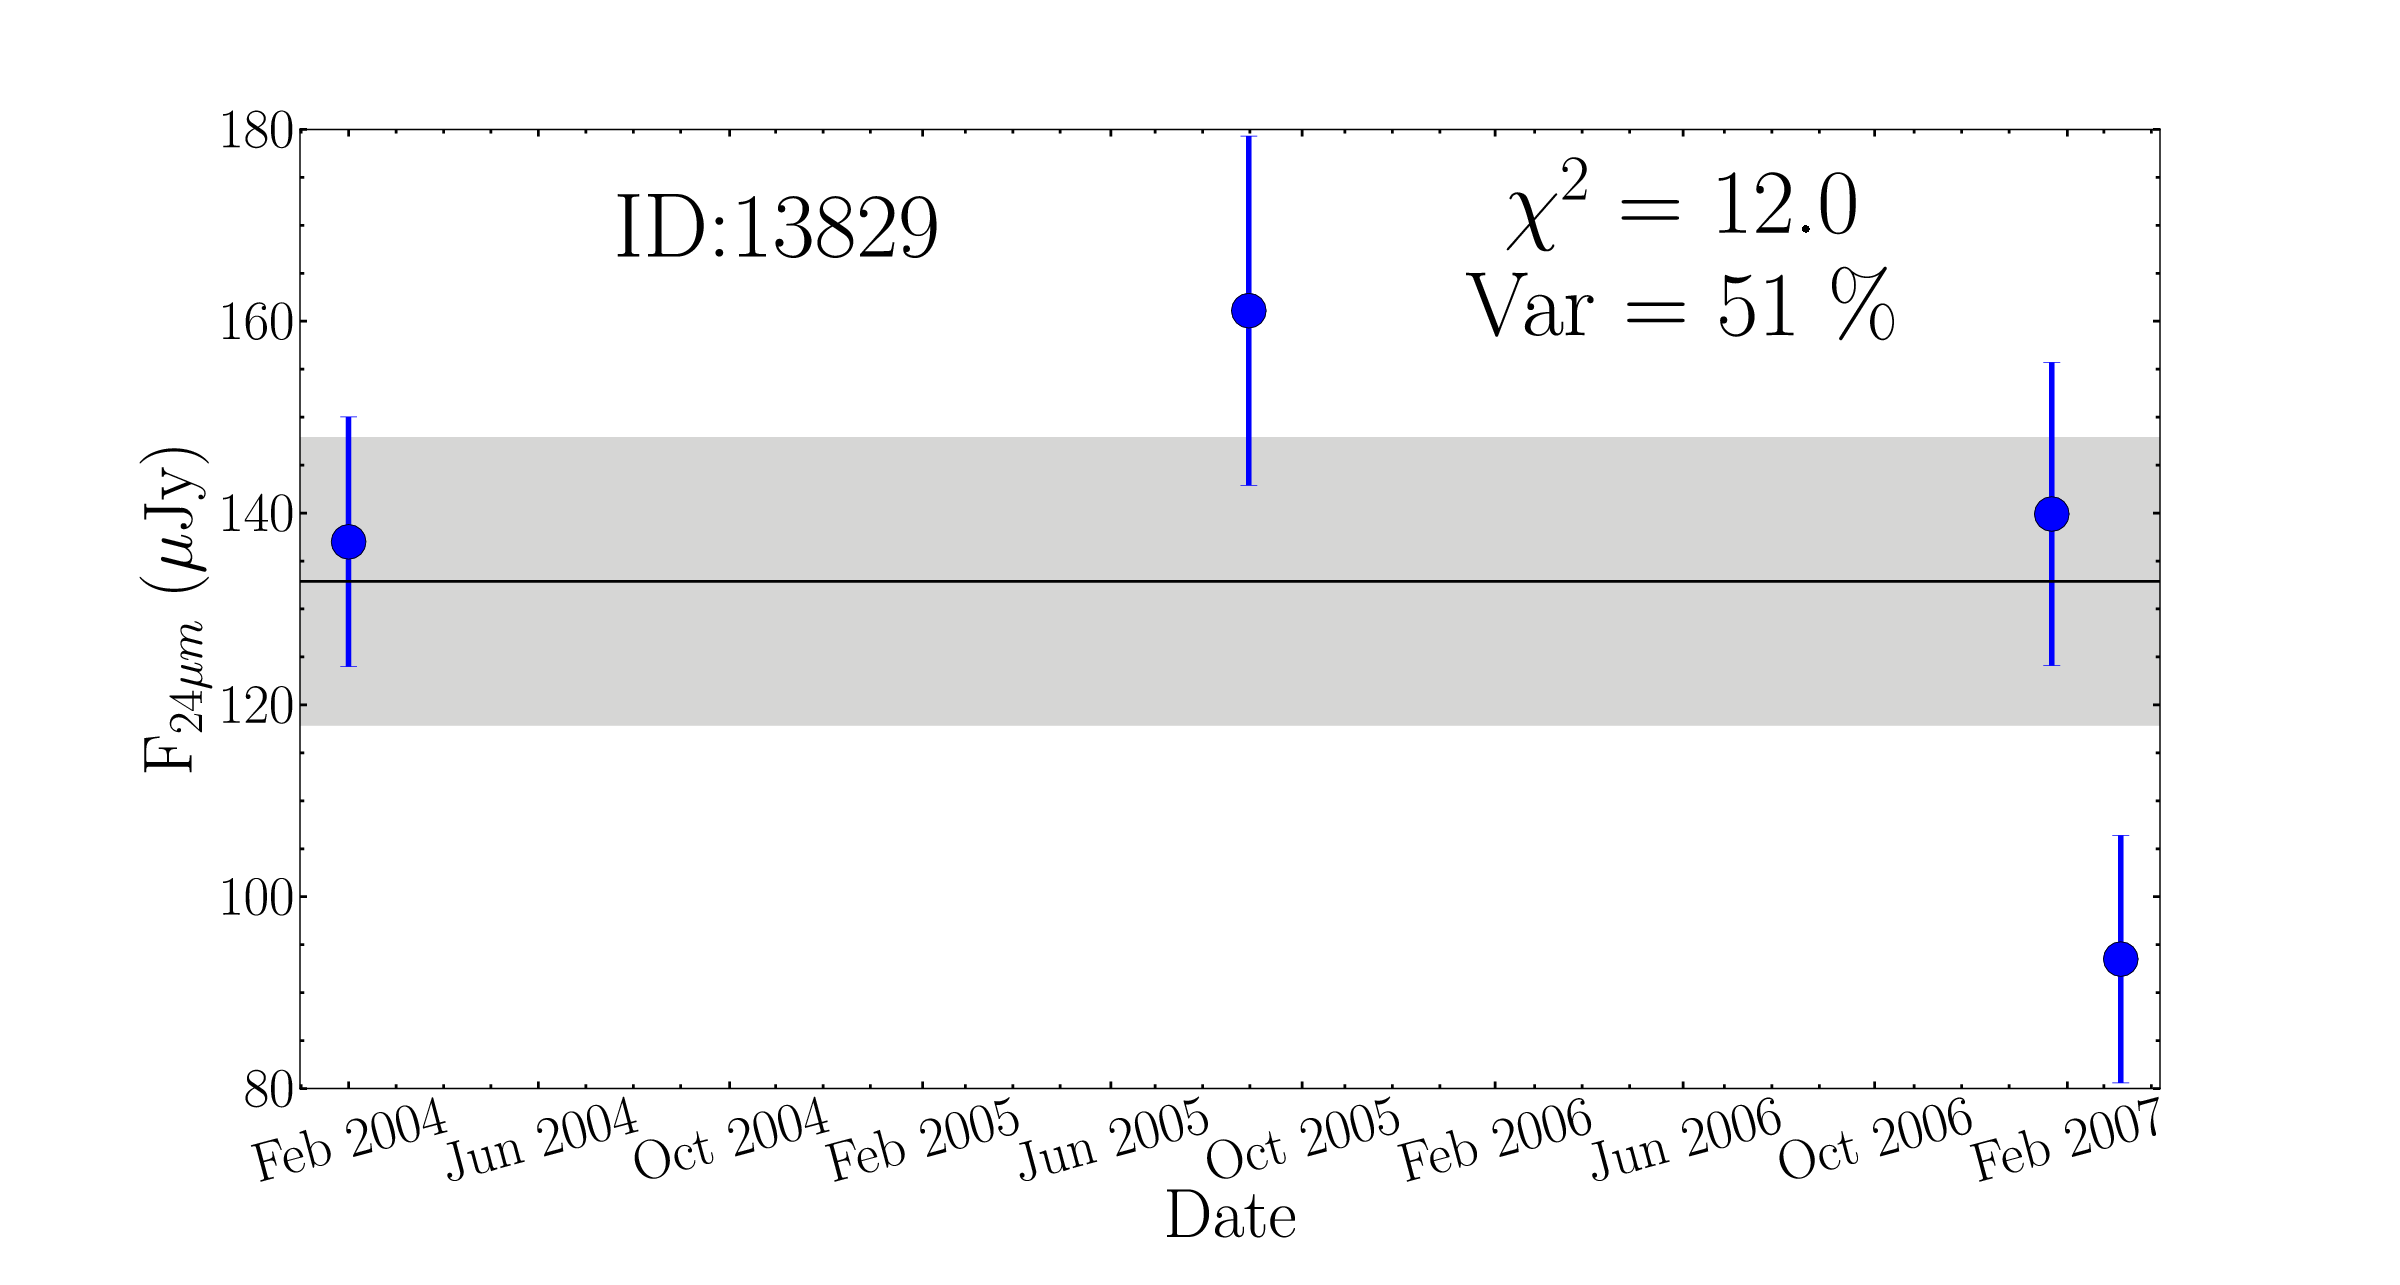
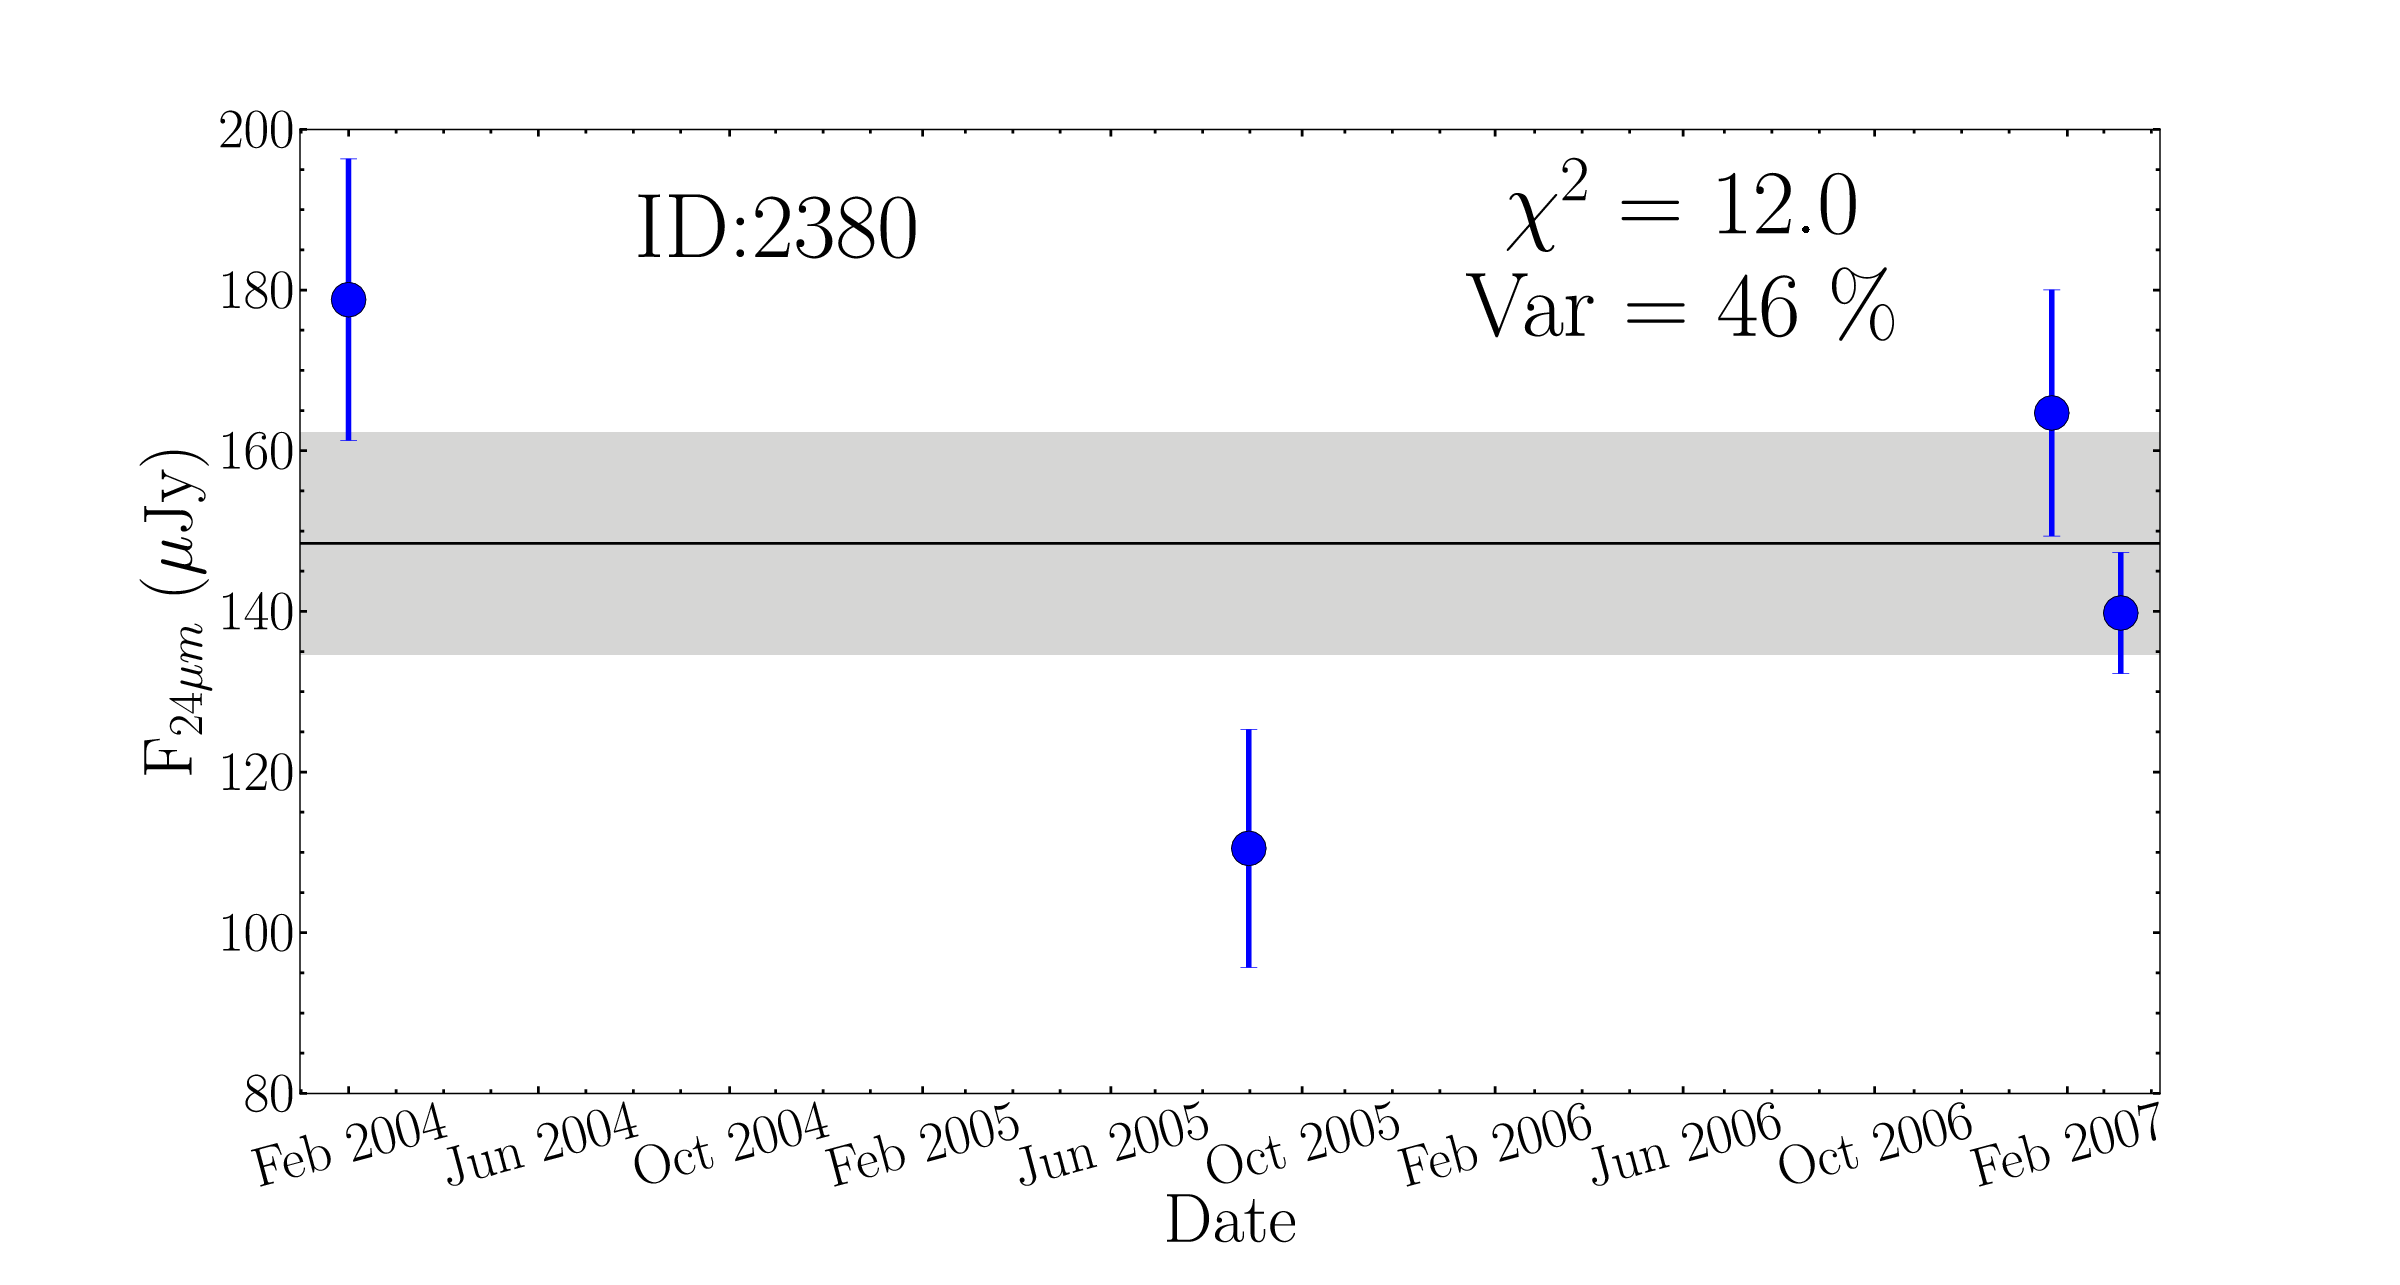
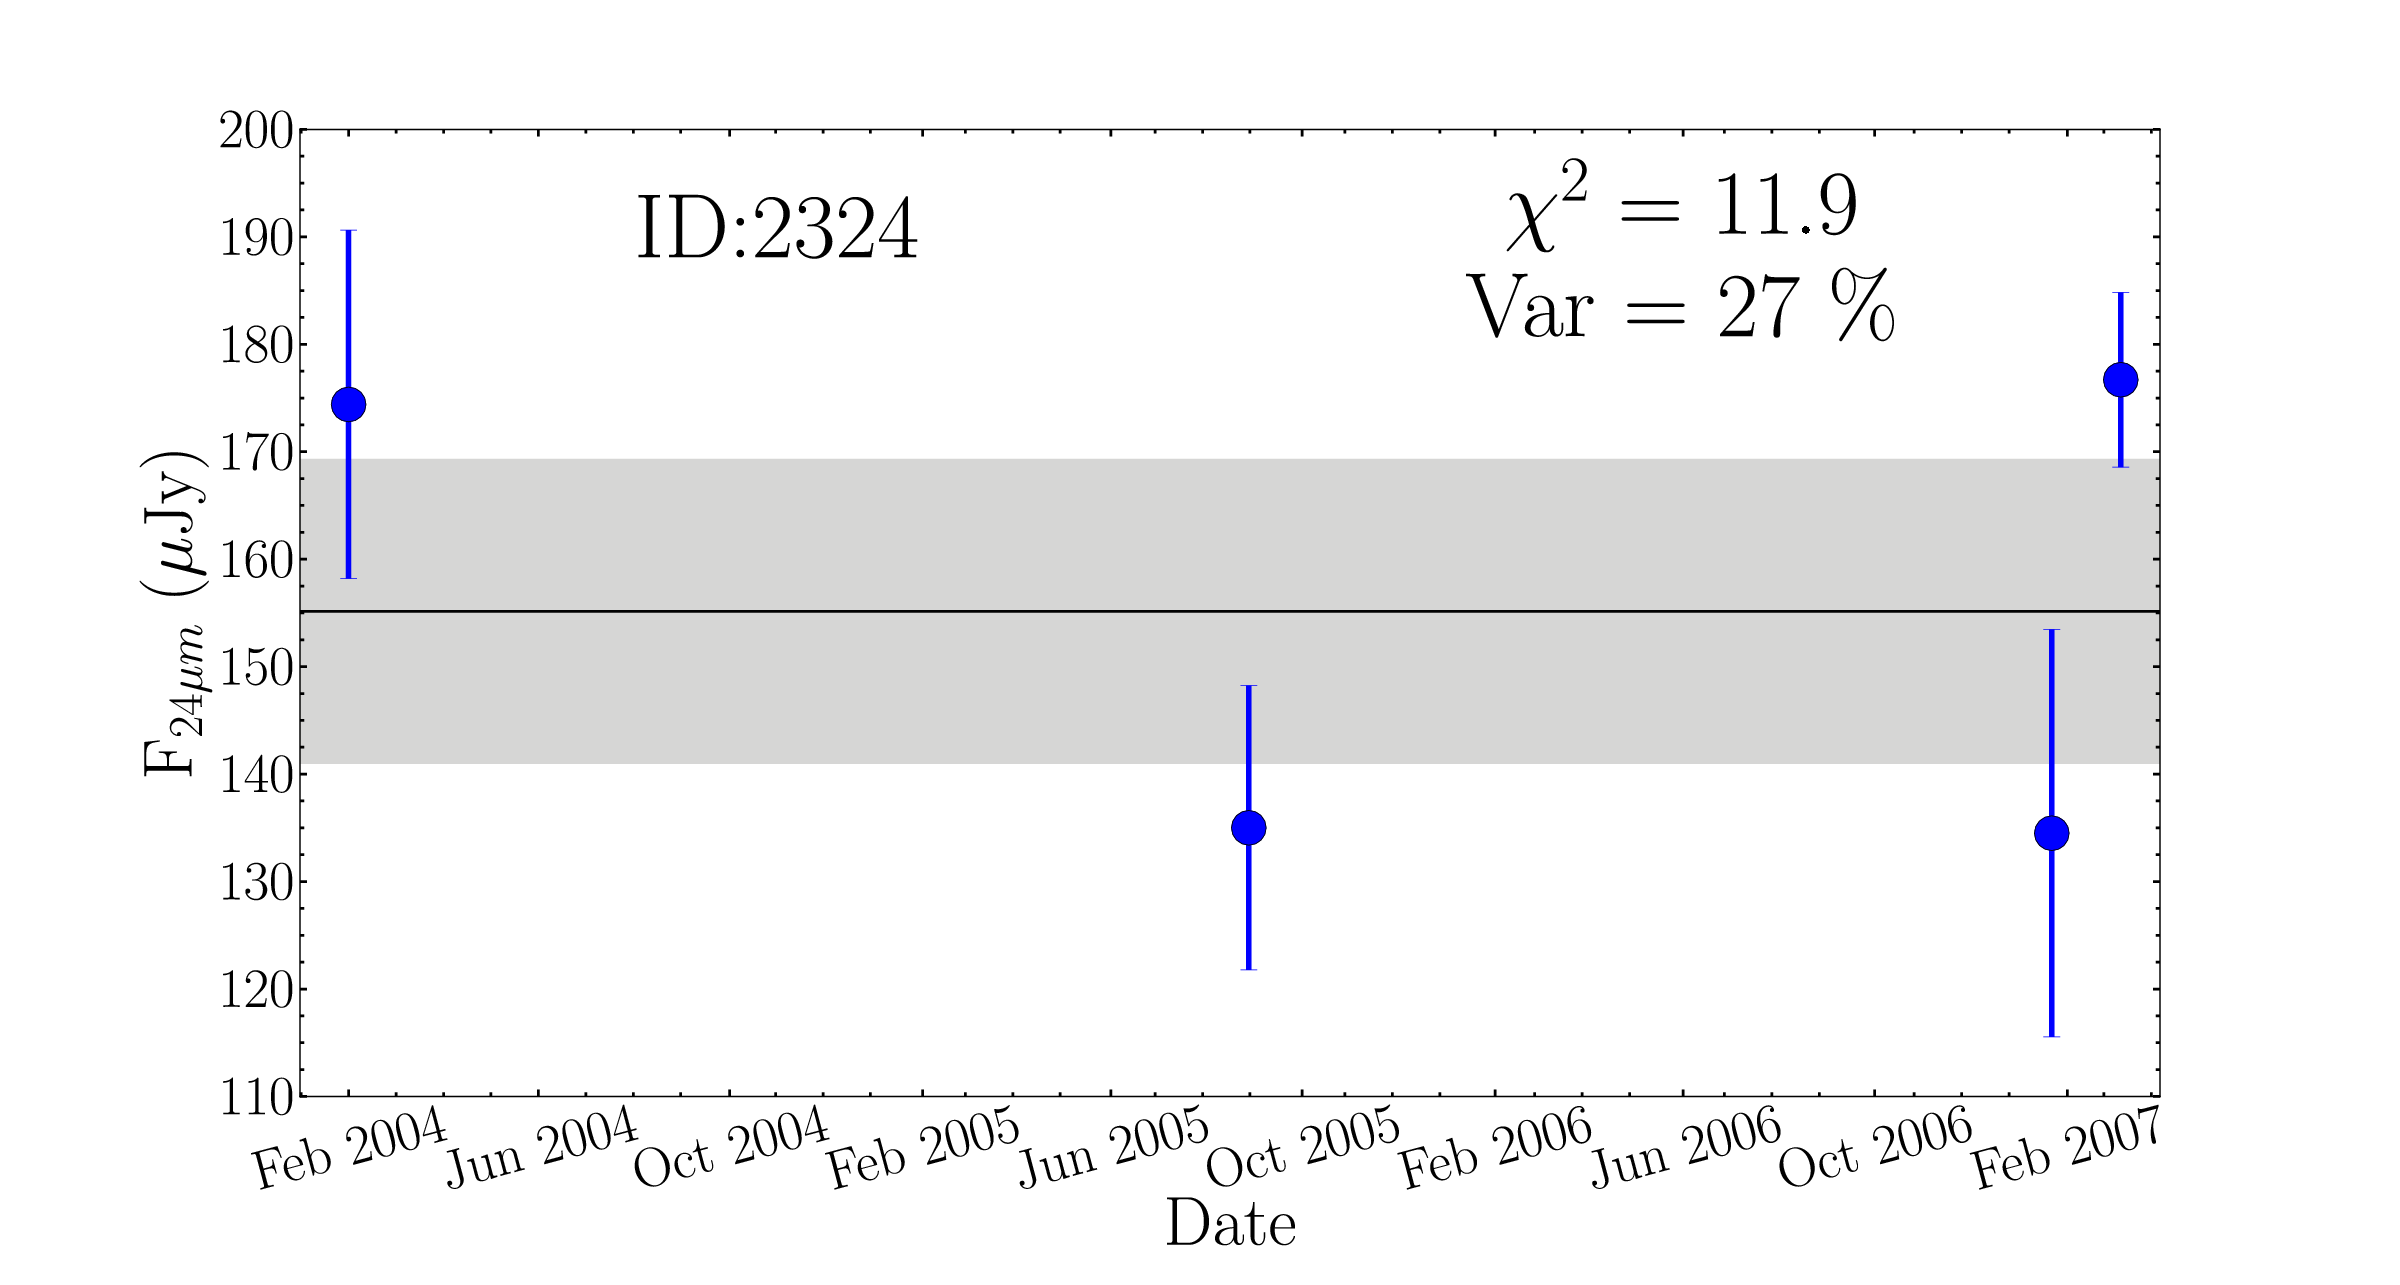
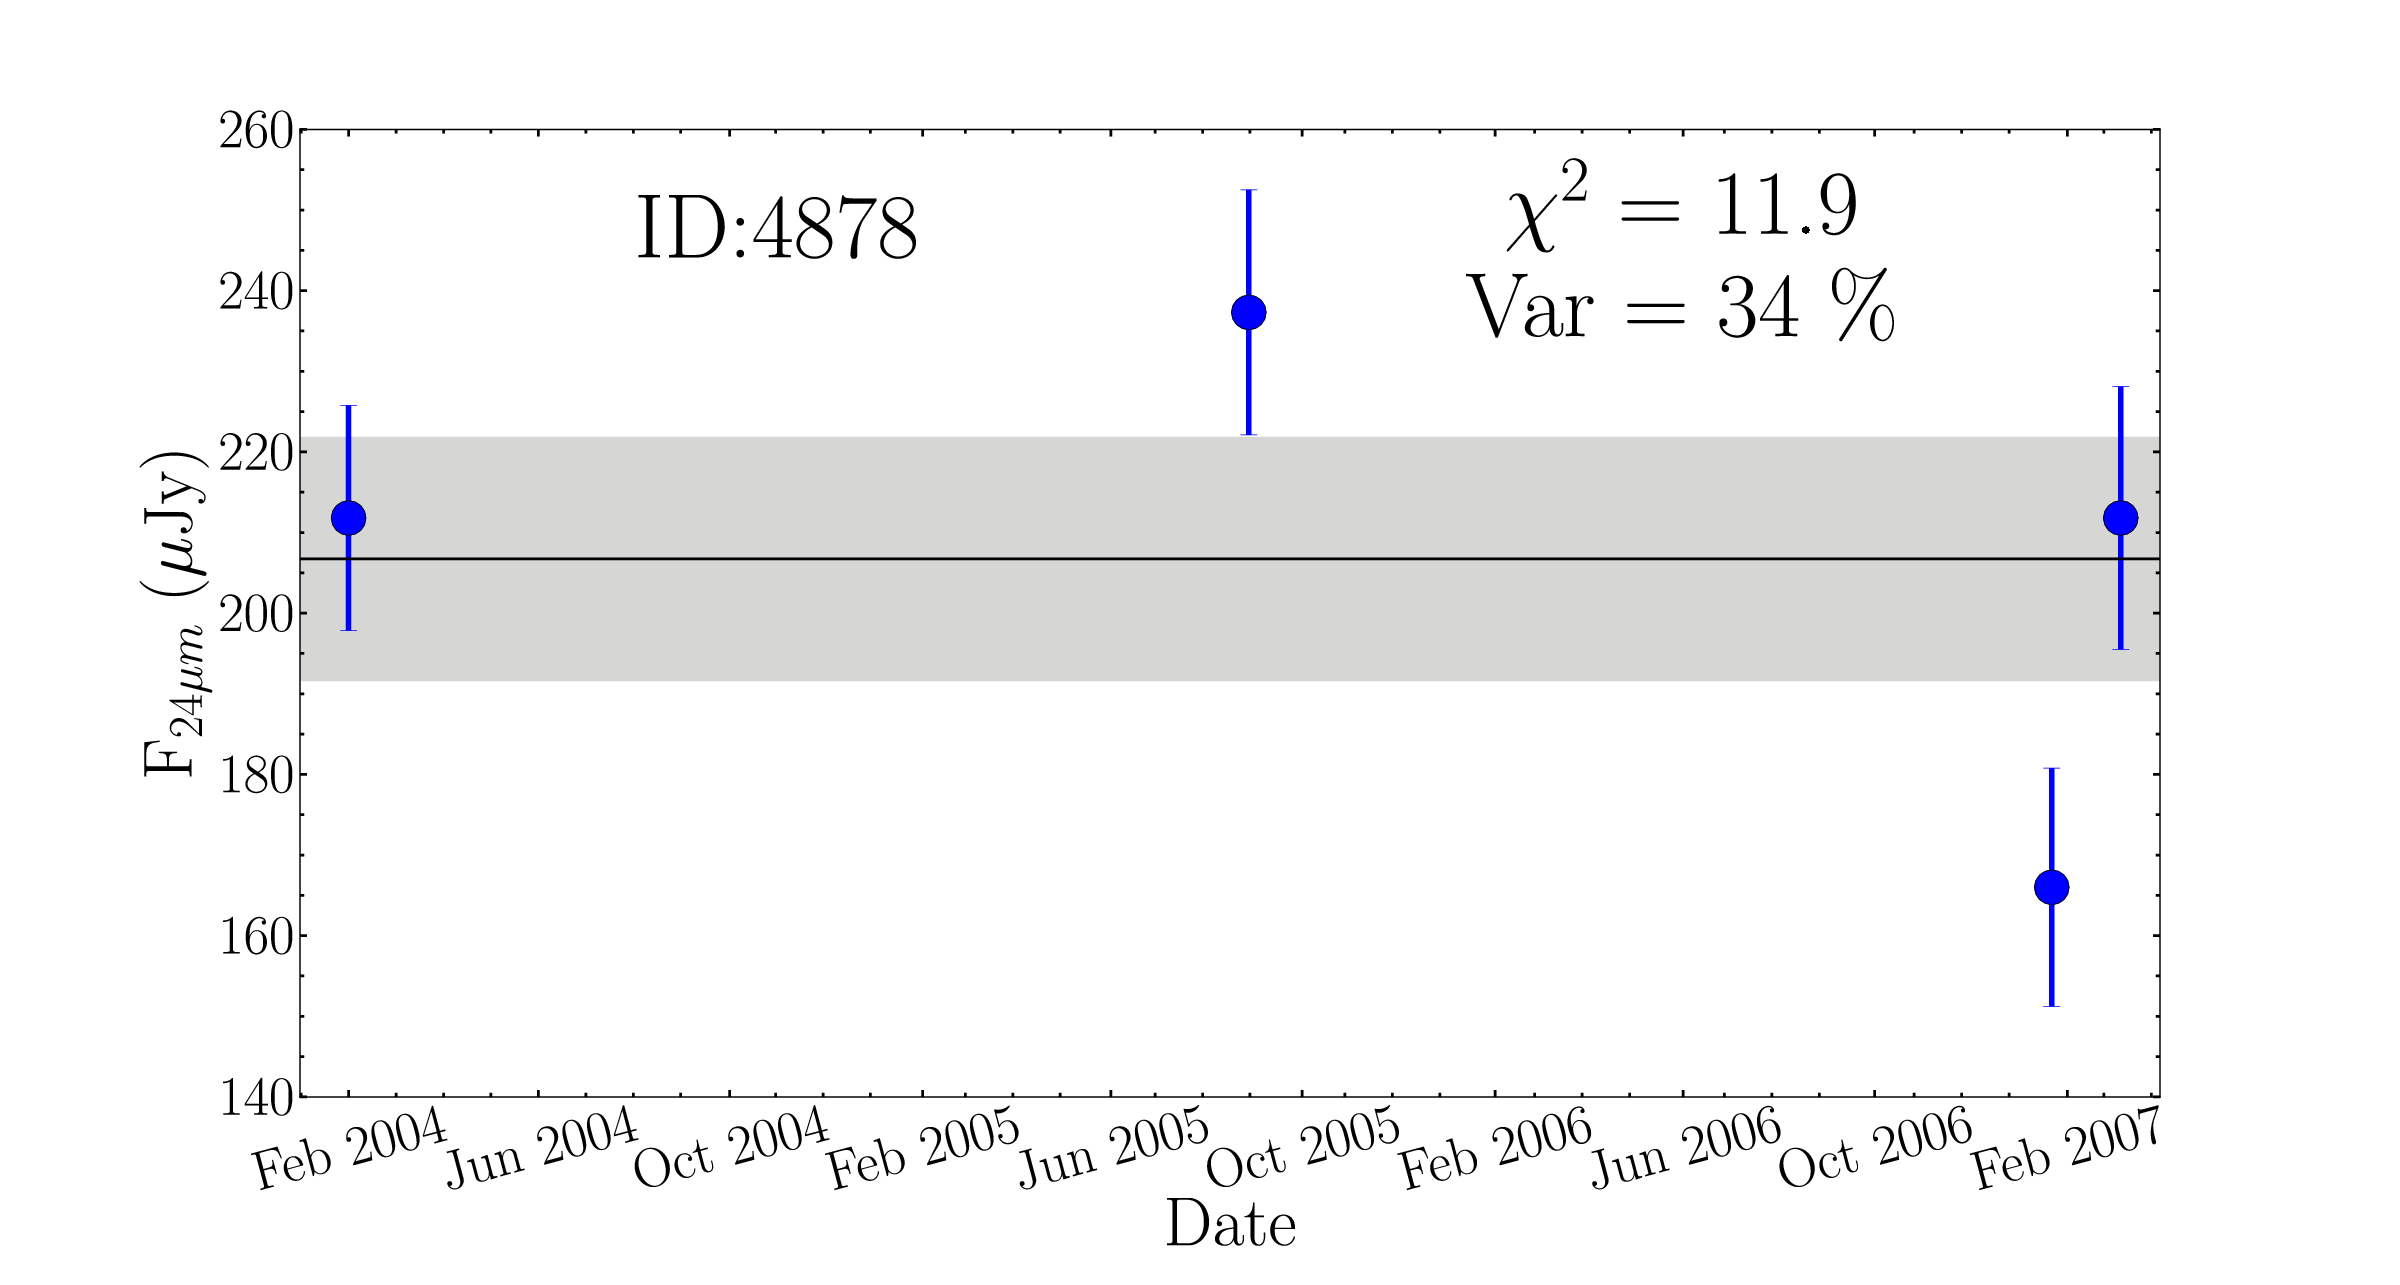
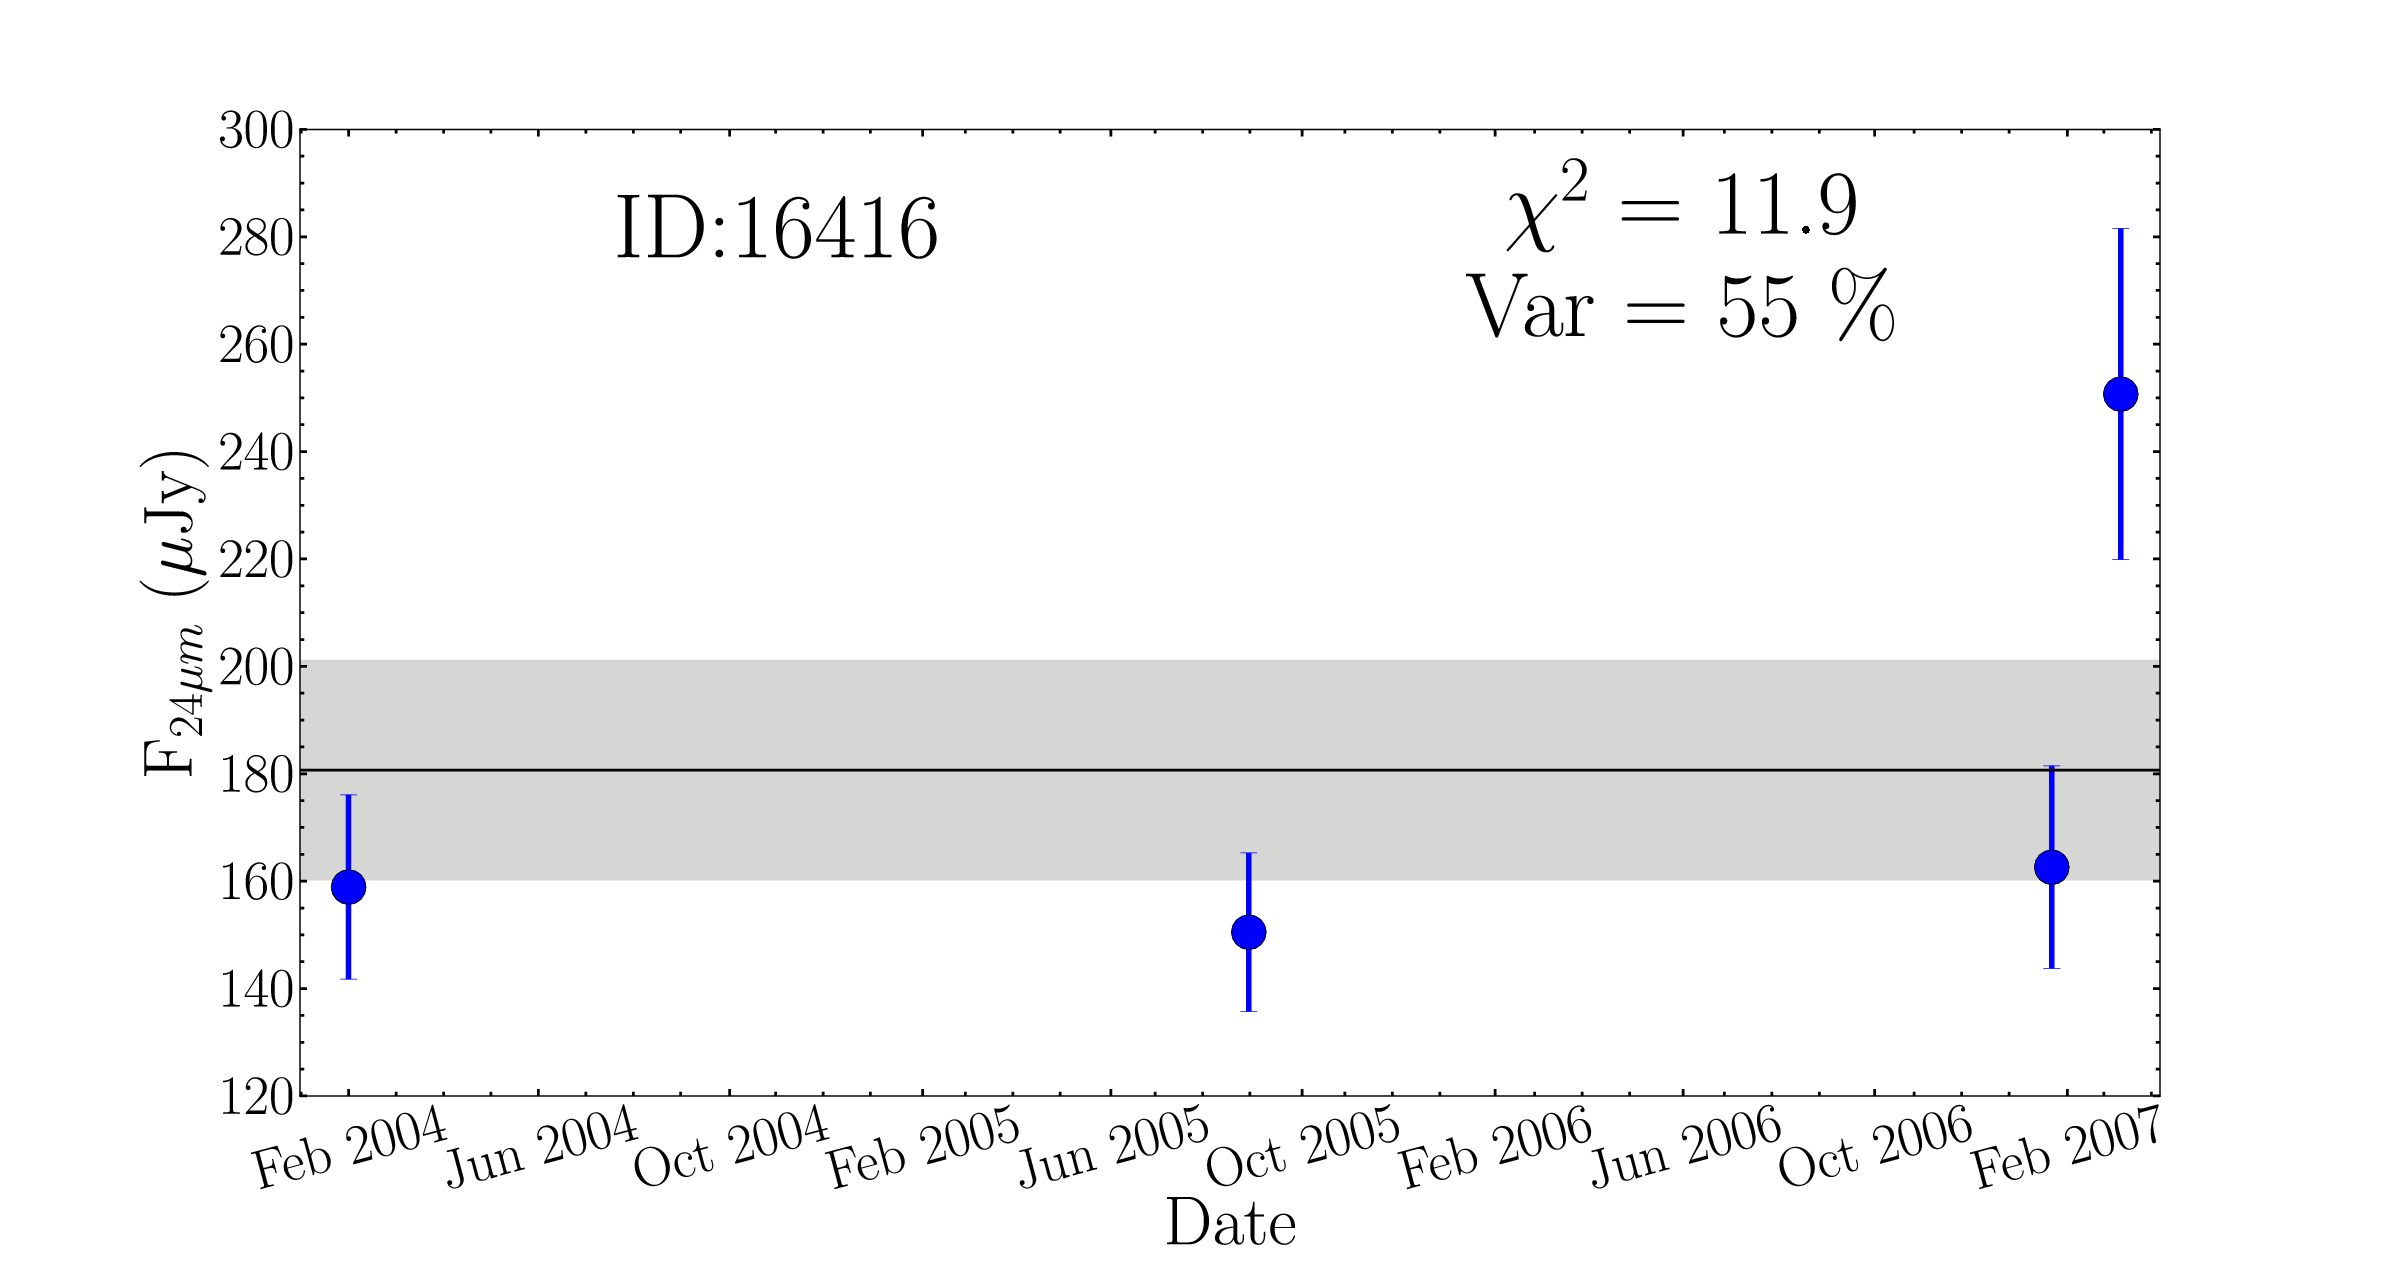
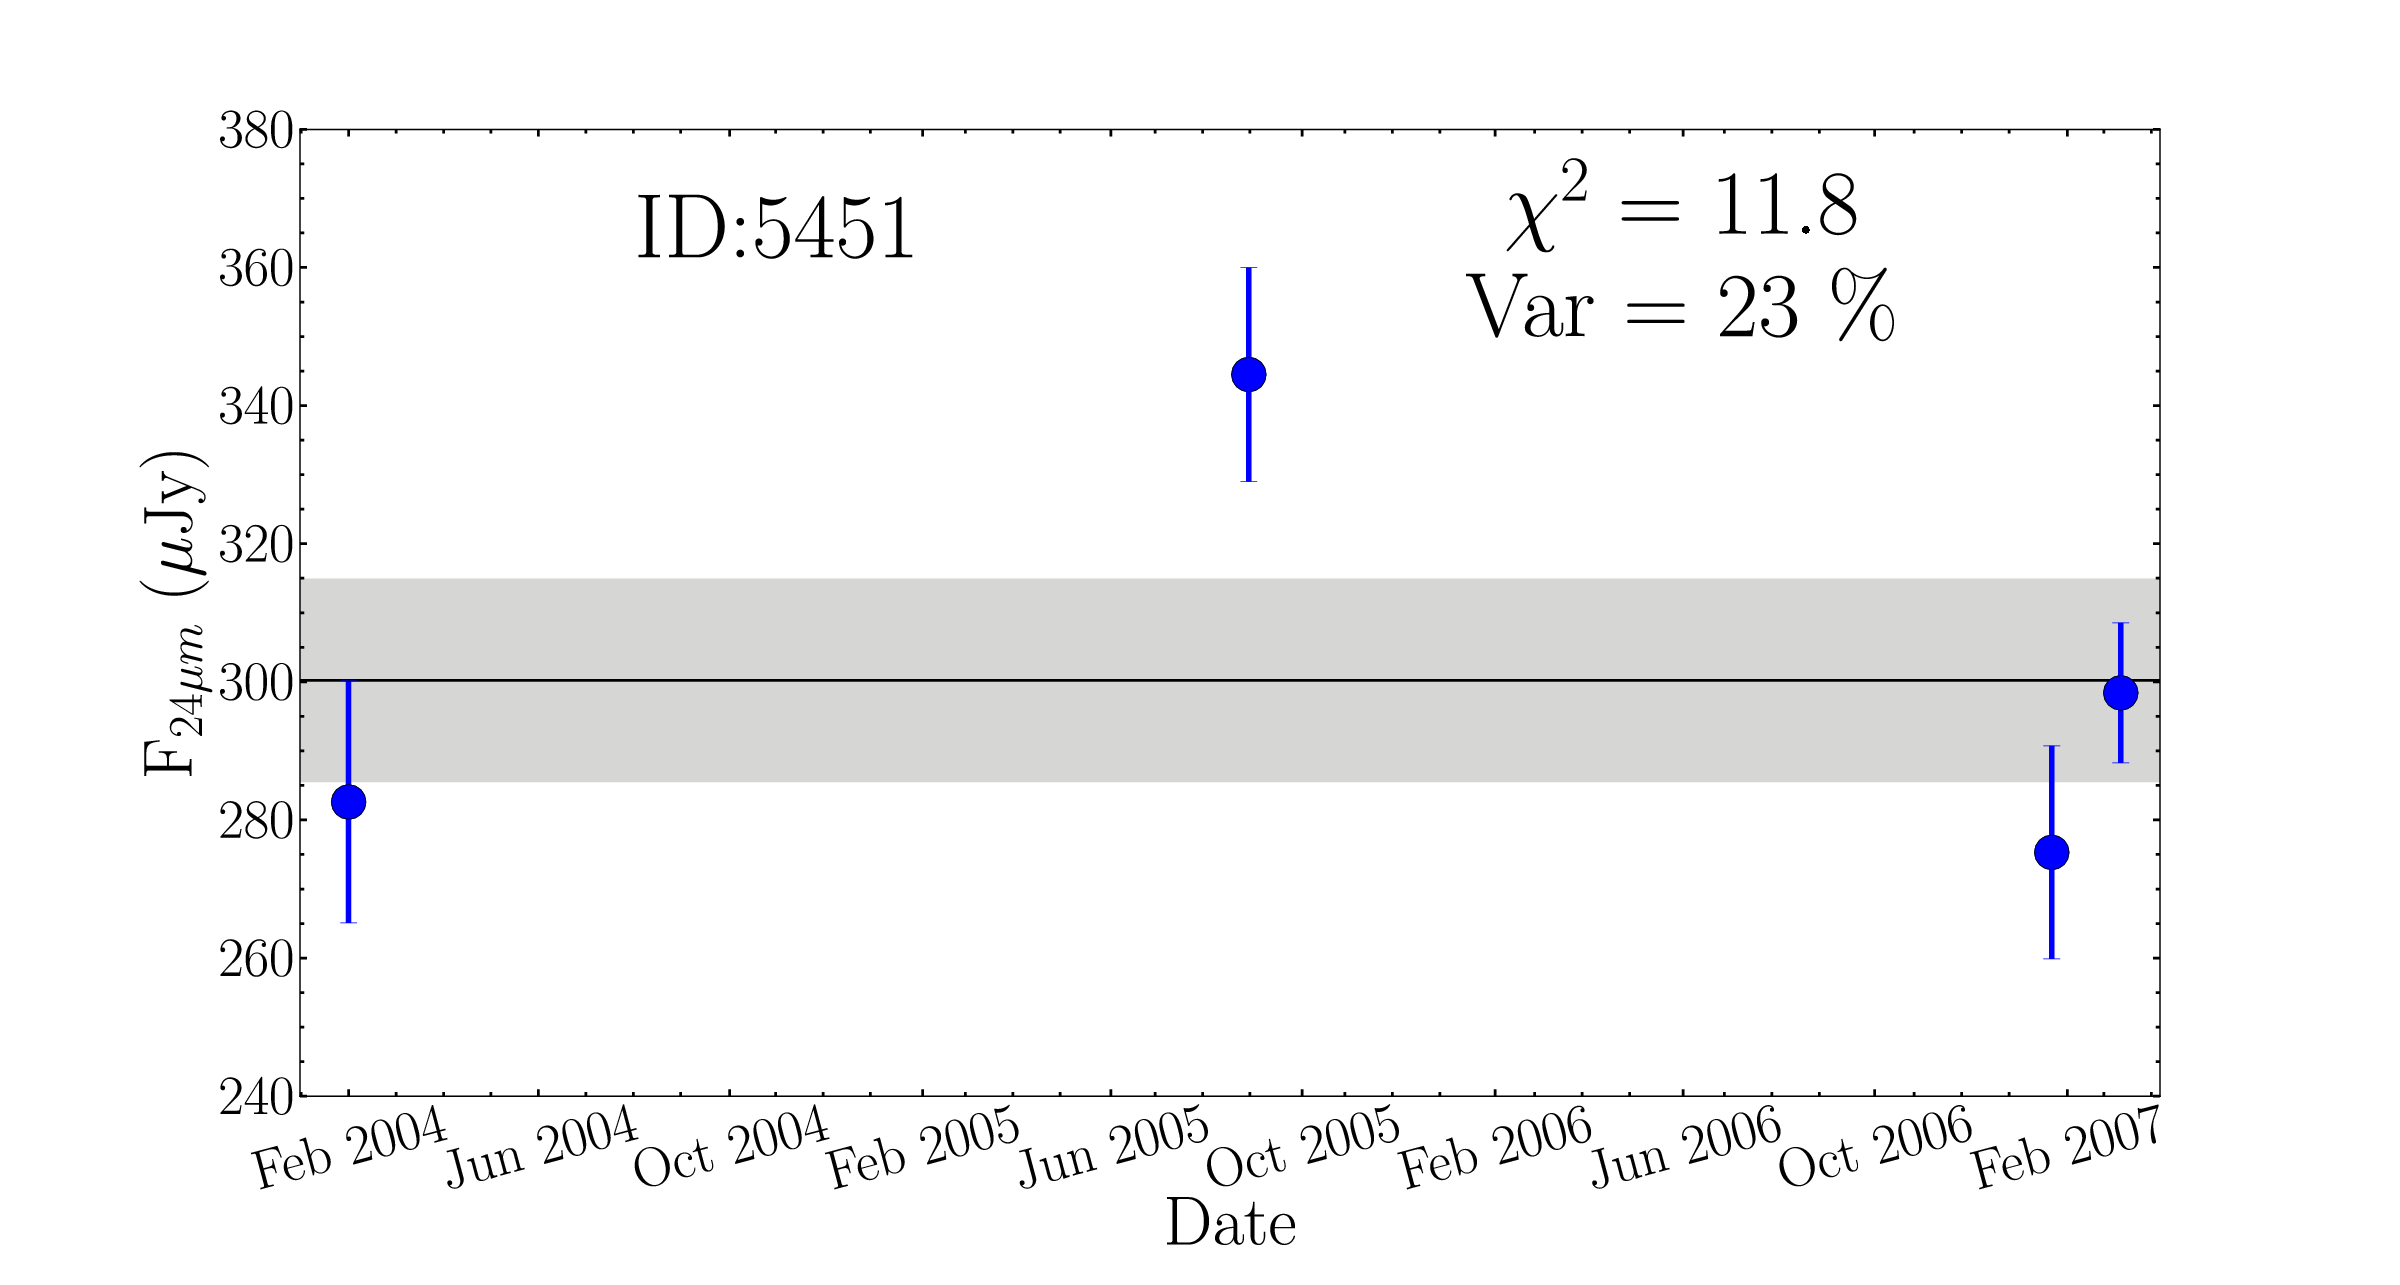
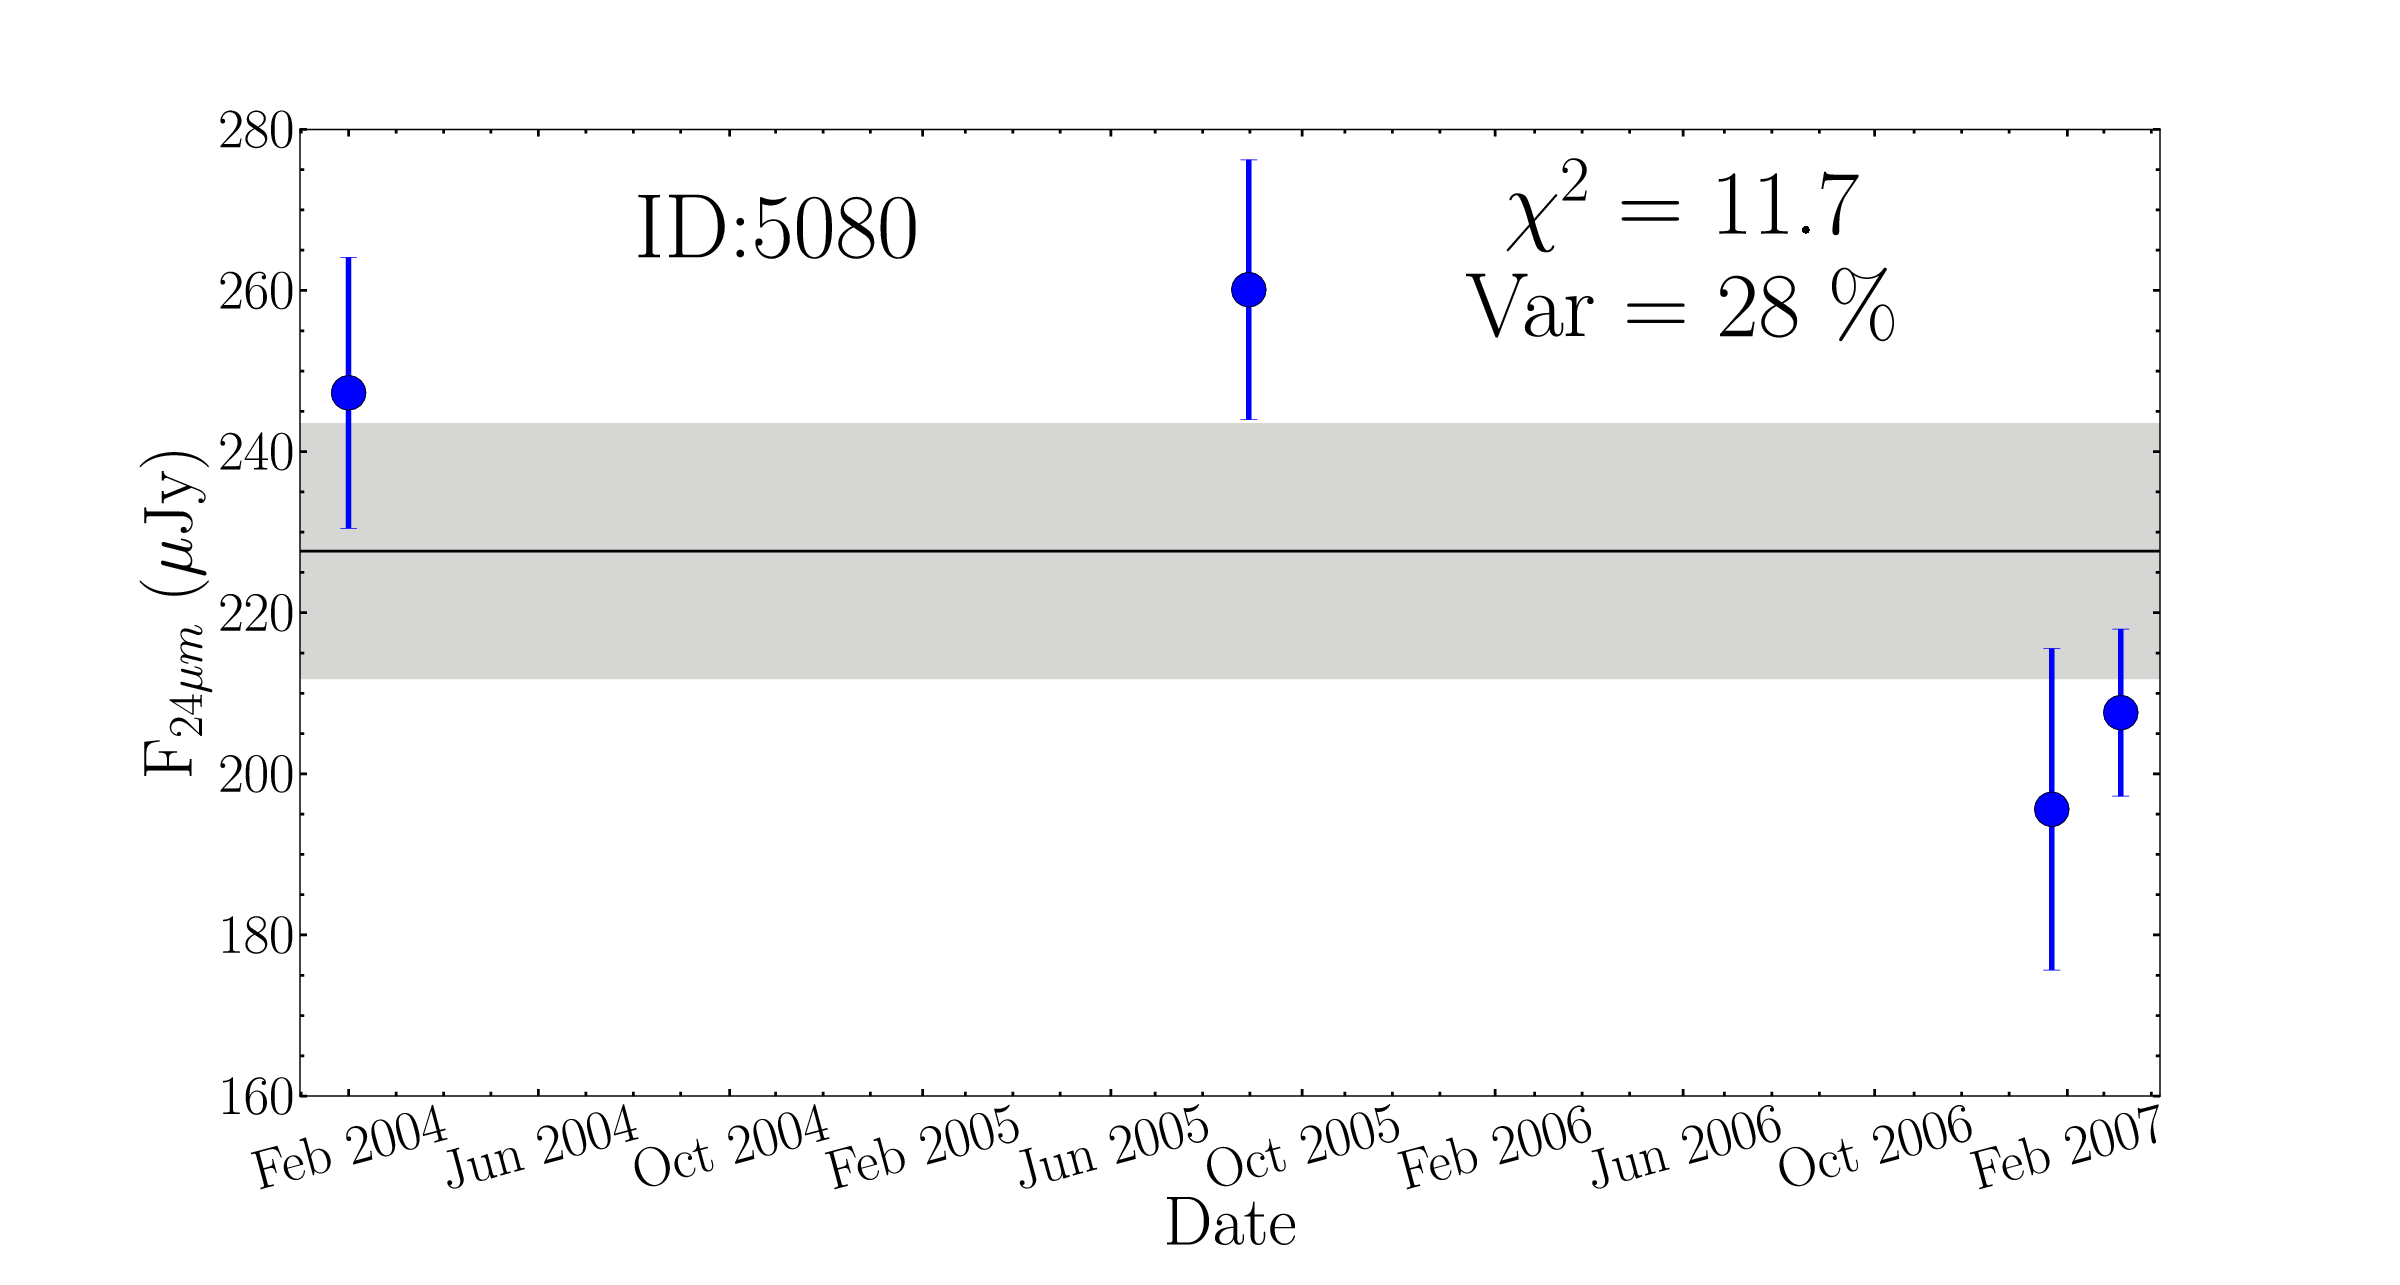
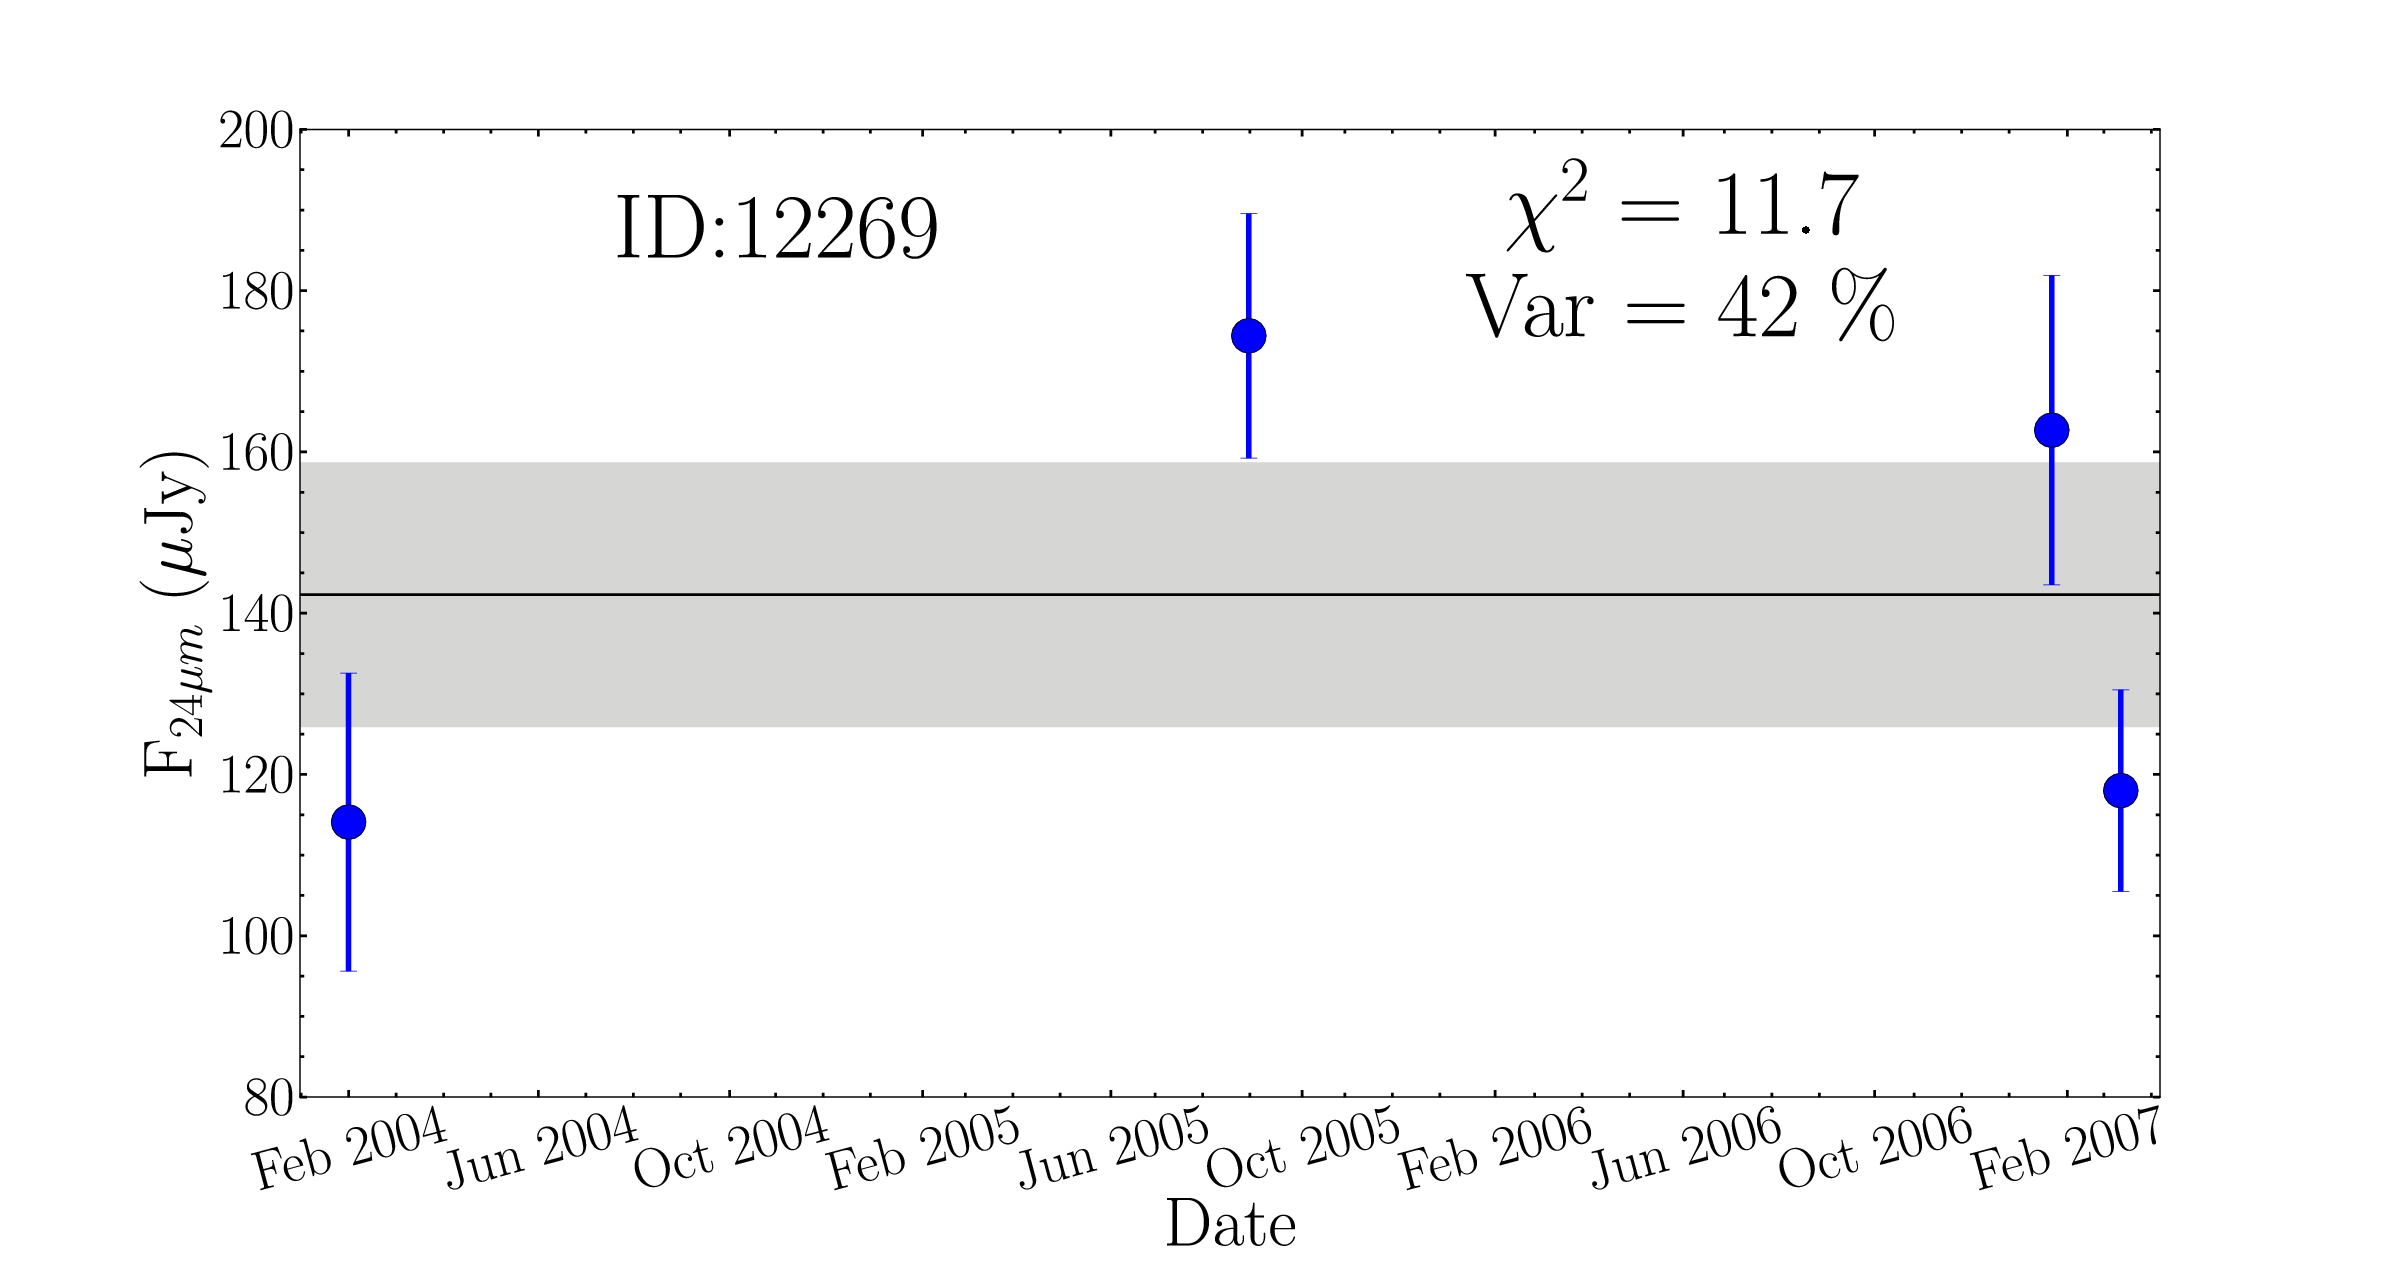
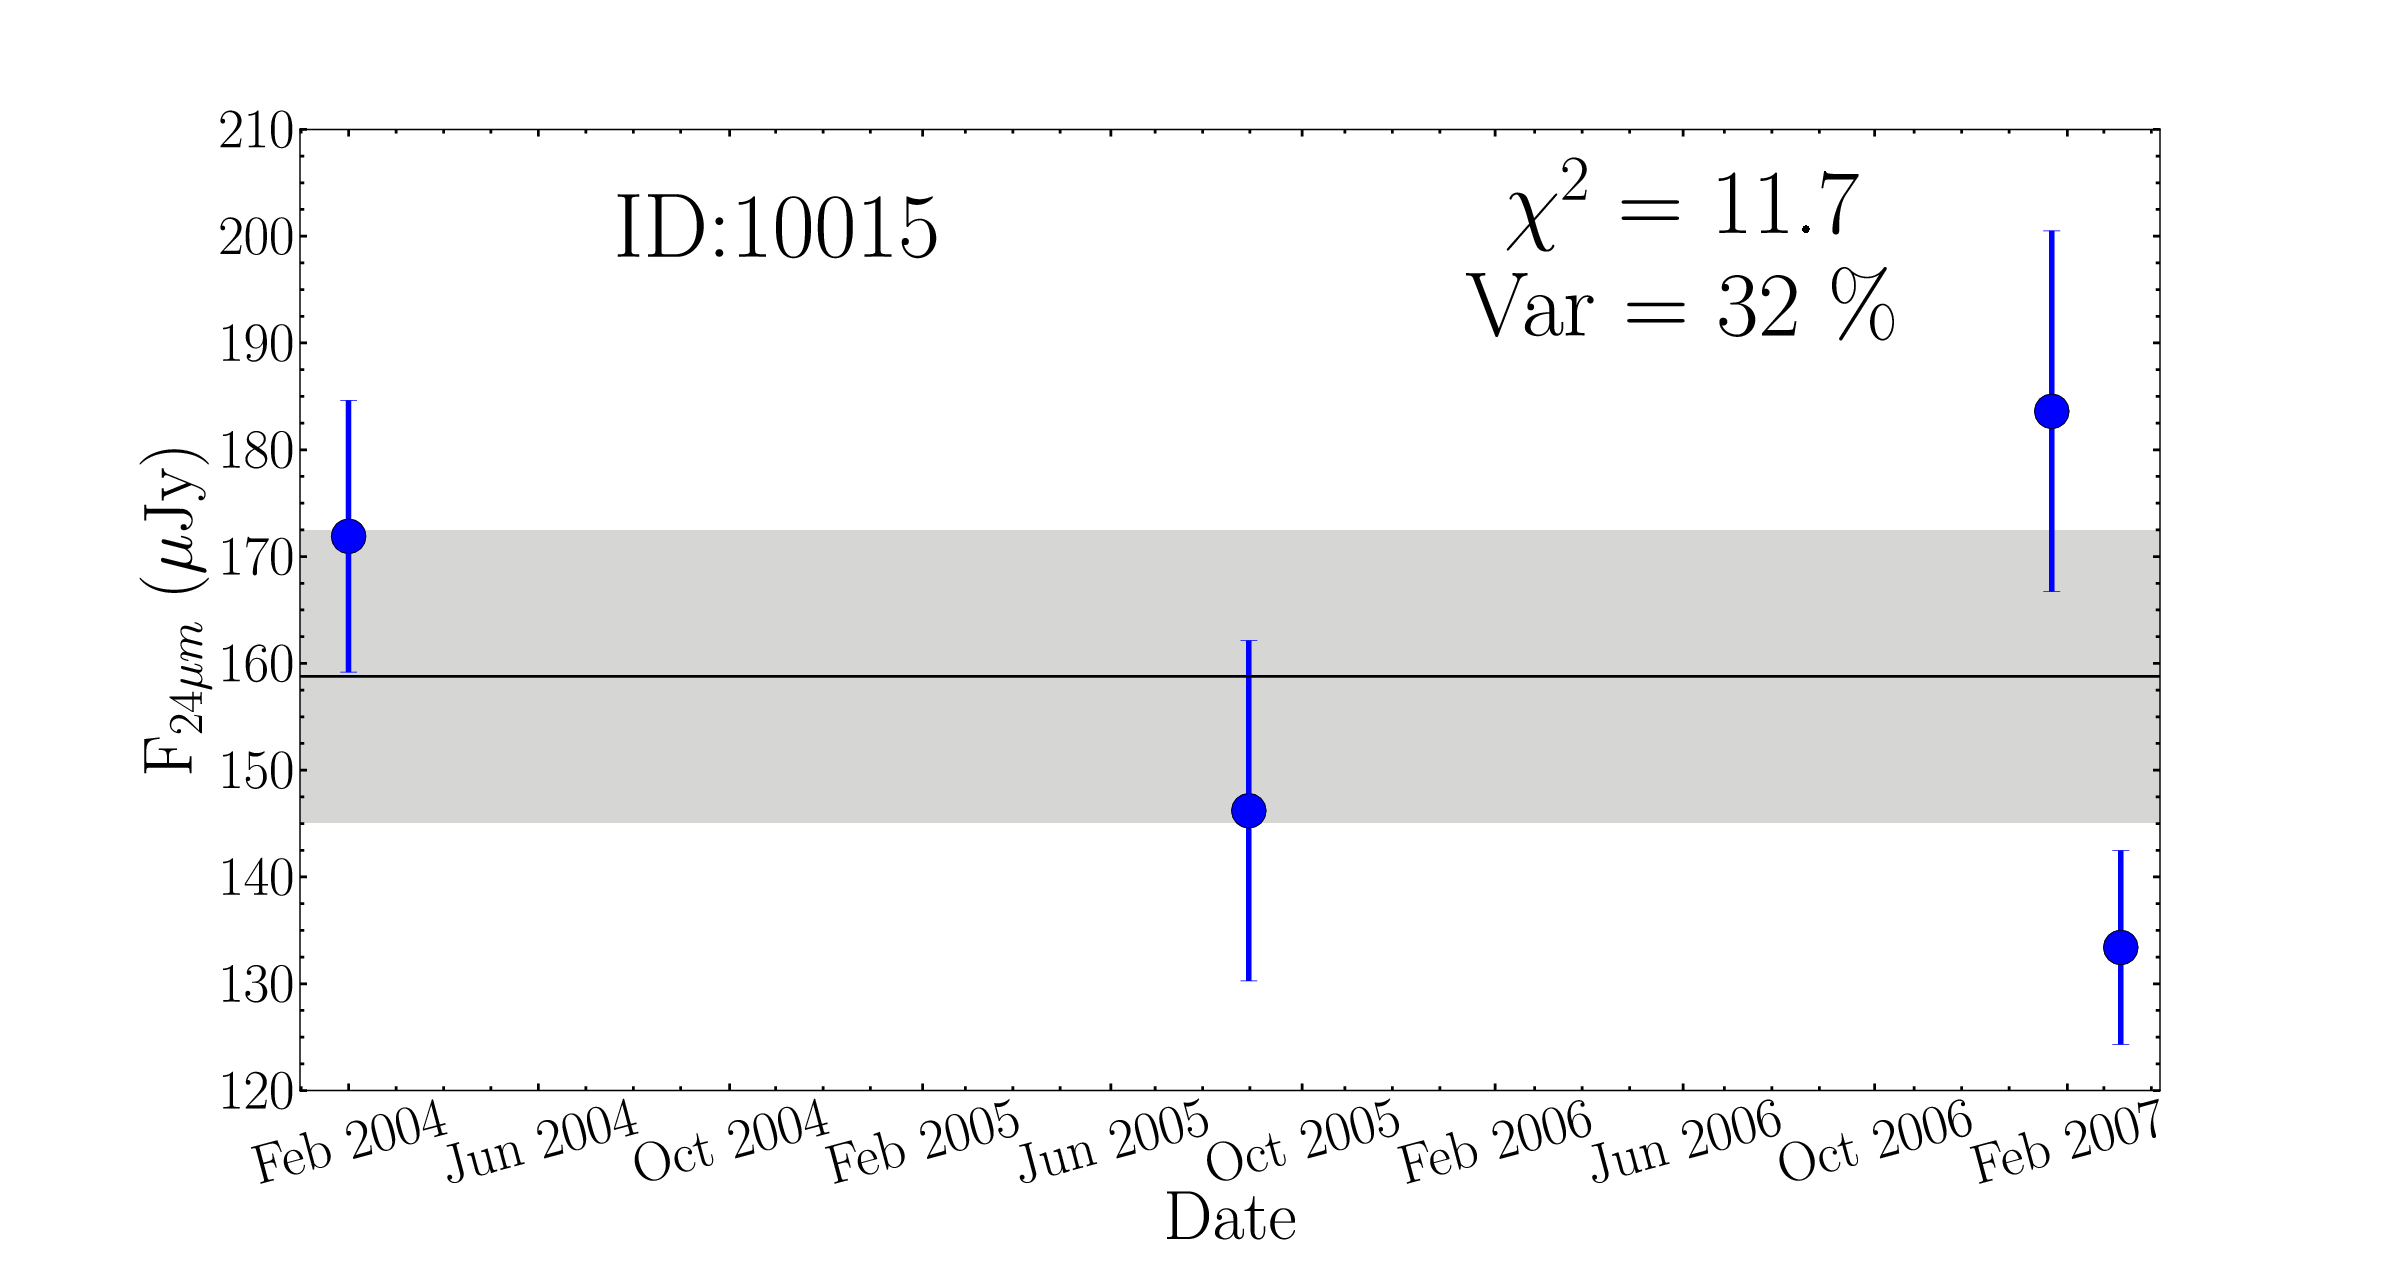
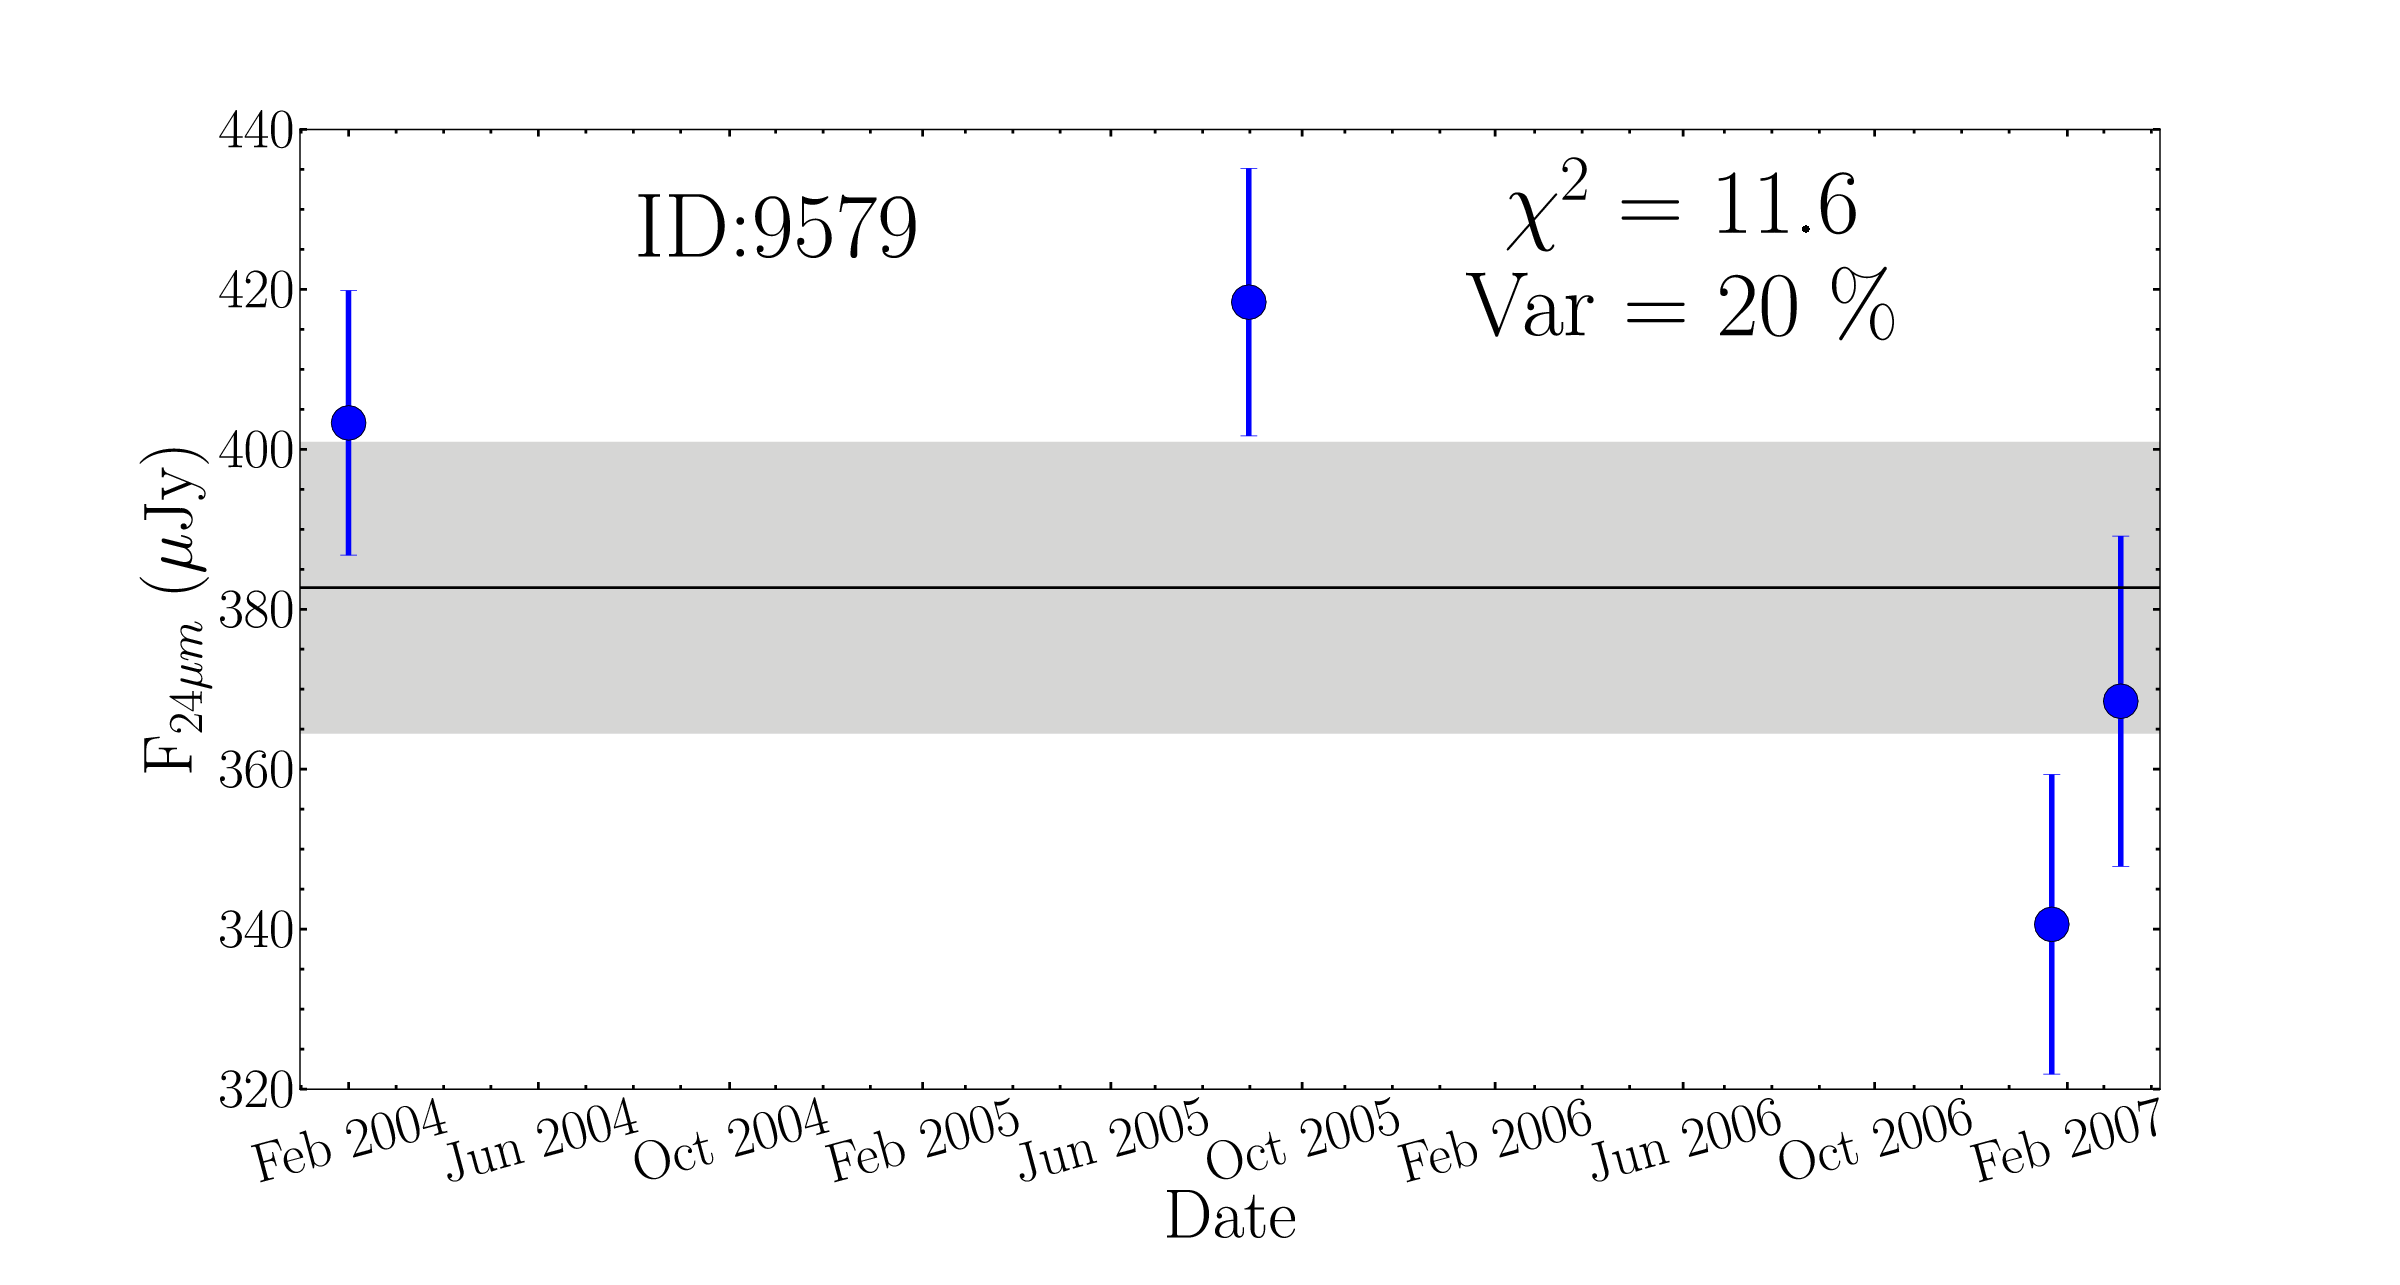
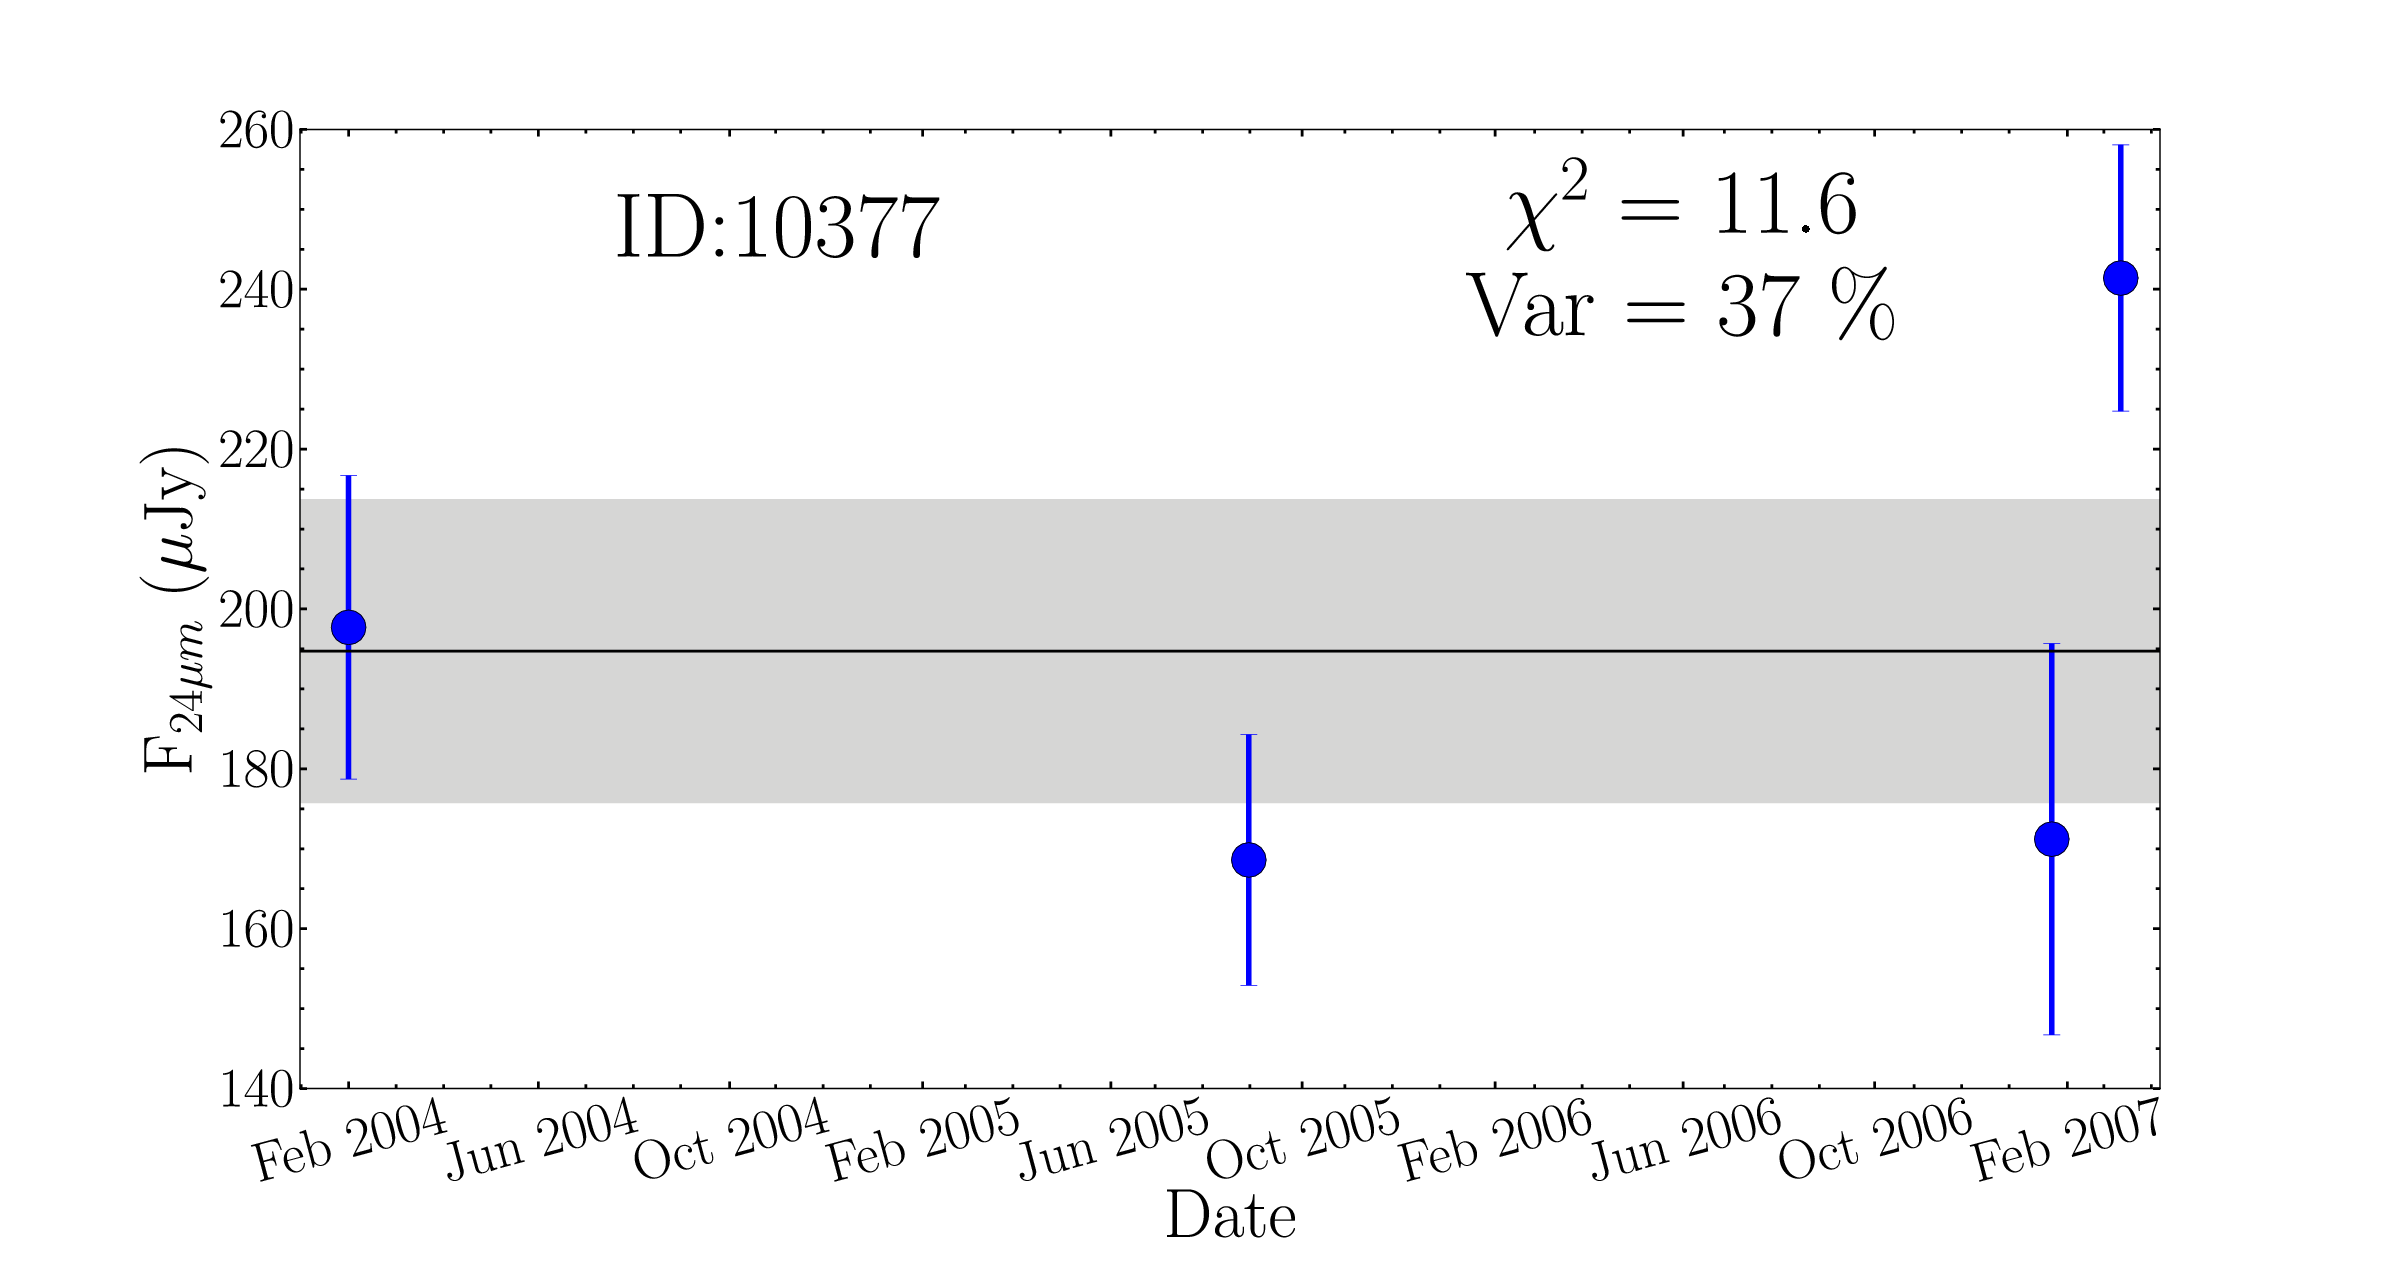
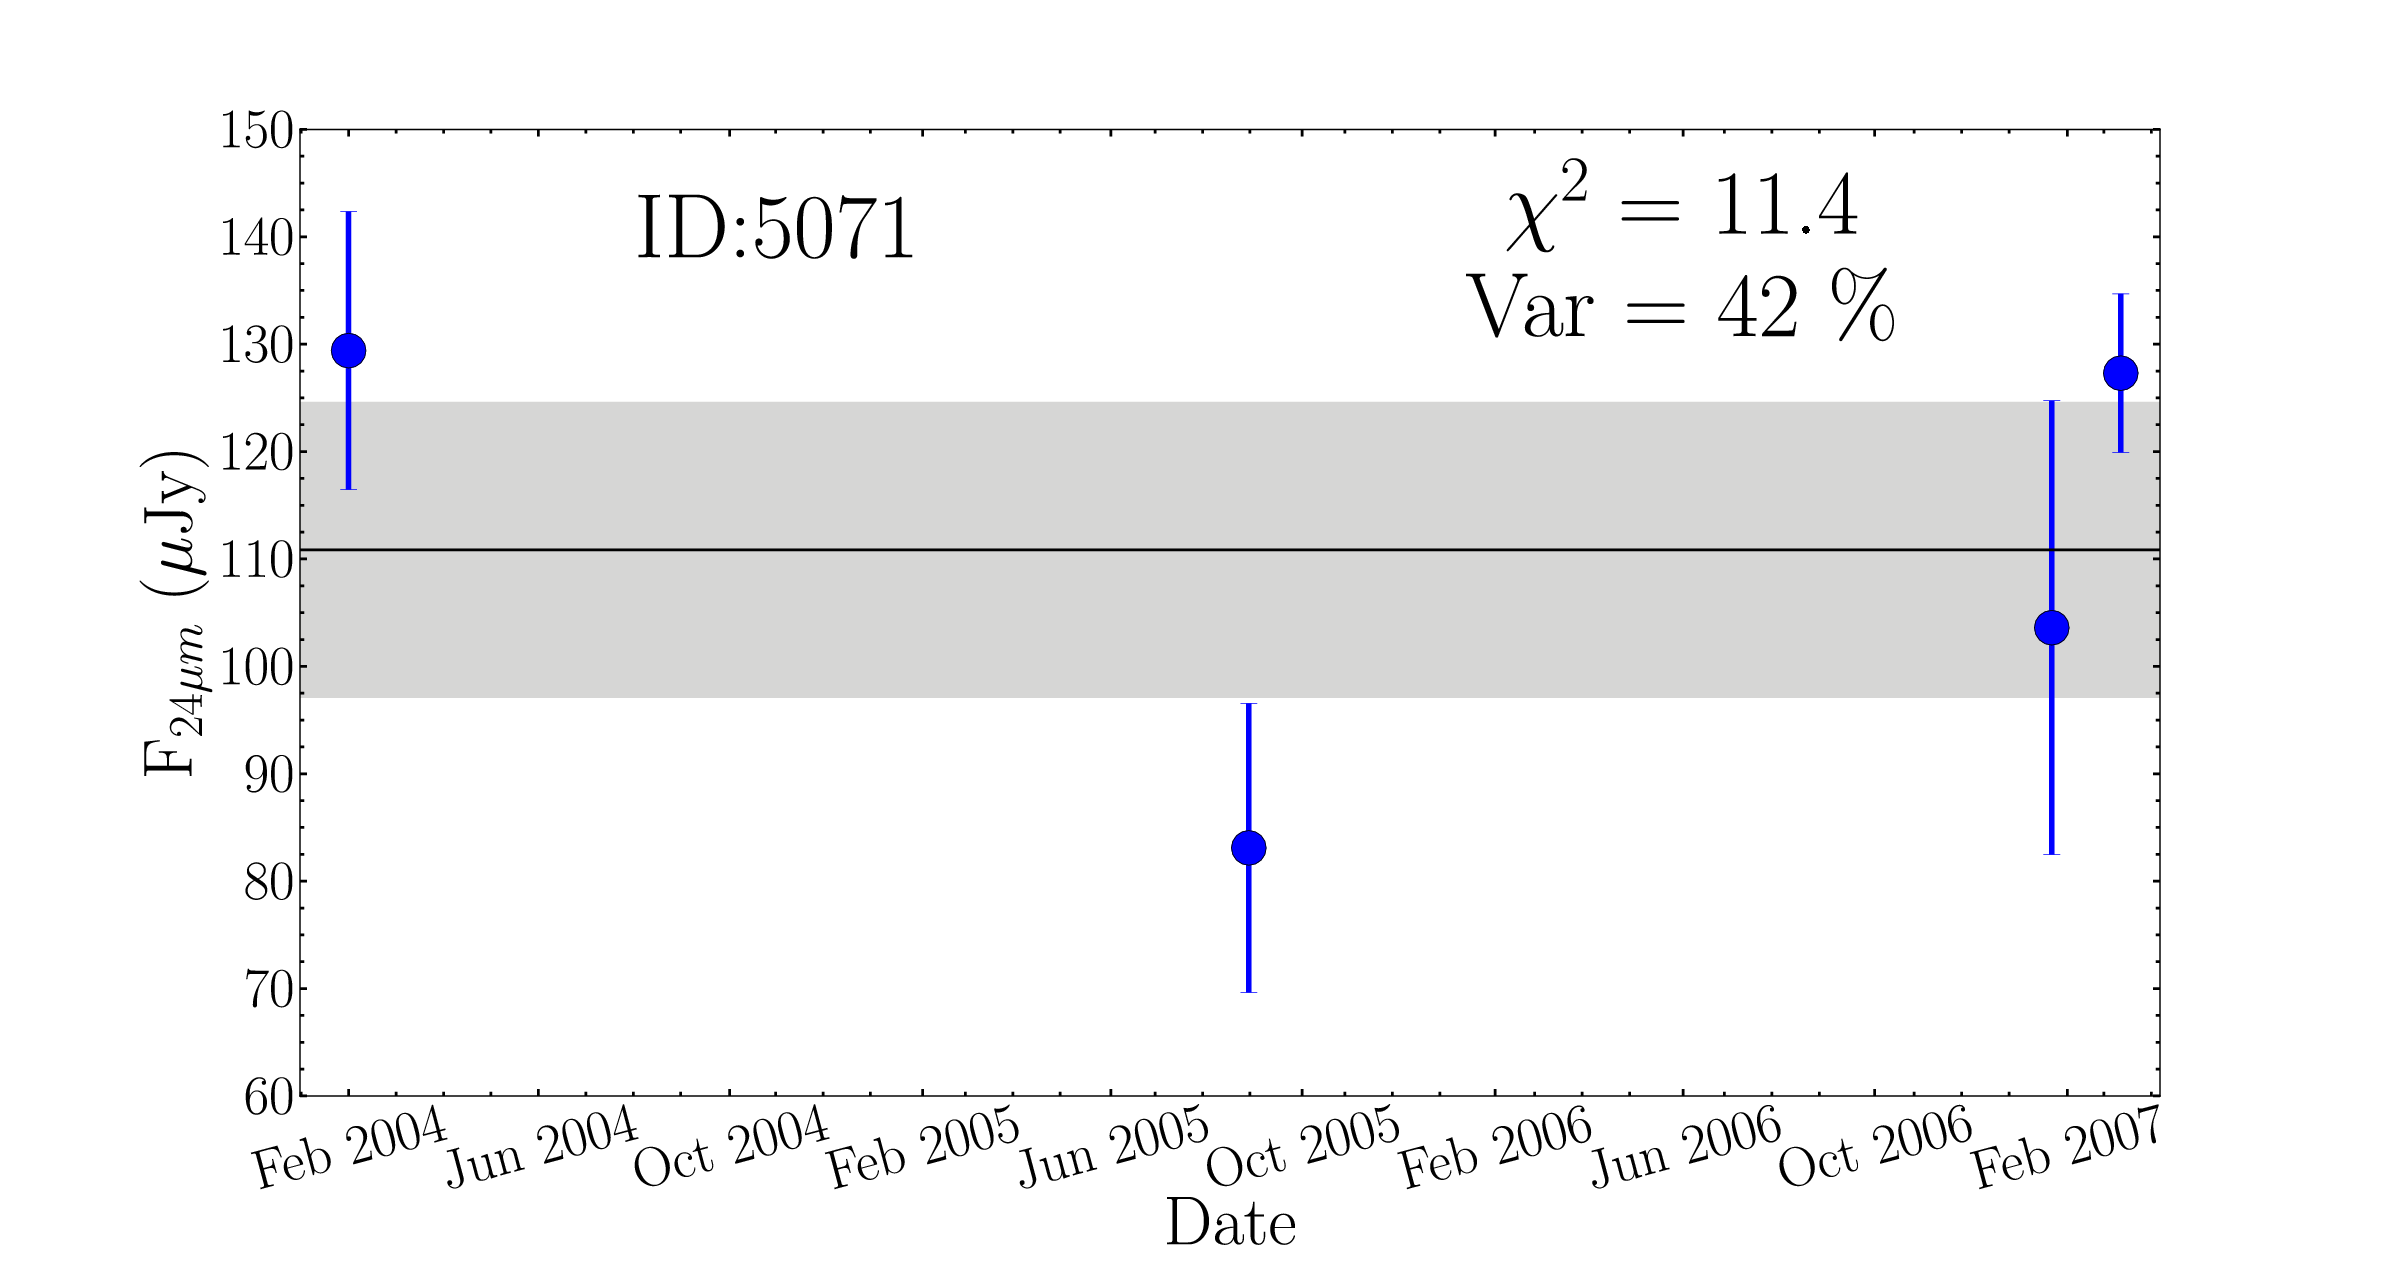
Appendix G Short-term variable candidates light curves
