Ram pressure statistics for bent tail radio galaxies
Abstract
In this paper we use the MareNostrum Universe Simulation, a large scale, hydrodynamic, non-radiative simulation in combination with a simple abundance matching approach to determine the ram pressure statistics for bent radio sources (BRSs). The abundance matching approach allows us to determine the locations of all galaxies with stellar masses in the simulation volume. Assuming ram pressure exceeding a critical value causes bent morphology, we compute the ratio of all galaxies exceeding the ram pressure limit (RPEX galaxies) relative to all galaxies in our sample. According to our model 50% of the RPEX galaxies at are found in clusters with masses larger than the other half resides in lower mass clusters. Therefore, the appearance of bent tail morphology alone does not put tight constraints on the host cluster mass. In low mass clusters, , RPEX galaxies are confined to the central whereas in clusters of they can be found at distances up to . Only clusters with masses are likely to host more than one BRS. Both criteria may prove useful in the search for distant, high mass clusters.
keywords:
galaxies: clusters: intracluster medium — method: numerical — radio continuum: galaxies1 Introduction
The unprecedented sensitivity and sampling speed of the new generation of radio telescopes, such as LOFAR and SKA, will yield an enormous number of new low-luminosity nearby as well as luminous distant radio sources. A significant fraction of the continuum sources are expected to be radio galaxies with double radio lobes formed by Active Galactic Nuclei (AGN), which can be detected at very large redshifts. Roughly 1% of the known radio galaxies show bent tail morphology , i.e., bending of the two lobes in the same direction (e.g., Blanton et al., 2000; Wing & Blanton, 2011). A gallery of bent tail radio sources (BRSs) can be found in Figure 1 of Blanton et al. (2001). The bent morphology is thought to be a result of the ram pressure exerted on the lobes when the ambient gas density is high and the relative velocity - between the ambient gas and the radio galaxy - is large. Both conditions are readily fulfilled within the intra cluster medium (ICM), i.e, the high-density, plasma-filled regions of galaxy clusters. Therefore, bent tailed radio sources may provide an efficient detection mechanism for clusters of galaxies even at high redshifts.
The evolution of the number density of high mass clusters is an interesting cosmological probe. According to the hierarchical structure formation paradigm the most massive structures of the Universe form late. The exact timing depends on the cosmological model. A single very massive cluster can pose a potential challenge to the currently favoured concordance model if it is found at an incompatibly high redshift (Allen et al., 2004; Planck Collaboration et al., 2013a). BRSs have been successfully used as tracers of galaxy clusters for redshifts up to (e.g., Hintzen & Scott, 1978; Deltorn et al., 1997; Blanton et al., 2001).
In this paper we assume that the ram pressure due to the motion of galaxies through the ICM, , is the primary cause of bent radio morphology (e.g., Miley et al., 1972; Venkatesan et al., 1994). In other words, all BRSs are radio sources exposed to ram pressure above a critical value. Buoyancy effects and other interactions which potentially also could cause bent morphology are left for a later study. The main argument in the paper can be summarised as follows:
-
1.
The study focuses on radio galaxies with jet linear size greater than 50kpc which populate the high mass end of the galaxy mass function ().
-
2.
We assume that all extended radio sources of that size require a minimum critical ram pressure in order to show bent morphology. This is a major simplification of the jet physics that is geared towards allowing for a statistical approach to the study of the BRS environments.
-
3.
The critical ram pressure used to match the relative numbers of bent sources observed is set based on the bending equation of extragalactic jets.
-
4.
The relative numbers of bent sources expected in different environments are analysed based on the MareNostrum Universe Simulation.
Point 1 allows us to apply a simple abundance matching scheme to determine the locations of potential radio lobe galaxies in the simulation as discussed in § 2.2. We focus only on large radio lobes (): firstly, because lobes are observed to reach megaparsec scales (e.g., 3C236, NGC315, NGC6251 in Willis et al., 1974; Bridle et al., 1976; Waggett et al., 1977) which makes them more easily detectable at high redshifts; and secondly, to make sure that the resolution of the simulation is sufficient to accurately determine the ram pressure at this scale. A side benefit is that we circumvent the discussion of small jet sizes at the beginning of the radio-loud phase as well.
Point 2 relies on a definition of ‘bent morphology’ which, in this work, is based on visual inspection of radio sources with bent morphology such as presented in Blanton et al. (2001). As a consequence of this we do not differentiate between Fanaroff-Riley type I and II (Fanaroff & Riley, 1974). Observations show that radio galaxies with jet sizes are evenly distributed between FR I, FR II with FR I/II hybrid types being a small fraction of the sample(Best, 2009). However, we note that FR I galaxies may be more easily bent even at small distances from the core since they have broader jets with internal turbulence making them less stiff. In contrast, the strongly collimated, highly relativistic FR II jets are very difficult to bend. In that case bent tail morphology manifests itself in the downstream shift of the radio lobes at the end of the jets.
Points 3 and 4 emphasize that we focus on the relative number of BRSs with respect to all radio sources of comparable size. In more detail, we use the MareNostrum Universe Simulation to determine the environment which is most conducive to the formation of BRSs. For that we assume that the ratio of BRSs to all extended radio sources (both ) is equal to the ratio of galaxies which exceed the ram pressure criterion (RPEX galaxies) to all massive galaxies (both ). Therefore, we investigate the relative abundances and locations of RPEX galaxies as a proxy for BRSs. In particular, we focus on the relative abundances as a function of host cluster masses down to . The investigation of relative numbers also allows us to circumvent the detailed discussion of the radio source duty cycles of these source which is an inherently difficult problem.
2 Methodology
We use the MareNostrum Universe simulation, which is a non-radiative hydrodynamical simulation within a cube of per side to determine the ram pressure at the cores of dark matter halos where massive elliptical galaxies are anticipated to reside. The ram-pressure is computed as the product of the ambient density times the square of the galaxy’s relative velocity, . If the ram-pressure exceeds a critical limit, the radio lobes associated with the galaxies are assumed to be bent in a downstream direction. In the following sections we introduce the simulation, including the halo finding procedure, the abundance matching approach which assigns galaxies to the cores of the dark matter halos and the determination of the ram pressure which we assume is the cause for the bent tail morphology.
2.1 Simulation and halo finding
The present analysis employs the snapshot of the MareNostrum Universe simulation (Gottlöber et al., 2006) which is based on the entropy conserving GADGET-2 code (Springel, 2005) to model both dark matter and gas components assuming a concordance cosmology with the following parameters: , , , and . These values are slightly different to the present values from the Planck survey (Planck Collaboration et al., 2013b) but this should not affect the basic results. The simulation follows the non-linear evolution of the gas and dark matter density fields from to the present within a co-moving box of on each side. Each component is resolved with particles resulting in gas and dark matter particle masses of and , respectively. Only adiabatic gas dynamics are considered, i.e, radiative processes, star formation and feed back processes are not included. The spatial force resolution was set to an equivalent Plummer gravitational softening of comoving kiloparsecs. The SPH smoothing length was set to the distance to the 40th nearest neighbour of each SPH particle.
For the halo and subhalo identification we utilize a hierarchical friends of friends algorithm (Klypin et al., 1999) with progressively shorter linking lengths of with . Our choice of the basic linking length of times the mean particle separation is commonly used to define particle concentrations with virial overdensity. Structures are identified based on their dark matter particle distribution only. We use , or equivalently , to find the host halos and for subhalos. These - subhalos (in the following simply referred to as subhalos) show overdensity of roughly 512 times the virial overdensity. We identify their centres of mass as possible locations of galaxies. In cases where distances between subhalos (galaxies) and the centre of the host halos are required we compute the distance between the location of a subhalos and the centre of mass of the nearest parent halo, i.e., the halo extracted with a linking length of 0.17 times the mean particle separation.
2.2 Abundance matching

Abundance matching is a technique used to populate theoretically derived dark matter halo distributions with observed galaxy properties based on the simultaneous gauging of their cumulative mass (or luminosity) functions. We employ a simple abundance matching technique similar to the approach described in Conroy et al. (2006) to assign stellar masses to the subhalos. For the present study we use the galaxy stellar mass function given in Bell et al. (2003) which employs the ugriz magnitudes from the Sloan Digital Sky Survey Early Data Release (SDSS-EDR; Stoughton 2002) in conjunction with K-band fluxes from the Two Micron All Sky Survey Extended Source Catalog (2MASS; Jarrett et al. 2000) to translate the galaxy luminosities into stellar masses.
An illustration of the abundance matching scheme is given in Fig. 1. This figure shows the cumulative dark matter (bold solid line) and stellar (bold dotted line) mass functions based on the subhalo and the SDSS/2MASS galaxy sample, respectively. The intersections between a horizontal dash-dotted line and the two distributions indicate the dark matter and stellar masses for which the cumulative number densities of the two distributions match. The dash-dotted box in Fig. 1 indicates that equal number densities are obtained for the SDSS/2MASS galaxies with stellar masses and subhalos with masses . Galaxies with stellar mass predominantly show elliptical appearance (Bell et al., 2003). Given a dark matter particle mass of the subhalo mass limit can be translated into minimum particle-number limits of 36.
Finally, the connection between galaxy mass and radio-loudness needs to be determined. For that we make use of the following observationally established relations. A tight correlation is found between a galaxy’s bulge luminosity and the mass of its Supermassive Black Hole (SMBH, Ferrarese, 2002) suggesting that the most massive galaxies, which are ellipticals, host the most massive black holes. SMBHs can trigger AGN activity. Kauffmann et al. (2003) showed that the distributions of sizes, concentrations and stellar surface mass densities of elliptical galaxies with and without AGNs are very similar. Best et al. (2007) found the radio-loud fraction of AGNs to increase from 0.01% for galaxies of stellar mass to greater than 30% for galaxies of stellar mass above . These findings suggest that, besides the intermittent nature the AGN activity, AGNs are a random subsample of early type galaxies of which a given fraction (depending on galaxy mass) is radio-loud.
Our results are based on the subhalo sample which corresponds to stellar masses where the percentage of extended radio-loud galaxies is expected to be substantial. In the following we will refer to these subhalos as galaxies and compute the ratio of RPEX galaxies (see § 1) to all galaxies.
2.3 Ram pressure limit
For the jets of radio-loud AGN to be visibly bent, the ram pressure caused by the jet on the ambient medium must be of the same order of magnitude as the ram pressure caused by the motion of the galaxy through the ambient medium. This gives rise to the following bending equation (Begelman et al., 1979; Jones & Owen, 1979; Burns & Owen, 1980):
| (1) |
where is the cylindrical radius of the jet and is the radius of curvature of the jet. The values , , and denote the density within the jet, the density of the ambient medium, the jet speed and the velocity of the galaxy relative to the ambient medium.
An alternative approach as outlined in Morsony et al. (2013) is to rewrite Eq. 1 as follows:
| (2) |
where is the pressure within the jet and , and are the same quantities as used in Eq. 1. We will use Eq. 2 to determine the ram pressure limit above which we assume that radio galaxies show bent tail morphology. The internal pressure, , can be approximated by the minimum synchrotron pressure, , as outlined in O’Dea & Owen (1985). It gives a lower limit for the internal pressure due to the presence of entrained material from the surroundings (Bicknell, 1984; Laing & Bridle, 2002; Croston et al., 2008) therefore we introduce the parameter . Since we assume that . This choice is substantiated by the fact that we obtain roughly the same ratio of BRSs to all radio lobe galaxies as observed (Blanton et al., 2000, see also § 2.4) . For we use the observed values presented in Table 1 of Freeland & Wilcots (2011) based on which we determine a mean value of ( being the cosmic baryon density). The minimum and maximum values are to . This range encompasses the minimum ram pressure required to produce bent tail morphology. We will employ it for the establishment of the ram pressure statistics for bent tail radio galaxies.
2.4 Determination of Ram Pressure
Equation 2 requires the determination of the density of the ambient ICM and the velocity of the galaxy relative to it from the simulation. We compute these quantities in the following way: First we determine the centre of mass and the bulk velocity of the subhalo based on its dark matter component only; then we compute the average ICM density and relative velocity within a halo-centric shell with lower and upper bounds of and , respectively. The lower bound is chosen to be comparable to the smallest radio lobes we consider.
Empirical relations show that galaxies with stellar masses of host black holes with (McLure & Dunlop, 2002). Black holes of that mass produce jets which propagate out to . Best (2009) shows that 70% of the extended radio-loud sources in the nearby Universe are larger than . Provided that the ratio between radio-loud galaxies with linear jet size larger than and galaxies more massive than is independent of environment we then set out to determine the fraction of BRSs among all radio-loud galaxies with lobes larger than . The upper bound, , is chosen to allow for a sufficiently large volume to determine the ambient ICM density while minimizing non local contributions.
Large relative velocities indicate that the gaseous halo of the galaxy has been stripped at least outside of . In this case, it gives the velocity with which the ambient ICM is streaming past the galaxy. In situations where stripping is not efficient, the gas density within 50 to 100 may be dominated by the galaxy’s own gaseous halo and we do not measure the ambient ICM density. Since, in this case, the relative velocity between the dark matter core and gas in the shell is expected to be rather small, the resulting ram pressure is small too and our approach does not predict bent tail morphology.
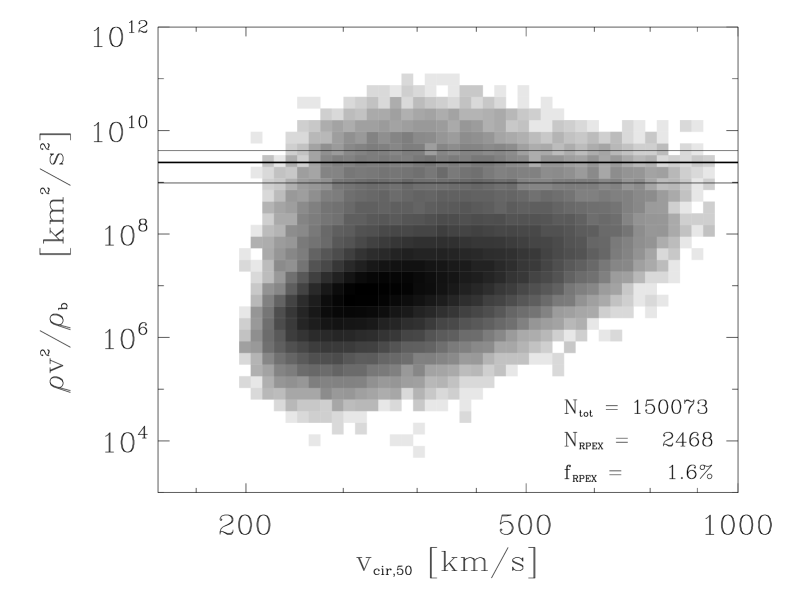
Figure 2 displays the ram pressure for the subhalos as a function of circular velocity based on the total mass within a halo-centric sphere of . The ram pressure limits as discussed in the context of Eq. 2 are indicated by the horizontal lines. The application of the limit indicates that for 2468 out of subhalos (1.6%) the ram pressure is sufficient to bend the tails of radio galaxies if the galaxies undergo a radio-loud phase during this time. In the following we refer to these objects as RPEX galaxies. For the lower and upper bounds shown in Figure. 2 we obtain 1.0% and 3.2%, respectively.
As discussed above, the fraction of RPEX galaxies to the total number of galaxies () approximates the fraction of bent tail sources among all radio-loud galaxies with lobes larger than . Accordingly, 1.6% of all radio-loud galaxies with radio lobes larger than show bent tail morphology due to the ram pressure exerted by their environment. This compares very favourably with observational results of the FIRST survey, which found 384 BRSs out of a total sample of 32000 double and multiple radio sources (Blanton, 2000) giving a fraction of 1.2%.
One concern regarding the comparison with observations may be the presence of projection effects. Two different alignment effects may have a bearing on the predictions from the simulations: firstly, the alignment between jet axis and the line of sight and secondly, the alignment between the galaxy’s velocity and the line of sight. The first case does not affect our predictions because we are interested in the relative number of bent tail radio galaxies with respect to all radio lobe galaxies larger than in size. A jet orientation parallel to the line of sight affects bent and non-bent radio galaxies in the same way and consequently does not change the ratio between the two sets. In the second case, the bent tails of a radio-lobe galaxies moving parallel to the line of sight may be observed as straight. If we assume this case for all galaxies moving with an angle of relative to the line of sight then the simulation overpredicts the fraction of bent tail radio sources relative to all radio lobe galaxies by 14% (). Given the inherent uncertainties in our approach we do not explicitly include this correction into our results. Morsony et al. (2013) states that orientation effects cause the jet lengths to be underestimated by and average of percent.
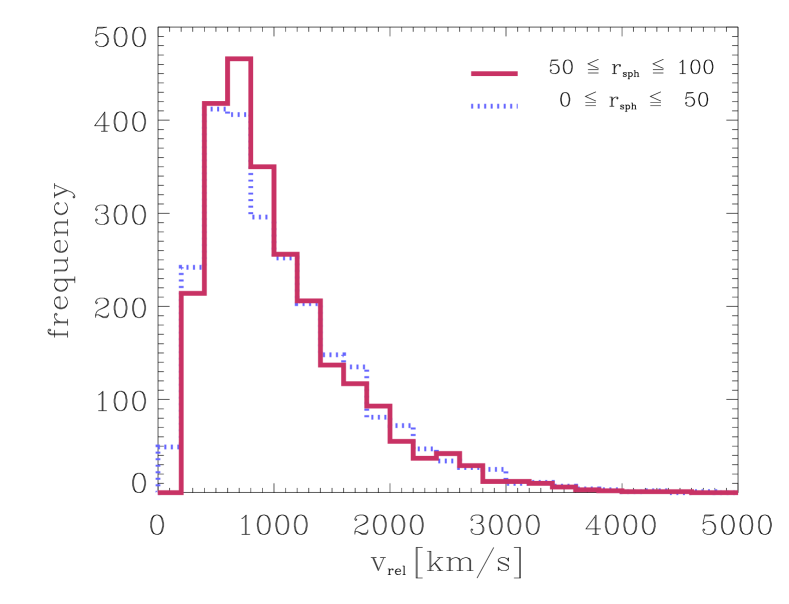
The distribution of the relative velocities between the subhalos and the ambient ICM for all halos which fulfill the ram pressure criterion () are shown in Figure 3. The solid, red line is based on the measurement of the subhalo velocity relative to the halo-centric shell between and which we use to determine the ram pressure. The relative velocities span a range from up to over with a marked peak slightly below . The dotted, blue line gives the relative velocities between the subhalo and the ICM within a halo-centric sphere of . The similarity of the two velocity distributions suggests that most of the subhalos which fulfill the ram pressure criterion have been entirely stripped of their own gas. Consequently, the ambient ICM streams freely through them, which should also be valid for the galaxies these subhalos are predicted to host.
We find some galaxies which have fairly low relative velocities with respect to the ambient ICM () and yet fulfill the bending criterion. This is in agreement with observations which, in rare cases, report low velocity environments of BRSs (O’Dea & Owen, 1985; Jetha et al., 2006). A more detailed discussion of this observation follows below.
3 Results
In order to use BRSs as tracers of clusters we need to be able to answer the following questions: What is the typical mass of the host clusters? What are the typical distances between BRSs and the host cluster centres? And, how many BRSs are likely to be found within a single host cluster of a given mass? The subsequent analysis aims to extract answers to these questions from the MareNostrum simulation. As emphasized before, we aim to determine the fraction of bent tail radio galaxies relative to all radio-loud galaxies with lobes larger than . This approach avoids detailed modelling of the jet physics and allows predictions based on the fraction of RPEX galaxies relative to all galaxies ().
3.1 Slow and fast moving galaxies
For the following discussion the differentiation between narrow angle tail galaxies (NATs) and wide-angle tail galaxies (WATs) is instructive, therefore a short definition is presented here. NATs, which are U-shaped radio sources where the angle subtended at the core by the jet arms is less than , have long been believed to be a product of the ram pressure experienced by the galaxy moving through the Intra-Cluster Medium (ICM) at high velocity (Miley et al., 1972; O’Dea & Owen, 1985). This mechanism is inadequate to address the morphology of slower-moving, C-shaped WATs without invoking much denser environments. WATs have subtended angles that are greater than and are usually associated with the brightest cluster galaxies (BCGs) that are located close to the cores of massive galaxy clusters with only moderate velocities relative to the ambient ICM (O’Donoghue et al., 1993).
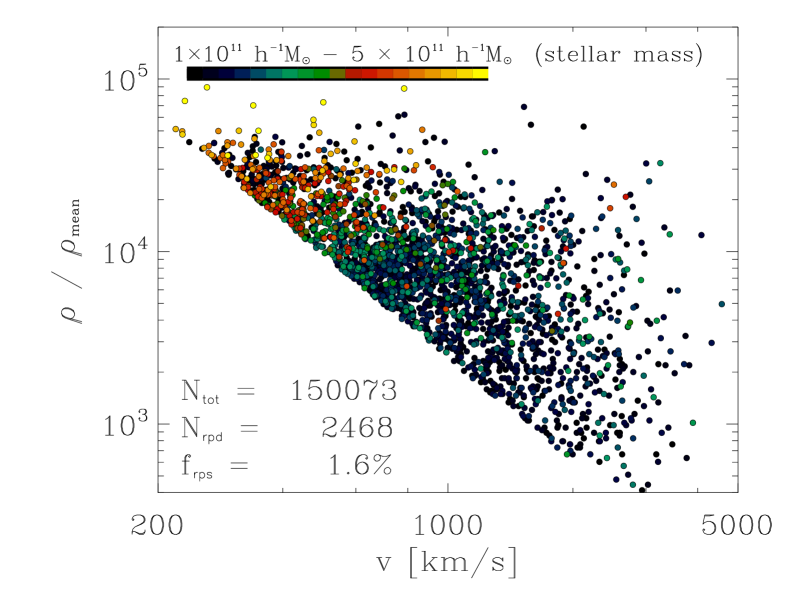
As a first step to answering the questions raised above we plot the RPEX galaxies in the plane, shown in the upper panel of Figure 4, where is the density of the ambient ICM and is the relative velocity between the galaxy and the ICM. The colour coding in this figure reflects the stellar mass as indicated by the color bar in the upper right corner. Yellow points correspond to the most massive galaxies with stellar masses of . They are found predominantly in high density environments with low relative velocities which can be readily identified as BCGs at the centres of massive clusters. The black, blue and green dots, which correspond to lower mass galaxies display a wider distribution of velocities and ambient densities. The figure shows that more massive galaxies which predominantly reside in high density regions require less extreme velocities with respect to the ambient ICM to generate RPEX galaxies. The apparent line, below which there are no qualifying RPEX galaxies corresponds to .
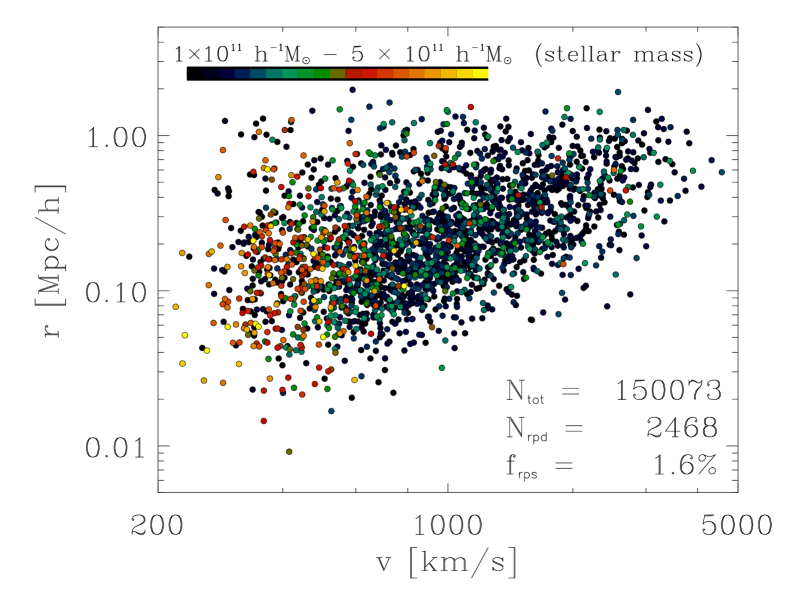
The lower panel of Figure 4 displays the distances with respect to the host cluster’s centre of mass versus the velocity relative to the ambient medium. This figure reveals a clear correlation between cluster centric distance and the relative velocity between the RPEX galaxies and the ambient medium. In particular the most massive galaxies which generally show low velocities relative to the ambient ICM preferentially inhabit the central regions of the clusters. That is where observations preferentially find the WATs (Burns, 1996). Notwithstanding the above correlation, there is also a good distribution of RPEX galaxies throughout the different cluster-centric distances.
The radio lobes of very massive galaxies which resemble BCGs are bent by the fact that the galaxies move through the clusters’ central, high density regions with relatively low velocities. Therefore, the associated radio lobes may fall into the WAT category. The RPEX galaxies found at the outskirts of the galaxy clusters show high relative velocities with respect to the ambient ICM and are, therefore, expected to show NAT morphology which, again is confirmed by observations (O’Dea & Owen, 1985). The continuous transition from NATs to WATs in Figure 4 shows that all RPEX galaxies belong to the same family and we will not differentiate between them in the remainder of the analysis. That does not necessarily mean that the NATs and WATs originate from the same physical processes. For instance, it is conceivable that the jet physics are different as a result of the different environments.
This result illustrates the importance of both the velocity at which the galaxies are travelling through the ICM and the density of the ICM. The cluster centres, where the ICM densities are high, are dominated by BCGs which only move slowly relative to the ICM. Croft et al. (2007) found 19.7% of BCGs’ in the FIRST Survey to be radio-loud. This radio-loudness is primarily correlated with the stellar mass of the BCG. At larger cluster-centric distances the density profiles of the ICM are the main determinants of the BRS fraction since the density increases from the outer radii to the cluster centre by a few orders of magnitude whereas the average velocities of the galaxies orbiting in the cluster potential well only rise by a factor of two or so (e.g., Faltenbacher et al., 2005).
3.2 Dependence on cluster mass
The mass of the parent cluster affects the jet bending probability in two ways. Firstly, the velocity dispersion of galaxies is correlated with the mass of the cluster, i.e., galaxies move faster in high mass clusters. Secondly, the density of the ICM is correlated with the cluster mass, i.e., galaxies in high mass clusters experience denser ICM. Therefore, we expect RPEX galaxies to populate predominantly high mass clusters. We quantify this by measuring the number of RPEX galaxies with respect to the total number of galaxies as a function of cluster mass.
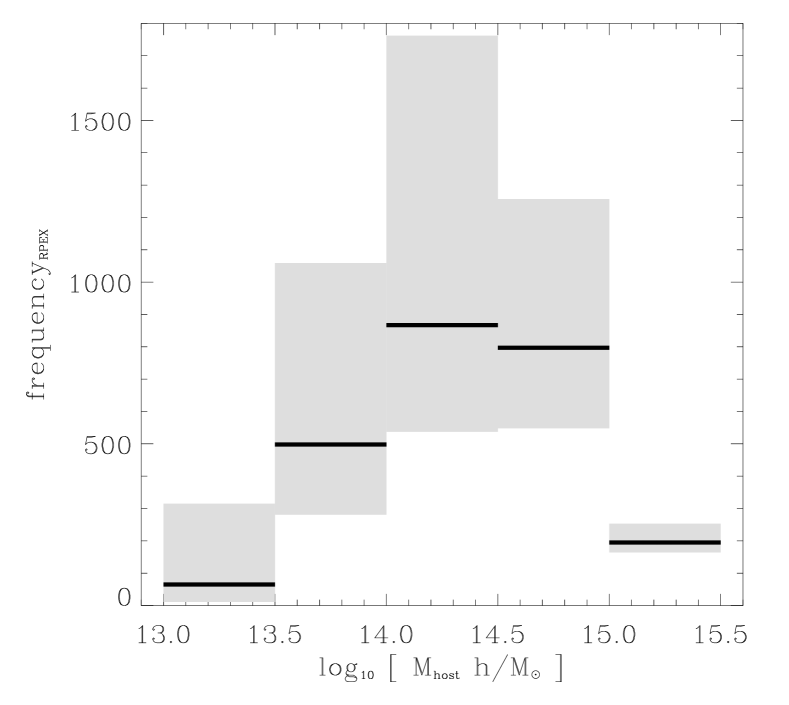
Figure 5 shows the total numbers of RPEX galaxies as a function of host cluster mass. We find no RPEX galaxies in clusters below (not shown) and only very few in clusters less massive than although the total number of such low mass clusters in the simulation box exceeds by far those of higher mass. As reported by Gottlöber et al. (2006), the simulation has more than 50000 clusters in the mass range and more than 4000 clusters with masses greater than . Clusters above provide suitable conditions for radio jet bending. The absolute numbers of RPEX galaxies peak for clusters between and . This can be observed independent of the exact ram pressure limit applied, i.e. the results of the averaged ram pressure criterion as well as its upper and lower limits yield similar results. The preponderance of low mass clusters and the low number of RPEX galaxies found in them, points to the inability of low mass clusters to cause the bent morphology at least for host galaxies with stellar masses above as investigated here.
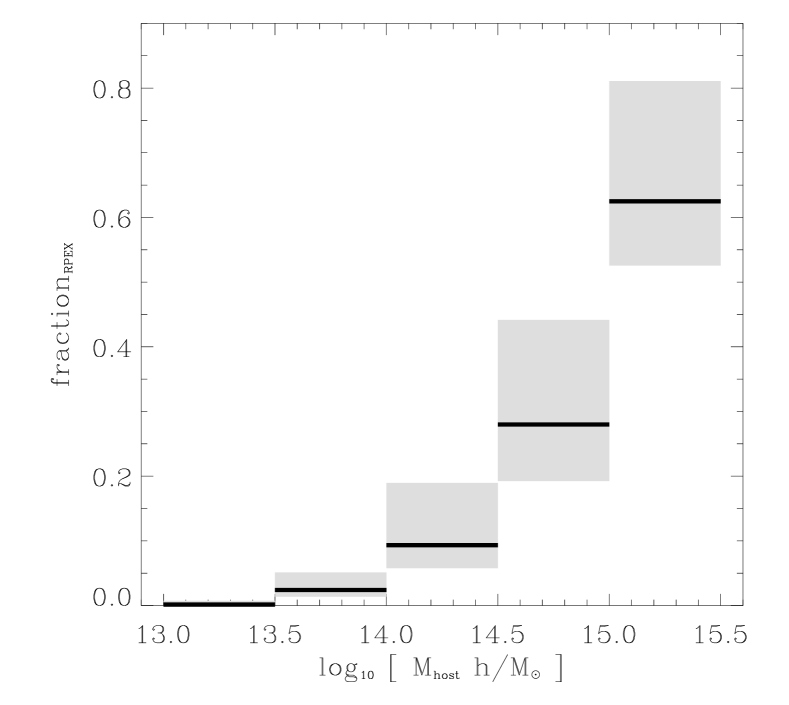
Figure 6 displays the fraction of RPEX galaxies relative to the total number of galaxies as a function of cluster mass. As discussed above, this quantity is equivalent to the fraction of bent tail sources relative to all radio-loud galaxies with lobes larger than . Consequently, a strong correlation between cluster mass and RPEX galaxy fraction can be derived. A negligible fraction of RPEX galaxies is found for host masses below , it rises for clusters with masses between and to roughly 5%. This is a relatively small fraction. However, it is important to keep in mind that the total number of RPEX galaxies as shown in Fig. 5 is relatively large due to the large number of clusters in this mass bin. For cluster masses between and the fraction of BRSs rises to . Therefore, if such clusters host more than two radio lobe galaxies half of them are expected to show bent tail morphology.
3.3 Distances of BRSs from cluster centres
To locate galaxy clusters with the help of BRS it is not only important to predict host cluster masses but also the spatial distribution of the BRSs with respect to the cluster centre. In other words, if a BRS is detected what is the maximum expected distance to the cluster centre?
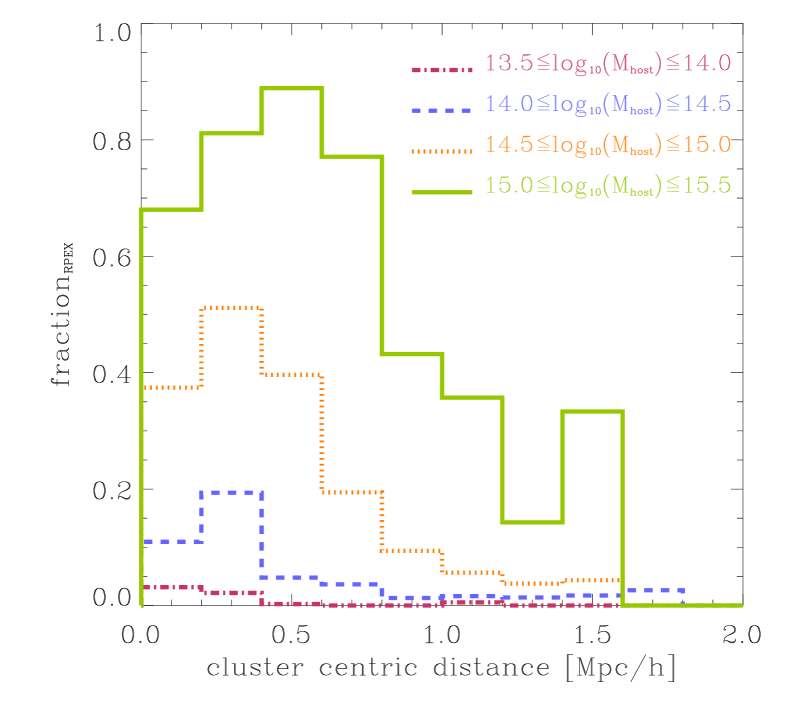
Figure 7 shows the fractions of RPEX galaxies with respect to the total number of galaxies as a function of cluster centric distance and host halo mass. For host halos above a slight reduction of the central () fraction of RPEX galaxies can be observed. For those clusters the fraction of RPEX galaxies peaks between and with a slight shift of the peak towards larger cluster centric distances for higher mass host clusters. For host clusters 80% of all double lobe galaxies at a cluster centric distance of are expected to show bent tail morphology. For distances above the fraction of RPEX galaxies drops quickly. Our model predicts, that for the most massive clusters 20% of all radio-loud galaxies with lobes larger than and stellar masses show bent tail morphology at cluster centric distances of .
The consequence, for observational strategies to detect clusters by locating BRSs, is that the cluster centre may be at a distance of from the actual position of the BRS.
3.4 Multiple BRS candidates in high mass clusters
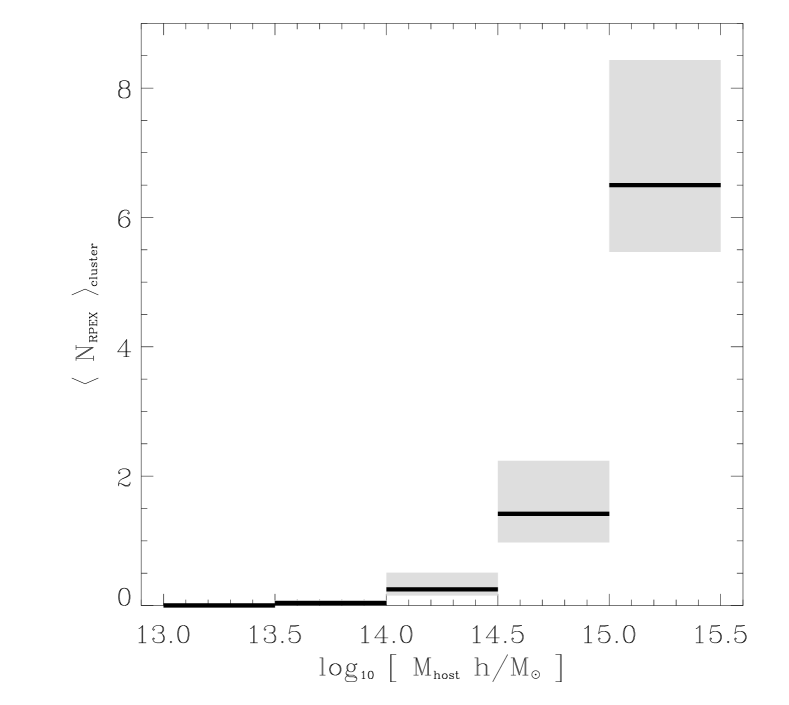
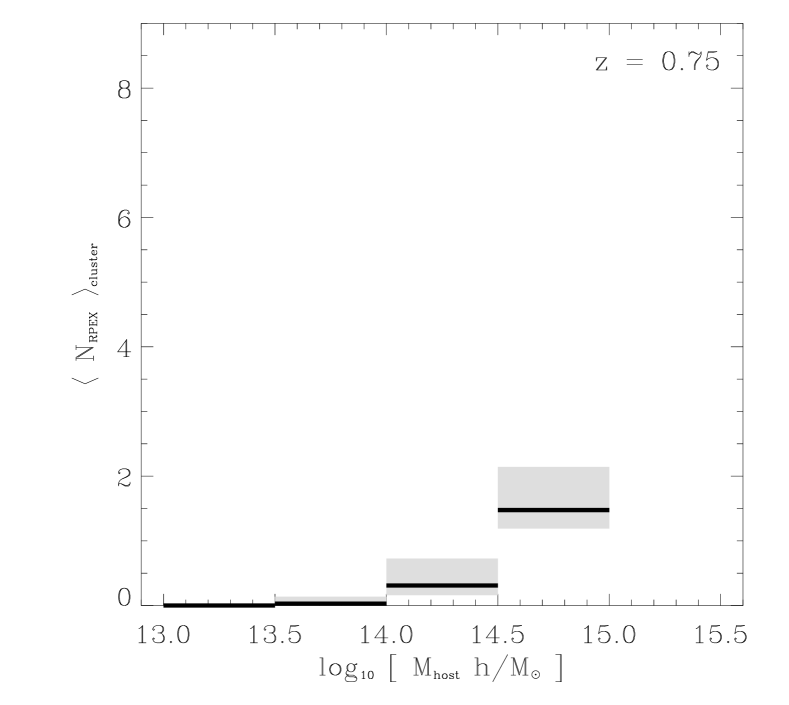
Figure 8 shows the average number of RPEX galaxies per cluster as a function of cluster mass. We find that, while there is less than one RPEX galaxy in clusters with masses and about one in clusters with masses between and , there are about 7 RPEX galaxies expected to be hosted by clusters . It depends on the duty cycle of the AGNs how many BRSs actually can be observed. Best et al. (2007) found the number of radio-loud AGNs to increase to about 30% for galaxies with stellar masses greater than . Therefore, we can expect that clusters with masses above are likely to host more than one BRSs. This is confirmed by several observations of multiple BRSs in clusters of galaxies e.g.,Abell 2382, Abell 2538, etc. (Owen & Ledlow, 1997). The appearance of multiple BRSs in close vicinity may be a used as tracer of high mass galaxy clusters.
The appearance of multiple BRSs in close proximity may also be useful for the detection of high redshift clusters. Figure 9 gives a coarse attempt to extend the analysis towards higher redshift. The figure is identical to Fig. 8 except that it is based on the snapshot of the simulation. For an accurate analysis one would need to redo the abundance matching (§ 2.2) with an observed, , stellar mass function. However, we do not do this in the current paper. Instead, we simply used all subhalos with more than 36 particles as for the analysis. In Fig. 9 multiple RPEX galaxies () can be observed for host halos . Above . we only find one cluster which is not shown on the plot due to lack of statistics. This is a preliminary result and a more detailed study based on a higher resolution simulation will be presented elsewhere.
4 Conclusions
Based on the MareNostrum Universe Simulation, we modeled the ram
pressure strength at the expected locations of massive galaxies.
We applied a simple bending criterion (Eq. 2) which
allowed us to determine whether the radio-lobes associated with these
galaxies will be bent.
If the galaxies exceed the ram pressure limit they are referred to as
RPEX galaxies which indicates that
they would display bent radio lobes during the radio-loud phase of their
duty cycle. We derive ratios of
RPEX galaxies relative to all galaxies within the same stellar mass
range (). Assuming that the AGN duty cycle is independent of environment,
these ratios are equal to the ratios of observed radio
lobes with bent tail morphology to all, straight and bent, radio lobe
sources. For technical reasons, the analysis is restricted to radio lobes larger
than .
The analysis of the velocities and ambient densities of RPEX galaxies
reveals that the most massive galaxies (possibly BCGs),
which reside at the cluster centres, require only moderate velocities
() relative to the ambient ICM to obey the bending criterion -
the ICM densities are high and thus the critical ram pressure is
easily reached without very high relative velocities. This type of
galaxy is expected to host WATs. RPEX galaxies
with lower stellar mass content show a wider distribution of
relative velocities and ambient densities. Those RPEX galaxies with
high relative velocities are the natural locations of NATs.
The simulation data show that there is a
continuous transition between WATs and NATs.
The underlying physical mechanisms are essentially the same.
Clusters with masses less than do not host any RPEX
galaxies. We find approximately equal numbers of RPEX galaxies in
clusters less/more massive than . Individual low
mass clusters only rarely provide suitable conditions for the
appearance of bent tail morphology. However, lower mass clusters are much
more prevalent. Consequently, their contribution to the total budget of
RPEX galaxies is substantial. Therefore, the appearance of BRSs does not uniquely
point towards a high mass host cluster.
The RPEX galaxy distribution of cluster-centric distances shows a
marked difference between high and low mass clusters. The RPEX
galaxies in high mass clusters are found at much larger
distances. This is a consequence of the fact that the ICM of such
systems is much more extended and the velocity dispersion of the galaxies is
higher. Our model predicts that BRSs in high mass clusters can be
observed as far as from the cluster centre.
For low mass clusters, , the BRS will
preferentially be found within a cluster-centric sphere of
radius.
Finally the appearance of more than one BRS in close proximity
() would be a strong indication of high mass host
systems. To what extent this clustered appearance of BRSs may be
useful to detect massive clusters at high redshift needs to be
investigated with higher resolution simulations which provide
a better mass resolution and thus more accurate results at early
times.
The purpose of this work is to lay the ground for investigations of the statistics of BRSs. The present analysis is incomplete and surely requires refinements in many respects. However, the incoming large data sets require the development of these statistical tools in the foreseeable future.
Acknowledgments
We thank the anonymous referee for the appreciative reading of our article as well as the suggestions that have helped to enhance the quality of our paper. The Marenostrum Universe simulation was performed at the Barcelona Supercomputing Center (Spain). The FOF programs have been developed by Victor Turchaninov during a visit at AIP funded by DFG (GO 563/22-1).
ZM thanks the South African Astronomical Observatory (SAAO) and the National Research Foundation (NRF) of South Africa.
GY thanks the Spanish’s MINECO and MICINN for supporting his research through different projects: AYA2009-13875-C03-02, FPA2009-08958, AYA2012-31101, FPA2012-34694 and Consolider Ingenio SyeC CSD2007-0050. He also acknowledge support from the Comunidad de Madrid through the ASTROMADRID PRICIT project (S2009/ESP-1496).
References
- Allen et al. (2004) Allen S. W., Schmidt R. W., Ebeling H., Fabian A. C., van Speybroeck L., 2004, MNRAS, 353, 457
- Begelman et al. (1979) Begelman M. C., Rees M. J., Blandford R. D., 1979, Nature, 279, 770
- Bell et al. (2003) Bell E. F., McIntosh D. H., Katz N., Weinberg M. D., 2003, ApJS, 149, 289
- Best (2009) Best P. N., 2009, Astronomische Nachrichten, 330, 184
- Best et al. (2007) Best P. N., von der Linden A., Kauffmann G., Heckman T. M., Kaiser C. R., 2007, MNRAS, 379, 894
- Bicknell (1984) Bicknell G. V., 1984, ApJ, 286, 68
- Blanton (2000) Blanton E. L., 2000, PhD thesis, COLUMBIA UNIVERSITY
- Blanton et al. (2001) Blanton E. L., Gregg M. D., Helfand D. J., Becker R. H., Leighly K. M., 2001, AJ, 121, 2915
- Blanton et al. (2000) Blanton E. L., Gregg M. D., Helfand D. J., Becker R. H., White R. L., 2000, ApJ, 531, 118
- Bridle et al. (1976) Bridle A. H., Davis M. M., Meloy D. A., Fomalont E. B., Strom R. G., Willis A. G., 1976, Nature, 262, 179
- Burns (1996) Burns J. O., 1996, in Hardee P. E., Bridle A. H., Zensus J. A., eds, Energy Transport in Radio Galaxies and Quasars Vol. 100 of Astronomical Society of the Pacific Conference Series, An Environmental Impact Assessment for Cluster Radio Galaxies. p. 341
- Burns & Owen (1980) Burns J. O., Owen F. N., 1980, AJ, 85, 204
- Conroy et al. (2006) Conroy C., Wechsler R. H., Kravtsov A. V., 2006, ApJ, 647, 201
- Croft et al. (2007) Croft S., de Vries W., Becker R. H., 2007, ApJ, 667, L13
- Croston et al. (2008) Croston J. H., Hardcastle M. J., Birkinshaw M., Worrall D. M., Laing R. A., 2008, MNRAS, 386, 1709
- Deltorn et al. (1997) Deltorn J.-M., Le Fèvre O., Crampton D., Dickinson M., 1997, ApJ, 483, L21
- Faltenbacher et al. (2005) Faltenbacher A., Kravtsov A. V., Nagai D., Gottlöber S., 2005, MNRAS, 358, 139
- Fanaroff & Riley (1974) Fanaroff B. L., Riley J. M., 1974, MNRAS, 167, 31P
- Ferrarese (2002) Ferrarese L., 2002, ApJ, 578, 90
- Freeland & Wilcots (2011) Freeland E., Wilcots E., 2011, ApJ, 738, 145
- Gottlöber et al. (2006) Gottlöber S., Yepes G., Khalatyan A., Sevilla R., Turchaninov V., 2006, in Manoz C., Yepes G., eds, The Dark Side of the Universe Vol. 878 of American Institute of Physics Conference Series, Dark and baryonic matter in the MareNostrum Universe. pp 3–9
- Hintzen & Scott (1978) Hintzen P., Scott J. S., 1978, ApJ, 224, L47
- Jarrett et al. (2000) Jarrett T. H., Chester T., Cutri R., Schneider S., Skrutskie M., Huchra J. P., 2000, AJ, 119, 2498
- Jetha et al. (2006) Jetha N. N., Hardcastle M. J., Sakelliou I., 2006, MNRAS, 368, 609
- Jones & Owen (1979) Jones T. W., Owen F. N., 1979, ApJ, 234, 818
- Kauffmann et al. (2003) Kauffmann G., Heckman T. M., Tremonti C., Brinchmann J., Charlot S., White S. D. M., Ridgway S. E., Brinkmann J., Fukugita M., Hall P. B., Ivezić Ž., Richards G. T., Schneider D. P., 2003, MNRAS, 346, 1055
- Klypin et al. (1999) Klypin A., Gottlöber S., Kravtsov A. V., Khokhlov A. M., 1999, ApJ, 516, 530
- Laing & Bridle (2002) Laing R. A., Bridle A. H., 2002, MNRAS, 336, 1161
- McLure & Dunlop (2002) McLure R. J., Dunlop J. S., 2002, MNRAS, 331, 795
- Miley et al. (1972) Miley G. K., Perola G. C., van der Kruit P. C., van der Laan H., 1972, Nature, 237, 269
- Morsony et al. (2013) Morsony B. J., Miller J. J., Heinz S., Freeland E., Wilcots E., Brüggen M., Ruszkowski M., 2013, MNRAS, 431, 781
- O’Dea & Owen (1985) O’Dea C. P., Owen F. N., 1985, AJ, 90, 954
- O’Donoghue et al. (1993) O’Donoghue A. A., Eilek J. A., Owen F. N., 1993, ApJ, 408, 428
- Owen & Ledlow (1997) Owen F. N., Ledlow M. J., 1997, ApJS, 108, 41
- Planck Collaboration et al. (2013b) Planck Collaboration Ade P. A. R., Aghanim N., Armitage-Caplan C., Arnaud M., Ashdown M., Atrio-Barandela F., Aumont J., Baccigalupi C., Banday A. J., et al. 2013b, ArXiv e-prints
- Planck Collaboration et al. (2013a) Planck Collaboration Ade P. A. R., Aghanim N., Armitage-Caplan C., Arnaud M., Ashdown M., Atrio-Barandela F., Aumont J., Baccigalupi C., Banday A. J., et al. 2013a, ArXiv e-prints
- Springel (2005) Springel V., 2005, MNRAS, 364, 1105
- Stoughton (2002) Stoughton C., 2002, AJ, 123, 485
- Venkatesan et al. (1994) Venkatesan T. C. A., Batuski D. J., Hanisch R. J., Burns J. O., 1994, ApJ, 436, 67
- Waggett et al. (1977) Waggett P. C., Warner P. J., Baldwin J. E., 1977, MNRAS, 181, 465
- Willis et al. (1974) Willis A. G., Strom R. G., Wilson A. S., 1974, Nature, 250, 625
- Wing & Blanton (2011) Wing J. D., Blanton E. L., 2011, AJ, 141, 88